The practical answer
- Short answer
- Free Proof of Concepts (POCs) reduce win rates by 40% and double sales cycle lengths. Here is the diagnostic to pivot from 'free pilots' to paid access.
- Best fit
- Industry: B2B SaaS. Function: Sales
- Operating path
- GTM Execution → Commercial Performance → Performance Improvement
- Key metric
- 40% Increase in conversion rates when using structured, success-criteria-based POCs versus open-ended free trials.
The Velocity Equation is Broken
In the high-pressure environment of 2026 B2B sales, the "Free POC" has become the most expensive crutch in the CRO's cabinet. It feels like momentum—engineers are engaged, logins are created, and the prospect is "testing" the platform. But mathematical reality tells a different story.
According to 2025 data from Optifai, unstructured free pilots in the enterprise segment convert at a median rate of just 15-20%. Contrast this with paid, structured pilots, which see conversion rates north of 80%. The gap isn't just in the win rate; it's in the denominator of the Sales Velocity equation: (Deals × Value × Win Rate) / Cycle Length.
Free pilots artificially inflate the cycle length, often by 2x or more, because they lack the "forcing function" of a financial commit. Without a contract, there is no urgency. Without urgency, the evaluation drifts into an open-ended technical exercise.
For a Series B or C company, this is costly. You are effectively acting as an unpaid consultant, burning your most expensive resource (Solutions Engineers) on prospects who have not yet internally committed to solving the problem.
A pilot needs business ownership, success criteria, a deadline, and agreed commercial next steps. Without those, it is usually an extended demo.
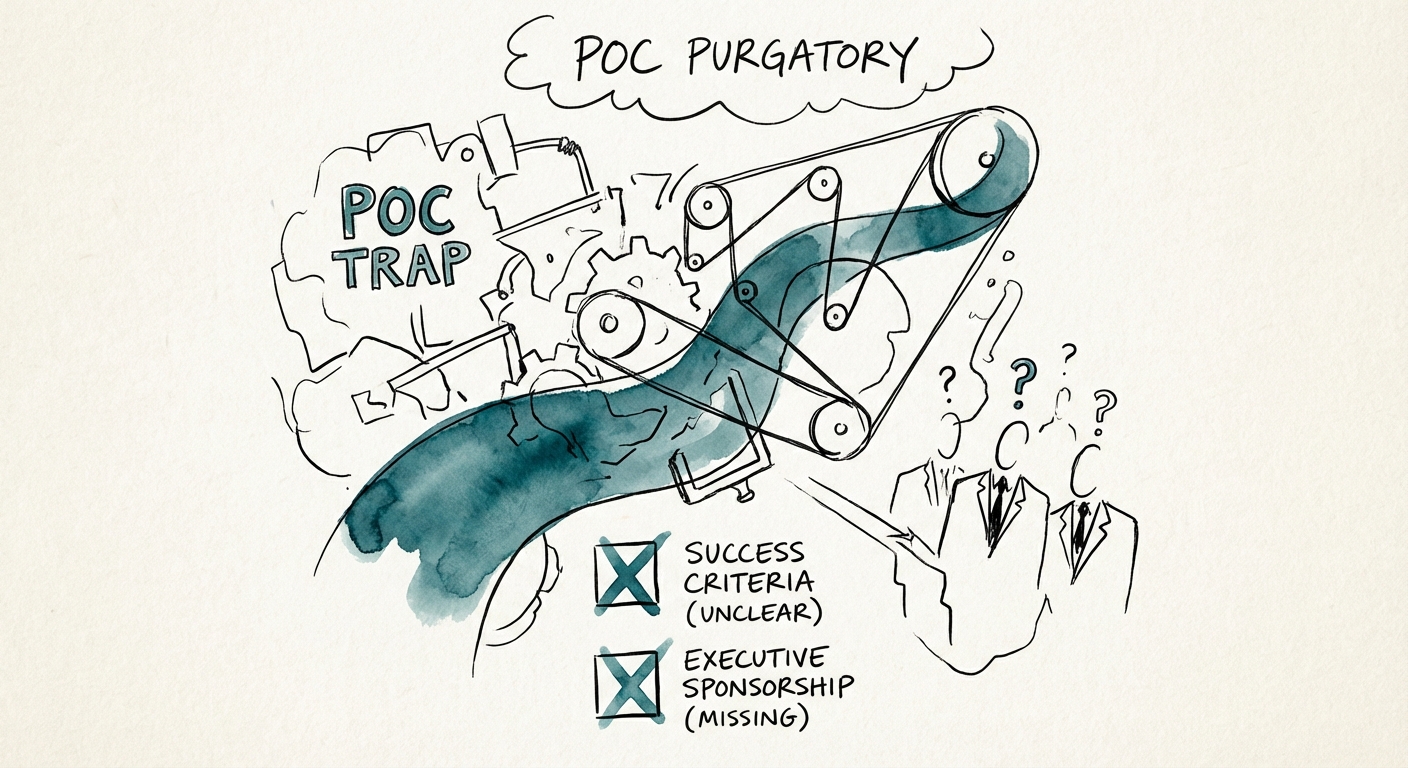
Diagnostic: Are Your POCs Too Open-Ended?
Most revenue leaders don't realize they are in the trap until they miss a quarter. Review your last 10 failed POCs against these three diagnostic criteria. If you failed more than one, your POC strategy is actually a "hope" strategy.
1. The "Undefined Success" Red Flag
If the pilot started without a document explicitly stating, "If X, Y, and Z criteria are met by Date A, we will sign Contract B," you didn't have a pilot; you had a demo with login credentials. Benchmark: 90% of successful POCs have a signed Mutual Action Plan (MAP) before provisioning access.
2. The "Executive Ghost" Syndrome
Did the Economic Buyer sign off on the POC, or was it authorized by a mid-level manager? Free pilots often bypass the CFO because they fall below the signature threshold (zero). This means you reach the end of a successful technical trial only to start the real sales cycle with procurement. This destroys Deal Velocity Benchmarks.
3. The Infinite Timeline
Did the pilot have a hard stop date that was enforced? In 2025, the average "successful" POC duration compressed to 14 days for mid-market and 30 days for enterprise. If your average duration exceeds 45 days, you are essentially subsidizing the prospect's operations.
The Fix: Pivot to Paid (or Highly Gated) Access
The solution is not necessarily to charge for every pilot, but to structure every pilot as if it were paid. This filters out non-serious buyers immediately—a feature, not a bug.
The "Skin in the Game" Framework
Shift your GTM motion to demand a "Paid Access Agreement" for any evaluation requiring custom engineering or data integration. If the prospect balks at a $5k or $10k pilot fee that applies to the annual contract, they likely never had the budget for the $100k deal.
If you must offer free access (common in PLG motions), you must gate it with a technical go/no-go agreement. As detailed in our 60-Day Win Rate Turnaround guide, this agreement dictates that if the software performs as advertised, the commercial terms are pre-agreed.
Restructuring the SE's Role
Stop measuring your Solutions Engineers on "activity" or "support." Measure them on POC Conversion Rate. High-performing organizations see SEs disqualify weak pilots before they start. This protects your Sales Cycle Compression efforts and ensures engineering resources flow only to high-probability revenue.