
The practical answer
- Short answer
- The standard 90-day ramp is a costly misconception. Discover the true onboarding time-to-productivity benchmarks and 30-60-90 day milestones for scaling tech teams.
- Best fit
- Industry: B2B SaaS & Tech-Enabled Services. Function: People Operations & Revenue Architecture
- Operating path
- Team & Hiring → Operational Excellence → Transaction Execution Services
- Key metric
- 30-60-90 Milestone cadence for inspecting early onboarding progress.
The 90-day ramp period is often treated as a finish line, when it is better understood as an early operating milestone. Scaling tech companies need to know when new hires become productive by role, not just when their first quarter ends.
In portfolio work, we consistently see executives projecting full quota attainment and independent code delivery at day 91 without enough structure to make that realistic. A welcome kit, access to Slack, and a few introductory meetings do not create enterprise value by themselves. New hires need clear daily agendas, documented workflows, manager accountability, and measurable role-specific milestones.
This is not just a Human Resources issue; it is an operating-model issue. If you are still anchoring forecasts to a generic 90-day ramp without segment-specific calibration, study Sales Onboarding 30-60-90 Productivity Benchmarks. Your financial model should distinguish early activity from full productivity. The goal is to convert abstract timelines into concrete deliverables that managers can inspect.
The 90-day onboarding period is not a warm-up; it is a structured diagnostic of your organization's ability to transfer knowledge, enforce standards, and scale operational excellence.
Engineering & Product: Managing the Onboarding Capacity Cost
Technical onboarding is the most misunderstood capability in scaling tech. Founders assume that a Senior Engineer hired on Monday will push meaningful production code by Friday. In reality, a new engineer requires context, environment setup, code review support, and time from senior teammates. That capacity cost is manageable when the onboarding system is explicit.
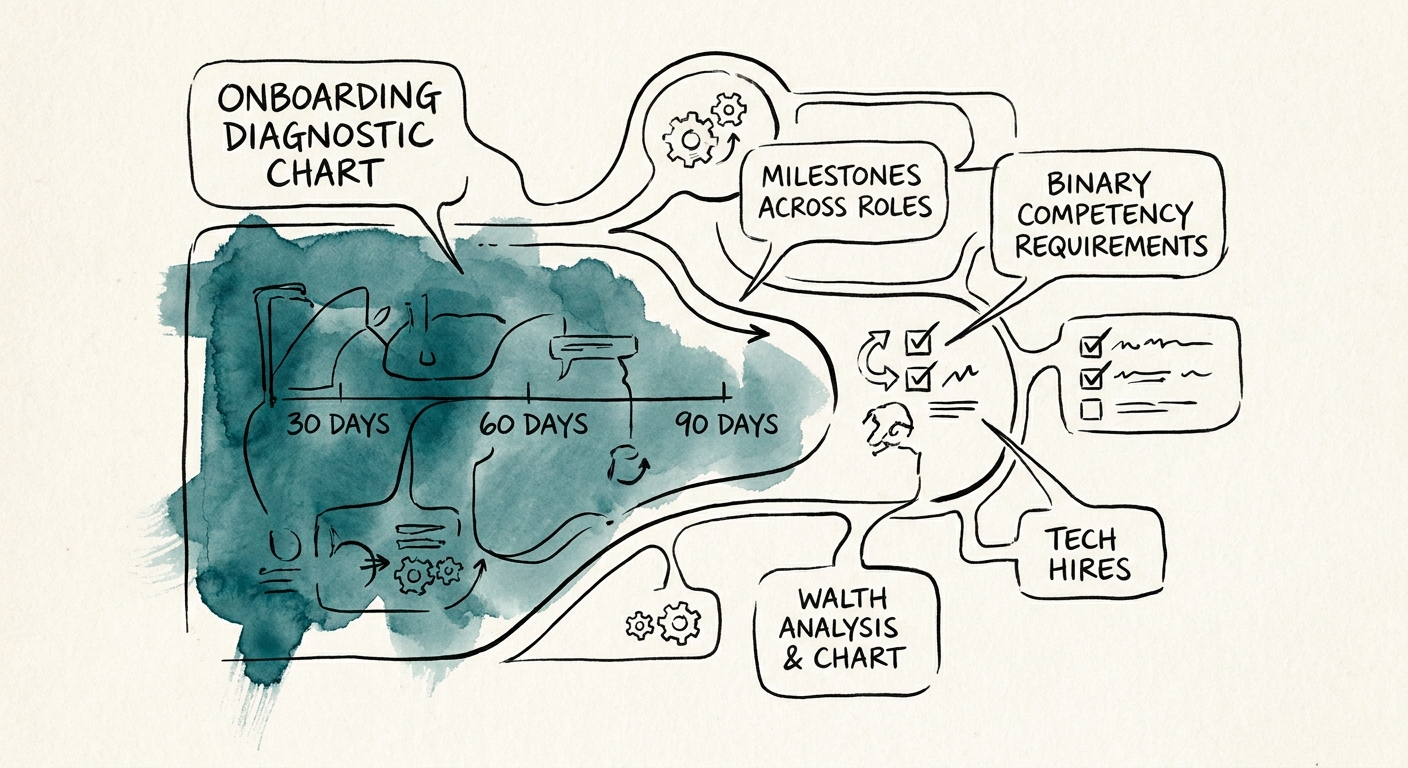
Use a structured 30-60-90 milestone architecture. At Day 30, the metric is not "understanding the codebase"—it is successfully pushing three non-critical bug fixes to production via pair programming. At Day 60, the milestone is the independent delivery of a minor feature component with zero rollbacks. At Day 90, we expect the successful scoping and delivery of a standard epic. If these gates are missed, management should diagnose whether the problem is hiring profile, enablement, documentation, or manager support. By documenting your core architecture and standardizing development environments, you reduce the ramp burden on senior engineers.
I cannot stress this enough: your engineering ramp is a measure of your technical debt, not just your new hire's competence. If it takes three weeks to provision access and configure a local environment, your operational foundation is broken. We rigorously audit the documentation density of the engineering wiki during due diligence precisely for this reason. If tribal knowledge is the only way a new developer can understand the service mesh, your company is difficult to scale. We have seen this exact scenario reduce deployment frequency, leading directly to the systemic failures outlined in The Fully Loaded Recruiting Costs and Ramp Time. Fix the deployment pipeline and formalize your documentation strategy before you hire another headcount.
GTM & Revenue: Dismantling the Quota Fallacy
Go-To-Market onboarding requires more structure than most scaling companies give it. You cannot hire a VP of Sales or a Senior Account Executive, hand them a nominal 90-day draw, and expect full pipeline coverage by month four. Sales leaders stubbornly cling to one-size-fits-all quotas that ignore the length and complexity of enterprise sales cycles.
To align ramp times with financial reality, we architect strict pipeline generation metrics instead of lagging revenue indicators. Day 30 is strictly for pitch certification and product mastery; if a rep cannot pass a mock discovery call with leadership by week four, they are not ready for independent ownership. Day 60 is measured by self-sourced pipeline generation—we demand 1.5x of their monthly quota target in qualified stage-two pipeline. Day 90 is when we expect the first independent, non-founder-assisted close. Misses should trigger a practical review of hiring profile, enablement quality, territory assignment, and manager support. For Customer Success roles, the ramp is also relationship-dependent. CSMs managing large ARR portfolios need time to understand account history, stakeholders, usage patterns, and expansion potential.
We enforce these milestones because hope is not a management strategy. Your enablement team must function as an operating system, not a welcome committee. Reps should not take live enterprise calls without first passing a certification process. When you study Sales Rep Ramp Time Benchmarks: Why 5.7 Months is the New 'Danger Zone', you realize that extending unearned grace periods to underperforming revenue hires can distort pipeline forecasts. The 90-day onboarding period is not a warm-up; it is a structured diagnostic of your organization's ability to transfer knowledge, enforce standards, and scale operational excellence. Demand proof of competence at every 30-day interval, or you will keep carrying avoidable ramp risk in your forecasts.