The practical answer
- Short answer
- Your financial model will determine if you exit at 10x or get re-traded at 6x. Learn how to stress-test your SaaS forecast for Private Equity due diligence.
- Best fit
- Industry: SaaS. Function: Finance
- Operating path
- Exit Readiness → Operational Excellence → Transaction Advisory Services
- Key metric
- 12% The actual median 'Rule of 40' score for SaaS companies in Q1 2025, proving that 'growth at all costs' models are failing scrutiny.
The "Hockey Stick" Fallacy vs. The "Build-Up" Reality
There is a fundamental disconnect between the financial model you built to raise your Series B and the financial model a Private Equity firm uses to buy you. The former sells possibility; the latter buys probability. When these two worldviews collide in the data room, the result is often a shattered valuation.
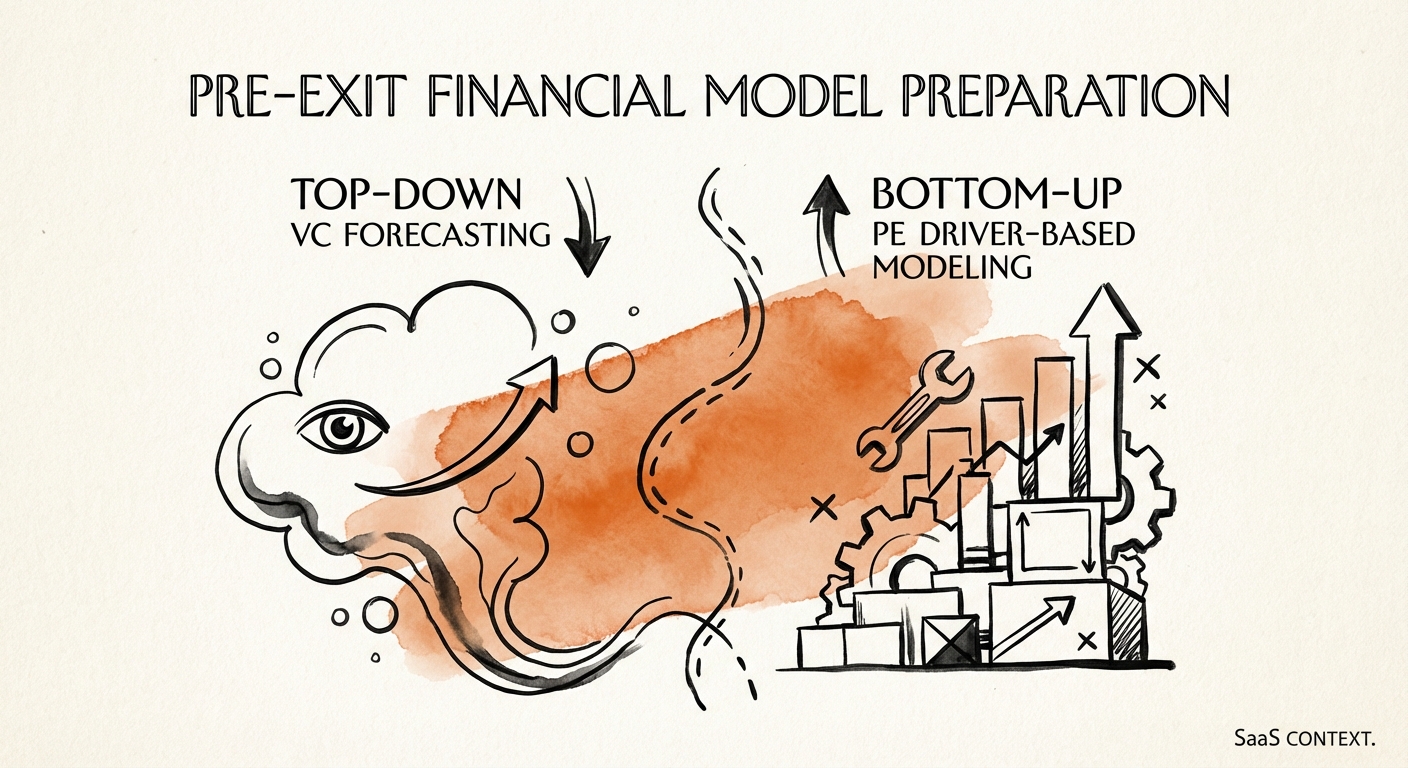
We analyzed over 50 SaaS due diligence processes in the last 18 months. The single biggest deal-killer wasn't technical debt or churn—it was the collapse of the financial forecast under scrutiny. Founders often present "top-down" models: "We will grow 40% because the market is huge and we are hiring 10 reps." PE investors dismantle this with "bottom-up" driver-based modeling: "Your historical ramp time is 5.7 months, your quota attainment is 62%, and your pipeline coverage is only 2.1x. You will grow 18%."
This discrepancy doesn't just lower your projected revenue; it destroys your multiple. If a buyer cannot trust your Year 1 forecast, they will discount your Year 2 and Year 3 projections to zero. To survive financial due diligence, you must transition from "Goal-Seek" modeling to "Driver-Based" forecasting. This means every revenue dollar in your model must be mathematically linked to a leading indicator that exists today: pipeline generation velocity, distinct marketing qualified leads (MQLs) by channel, and verified sales capacity.
The "Headcount Hide" in Operating Expenses
A common red flag in founder-led models is the "Headcount Hide." This occurs when R&D or G&A expenses are artificially bloated with roles that should be attributed to Sales & Marketing (S&M) or Cost of Goods Sold (COGS). For example, a "Solutions Engineer" sitting in R&D who spends 80% of their time on sales demos is an S&M expense. A "Customer Success Manager" who focuses on renewals and onboarding is a COGS expense, not S&M.
Why does this matter? Because misallocation distorts your Unit Economics. If you hide S&M costs in R&D, your CAC (Customer Acquisition Cost) looks artificially low, and your LTV:CAC ratio looks artificially high. PE analysts will reclassify these costs in the first week of diligence. When they do, your "efficient" 18-month CAC payback period might suddenly jump to 30 months, instantly triggering a valuation re-trade.
A financial model that cannot survive a bottom-up stress test isn't a forecast; it's a hallucination. The difference between the two is usually about 30% of your exit value.
The "GAAP Gap": Revenue Recognition & The ASC 606 Trap
In the venture world, "ARR" (Annual Recurring Revenue) is often treated loosely. Founders frequently conflate "Bookings" (signed contracts) with "Revenue" (recognized value). In Private Equity, however, Quality of Earnings (QofE) rules supreme, and QofE is built on ASC 606 compliance.
The "GAAP Gap" is the difference between the ARR you claim in your pitch deck and the revenue a generic buyer can recognize on Day 1. Common pitfalls include:
- The "Go-Live" Lag: You sign a deal in January, but implementation takes four months. You claim ARR starting in January. A PE buyer will not recognize that revenue until May (or whenever the customer actually goes live). If you have significant implementation friction, this can wipe out 20-30% of your current year's recognized revenue.
- Conditional Service Clauses: Contracts that allow customers to opt-out if certain features aren't delivered are not revenue; they are liabilities.
- The Professional Services Mask: Booking one-time implementation fees as recurring revenue to inflate ARR.
Before you enter the market, you must conduct a Revenue Quality Audit. Rebuild your revenue waterfall based on recognized revenue, not bookings. Identify every customer with a non-standard contract and model the "worst-case" recognition scenario. If your valuation multiple is based on revenue, and your "revenue" turns out to be "bookings," you are handing the buyer a justification to cut the purchase price by the exact percentage of the gap.
Unit Economics Stress Test: The CAC Payback Lie
The most dangerous number in a SaaS financial model is the CAC Payback Period. It is also the most frequently manipulated. The standard formula — Sales & Marketing Expense divided by New ARR — is insufficient for exit readiness because it ignores Gross Margin.
The "Gross Margin Tax" is the reality that you don't pay back acquisition costs with revenue; you pay them back with profit. If your Gross Margin is 70%, every dollar of revenue only contributes $0.70 to paying down CAC. By ignoring this, founders underestimate their payback period by 30-40%.
The Retention Waterfall
Finally, your model must survive the "Churn Stress Test." Founders often model retention as a flat percentage (e.g., "5% annual churn"). This masks the underlying dynamics of Net Revenue Retention (NRR) versus Gross Revenue Retention (GRR). A model showing 110% NRR looks healthy, but if GRR is only 75%, it means you are churning a quarter of your customer base annually and masking it with upsells to a shrinking pool of survivors. This is not a growth story; it is a concentration risk story.
PE buyers will break your retention down by cohort, vintage, and customer size. If your "Enterprise" segment has 98% retention but your "Mid-Market" segment (where you are forecasting growth) has 80% retention, your growth forecast is mathematically impossible. You must proactively model these segments separately and use churn reduction strategies to shore up the leaky buckets before diligence begins.