The practical answer
- Short answer
- New 2025 data: Average MSPs trade at 5-6x EBITDA, while best-in-class firms hit 10x+. Learn the 4 specific metrics that bridge the gap.
- Best fit
- Industry: MSP / IT Services. Function: Finance
- Operating path
- Exit Readiness → Operational Excellence → Transaction Advisory Services
- Key metric
- 11.2x Top-tier EBITDA multiple for >$500M platforms (Aventis Advisors)
The Tale of Two Term Sheets
In the managed services market, there is no such thing as a "standard" multiple. There is only the price paid for risk versus the price paid for scale. I recently reviewed two term sheets for MSPs with nearly identical top-line revenue ($12M). One received an offer of roughly 4.5x EBITDA with a heavy earn-out structure. The other commanded a 9.5x multiple, 80% cash at close.
The difference wasn't their tech stack. It wasn't their geography. It was their revenue composition and operational maturity.
The current market (2024-2025) has bifurcated. On one side, you have the "lifestyle" MSPs: <$1M EBITDA, heavy project revenue dependence, and founder-led sales. These firms are trading at 4x to 6x EBITDA, often treated as "bolt-on" acquisitions where the buyer is really just purchasing the client list and a few engineers.
On the other side are the "platform-ready" MSPs: >$3M EBITDA, >70% recurring revenue, and documented processes. These firms are seeing multiples of 8x to 12x. The delta between these two outcomes is not luck; it is financial engineering.
The "Commodity Trap" in IT Services
Most founders believe that growing revenue is the primary lever for valuation. They are wrong. Growing bad revenue (low-margin hardware resale, unpredictable project work) actually dilutes your multiple. Buyers in 2025 are sophisticated. They strip out low-quality revenue streams during Quality of Earnings (QofE) to arrive at an "Adjusted EBITDA" that is often significantly lower than what you see in QuickBooks. If you want the 10x exit, you stop selling commodity hardware and start selling high-margin, sticky outcomes.
The delta between a 4x and a 10x exit isn't luck. It's the difference between selling a 'book of business' and selling a 'platform'.
The Four Metrics That Determine Your Multiple
Based on data from the Service Leadership Index and recent transaction reports, four specific levers dictate where you fall on the valuation spectrum.
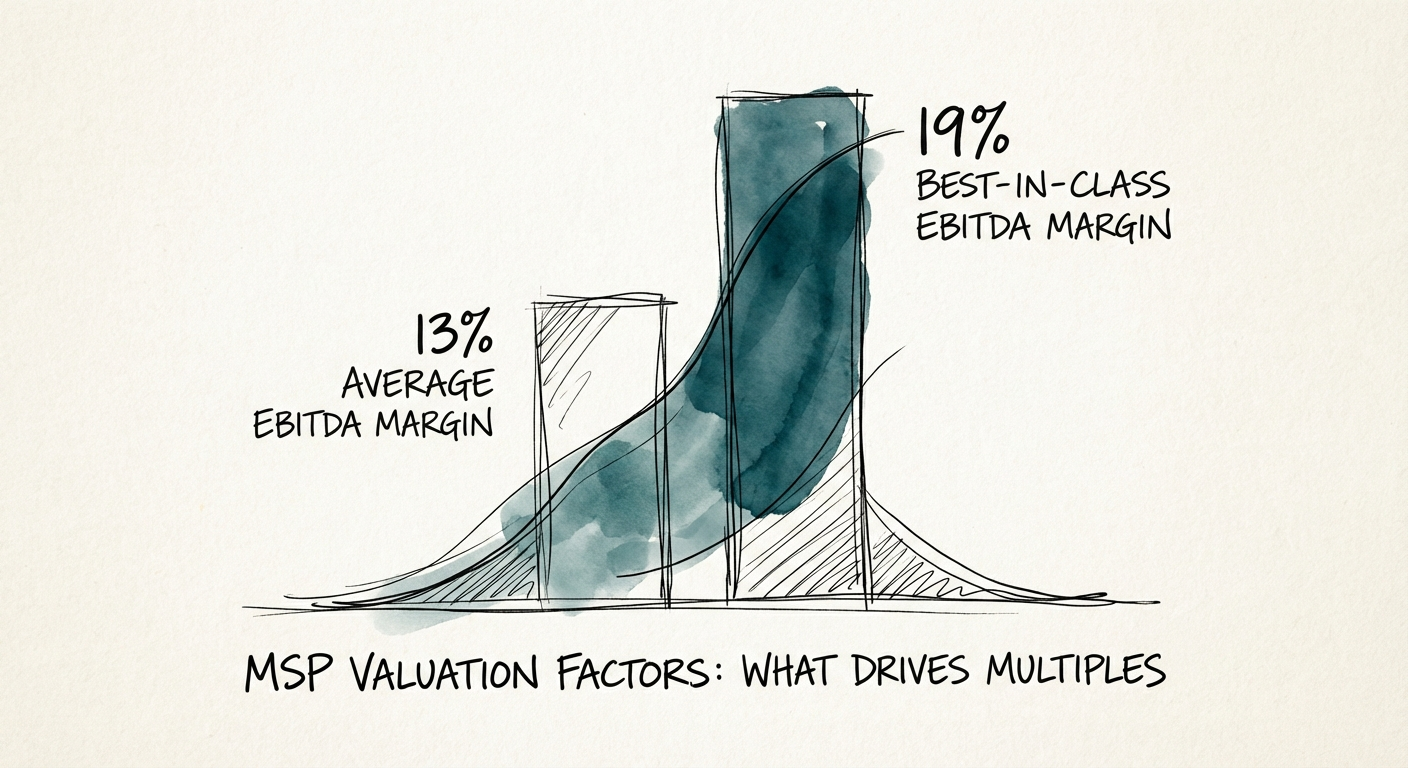
1. EBITDA Margin: The 19% Gold Standard
Average MSPs generate roughly 13-14% adjusted EBITDA. However, Service Leadership data confirms that "Best-in-Class" MSPs have maintained 19%+ EBITDA margins for five consecutive years. Private Equity buyers, who now drive the majority of consolidation, look for a minimum floor of 15% to consider an asset a "platform." If you are running at 10% margins, you are not just less profitable; you are mathematically invisible to premium buyers.
2. Recurring Revenue Mix (The 70% Threshold)
Valuation is a function of predictability. Revenue from hardware and one-off projects is valued at roughly 0.5x to 1x revenue (if at all). Recurring Managed Services revenue is valued on a multiple of EBITDA. To unlock premium multiples, you need >70% of total revenue coming from recurring contracts. This shifts the buyer's risk profile from "Will they buy again?" to "When do they renew?" which is a risk they are willing to pay for.
3. Customer Concentration: The "Whale" Discount
Nothing kills a deal faster than a single client representing 25% of revenue. In the calculus of concentration risk, buyers apply a massive discount if any single customer exceeds 15% of revenue, or if the top five customers exceed 50%. I have seen LOIs drop from 8x to 5x simply because the founder couldn't prove the top client was contractually locked in for 3+ years.
4. Gross Margin on Services
Top-tier valuation requires operational efficiency. The average MSP sees managed services gross margins around 46%. Best-in-class firms target 50% to 60%. This gap indicates whether your engineers are utilized effectively or if you are wasting cash on inefficient service delivery. Refer to our 2025 MSP Gross Margin Benchmarks for a deeper dive into this calculation.
The 24-Month Exit Engineering Plan
You cannot fix these metrics two months before a sale. You need a 24-month runway to restructure the P&L. Here is the operator's playbook for multiple expansion:
- Purge Low-Margin Revenue: Stop selling hardware at 10% margins unless it drags through significant managed services. It inflates your top line but depresses your valuation multiple.
- Migrate "Time & Materials" to MRR: Aggressively convert break/fix clients to managed agreements, even if you have to slightly discount the first year. The valuation arbitrage (trading $1 of project revenue for $1 of recurring revenue) creates a 5x increase in enterprise value.
- Standardize the Stack: "Unique" tech stacks are a liability. Buyers want a standard stack (e.g., ConnectWise/AutoTask + SentinelOne + Microsoft 365) that integrates easily into their platform. Custom configurations are viewed as technical debt.
- Documentation as an Asset: As we discuss in Valuation Gaps, premium buyers pay for systems, not heroes. If your delivery depends on tribal knowledge, you are selling a job, not a company.
Conclusion: Stop Guessing, Start Measuring
The days of selling an MSP based on a multiple of revenue are over. Today's buyers are financial engineers looking for specific characteristics. If you can demonstrate 19% EBITDA, 70% recurring revenue, and low concentration, you dictate the terms. If not, you are merely a bolt-on waiting for a low-ball offer.