The practical answer
- Short answer
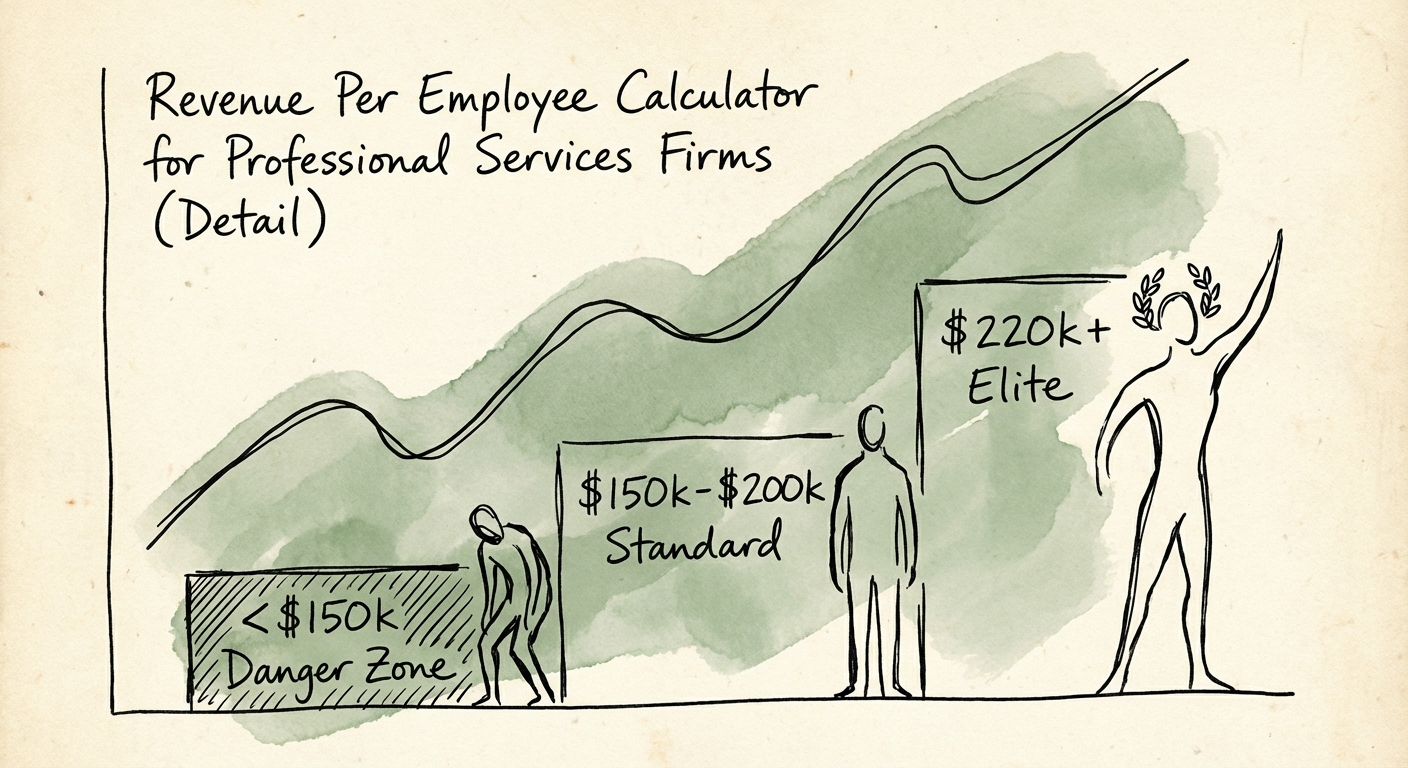
- Calculate your firm's true efficiency. 2025/2026 benchmarks for Revenue Per Employee in professional services. Why <$200k is the danger zone and how to hit $300k.
- Best fit
- Industry: Professional Services. Function: Finance
- Operating path
- Unit Economics → Commercial Performance → Transaction Advisory Services
- Key metric
- $199k Average Revenue Per Consultant (2025 Danger Zone)
The Vanity Metric That is Killing Your Margins
If you are a founder scaling past $10M revenue, you are likely obsessed with utilization. You have a dashboard showing 78% utilization and you feel safe. You shouldn't. Utilization measures busyness, not value.
In 2024, the tech consulting sector faced a brutal reality check. According to the 2025 SPI Professional Services Maturity Benchmark, average billable utilization dropped to 68.9%, dragging EBITDA margins down to a five-year low of 9.8%. But here is the data point that should keep you awake: the average Revenue Per Employee (RPE) for billable consultants has plummeted to $199,000.
If your firm is sitting near this average, you are running a low-margin staffing agency, not a premium consultancy. You are efficiently processing low-value work. To exit at a premium multiple, you need to break the linear relationship between headcount and revenue.
The Calculation That Matters
Most firms calculate RPE wrong. They divide revenue by billable headcount. This ignores your overhead bloat. The only number a PE buyer cares about is:
Total Trailing 12-Month Revenue / Total Full-Time Equivalents (FTEs)
Include everyone. The admin staff, the marketing team, and you. If this number is below $200k, you are in the Danger Zone.
If your Revenue Per Employee is under $200k, you don't have a scaling problem. You have a business model problem. You cannot hire your way out of negative unit economics.
The Benchmarks: Where Do You Stand?
We analyzed data from the 2025 reporting cycle to create a diagnostic framework for services founders. Where does your firm land?
1. The Danger Zone (< $200k RPE)
Status: Commodity Staffing
At this level, you are trading time for money with zero leverage. You likely have a leaky delivery model where scope creep eats your margins. Every $1M in new revenue requires hiring 5+ new people, exponentially increasing your management complexity.
2. The Healthy Service Firm ($200k - $250k RPE)
Status: Stable Consultancy
This is the industry average for decent firms. You have some process documentation, but you are still heavily reliant on heroics. You are profitable, but you aren't scalable. To grow, you must hire.
3. The High Performer ($261k - $300k RPE)
Status: Premium Specialist
According to SPI Research, the top 20% of firms (High Performing Organizations) average $261,000 per billable consultant. These firms have strong utilization controls and premium pricing power.
4. The Tech-Enabled Elite (> $300k RPE)
Status: Platform/Productized Service
This is where valuations jump from 1x revenue to 3x+ revenue. These firms use IP, software, or highly standardized playbooks to deliver value. They disconnect hours from revenue.
How to Fix Your RPE (Without Just Firing People)
Moving from $200k to $300k isn't about working harder; it's about changing your valuation physics.
1. Stop Selling Hours, Start Selling Outcomes
If you bill hourly, your RPE is capped by the number of hours in a year (2,080) times your rate. Value-based pricing allows you to capture the upside of your efficiency. If you deliver a $50k project in 100 hours instead of 200, your effective rate doubles.
2. Automate the 'Grind' Work
The 2025 benchmark data shows that high performers have 20% lower revenue leakage because they use integrated systems (PSA/ERP). If your team is manually updating spreadsheets, you are paying high-salary consultants to do low-value admin work.
3. Prune the 'Inactive' Services
Run an RPE analysis by service line. You will likely find that 80% of your complexity comes from a legacy service line that generates $150k RPE. Kill it. Revenue is vanity; RPE is sanity.