
The practical answer
- Short answer
- SaaS firms spend 10%+ of revenue on tech; services firms should sit at 5-8%. Why copying the wrong benchmark quietly kills your exit multiple.
- Best fit
- Industry: B2B SaaS & Professional Services. Function: Finance & Operations
- Operating path
- Financial Infrastructure → Commercial Performance → Valuations
- Key metric
- 30-35% Average cloud spend wasted on idle resources in SaaS companies
The same 10% means two completely different things
Two companies, both spending 10% of revenue on technology. The first is a SaaS business — that 10% is the engine room: the cloud it runs the product on, the platform customers pay to use. The second is a 90-person consulting firm that bills by the hour, and that same 10% is pure overhead stacked on top of payroll. One number, two opposite stories. Confuse them and you will mis-set your entire budget.
I watched a management team at a roughly $40M tech-enabled services firm justify a 10.5% spend ratio by pulling up SaaS comps. The logic felt airtight to them: we use sophisticated software, therefore we should spend like a software company. But their revenue still came from billable hours, not from recurring license fees. According to the 2026 Umbrex IT Cost & Productivity Guide, digital-native SaaS businesses routinely clear 10% of revenue because their infrastructure is the product — it is the factory. Information-heavy professional services live under different physics entirely, with the 2026 benchmark sitting firmly between 5% and 8%. For contrast, heavy manufacturing runs at roughly 1.95%, per Deloitte's industry tracking. The benchmark you copy has to match the revenue model you actually run.
So here is the line that matters for a services firm: 9% is the inflection point. Below it, you are buying tools that support delivery. Cross above it and exactly one of two things is true. Either you have a board-approved digital transformation underway with a named owner and a sunset date — or you are quietly carrying shelfware and calling it being "tech-enabled." There is no third explanation, and a buyer will figure out which one applies inside the first afternoon of diligence.
A SaaS company's infrastructure is its factory floor. A services firm's infrastructure is overhead. Spend like the former while you bill by the hour and you haven't become tech-enabled — you've just shrunk your margin and called it strategy.
Services overspend out loud. SaaS hides it in COGS.
The two models don't just spend differently — they go wrong in mirror-image ways, and you have to diagnose for the failure mode that matches yours.
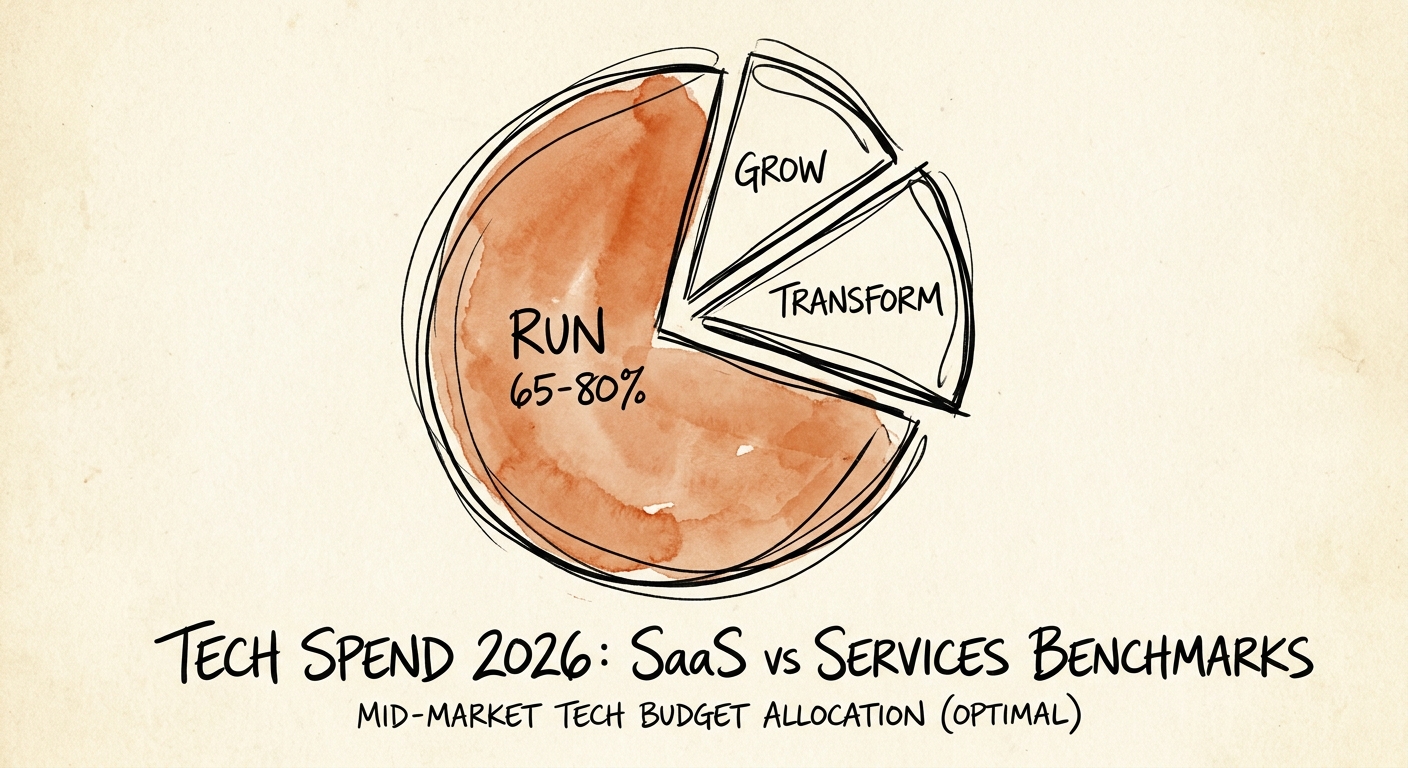
A services firm overspends in the open. The percentage sits high, and the damage is in allocation. Sort every tech dollar into three buckets: Run (keeping the lights on), Grow (improving capability), and Transform (standing up something genuinely new). In a healthy mid-market services business, 65% to 80% of the budget is Run. Push Run past 80% and you are paying premium rates for a utility you've stopped improving. The trap is buying the top tier of Salesforce or Workday in the hope that expensive software will impose process discipline by itself. It won't. License a clumsy delivery workflow at enterprise rates and you have not fixed it — you have just put it on an annual renewal and made it run faster. Rather than a budget you can defend in front of a board, you've built a fixed cost base that scales ahead of revenue.
So stop staring at the top-line percentage and start measuring Tech Spend per Knowledge Worker. If a senior consultant generates $250,000 a year and carries $15,000 in localized SaaS licenses, that ratio tells you far more than any revenue percentage will. Most of that sprawl arrives through the side door anyway — Marketing expenses HubSpot, Sales puts Outreach on a corporate card, Delivery signs up for Monday.com, and you wake up with a fractured data layer that needs paid integration middleware just to produce a weekly flash report. That is the visible black box of IT spend: decentralized purchasing nobody is forced to defend against utilization. Centralize procurement and make every business leader justify renewals against login data, and the number comes down on its own.
The SaaS version: the waste is real, it's just buried
SaaS companies have the inverse problem. Because the product is technology, back-office bloat doesn't show up as a clean overhead line — it gets folded into COGS and R&D where it's far harder to see. In technical diligence we typically find SaaS firms overspending on redundant internal tooling by about 18%, and industry analysts confirm that 30% to 35% of total cloud spend evaporates on idle resources, over-provisioned staging environments, and forgotten instances. That is not the cost of doing business. It's a governance gap wearing an infrastructure costume.
And it surfaces at the worst possible moment — a sell-side Quality of Earnings review. When a buyer finds half a million dollars of unused compute, or both Jira and Asana running as if both were load-bearing, they don't shrug it off. They normalize EBITDA down and read the waste as a tell about engineering culture: a CTO indifferent to cloud unit economics is presumed indifferent to building cost-effective architecture. The dollars matter; the inference about how you run the company matters more, and it compounds against your multiple.
The fix differs by model, so run the one that fits you. If you're SaaS, implement automated chargebacks by business unit and map cloud consumption to actual product feature usage, so you can name the microservices burning cash without driving recurring revenue. If you're services, audit license tiers without mercy: downgrade anyone who hasn't logged in for 30 days, and pull admin rights from anyone not actively changing a configuration. Either way, the principle is the same — a premium valuation comes from disciplined capital allocation, not from owning every subscription on the market. Make your team prove the return on a technology dollar before the purchase order clears, not after the auditors find it.