
The practical answer
- Short answer
- A private equity guide to auditing data pipelines in analytics acquisitions. Discover the 4 metrics that reveal hidden technical debt and how to quantify 'data downtime' in valuation.
- Best fit
- Industry: Private Equity / Technology. Function: Technical Operations
- Operating path
- Technical Debt → Turnaround & Restructuring → Transaction Advisory Services
- Key metric
- $12.9M Average annual cost of poor data quality for organizations (Gartner).
The $12.9M Blind Spot in Your Analytics Thesis
You are buying an analytics company for its ability to turn raw information into high-margin insights. The investment thesis usually relies on a simple equation: more data + better models = higher ACV. But there is a hidden variable that most private equity due diligence overlooks until it’s too late: the fragility of the data pipeline itself.
In 2026, the cleanliness of the data infrastructure is as critical as the quality of the revenue. Gartner estimates that poor data quality costs the average organization $12.9 million annually. For a mid-market analytics firm with $50M in revenue, that isn't just a line item; it's a structural cap on EBITDA. When you acquire an analytics target, you aren't just buying the dashboard the customer sees; you are inheriting the miles of invisible, often duct-taped piping that feeds it.
If that piping is corroded—plagued by undocumented dependencies, manual schema patches, and 'heroic' engineering interventions—your 100-day plan will stall. Instead of launching new AI features (the growth story you sold to the Investment Committee), your acquired engineering team will spend 50% of their time on remediation. This is what we call 'Data Debt,' and unlike financial debt, it doesn't show up on the balance sheet until the system crashes.
The 'GenAI' Multiplier Effect
The stakes have risen because of Generative AI. In 2023, a 'good enough' pipeline meant the CEO’s dashboard loaded by 9 AM. In 2026, where analytics products are expected to feed RAG (Retrieval-Augmented Generation) models in real-time, 'good enough' data kills product viability. If the pipeline feeds hallucinations into an automated customer-facing agent, the liability isn't just technical—it's reputational and legal.
Data debt is the silent killer of analytics exits. You buy the company for its AI potential, but you spend the first two years fixing the SQL queries that feed it.
The 4-Point Data Pipeline Diagnostic
When evaluating an analytics target, you cannot rely on the CTO's assurance that 'our stack is modern.' You need to audit the physics of how data moves. Use this diagnostic framework to assess the true quality of the asset.
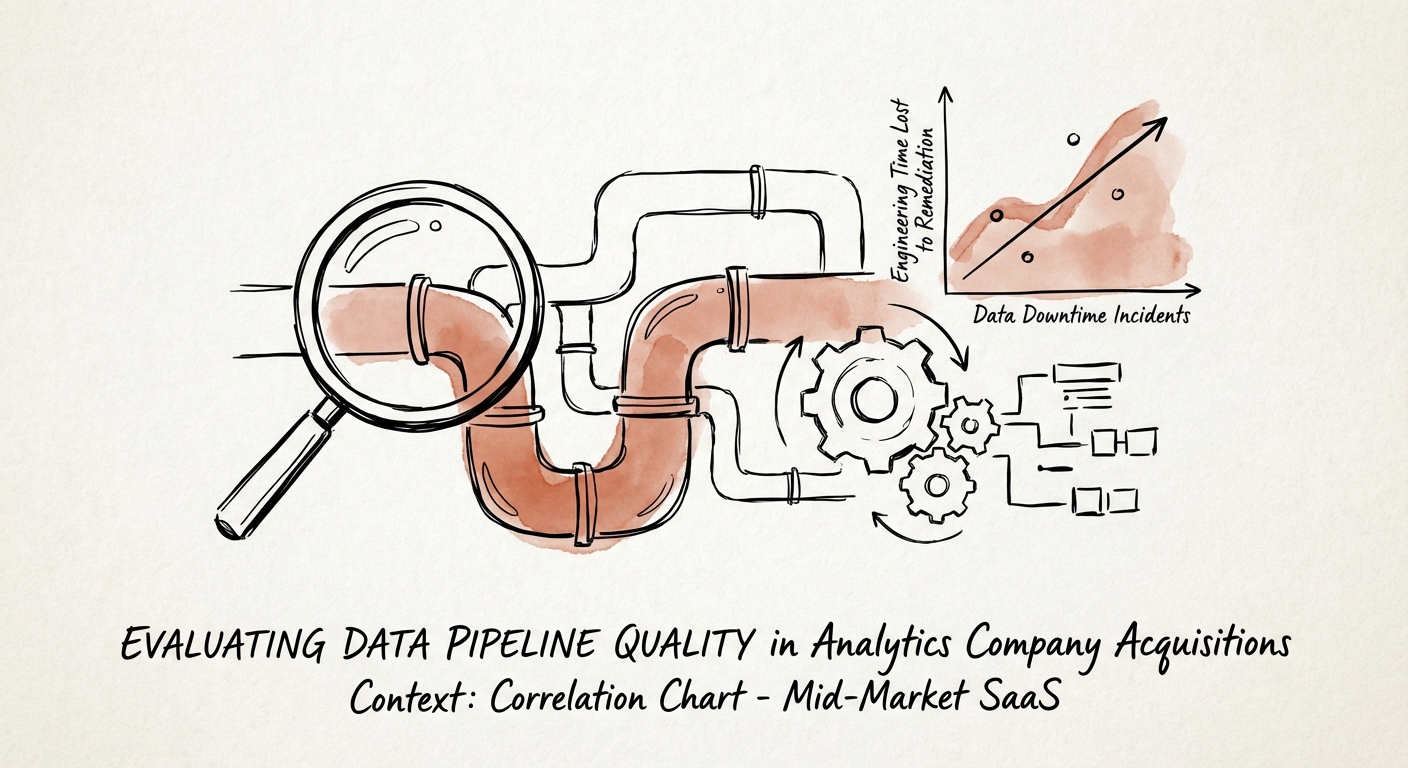
1. Data Downtime & Reliability
Ask for the 'Data Downtime' logs for the trailing 12 months. Data downtime refers to periods when data is partial, erroneous, or missing. According to Monte Carlo Data, data incidents have nearly doubled year-over-year. A healthy pipeline should have automated circuit breakers. If the target company relies on customers to report broken dashboards, you are looking at a valuation discount.
- Red Flag: >1 incident per week requiring manual intervention.
- Red Flag: No automated testing (Great Expectations, dbt tests) in the CI/CD pipeline.
2. The 'Hero' Ratio
Analyze the git commit history of the data engineering team. If 80% of the complex pipeline fixes are committed by a single 'Hero Engineer' (often a founder or early employee), you have a key person dependency masquerading as a technology asset. When that person leaves post-close, the pipeline stops.
3. Consumption Efficiency (The Snowflake Tax)
Inspect the cloud data warehouse bill (Snowflake/Databricks) relative to ARR growth. In efficiently architected pipelines, storage costs grow linearly while compute costs should optimize over time. If compute costs are growing faster than ARR, the pipeline is likely inefficient—running full table scans instead of incremental updates. This is 'Financial Technical Debt' that will directly erode your gross margins.
4. Latency vs. Value
Does the architecture match the promise? If the marketing deck promises 'Real-Time AI' but the architecture relies on nightly batch jobs via Airflow, you have a product-market fit gap. Re-architecting from batch to streaming (Kafka/Flink) is a 12-18 month initiative costing $2M+. You need to price this into the deal.
Quantifying 'Data Debt' in the Valuation
Once you identify these issues, you must quantify them. 'Data Debt' is not abstract; it is a future cash flow obligation. McKinsey research suggests that technical debt effectively amounts to 20-40% of the value of the entire technology estate. In an analytics acquisition, this percentage can be higher because the data is the product.
The Purchase Price Adjustment
If your due diligence reveals that the target lacks automated data quality checks or relies on manual 'data janitor' work, calculate the cost of remediation:
- Headcount: 2 Senior Data Engineers ($400k/year) for 12 months to refactor.
- Tooling: Implementation of observability platforms (e.g., Monte Carlo, Datadog) at $50k/year.
- Opportunity Cost: The 6-month delay in the new product roadmap.
We typically see this tallying to $1.5M - $3M in immediate post-close expense. This should be treated as a working capital adjustment or a specific indemnity, not just an operating expense. If the seller pushes back, use the 'Maintenance CapEx' argument: the pipeline is an asset that has not been maintained, requiring immediate capital infusion to function at the promised scale.
The Exit Narrative
Conversely, a verified, automated, and self-healing data pipeline is a premium asset. It allows you to position the company not just as a 'Service Provider' but as a 'Platform' suitable for bolt-on acquisitions. When you sell, being able to demonstrate 99.9% data reliability and a documented, automated lineage will support a higher multiple from strategic buyers who fear integration nightmares.