The number in cell C14 that quietly bankrupts the thesis
Here is the deal everyone in the room agreed was clean. You bought a platform company doing $30M in revenue, then stapled on two smaller competitors inside the same quarter. The investment committee memo had a beautiful waterfall: consolidate the back office, merge two overlapping product roadmaps, cross-sell into a combined book of customers. Net of everything, the model spat out $4M of incremental EBITDA inside 18 months. Nobody pushed on it because the logic was self-evident.
Six months after close, the same $4M lives in a different reality. The ERP cutover that was supposed to take a quarter is stuck behind a data-cleansing project nobody scoped, burning roughly $150K a month in bridge consultants. The two sales teams aren't cross-selling — they're litigating who owns the mid-market accounts in the overlap. And costs didn't fall. They rose, because you're now paying for duplicate software seats and retention bonuses for four engineers you discovered, post-signing, were the only people who understood the acquired company's billing logic.
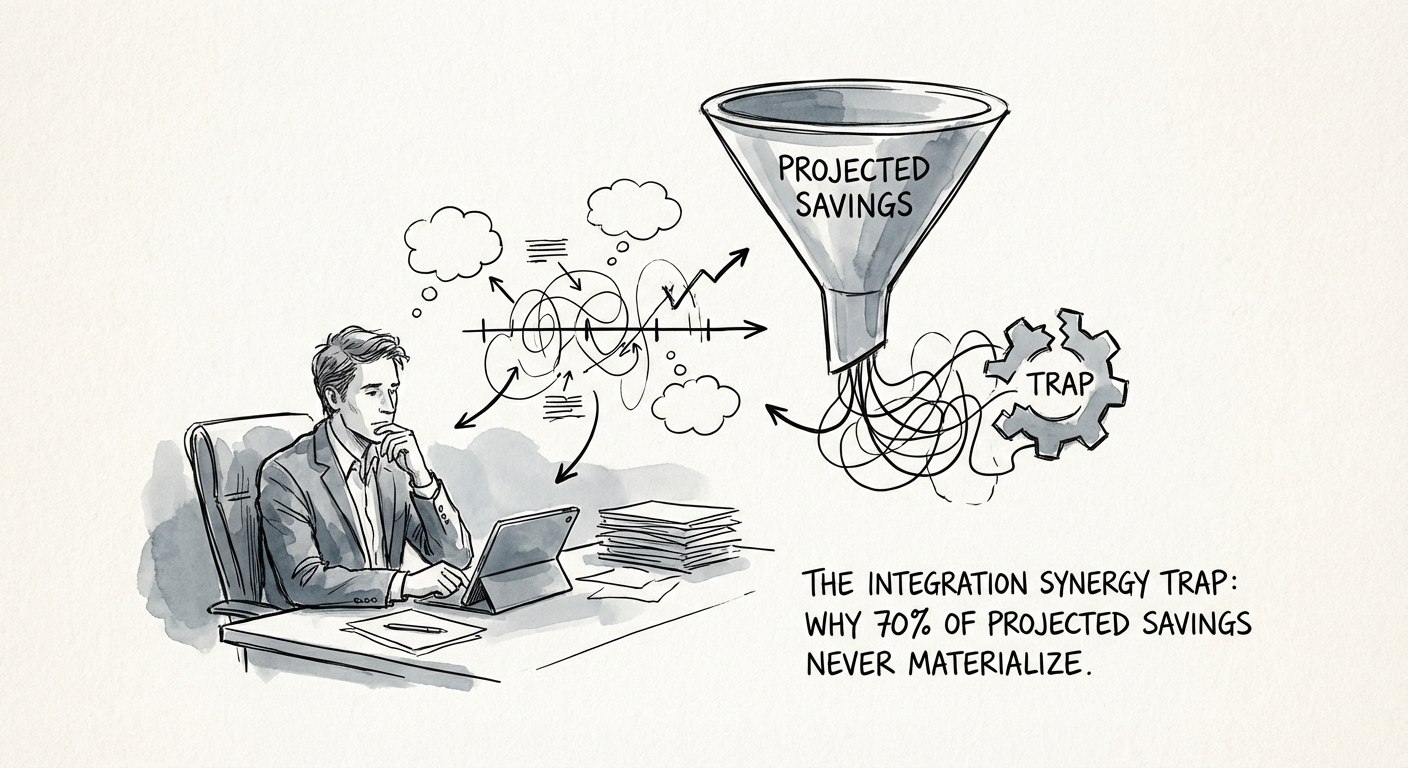
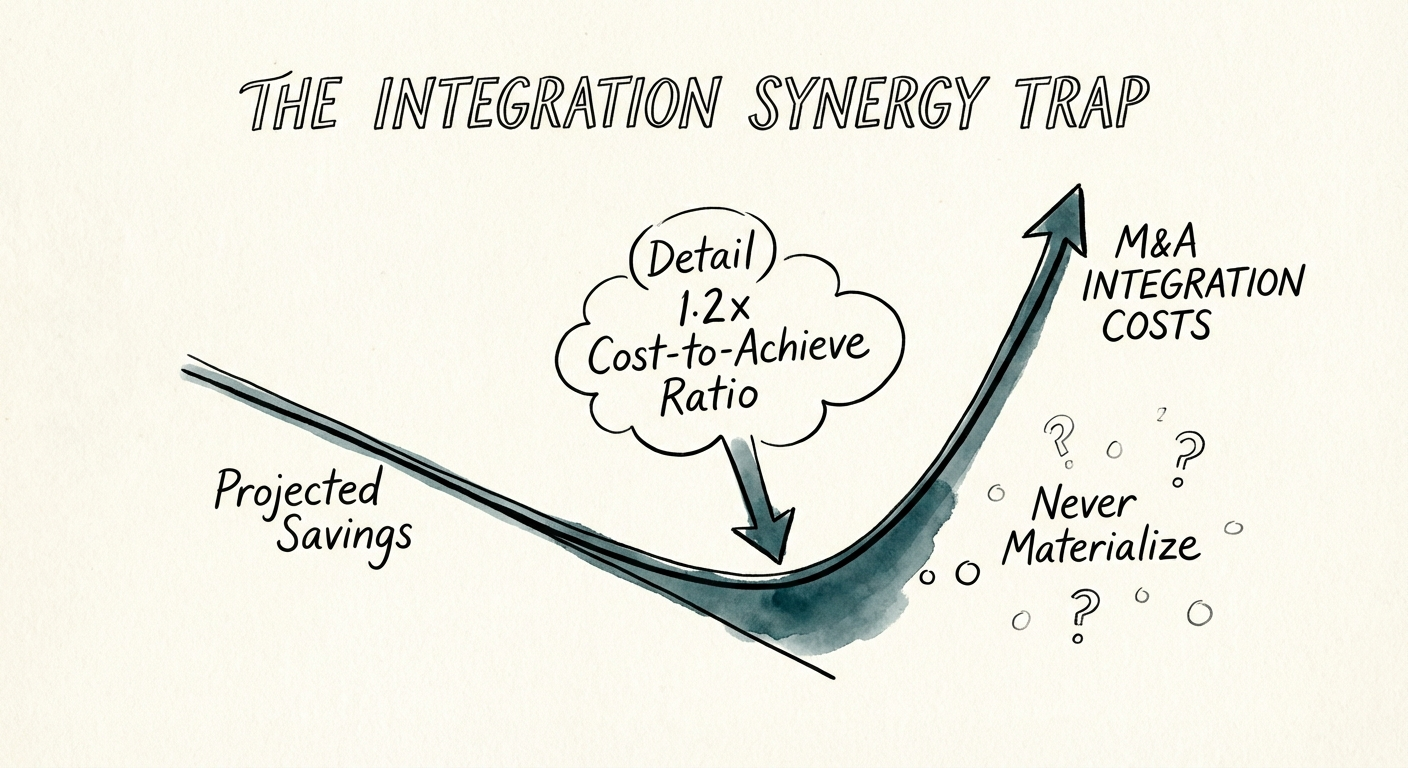
This is the synergy trap, and it is specific to your situation as an operating partner running a platform-plus-bolt-on play: you underwrote financial engineering and you are now executing operational engineering, and the two are priced completely differently. McKinsey's analysis of deal synergies puts the one-time cost to capture a dollar of run-rate savings at roughly $1.10 to $1.20. So your tidy $4M target quietly carried a near-$5M cash bill to realize it. Most sponsors budgeted half of that, if they line-itemed it at all — and the gap is where the thesis goes to die.
The three places a bolt-on synergy model leaks
Cost synergies cost more than you modeled, and L.E.K. Consulting notes that even the controllable ones — severance, lease breakage, migration tooling, retraining — run inflation-prone. Revenue synergies are worse: in the deals that disappoint, the cross-sell line is the first to evaporate. Three leaks do most of the damage on a back-office-consolidation thesis.
Leak 1: the migration line item that was never a line item
In diligence, "system consolidation" was one row with a round placeholder number. But you didn't buy one clean system — you bought a platform on its own ERP plus two bolt-ons running theirs, and merging three charts of accounts and three customer masters is a forensic data project, not an IT ticket. This is exactly where cloud migration cost overruns eat the savings before you decommission a single server. Through the 6-to-18-month slip that follows, you pay for parallel systems, parallel support, and the bridge contractors holding it together.
Leak 2: the CRM merge that turns Year 1 savings to zero
The most dangerous figure in the model is "net" synergy — the savings without the honest cost to capture them. When the two sales orgs ran different pipelines and pricing logic, a Salesforce consolidation isn't a deduplication exercise; rebuilding the CPQ and quote-to-cash flow alone can absorb a $500K specialist engagement. That's your first-year headcount savings, spent before it ever hit the P&L.
Leak 3: the talent you needed to keep, leaving
Culture isn't a soft cost — it has a wire transfer attached. Bolt the acquirer's process onto a smaller, faster team and the people who made the acquired company worth buying start updating their LinkedIn. When the engineer who owned the billing system leaves over a new time-tracking mandate, you lose the institutional knowledge, then pay recruiting fees and ramp time to backfill it. The "headcount synergy" you banked turns into a hiring bill.
Re-underwrite at $1.20, then integrate three systems and stop
The fix is to stop reporting synergy as a P&L outcome and start managing it as an execution program with its own owner. Three moves matter more than the rest.
Re-underwrite the model at a 1.2x multiplier before Day 1
Take the synergy number and apply the McKinsey cost-to-capture ratio: assume $1.20 of one-time cash for every $1.00 of run-rate savings. If the deal still pencils, proceed. If it only works at par, the synergy isn't real — it's a hope. Force a bottom-up migration budget out of whoever will actually run the cutover, not a top-down round number from the deal team.
Integrate exactly three systems in Year 1
The instinct to unify everything is what produces integration fatigue and stalled teams. Pick the three platforms that drive value visibility — finance (ERP), revenue (CRM), people (HRIS) — and let everything else stay separate until Year 2. Our 90-day IT integration roadmap sequences which to touch first so you're not running three cutovers at once.
Report actioned synergies apart from realized cash
Make the board pack distinguish contracts cancelled and roles eliminated (actioned) from dollars that have actually hit the bank (realized). Bain's 2025 M&A Report finds the acquirers who win pursue cost and revenue synergies together but track each with separate rigor — so a stalled migration never gets masked by a quick cost win, and you see the leak while you can still plug it. Open the model Monday, find cell C14, and ask the one question diligence skipped: who writes the check to make this true, and how big is it?