
The practical answer
- Short answer
- Last-touch attribution tells boards to cut marketing and double SDRs. Here's how W-shaped and algorithmic models expose the real B2B buyer journey.
- Best fit
- Industry: B2B Software and Services. Function: Revenue Operations
- Operating path
- Revenue Architecture → Commercial Performance → Office of the CFO
- Key metric
- 68% Pipeline generated by 'last-touch' outbound sales that was actually incubated by 4+ prior marketing touches over 6 months.
The dashboard that lied to the board
Here is the meeting I keep walking into. A B2B software company, somewhere between $20M and $60M in revenue, pulls up the CRM in front of the board. The chart is clean: outbound SDRs are credited with 80% of new pipeline. So the logic writes itself — double the SDR team, cut the content and demand budget by a third, harvest harder. Six months later pipeline doesn't grow. It falls off a cliff. Nobody can explain why, because the report that justified the decision is the same report that's now hiding the cause.
The model didn't malfunction. It did exactly what last-touch attribution does: it handed 100% of the credit to whoever made the final move before the opportunity got logged. In a long-cycle enterprise sale, that's almost always the SDR's call or the demo request. But the call isn't what built the deal. It's the administrative trigger that fired after the deal was already warm. Gartner's B2B Buyer Journey research puts the average enterprise purchase at roughly 27 discrete touches before signature. Last-touch scores one of them and throws the other 26 in the trash — the technical whitepaper a security lead forwarded to the CFO, the peer-review thread on a private Slack, the webinar the eventual champion attended four months before they ever raised a hand.
That gap isn't academic. Bain's enterprise sales efficiency work ties a large share of misallocated go-to-market budget directly to single-touch attribution being forced onto multi-stakeholder buying motions. The pattern repeats because executives want a one-line answer to a question that has a committee for an answer. In B2B software, a six-figure deal isn't decided by a person who got cold-called. It's negotiated inside a buying group where the economic buyer, the technical evaluator, and the end-user champion each needed something different to say yes. Attribution that can't see the committee can't see the deal.
Last-touch attribution doesn't measure what created the deal. It measures who happened to be standing closest when the deal admitted it was ready. Those are not the same thing, and confusing them costs you a third of your go-to-market budget.
Why the mid-funnel starves first
When two leaders are both rewarded by a model that double-counts touches, they stop building revenue and start fighting over it. I sat in a board meeting at a roughly $40M SaaS company where the CRO and the CMO presented pipeline numbers that, added together, came to about 140% of the pipeline the company actually generated. Both reports were "right." Both used linear attribution that overlapped on the same deals, so each leader claimed sourcing credit for the same opportunities. The board couldn't fund either plan because neither number was real.
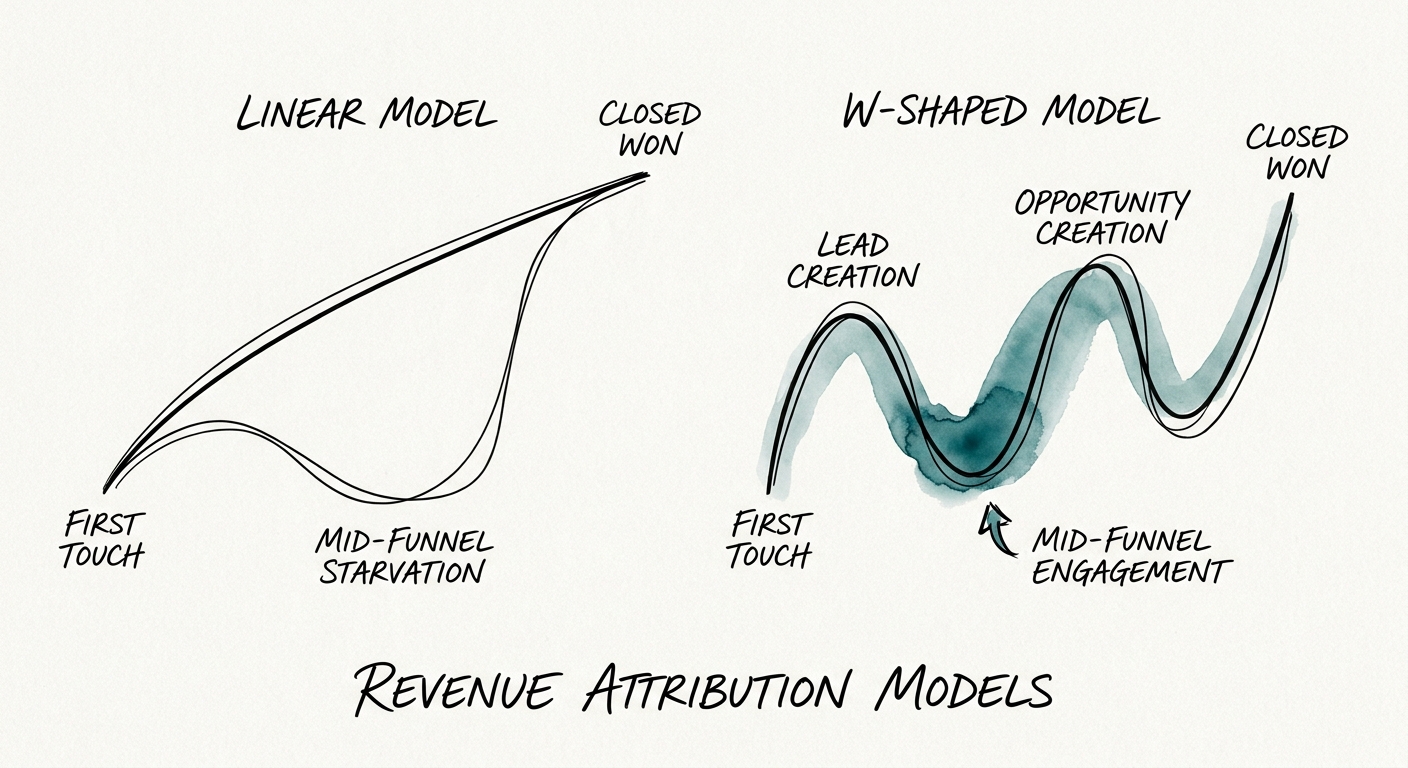
The fix starts by killing the two laziest models in the building. Last-touch you already know about. The other one is even-weight — giving a five-minute webinar replay the same 10% credit as the executive dinner where the deal actually turned. That's not measurement, it's arithmetic that refuses to make a judgment. The honest floor is a W-shaped model: 30% to the first touch that created the contact, 30% to the touch that converted them to a lead, 30% to the touch that opened the opportunity, and the last 10% spread across the nurture touches in between. It's not perfect, but it credits the three moments that demonstrably move a B2B deal forward instead of pretending they didn't happen.
The reason this matters more in software than almost anywhere else is the sales cycle. Forrester's revenue architecture research finds that a large majority of pipeline credited to outbound was actually incubated by four or more marketing touches over the preceding months. So when a board "cuts marketing because outbound is working," it's defunding the exact incubation that makes outbound connect — and outbound quietly stops working one cycle later, by which point the budget decision looks unrelated. PwC's revenue operations benchmark shows the misallocation gets sharper the longer the cycle runs past four months. The mid-funnel is where deals are educated and de-risked, and it's the first thing a single-touch model tells you to defund — because it's the part the model literally cannot see. This is the blind spot disciplined revenue operations architecture exists to close: connect the CRM, marketing automation, and sales engagement platforms under one campaign taxonomy so the same deal can't be claimed twice and no stage goes uncounted.
What to actually do Monday
Don't start by buying an attribution tool. Start by forcing leadership to agree on one source of truth, because multi-touch attribution is a change-management fight dressed up as a software project. Pull your last 12 months of closed-won deals and tag every touchpoint into one taxonomy — the same event named the same way whether marketing or sales logged it. You will find the double-counts the first afternoon. That alone is worth doing even if you never run a model, because it tells you which touches your team has been quietly erasing.
From that baseline, move toward algorithmic attribution, which uses the historical data to assign fractional credit based on how much a touch actually shifts conversion probability. Say a technical security whitepaper consistently moves software deals from stage two to stage three roughly 40% faster than the average asset — an algorithmic model weights it heavily even though it's almost never the first or last touch, because the data shows it's load-bearing. That's the asset a last-touch report would have you defund. McKinsey's B2B go-to-market analytics work ties a move to algorithmic multi-touch to a meaningful lift in capital-allocation efficiency inside the first year — more pipeline yield from the same spend, because the dollars stop going to the loudest touch and start going to the effective one.
Three concrete moves: (1) reconcile the CRO and CMO pipeline reports into a single number this quarter, even if the combined total drops — a smaller honest figure beats two inflated ones the board can't fund. (2) Put a multi-touch dashboard in the weekly revenue review and treat marketing and sales as one supply chain, not two departments competing for the same credit. (3) Recompute your CAC payback on the fully loaded cost of a logo — every incubating touch included — because that's the number a buyer of your business will recompute anyway. Force the integration, expose the real buyer journey, and fund the touches that accelerate revenue instead of the ones that happen to close it.