BRIEF · FINANCIAL INFRASTRUCTURE
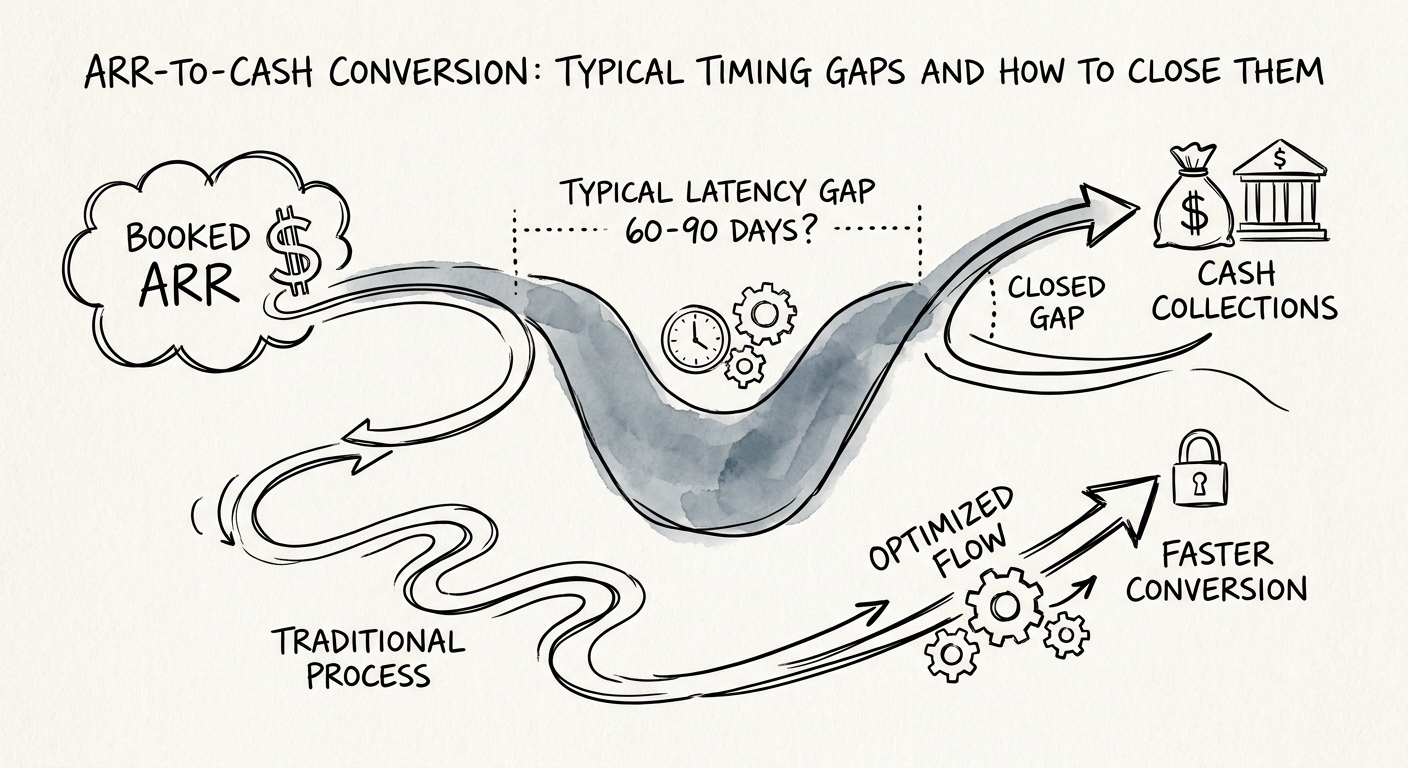
The 70-Day Gap Between Your ARR Dashboard and Your Bank Balance
Your SaaS dashboard says $15M ARR. Your bank says otherwise. Here's where the days leak in the order-to-cash cycle, and how to claw each one back.
75% Reduction in order-to-cash time via system architecture alignment
BRIEF · UNIT ECONOMICS
Your Biggest SaaS Customer Is Your Biggest Discount: Concentration Risk at Series B
Why one whale account above 10% of ARR can reset a Series B SaaS exit from 8x to 5x in diligence — and the GTM mechanics that dilute concentration first.
< 20% Top-10 ARR Concentration Benchmark
BRIEF · FINANCIAL INFRASTRUCTURE
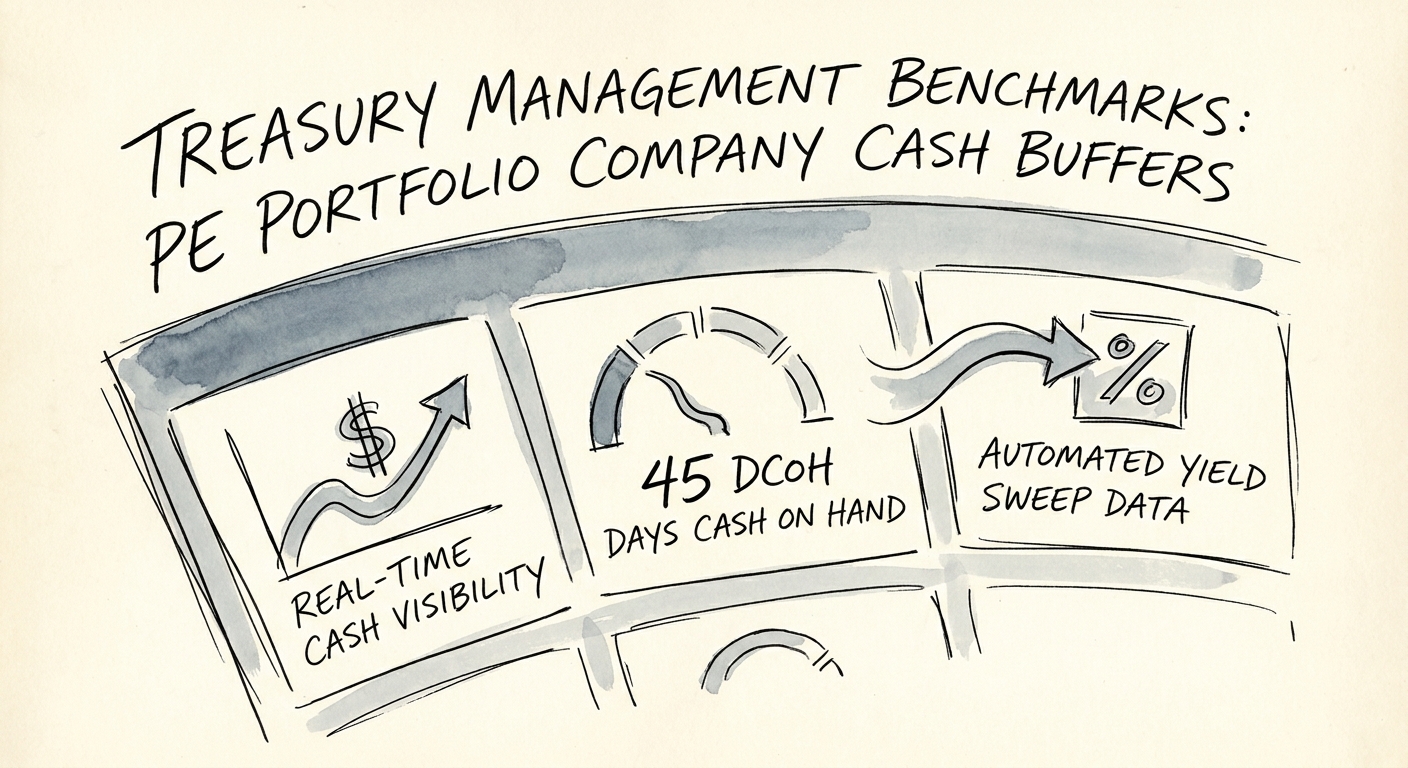
Treasury Management Benchmarks: Why Your Portfolio Company's Cash Buffer is Bleeding EBITDA
Discover 2026 treasury management benchmarks for PE portfolio companies. Learn why holding 45 days of cash on hand is a valuation trap and how to stop cash drag.
$640,000 Average Annual Unearned Yield Leakage
BRIEF · COMPLIANCE & SECURITY
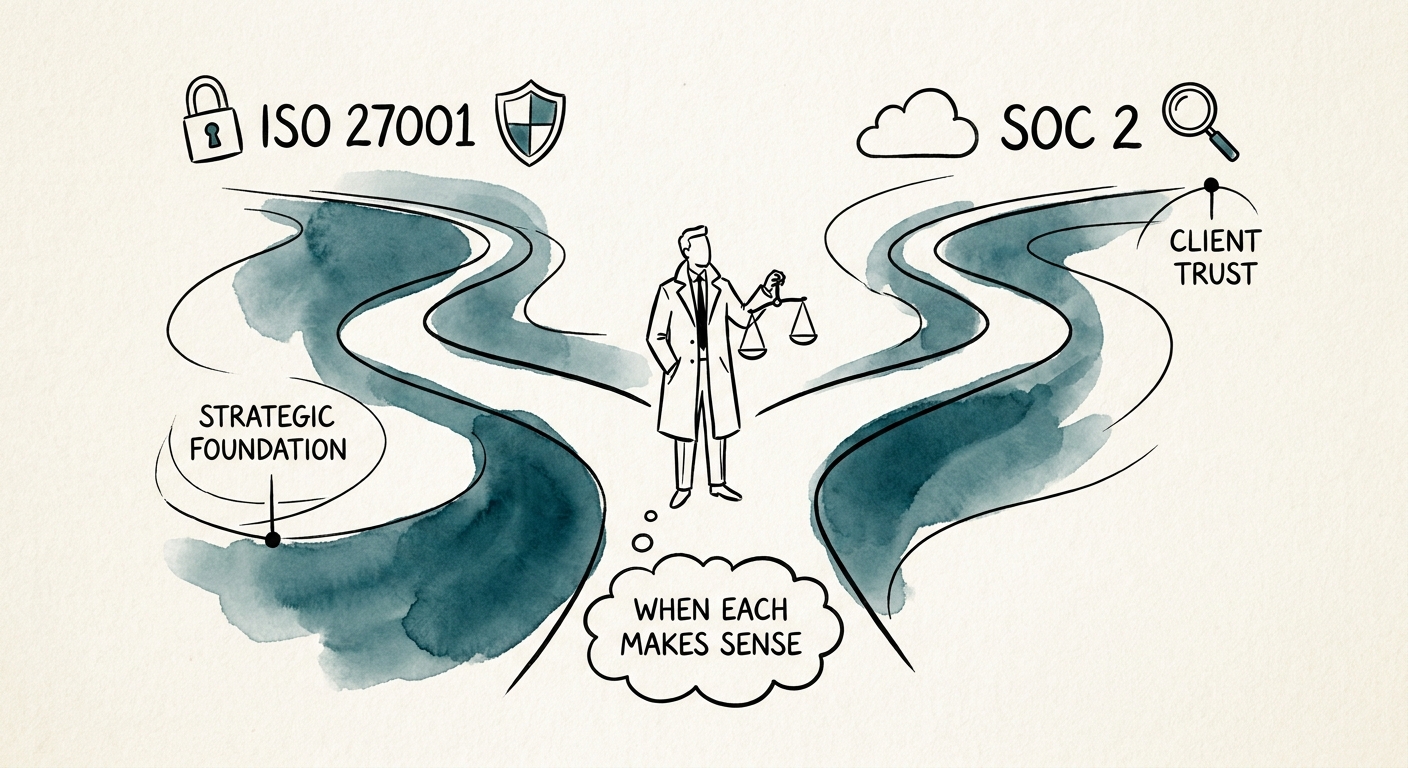
ISO 27001 vs SOC 2: Pick the Badge Your Buyer's Procurement Team Already Requires
SOC 2 or ISO 27001 first? The answer is in your pipeline map, not your security backlog. Justin Leader on sequencing the badge to where your revenue lives.
4.2 Months of enterprise sales cycle delay due to wrong framework
BRIEF · FINANCIAL INFRASTRUCTURE
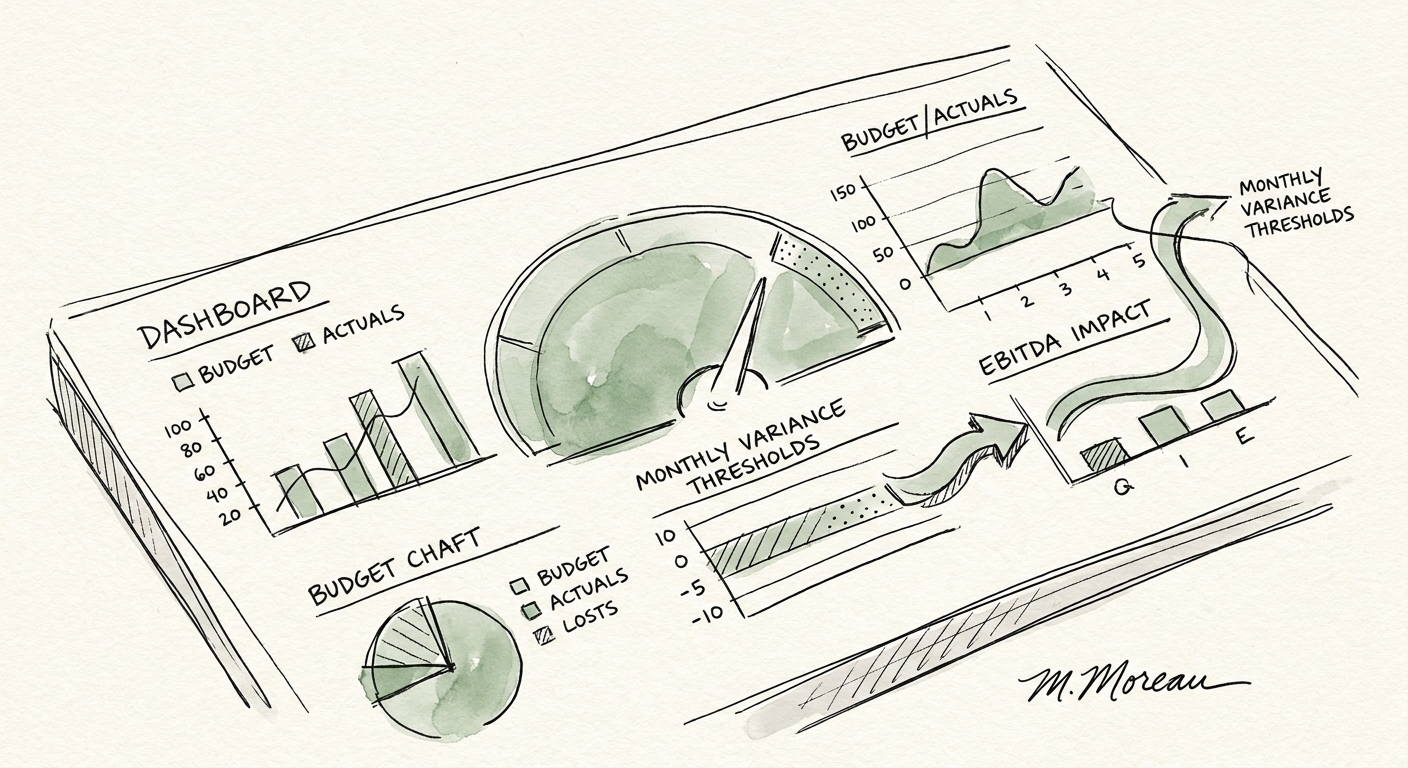
One Blended Variance Number Is Hiding a Margin Fire in Your Portfolio Company
A single blended budget-vs-actuals number hides departmental margin leaks. Here are the category-specific monthly variance thresholds PE operators should enforce.
1.2x EBITDA multiple destruction caused by compounding 5% OPEX variances
BRIEF · TEAM & HIRING
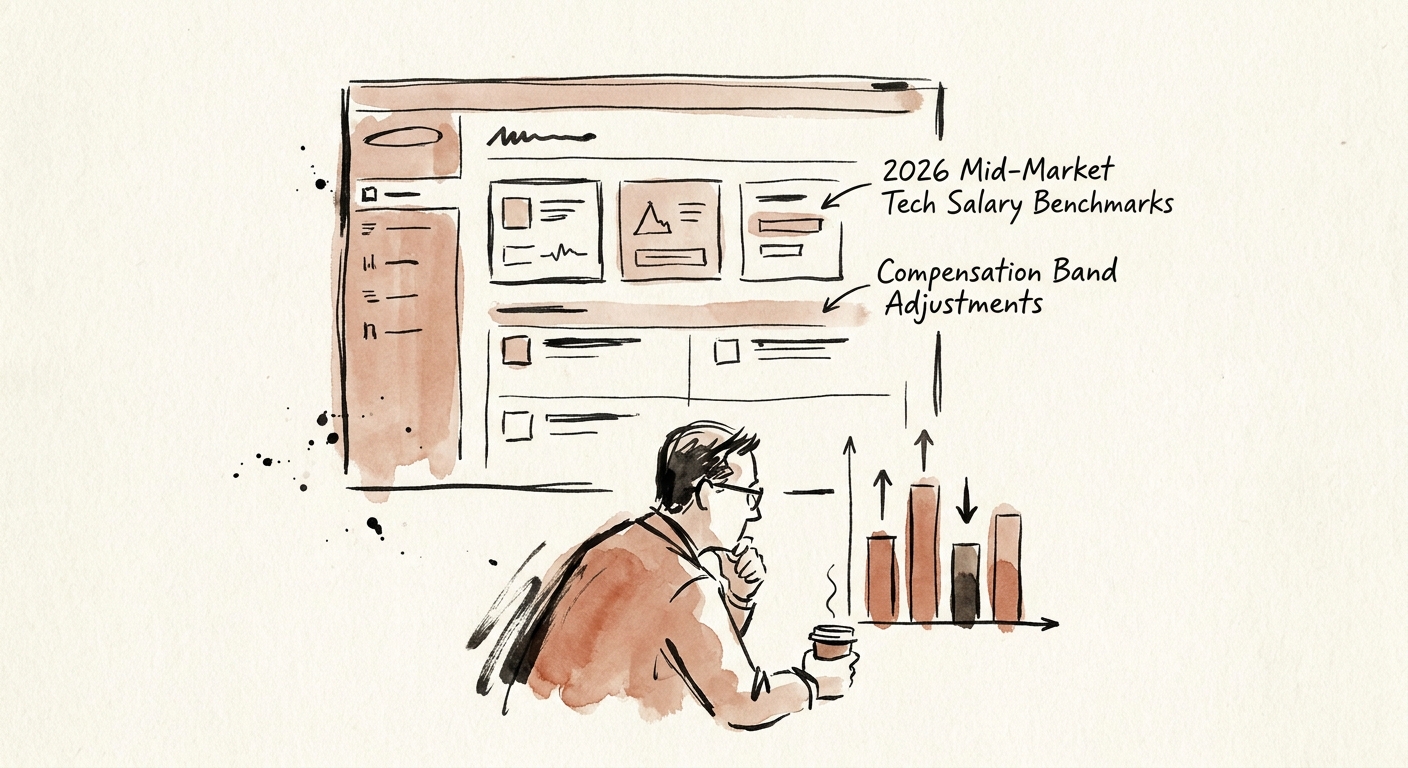
2026 Mid-Market SaaS Pay Bands: Where the $45K Spread Hides
A $20-100M ARR SaaS company will overpay full-stack engineers by ~$35K and underpay its data-platform lead. Here are 2026 bands and how to rebuild them.
6 months Recommended Review Cadence for Critical Roles
BRIEF · UNIT ECONOMICS
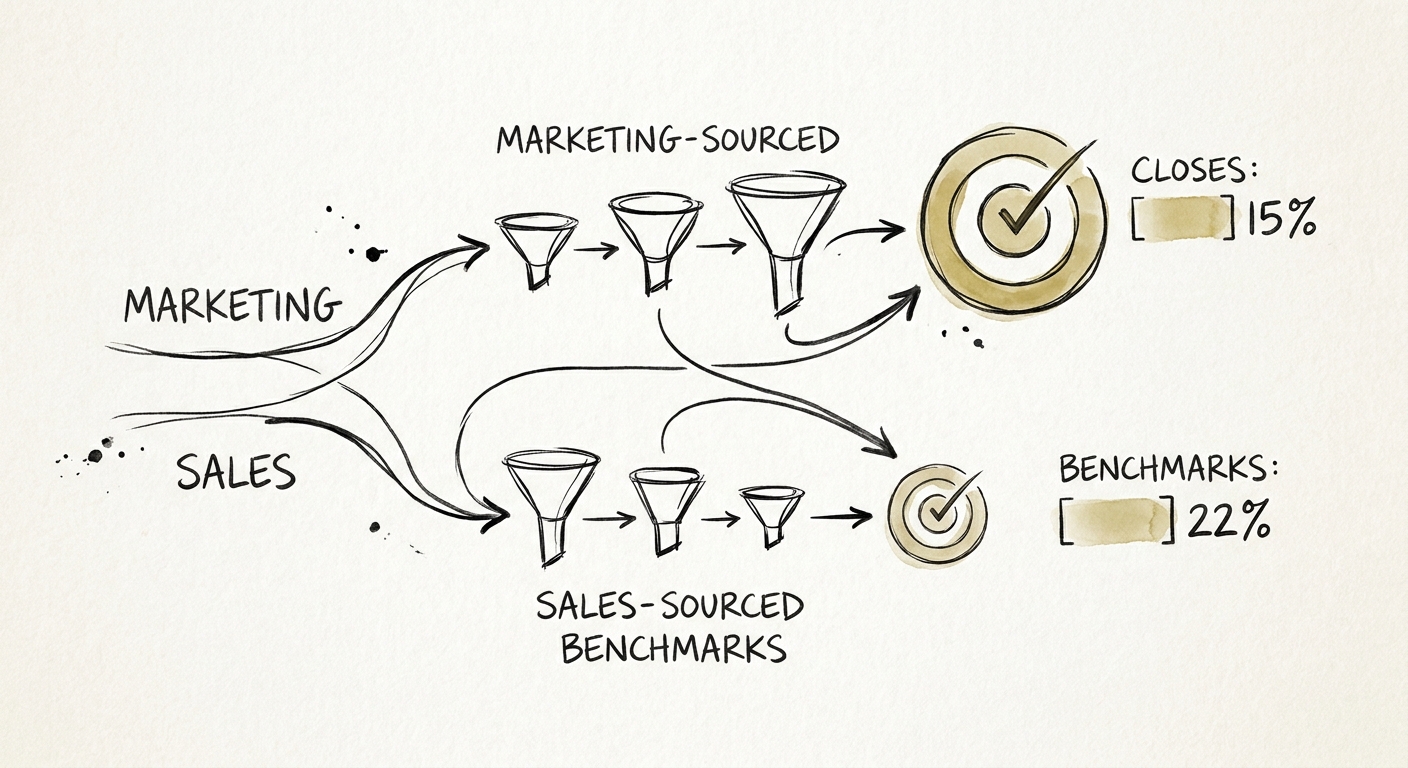
The 50/50 Pipeline Lie: Why Marketing-Sourced Deals Destroy Your Unit Economics
Discover why marketing-sourced pipeline closes at less than half the rate of sales-sourced deals, and how B2B SaaS leaders must adjust CAC payback models.
11.4% Average win rate for marketing-sourced enterprise SaaS pipeline
BRIEF · MIGRATION & INTEGRATION
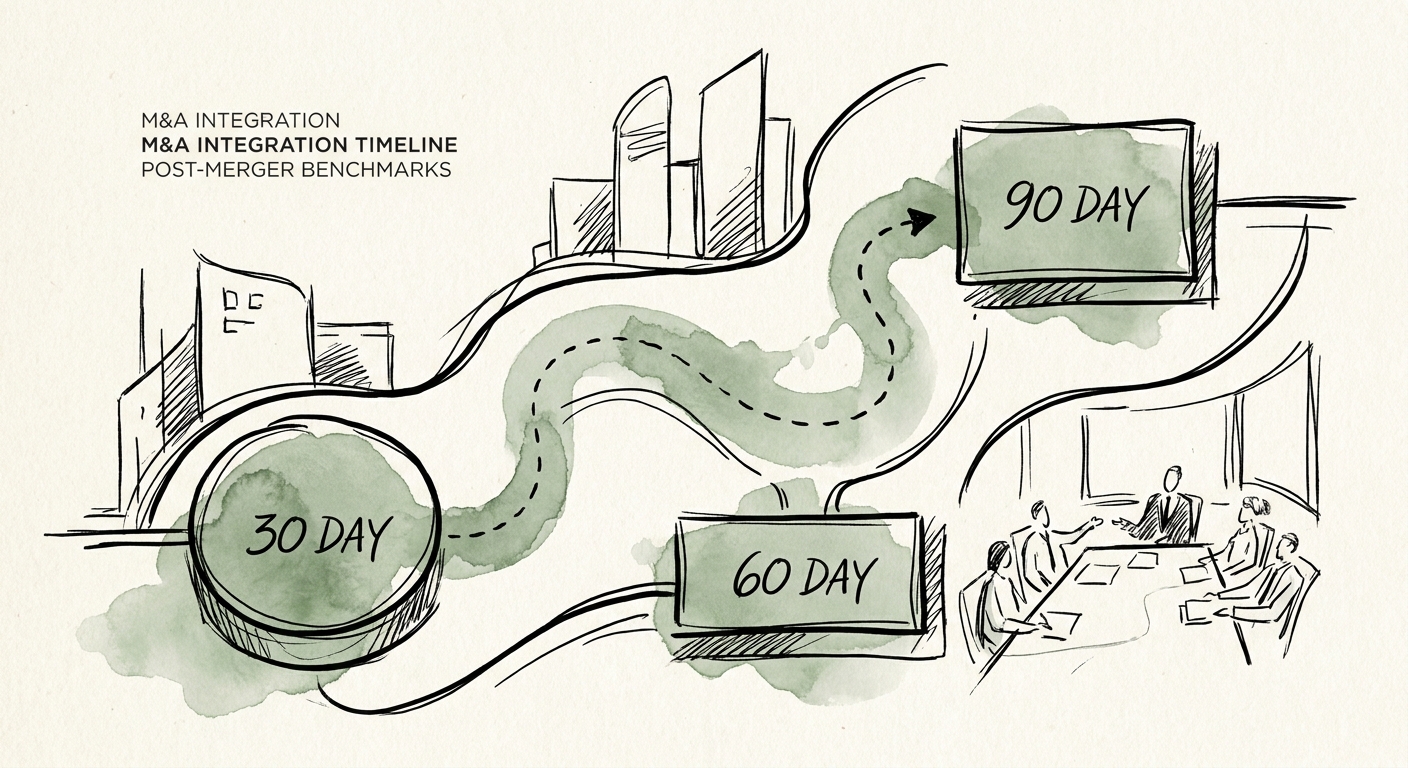
M&A Integration Timeline Benchmarks: The 30, 60, and 90-Day Milestones That Save Your Deal
Discover the 30, 60, and 90-day M&A integration timeline benchmarks that private equity operating partners use to prevent value destruction and capture synergies.
86% of acquirers fail to achieve significant integration success due to timeline execution errors
BRIEF · TECHNICAL DEBT
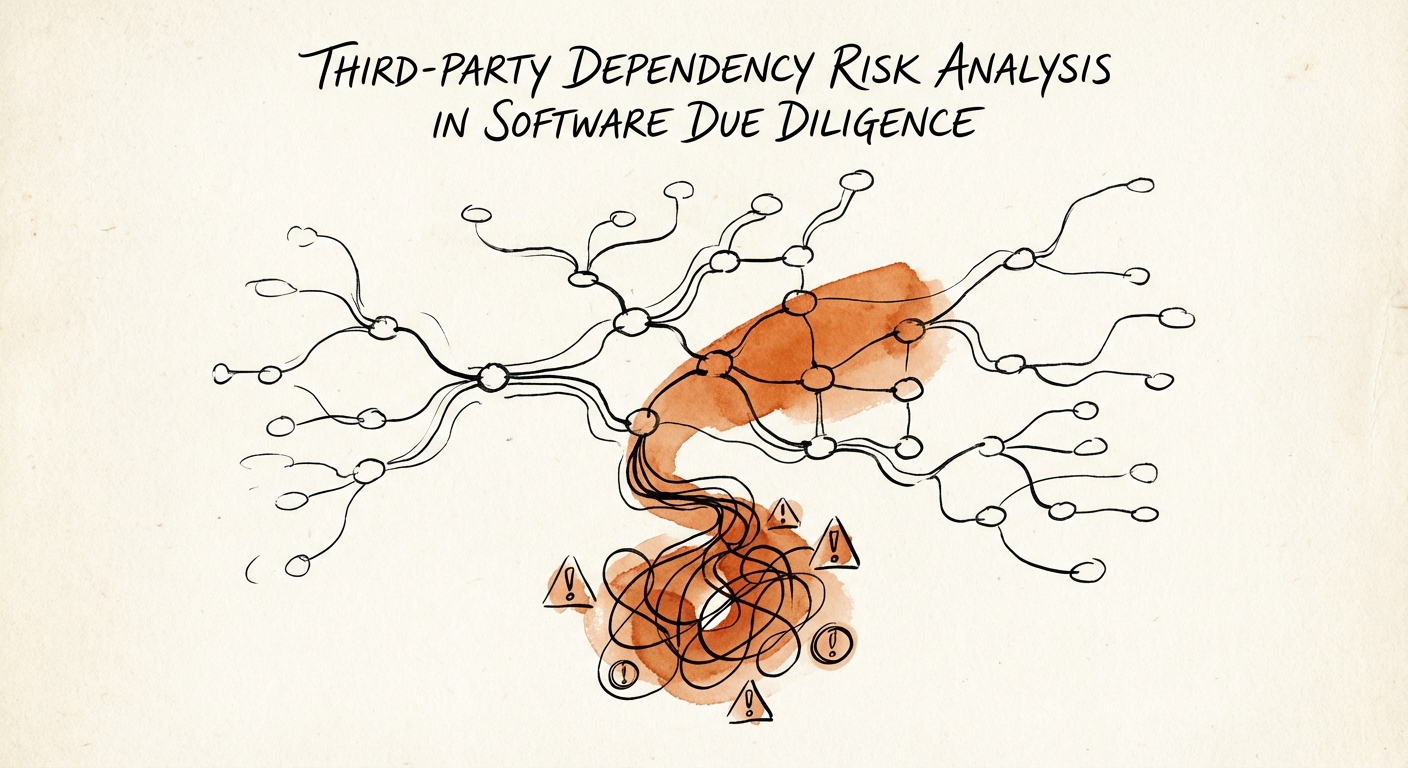
The Dependency Tree Is the Asset: Pricing Third-Party Risk Before You Sign
A target's package.json lists 50 dependencies. The real number is 2,000. Here's how to price the transitive risk hiding underneath before you close.
74% of codebases contain high-risk open source vulnerabilities (Synopsys 2024)
BRIEF · GTM EXECUTION
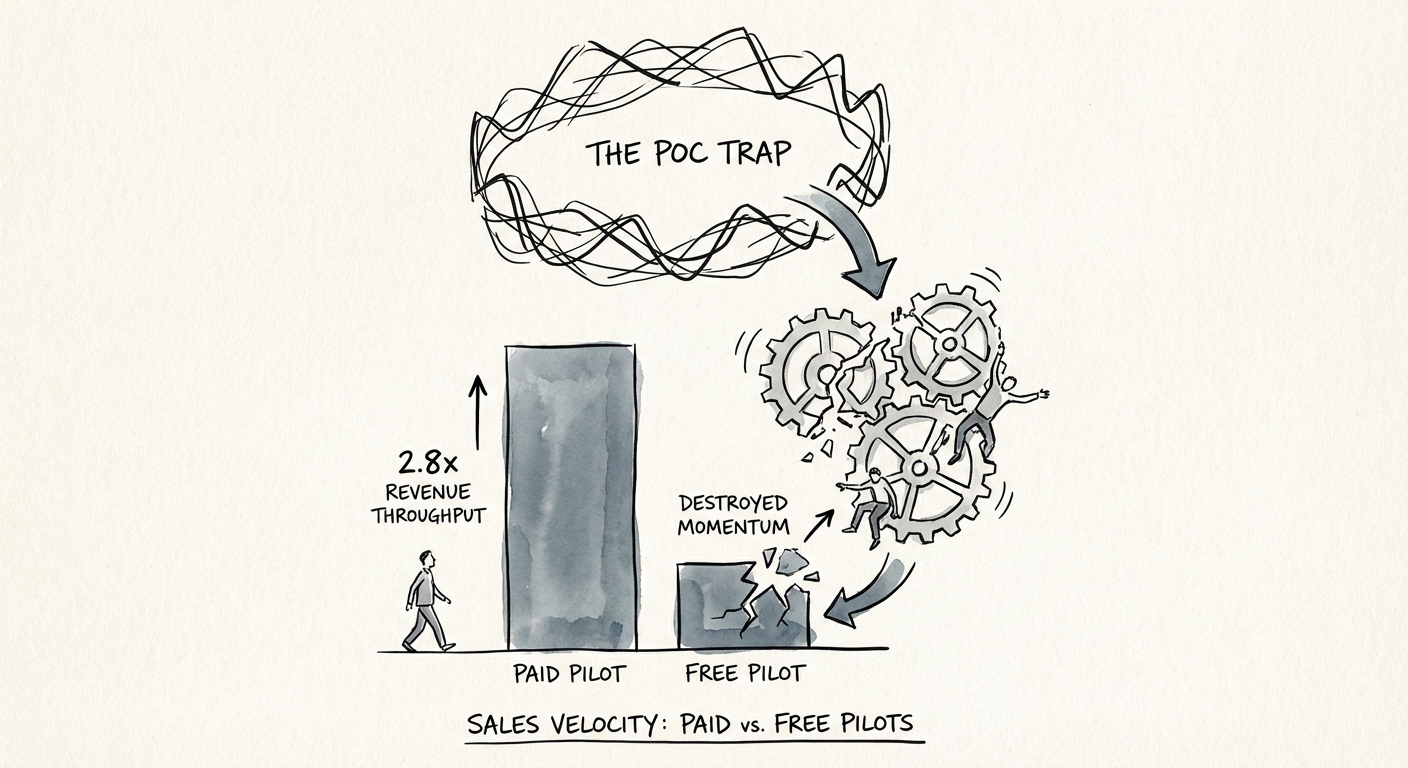
The POC Trap: When Free Pilots Destroy Sales Velocity
Free Proof of Concepts (POCs) reduce win rates by 40% and double sales cycle lengths. Here is the diagnostic to pivot from 'free pilots' to paid access.
80% Target POC Conversion Rate
BRIEF · EXIT READINESS
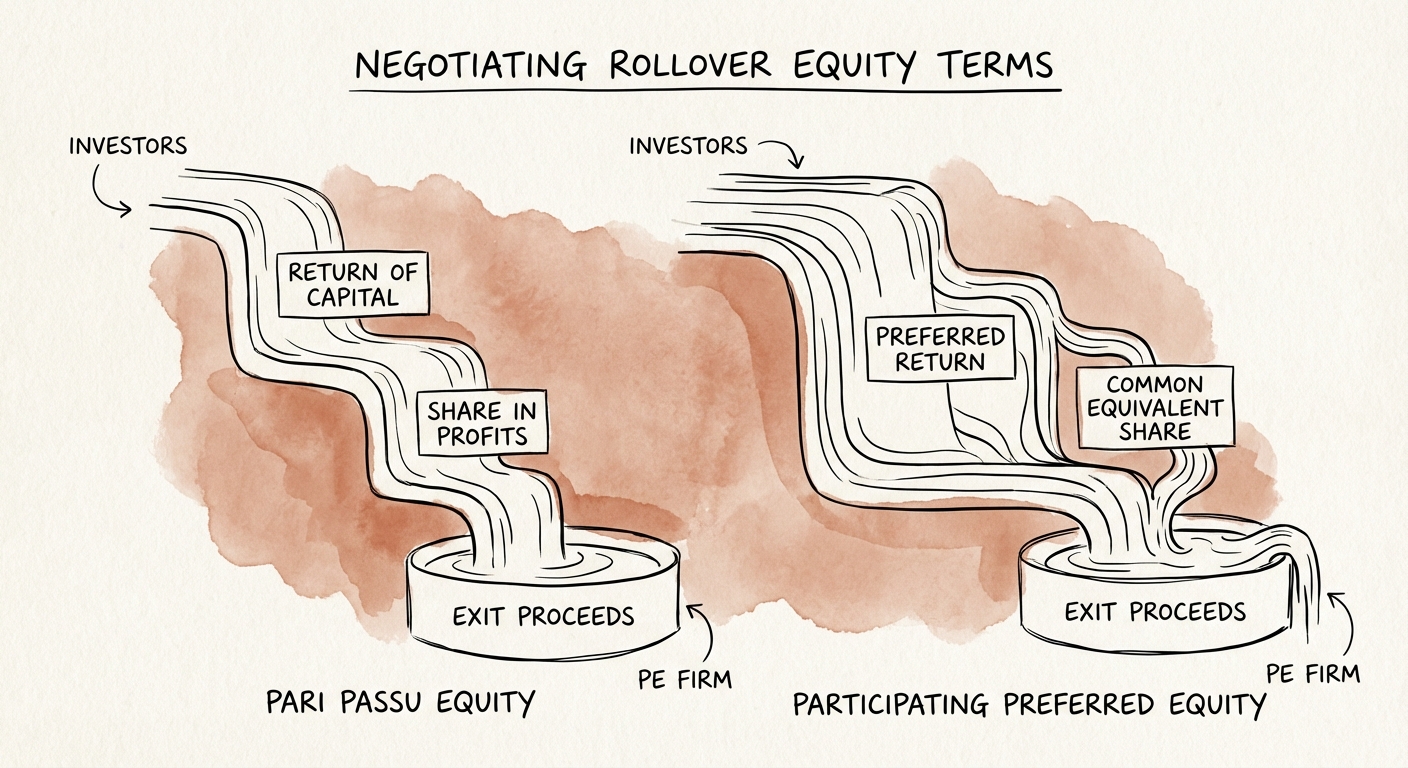
The Rollover Equity Trap: Negotiating the 'Second Bite' Without Getting Bitten
Founder's guide to negotiating rollover equity in PE acquisitions. Benchmarks for 2026, Section 721 vs 351 tax traps, and why 'Pari Passu' matters more than percentage.
20-40% Typical Founder Rollover Requirement
BRIEF · MIGRATION & INTEGRATION
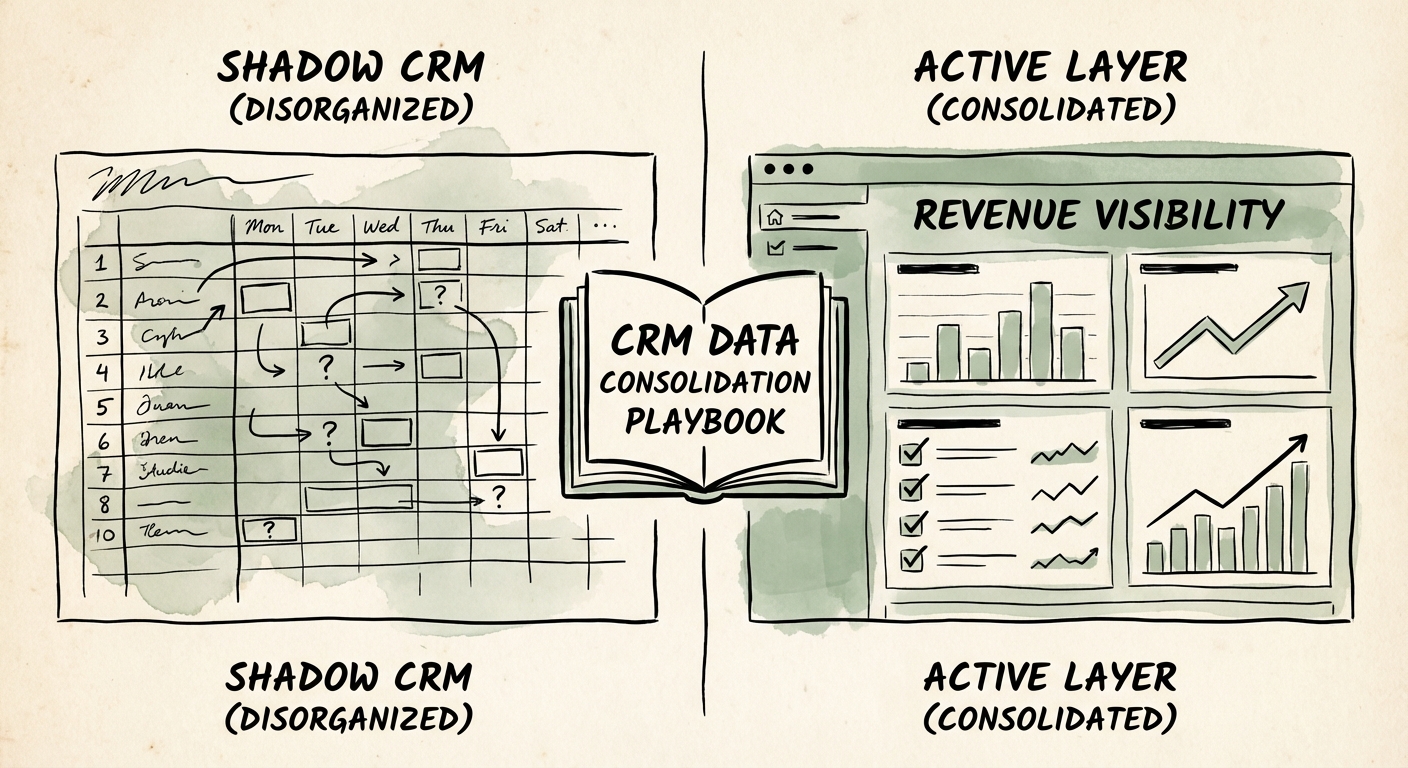
CRM Data Consolidation Playbook: Preventing the 22% Pipeline 'Dip' in Acquired Sales Teams
A diagnostic guide for PE sponsors and founders on merging CRM instances without destroying pipeline value. Learn the 'Active vs. Archive' framework and how to prevent the 22% post-acquisition deal-velocity dip. metric_label: Deal Velocity Drop During CRM Integration metric_value: 22%
BRIEF · TECHNICAL DEBT
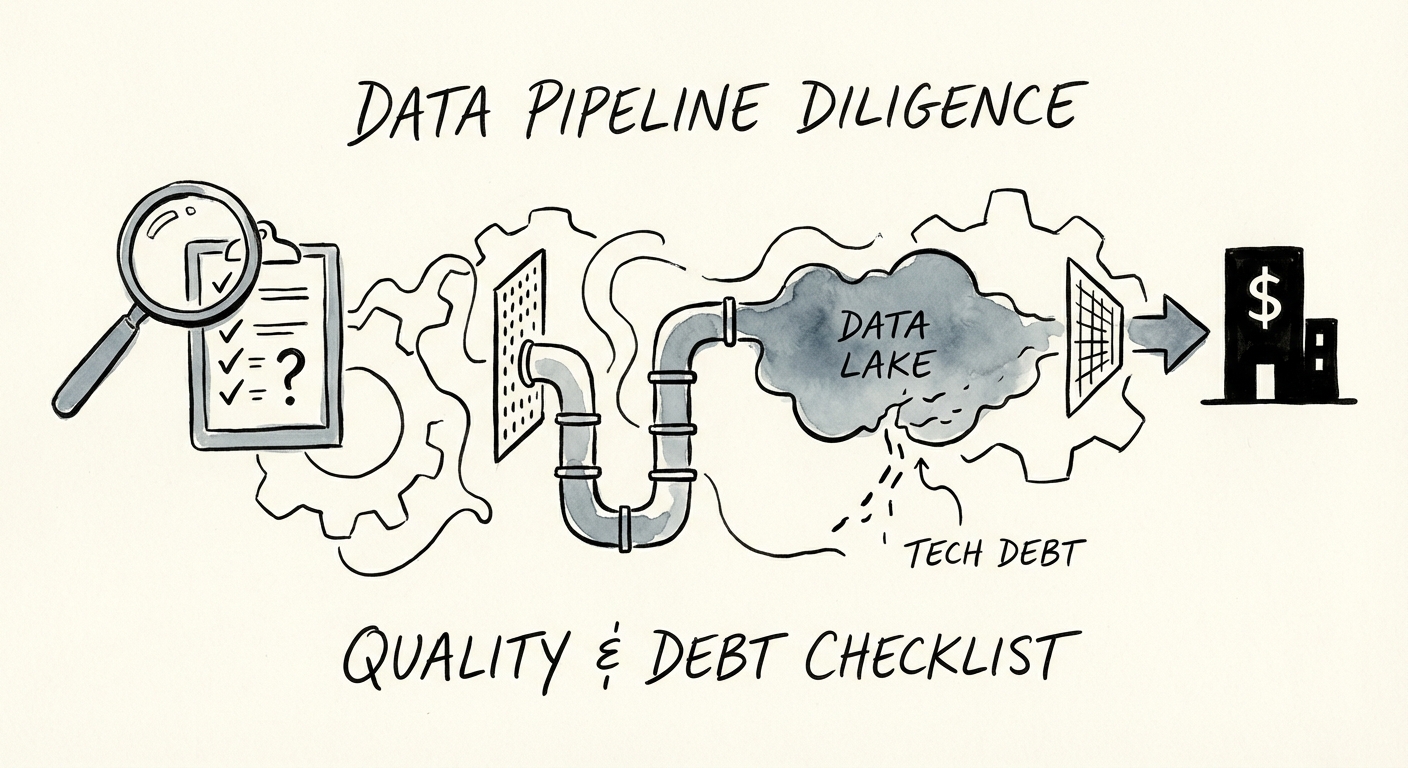
The 'Pipeline Premium': How to Evaluate Data Quality in Analytics Acquisitions
A private equity guide to auditing data pipelines in analytics acquisitions. Discover the 4 metrics that reveal hidden technical debt and how to quantify 'data downtime' in valuation.
$12.9M Average annual cost of poor data quality
BRIEF · TECHNICAL DEBT
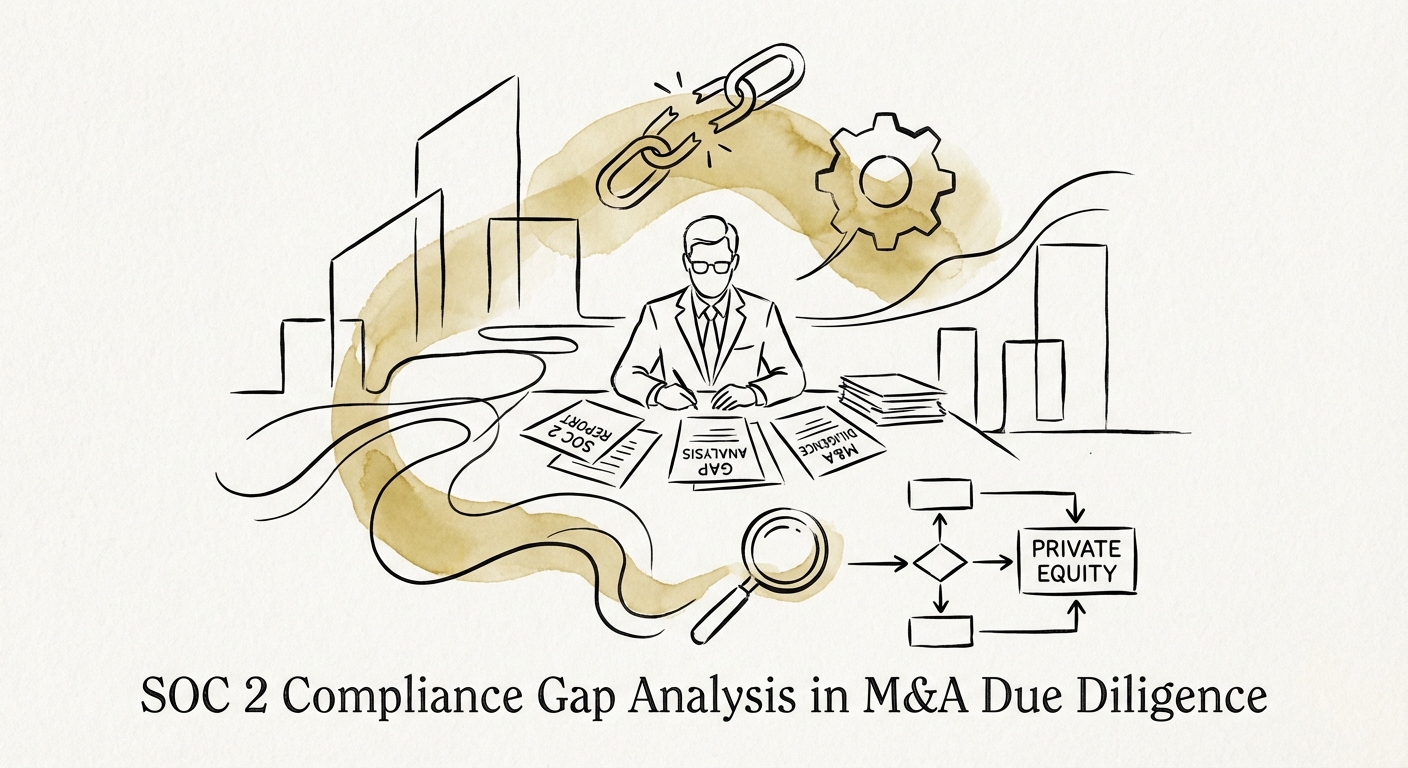
The 'Compliance Debt' Haircut: Why Missing SOC 2 is a $350k Liability
A guide for PE Operating Partners on identifying hidden SOC 2 compliance gaps during M&A due diligence. Learn the $350k valuation impact and how to spot 'paper tiger' security programs.
$350,000 Hidden Liability per Asset
BRIEF · EXIT READINESS
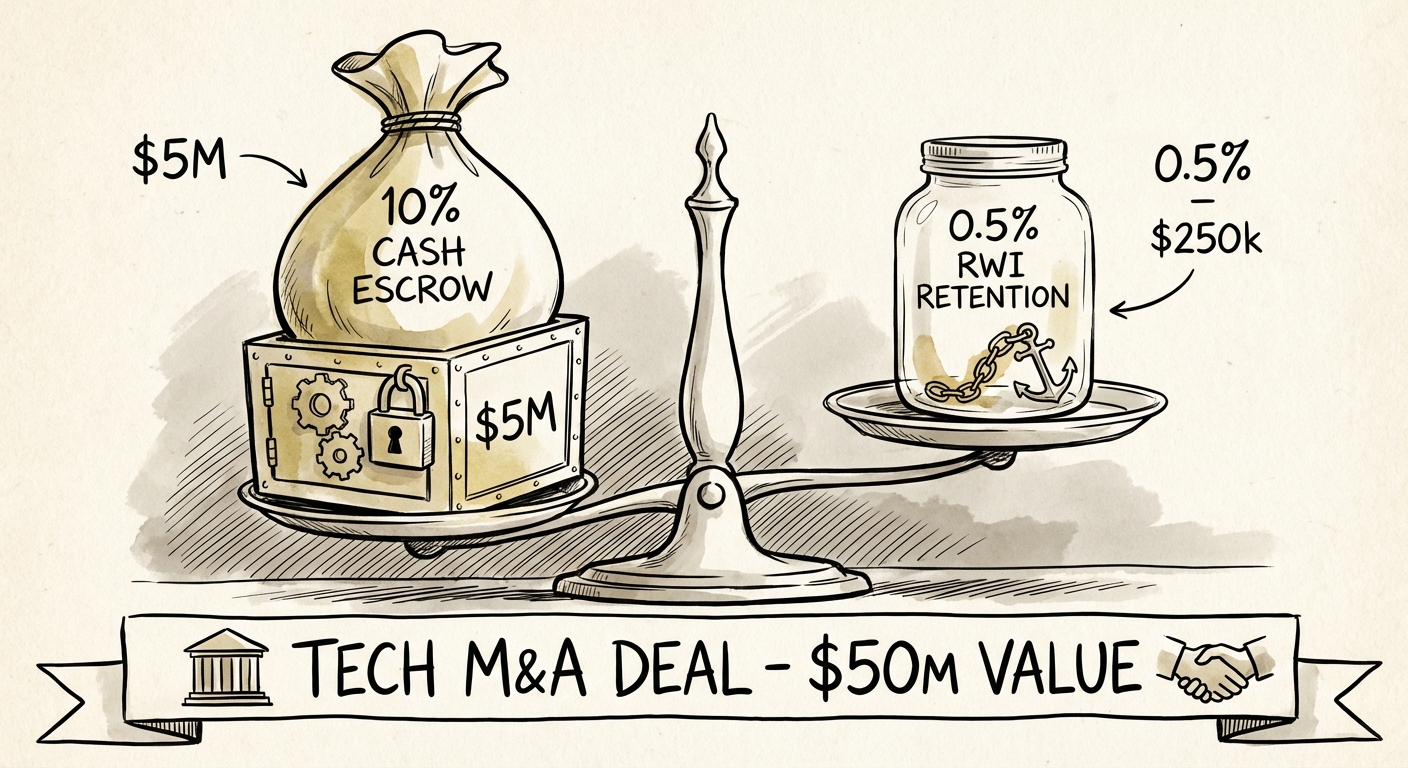
The 15-Month Trap: Why Your Exit Price is a Hallucination
Diagnostic guide on M&A escrow and holdback provisions. Learn why 15-month survival periods are the new norm and how R&W insurance can unlock 9.5% of your deal value.
15 Months Median Indemnity Survival Period (2025 Benchmark)
BRIEF · REVENUE ARCHITECTURE
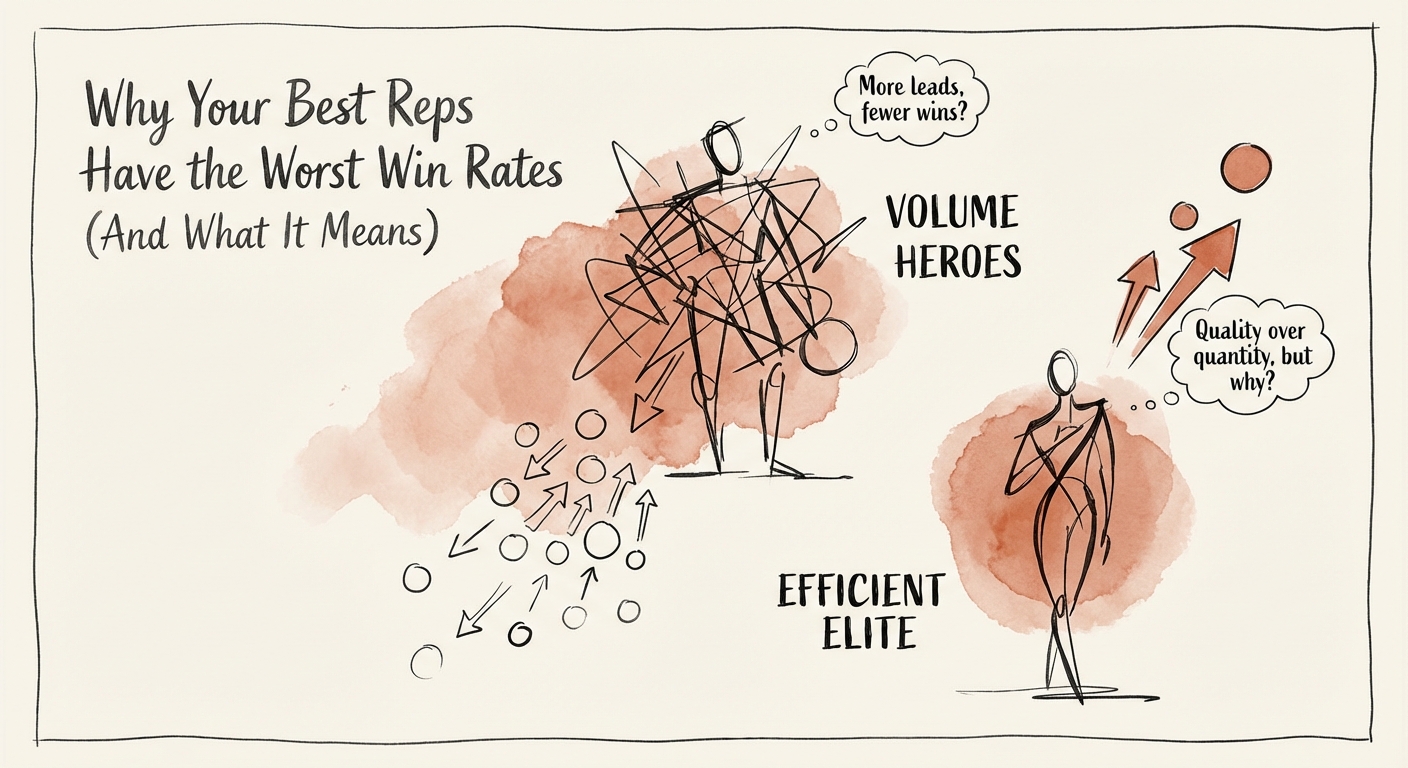
Why Your 'Best' Sales Reps Are Killing Your Unit Economics
Why your highest-revenue sales reps might have the worst win rates, and how this 'brute force' strategy destroys unit economics and CAC efficiency.
15% vs 35% Win Rate Gap (Volume Hero vs. Efficient Elite)
BRIEF · TECHNICAL DEBT
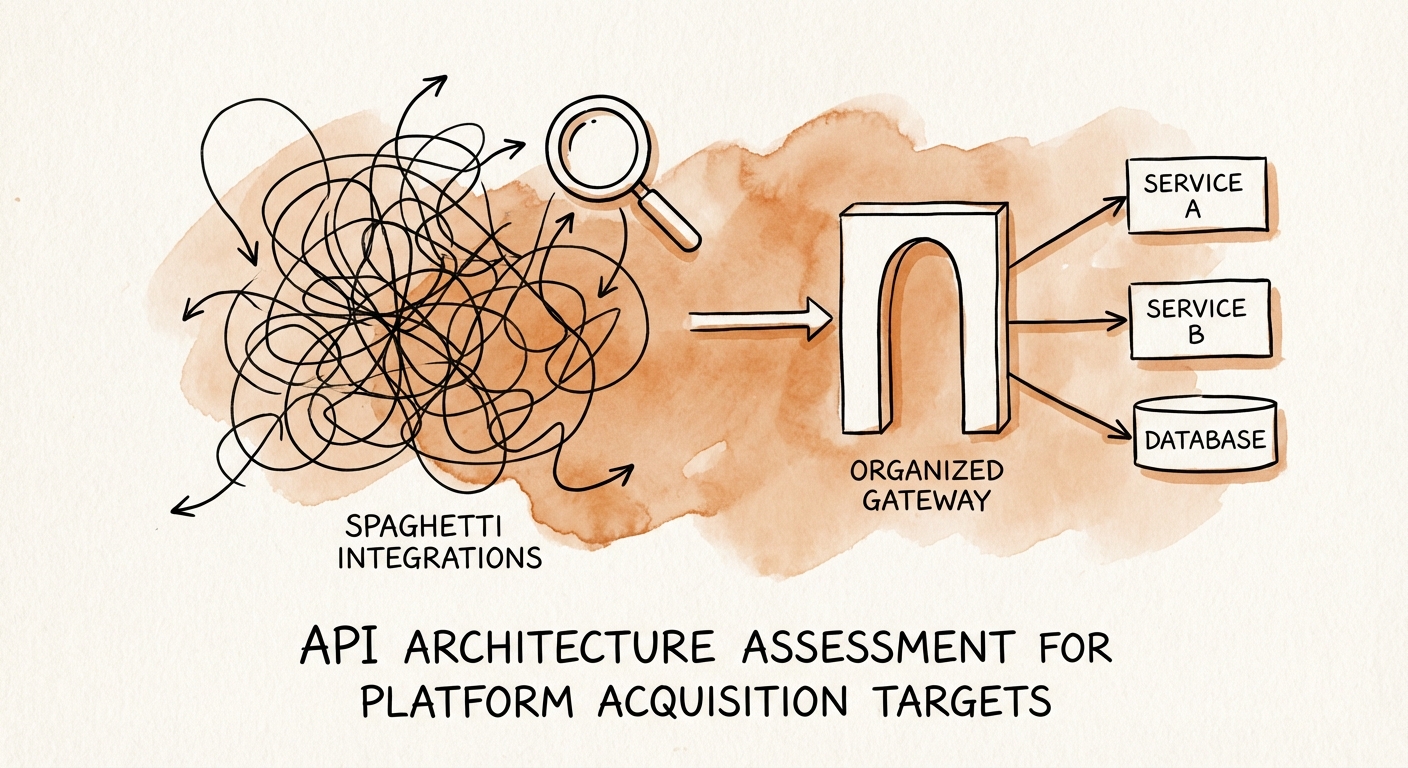
The API "Spaghetti Tax": Why Your "Platform" Acquisition Is Just a Monolith in Disguise
Poor API architecture creates a $150k/year 'Integration Tax' per connection. Learn the 5-point diagnostic to assess platform scalability and protect deal value.
$150,000 Annual "Integration Tax" per custom connection for targets without standardized API architecture
BRIEF · PROCESS DOCUMENTATION
Synergy Tracking Dashboard Design for Technology Acquisitions
Stop 'synergy leakage' in technology acquisitions. A diagnostic guide for PE operating partners on designing dashboards that track value, not just activity.
30% Typical Synergy Leakage Without Real-Time Tracking
BRIEF · GTM EXECUTION
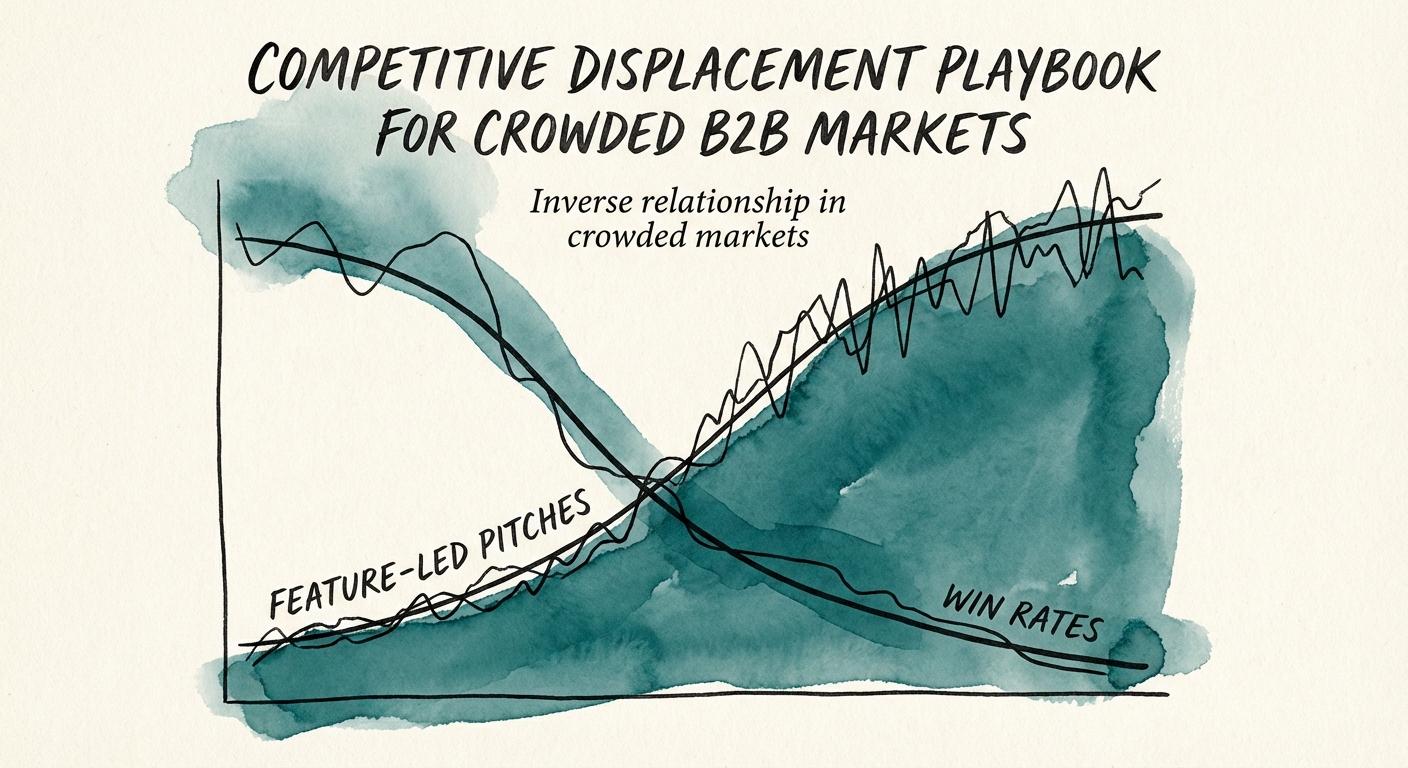
The 'Wedge' vs. The 'Wrapper': A Competitive Displacement Playbook for Crowded B2B Markets
Stop pitching features against incumbents. Use the 'Wedge Strategy' to exploit technical debt, pricing fatigue, and support cliffs. A guide for B2B founders.
35% Win Rate Improvement Using Displacement vs. Net-New Strategies
BRIEF · EXIT READINESS
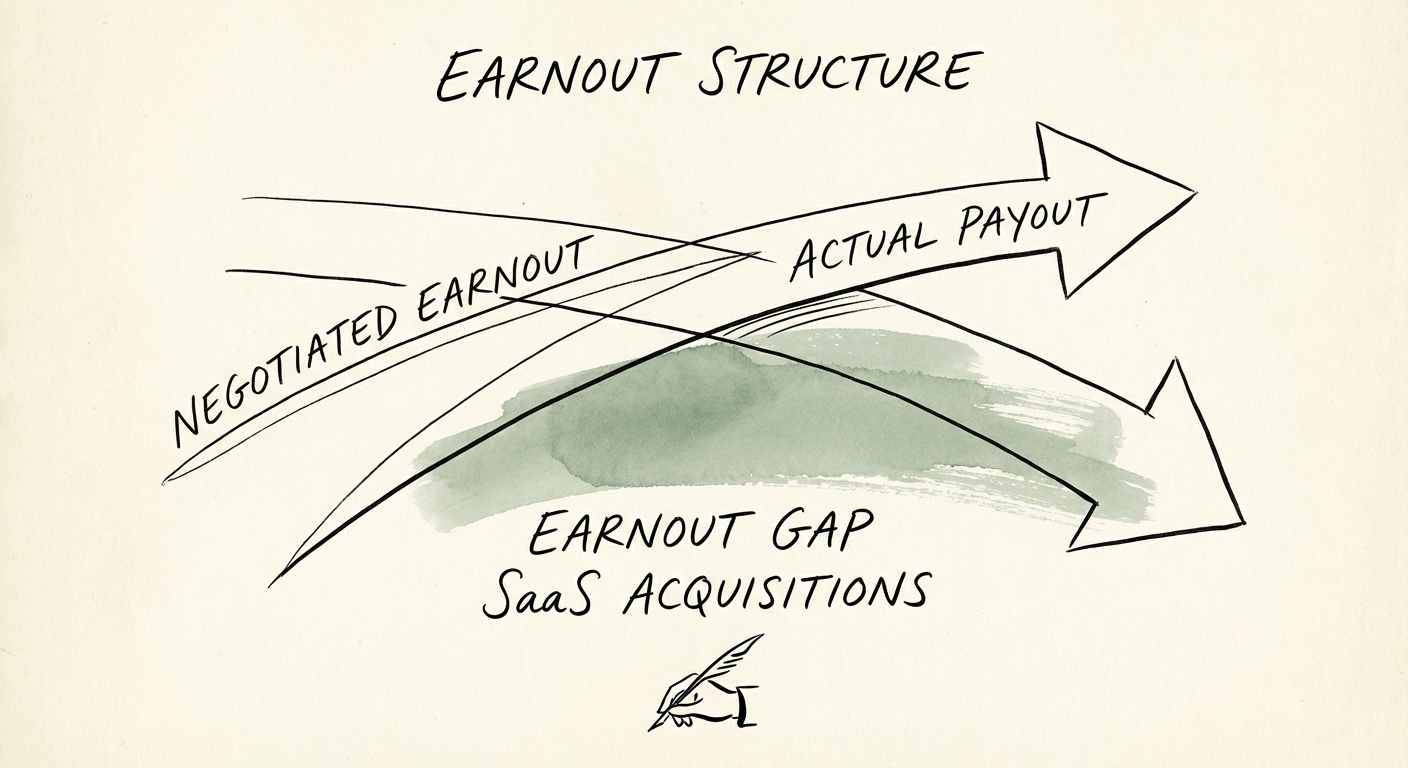
The 21-Cent Dollar: Designing SaaS Earnouts That Actually Pay Out
Earnouts are bridging the valuation gap in 33% of SaaS deals, but the average payout is just 21 cents on the dollar. Here is how to design a structure that actually pays.
$0.21 Avg. Payout Per Earnout Dollar
BRIEF · PROCESS DOCUMENTATION
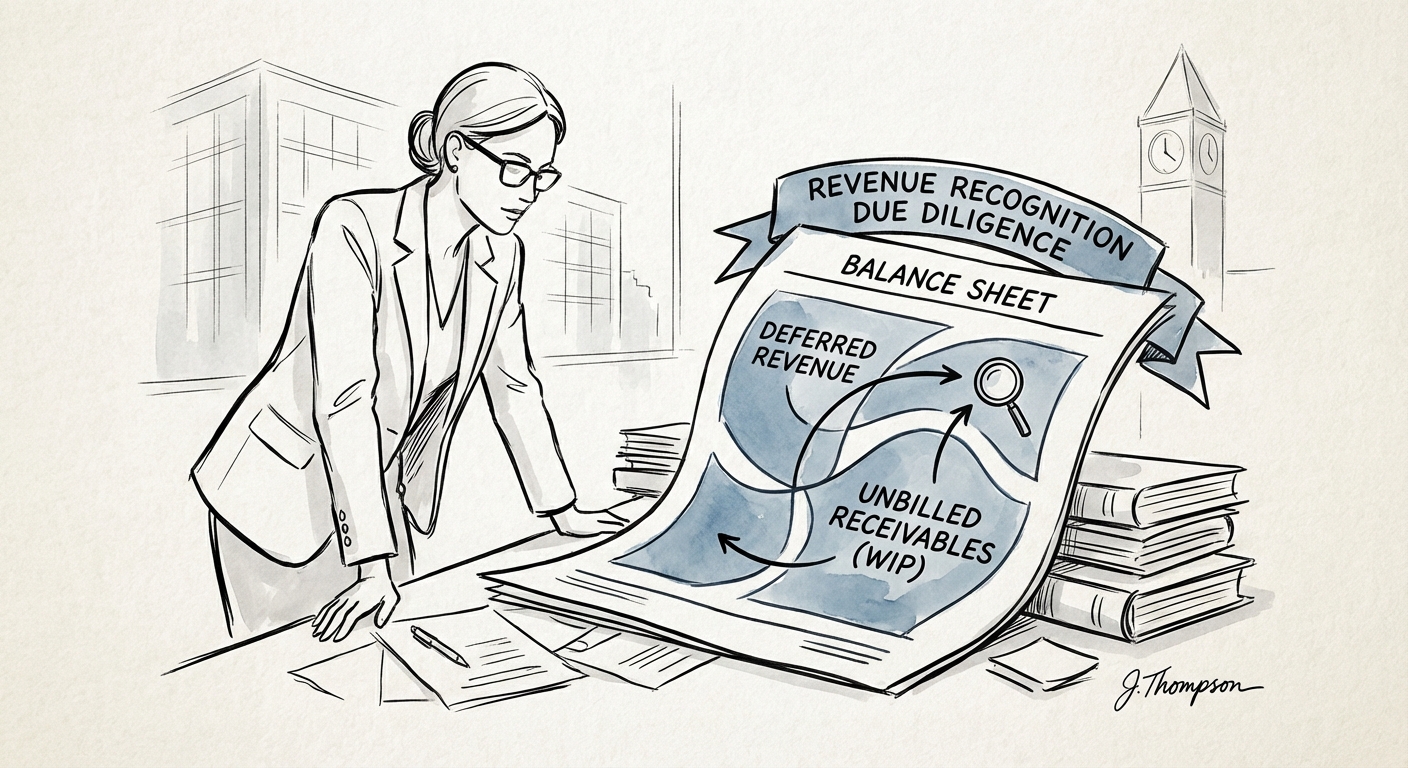
Revenue Recognition Due Diligence in Professional Services: The 'WIP Trap' That Inflates EBITDA
Why 22% of professional services EBITDA evaporates in due diligence. A diagnostic guide to ASC 606, WIP traps, and input method failures for PE sponsors.
22% Average EBITDA reduction in services QofE due to revenue adjustments
BRIEF · MIGRATION & INTEGRATION
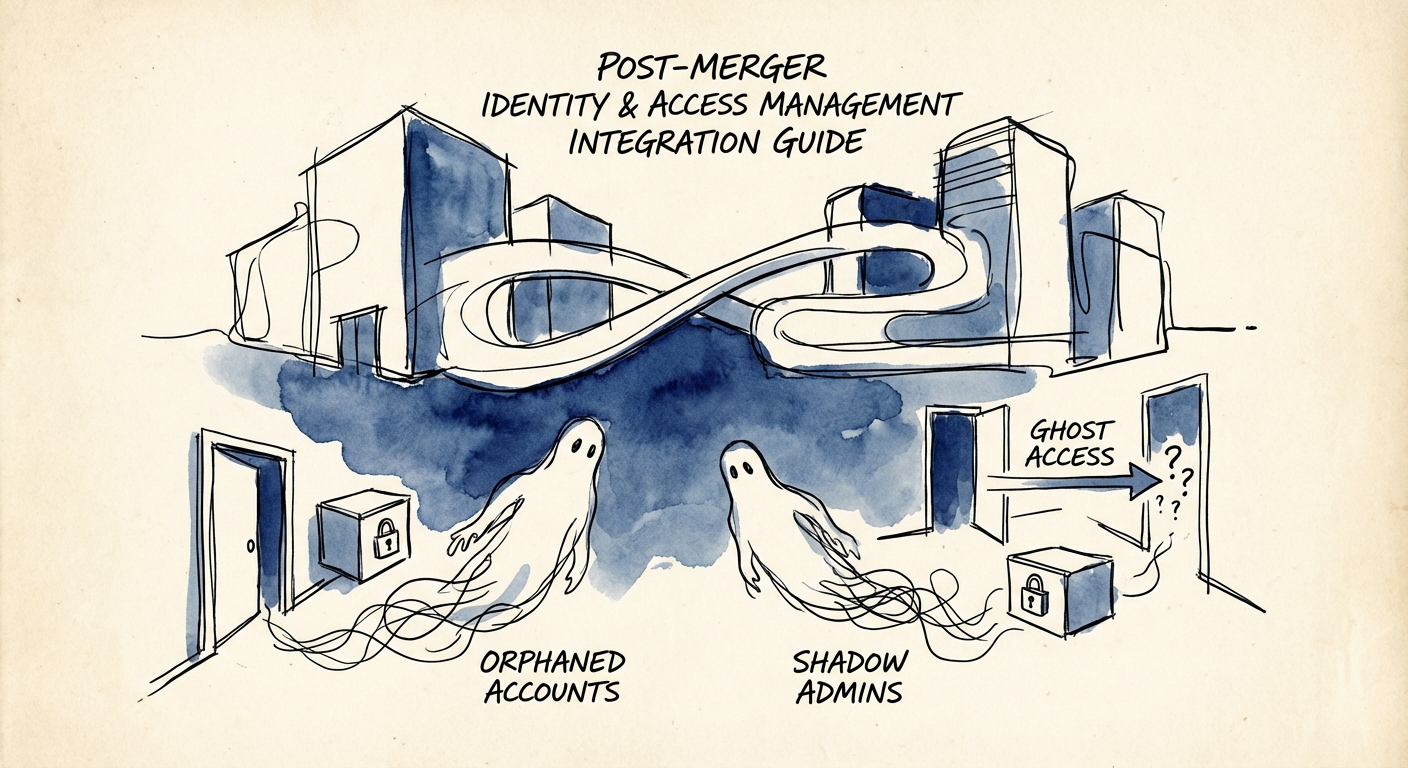
Post-Merger Identity and Access Management Integration Guide: The 'Ghost Access' Risk
33% of firms experience data breaches during M&A integration. This guide outlines the Post-Merger Identity and Access Management (IAM) roadmap to prevent 'Ghost Access' and secure deal value.
33% of firms experience data breaches specifically attributed to M&A integration activity
BRIEF · REVENUE ARCHITECTURE
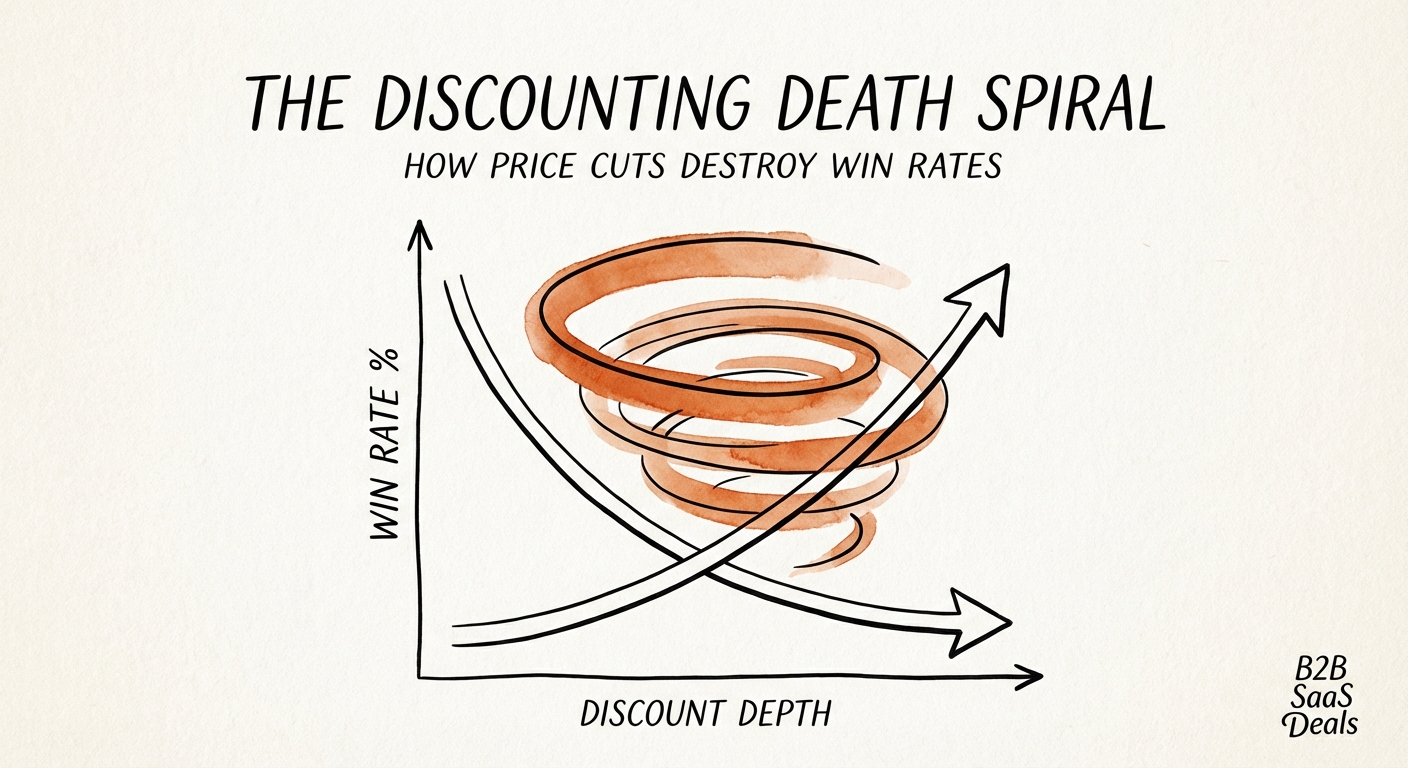
The Discounting Death Spiral: How Price Cuts Destroy Win Rates
New 2026 data reveals a counter-intuitive truth: deals with higher discounts have lower win rates. Here is the diagnostic guide for PE sponsors to stop the margin bleed.
11.1% Profit Lift from 1% Price Increase
BRIEF · MIGRATION & INTEGRATION
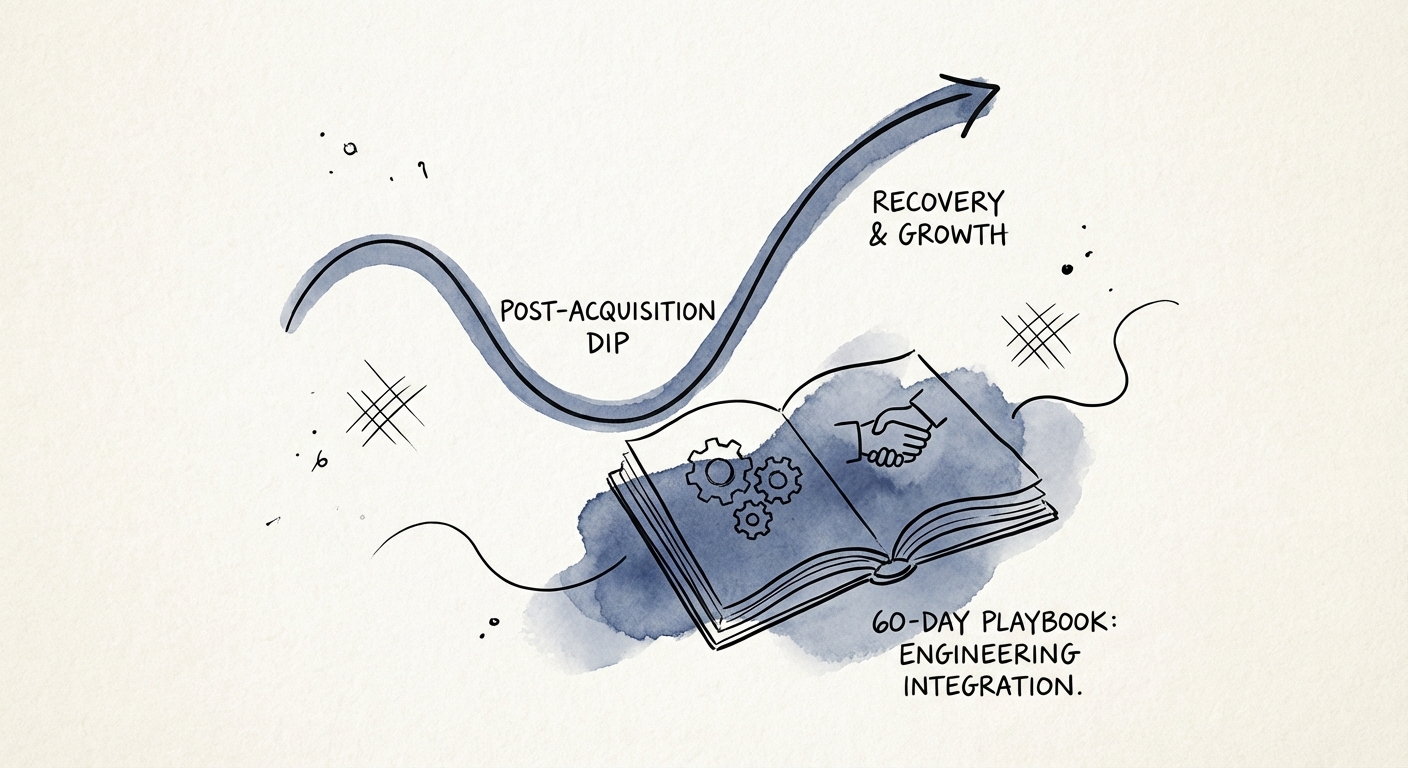
The Velocity Tax: A 60-Day Engineering Team Integration Playbook to Prevent the 30% Productivity Drop
Acquired engineering teams often face a 30% productivity drop post-close. Use this 60-day diagnostic playbook to stabilize talent, map dependencies, and prevent the 'Velocity Tax' that kills deal value.
30% Avg. Velocity Drop Post-Close