BRIEF · FINANCIAL INFRASTRUCTURE
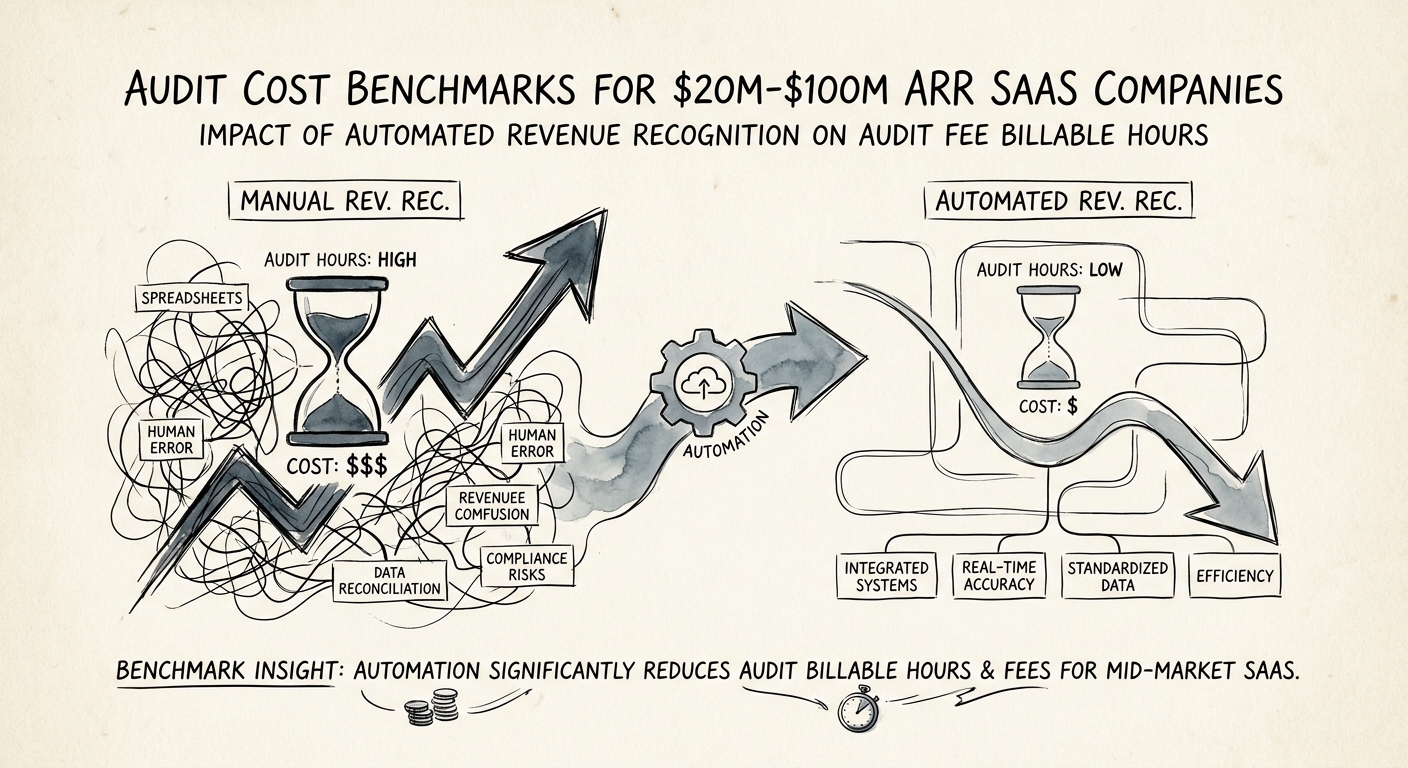
The 40% Surcharge: Audit Cost Benchmarks for $20M-$100M SaaS Companies
Audit cost benchmarks for private SaaS companies between $20M and $100M ARR. Learn why the 'mess tax' inflates audit fees and how to cut costs by 30%.
40% Audit Fee "Mess Tax" Surcharge
BRIEF · REVENUE ARCHITECTURE
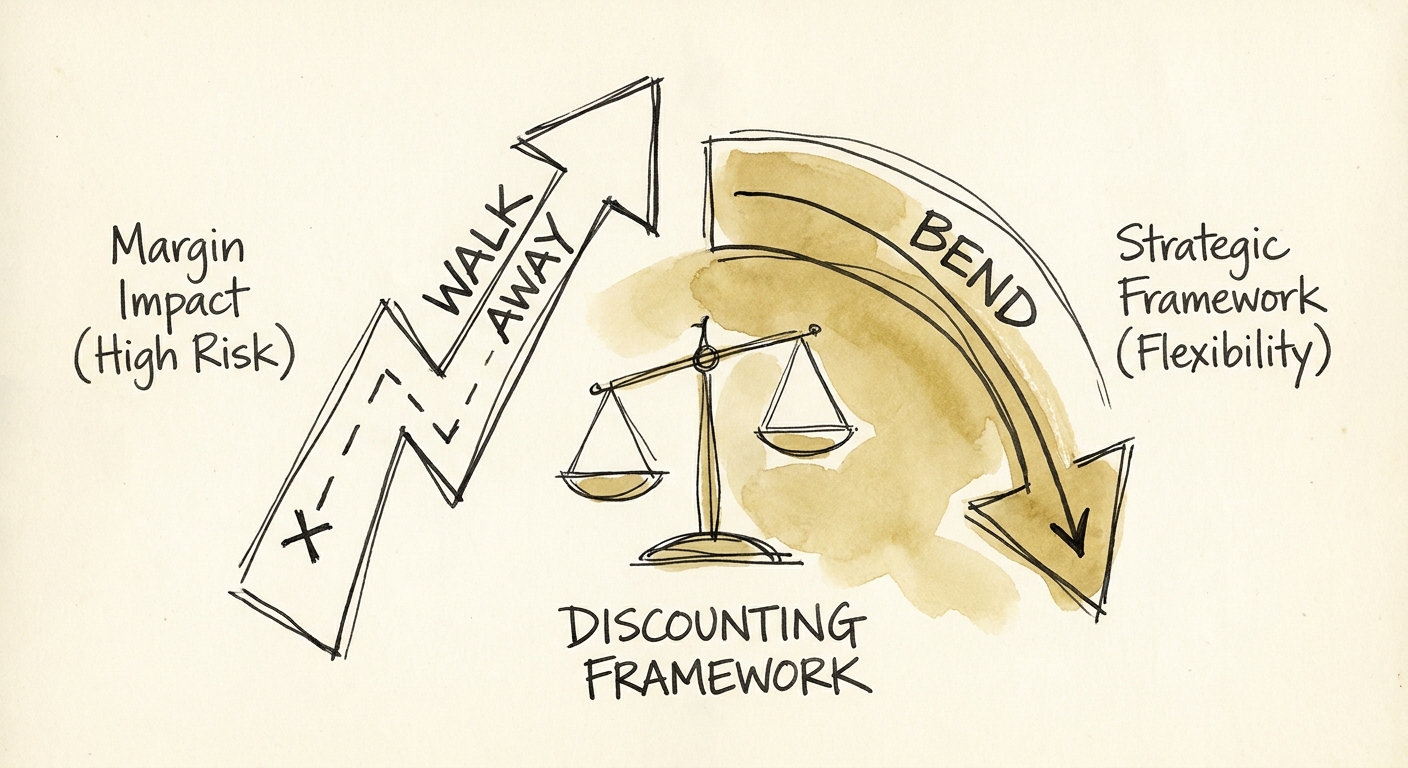
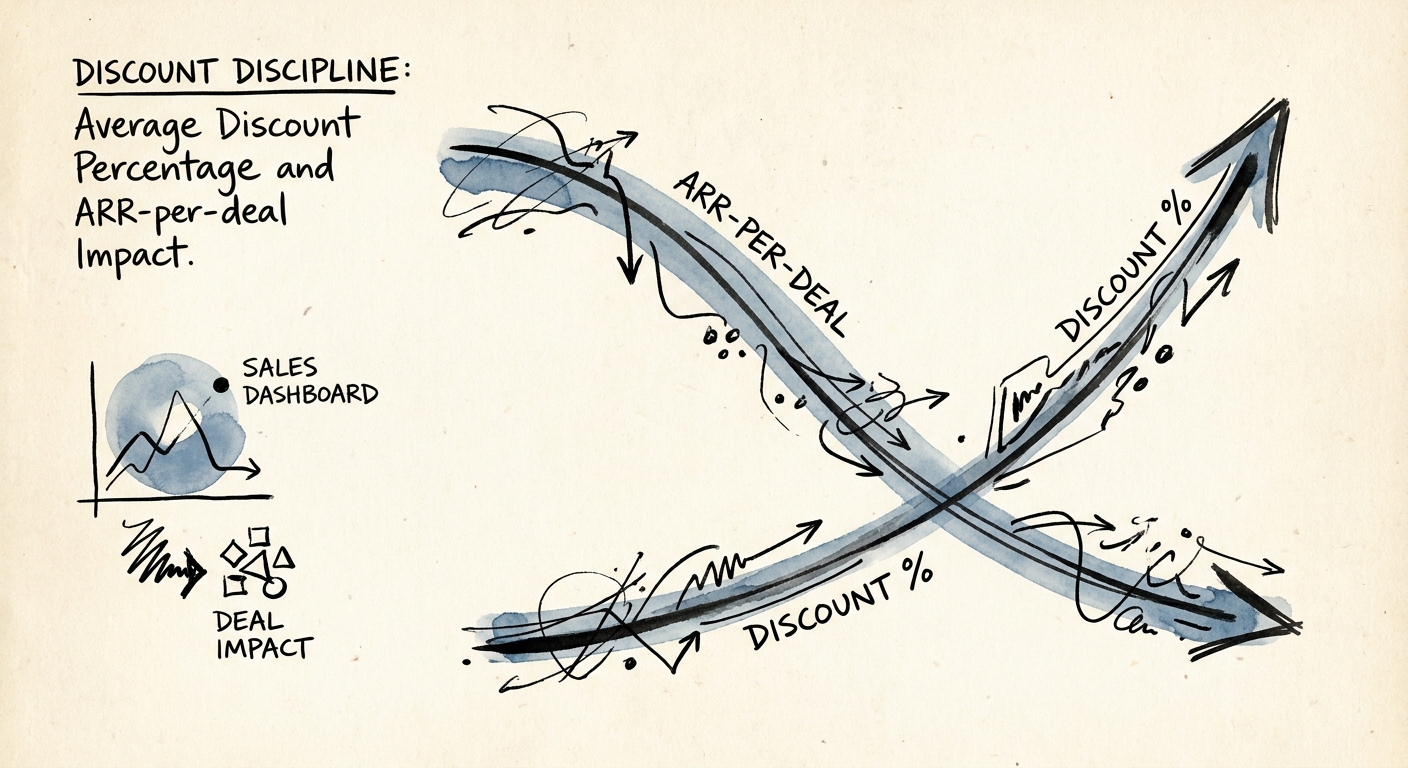
The B2B SaaS Discount Decision: Walk Away, or Trade the Price for Terms
A Series C SaaS firm gave away 20% to close by Friday and torched its margin. Here's the line between a discount that builds value and one that bleeds it.
38% EBITDA Margin Erosion from a 15% Unreciprocated Discount
BRIEF · GTM EXECUTION
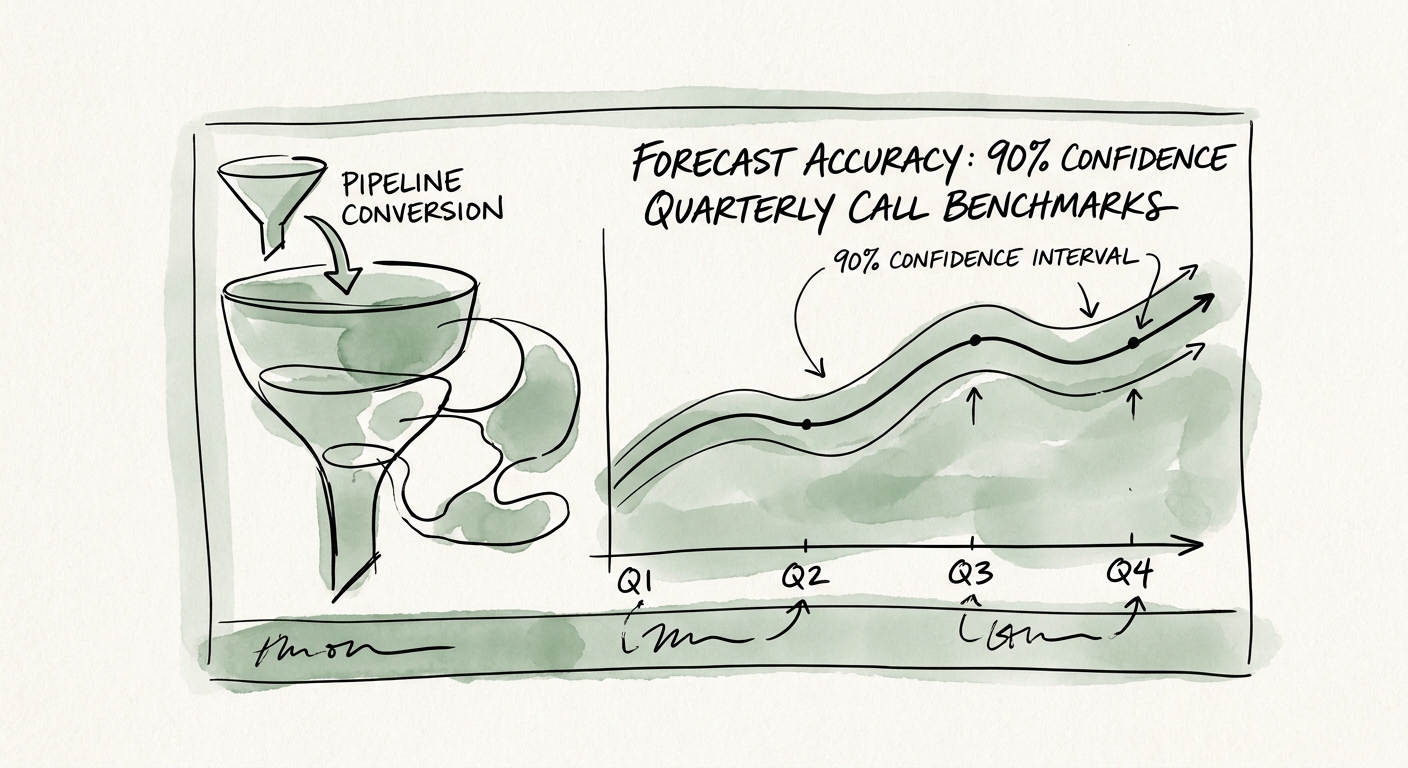
The 90% Confidence Forecast: How to Survive a B2B SaaS Quarterly Board Call
Two missed quarters can cost a SaaS company a double-digit valuation haircut. Here is the 90% confidence forecast a PE operating partner expects on the board call.
18% Valuation Haircut for Consecutive Misses
BRIEF · REVENUE ARCHITECTURE
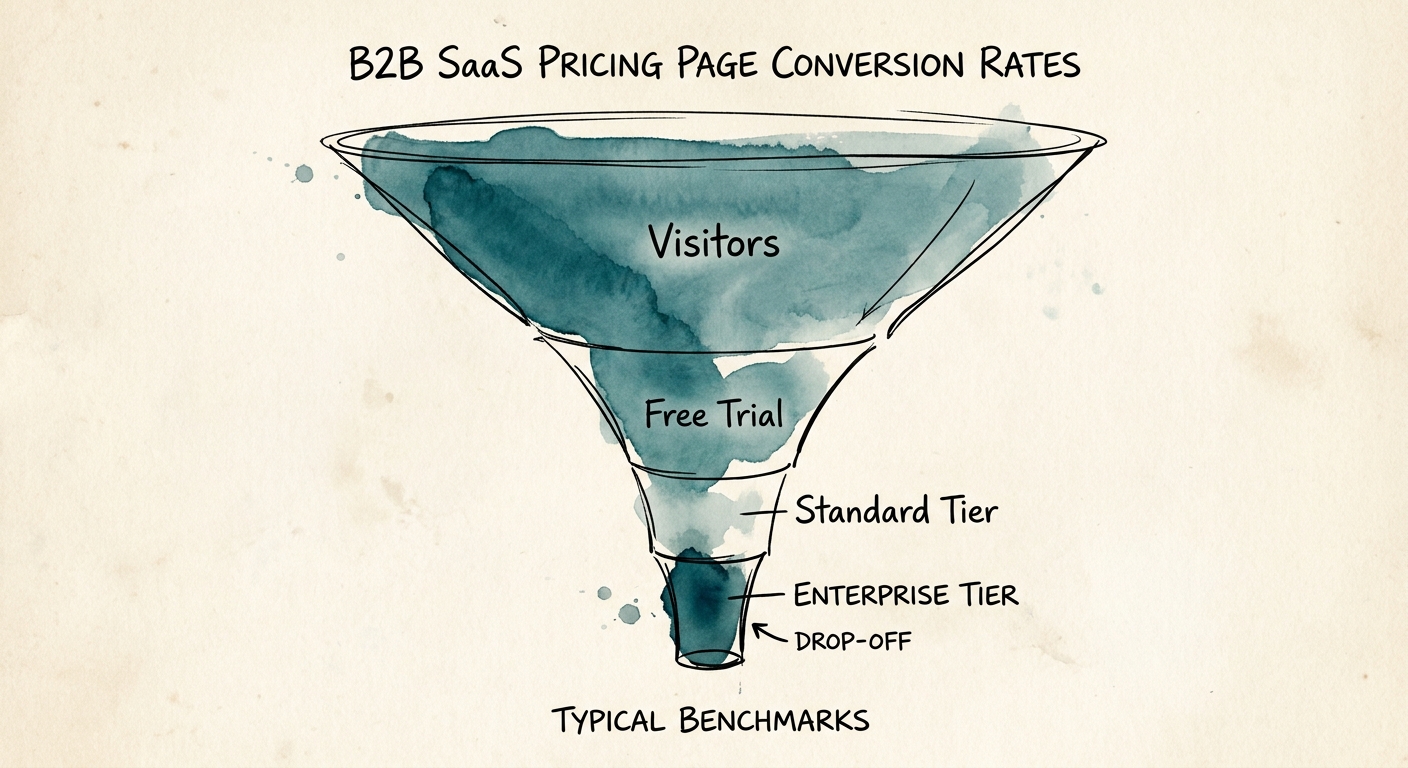
Pricing Page Conversion Benchmarks: The Multi-Million Dollar Leak in Your Revenue Funnel
73% of highly qualified B2B pipeline abandons the pricing page. Discover accurate pricing conversion benchmarks and the architectural fixes that drive 12% conversion rates.
4-8% Typical Pricing Page Visitor-to-Lead Conversion Rate in Mid-Market SaaS
BRIEF · GTM EXECUTION
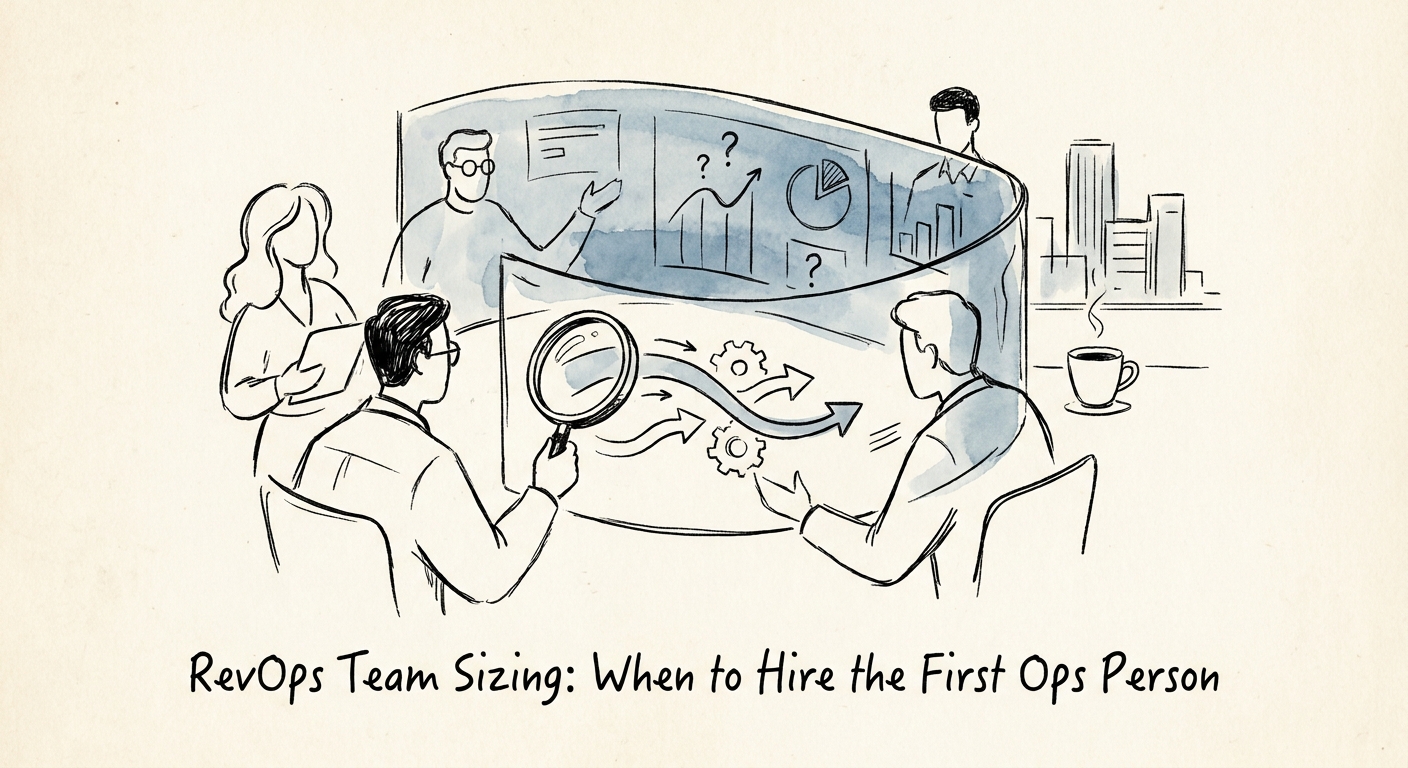
Stop Counting ARR: Hire RevOps at Rep Number Eight
Your first RevOps hire isn't triggered by $10M ARR -- it's headcount. The rep count where forecasts break, and the reporting line that makes the hire work.
28% Time B2B sales reps spend actually selling
BRIEF · FINANCIAL INFRASTRUCTURE
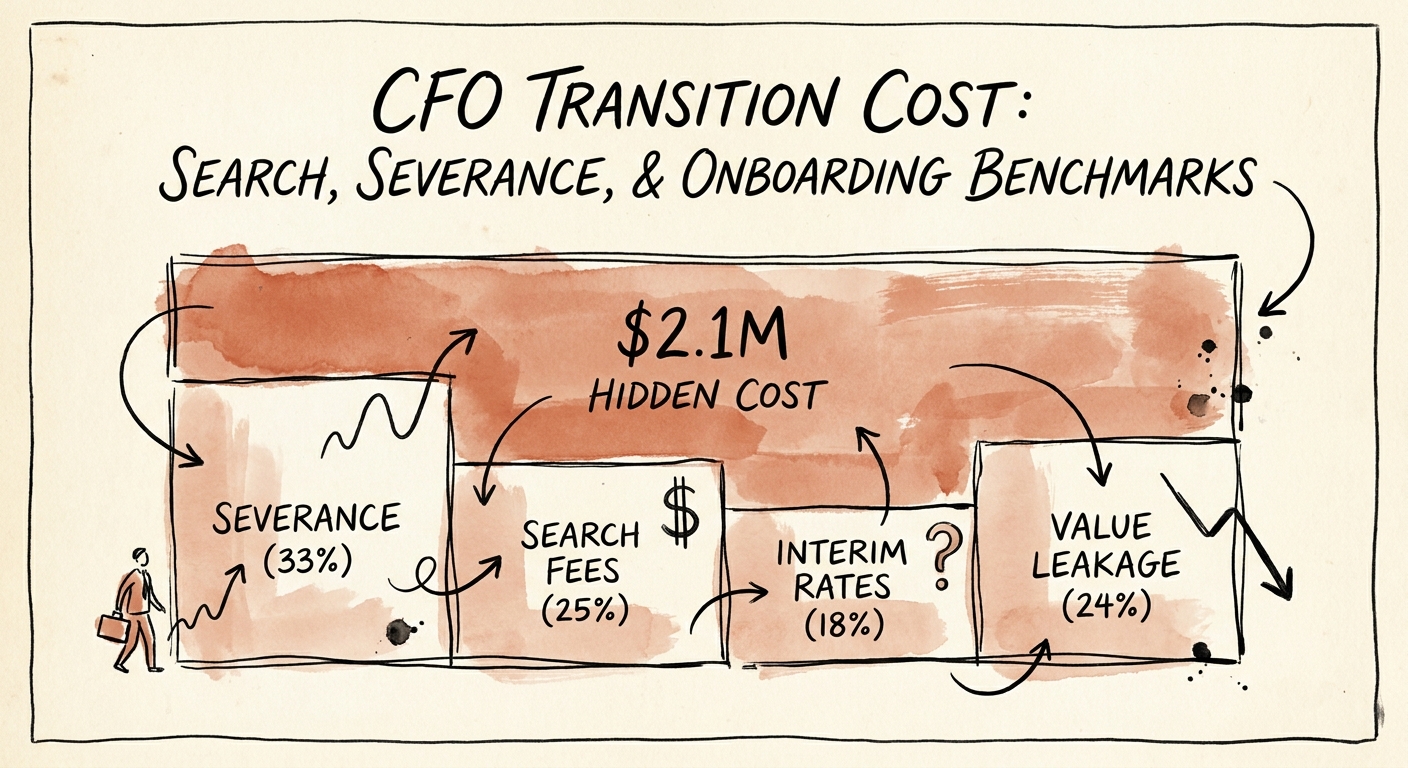
What a Mid-Hold CFO Swap Actually Costs: The $2.1M Most Sponsors Never Model
Replacing a PE portfolio CFO mid-hold runs ~$750K in cash and a $2.1M EV tax. The severance, search, and interim day-rate math sponsors skip until it's too late.
$2.1M Hidden Enterprise Value Tax per CFO Transition
BRIEF · GTM EXECUTION
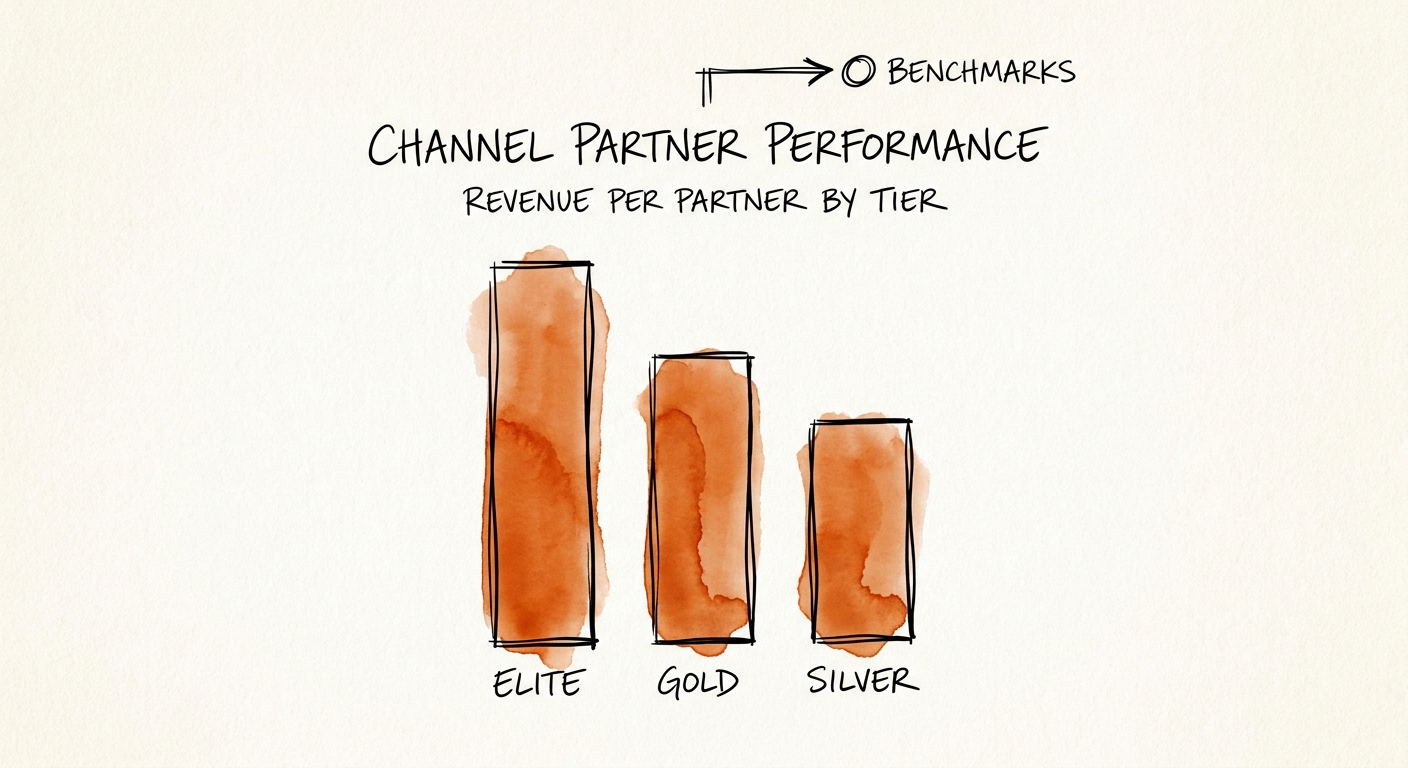
Channel Partner Benchmarks: What Revenue Per Tier Actually Tells You
Most channel rosters hide a tier that costs more to serve than it earns. Here is how to read revenue-per-partner by tier and find the margin underneath.
42% of channel GTM budget drained by long-tail partners returning less than 9% of total revenue
BRIEF · PROCESS DOCUMENTATION
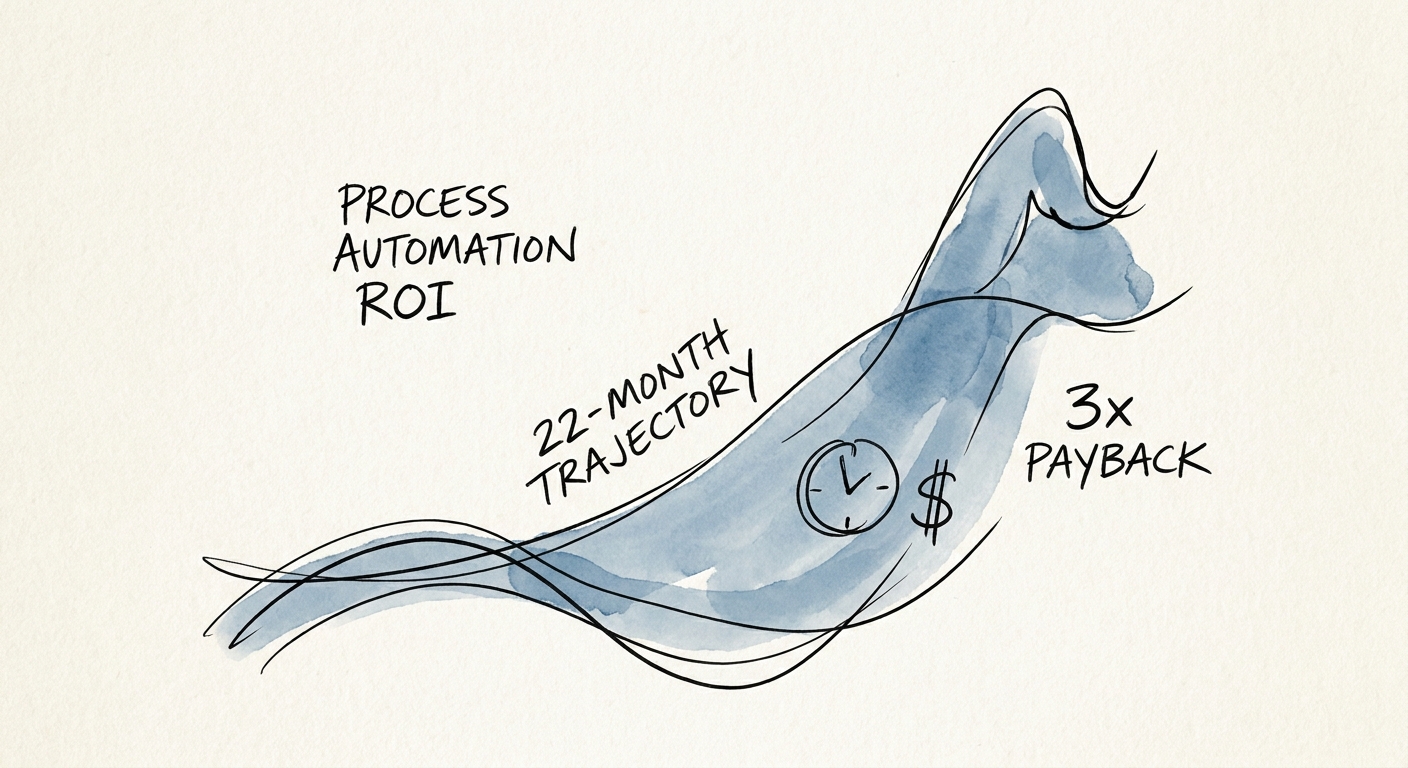
The 22-Month Reality: Why Your Process Automation ROI is Hallucinating
Discover why 50% of process automation initiatives fail to deliver a 3x ROI. A data-backed diagnostic on documentation, payback timelines, and PE exit readiness.
22 Months median payback period for undocumented enterprise automation
BRIEF · PROCESS DOCUMENTATION
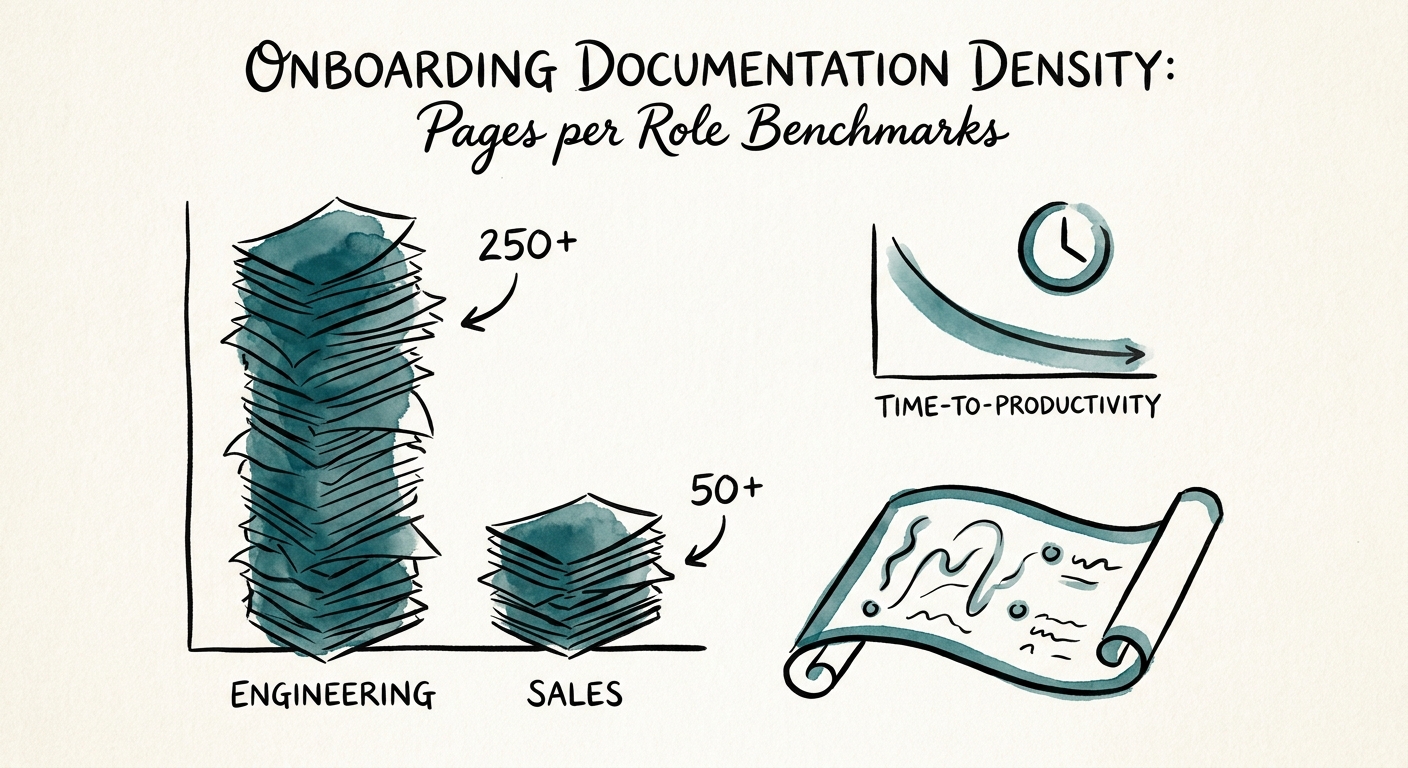
Onboarding Documentation Density: The Pages-Per-Role Diagnostic
Discover why excess onboarding documentation destroys time-to-productivity. Learn the 2026 pages-per-role benchmarks to accelerate ramp times and integration.
3.4 Days delayed in time-to-first-value per 10 pages of unstructured onboarding docs
BRIEF · GTM EXECUTION
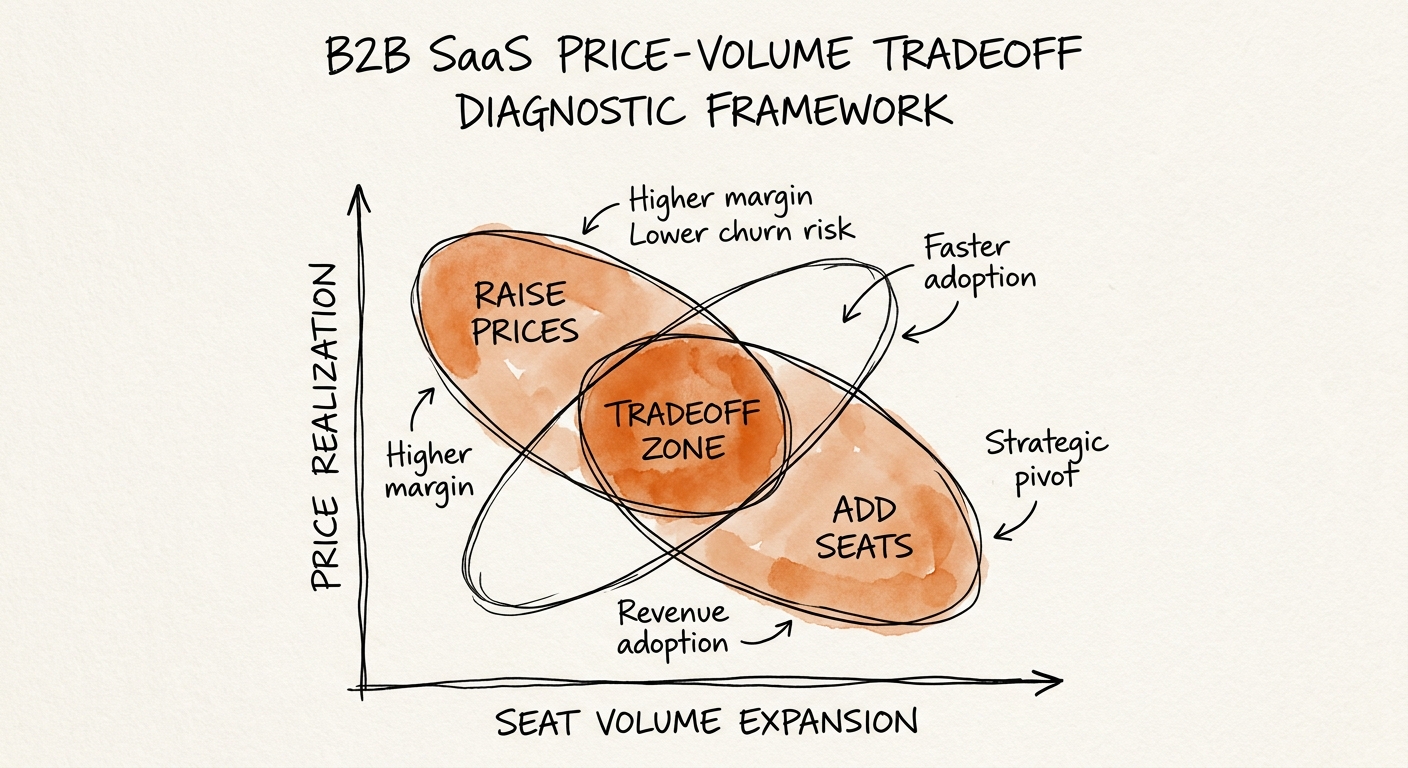
The Price-Volume Tradeoff: Why Discounting Seats is Killing Your B2B Valuation
Founders lose 28% of enterprise deal value to volume discounts. Discover the diagnostic framework for the price-volume tradeoff in B2B SaaS and know when to raise prices.
28% Enterprise deal value sacrificed to seat volume discounts
BRIEF · PROCESS DOCUMENTATION
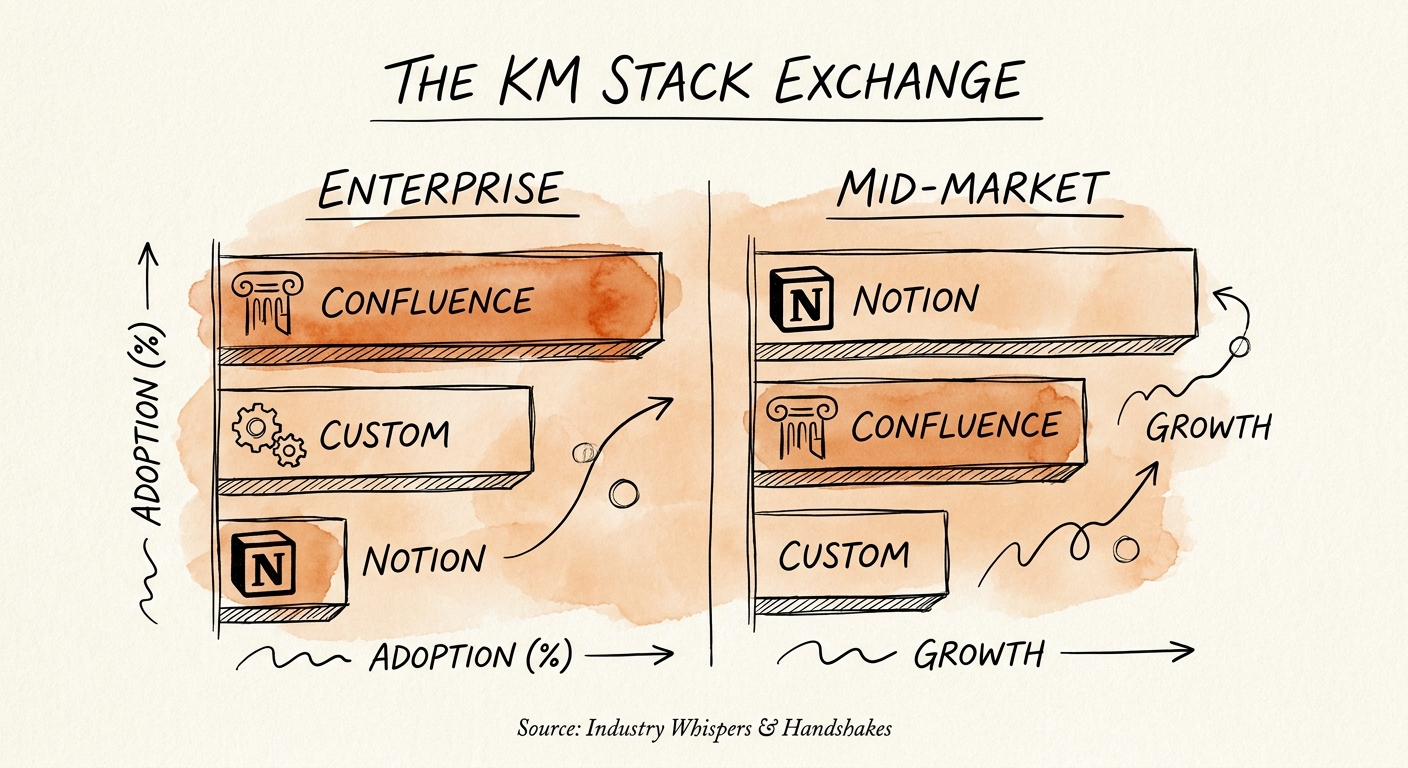
Confluence vs Notion vs Docs-as-Code: The Knowledge Stack Decision That Shows Up in Diligence
A B2B SaaS operator's framework for choosing between Confluence, Notion, and a custom Docs-as-Code stack at the $15-30M ARR inflection, and why it surfaces in diligence.
20% of a knowledge worker's week is wasted searching for information
BRIEF · FINANCIAL INFRASTRUCTURE
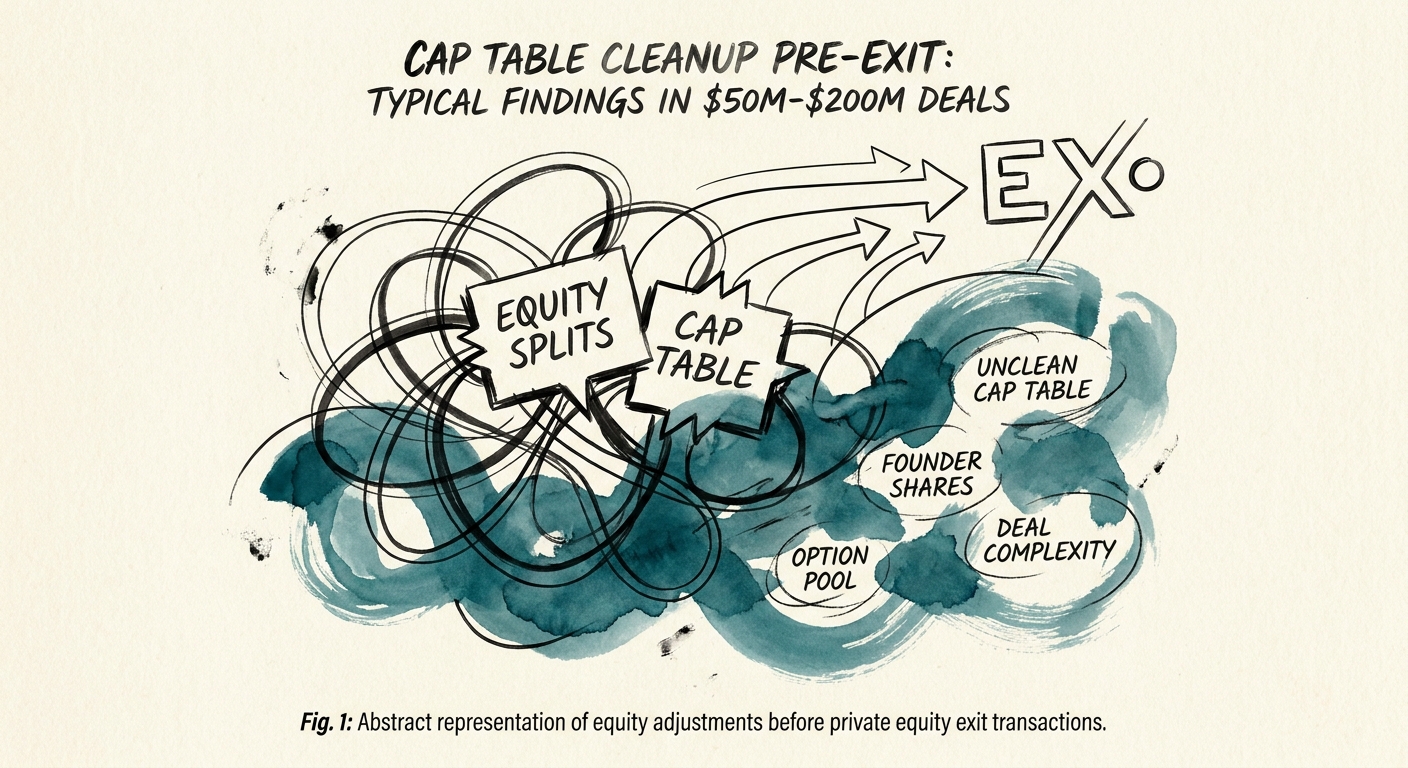
The 4.2% Bleed: What a Buyer's Lawyer Finds in Your Cap Table First
A forgotten SAFE conversion or a missing 83(b) can cost you 4.2% of enterprise value at exit. Here is exactly what diligence counsel finds and how to fix it first.
4.2% Average EV bleed from cap table discrepancies
BRIEF · GTM EXECUTION
The Friday Discount That Costs You $18M at Exit
A 24.8% average discount cost one SaaS company $18M in enterprise value. Here is exactly how a PE buyer's QofE team finds it in your CRM data.
8.7% Operating profit increase per 1% pricing improvement
BRIEF · FINANCIAL INFRASTRUCTURE
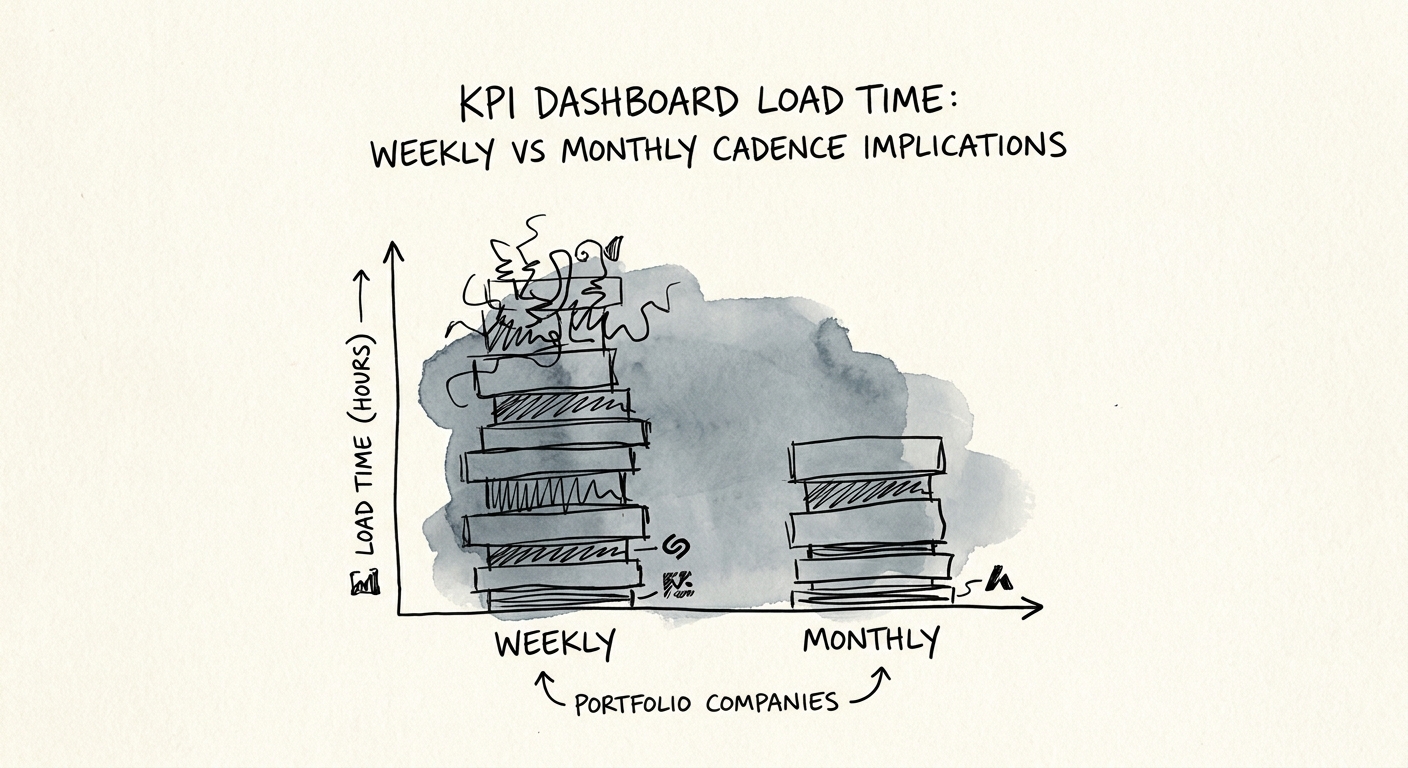
If Your Dashboard Takes 38 Hours to Build, You Don't Have a Weekly Cadence
A $45M SaaS carve-out's "weekly" flash report took 38 hours to compile. Why dashboard build time, not your calendar, decides whether you can steer a portfolio company.
2.5x EBITDA Growth Rate Multiplier for Weekly KPI Visibility
BRIEF · GTM EXECUTION
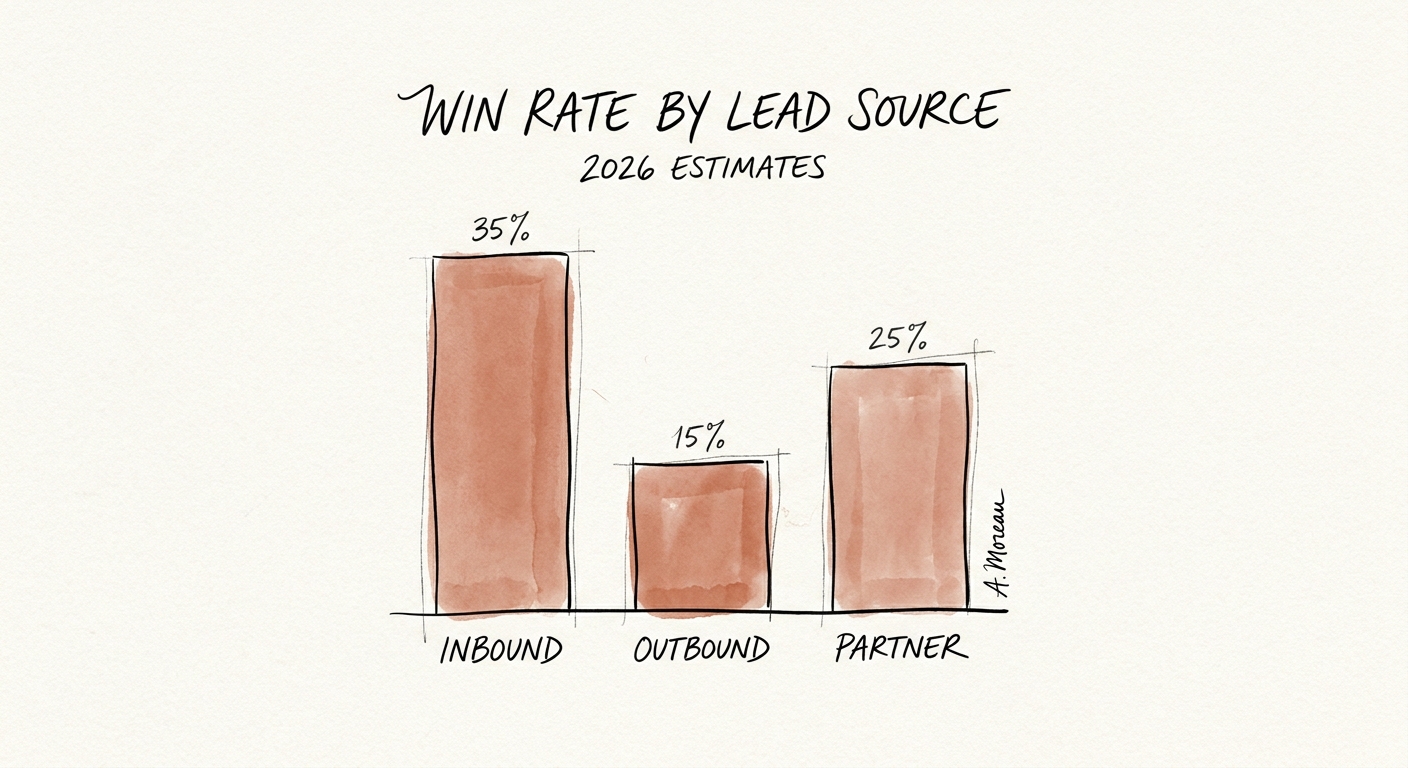
The Blended Win Rate Lie: Untangling Inbound, Outbound, and Partner Pipeline
Stop relying on a blended win rate. Discover the 2026 benchmarks for inbound, outbound, and partner-sourced deals, and why PE buyers discount outbound revenue.
3.8% Average B2B Outbound Win Rate in 2026
BRIEF · GTM EXECUTION
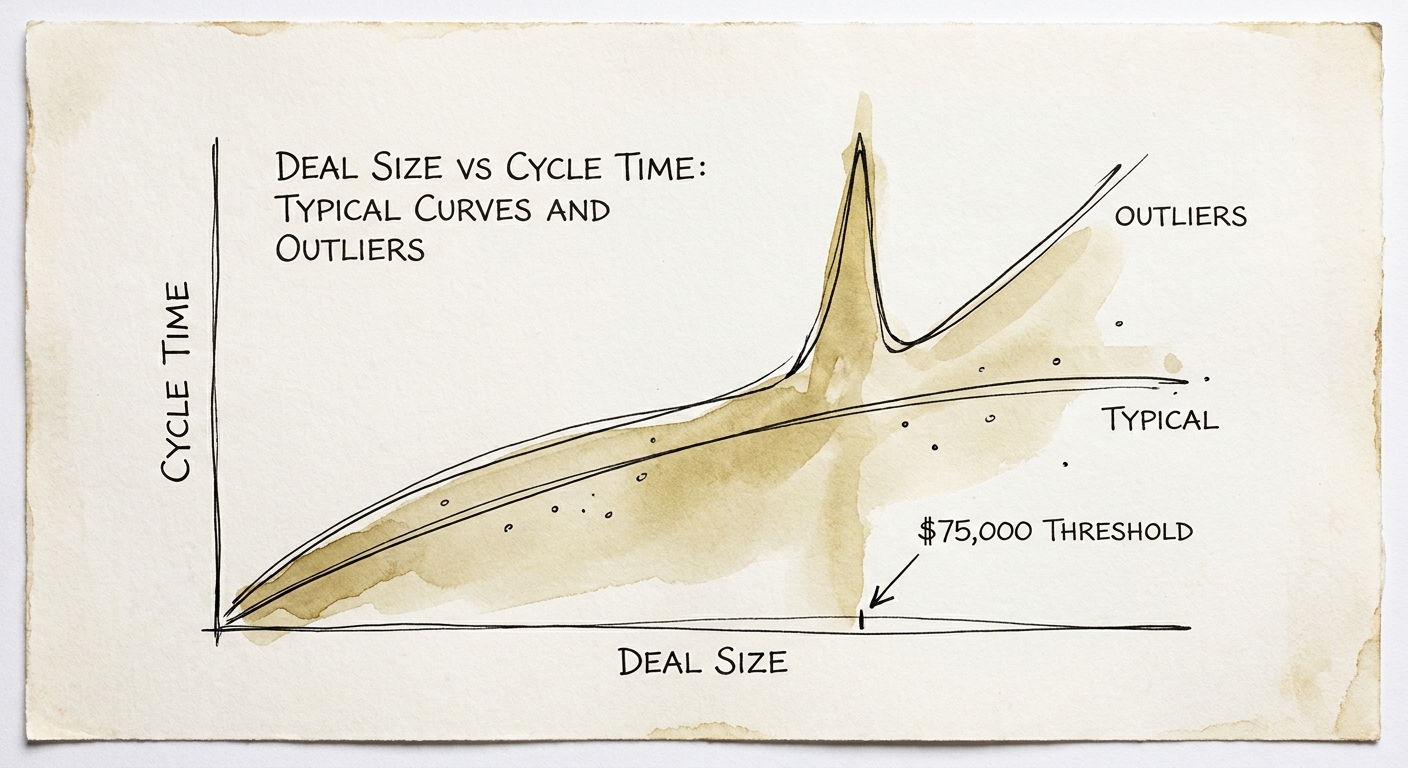
The $80k Trap: Why Mid-Market SaaS Deals Stall in the Valley of Death
An $80k SaaS deal triggers full enterprise procurement but commands zero C-suite attention. That's the outlier zone — where cycle times double and win rates collapse.
212 Days Cycle Time in the Outlier Zone
BRIEF · COMPLIANCE & SECURITY
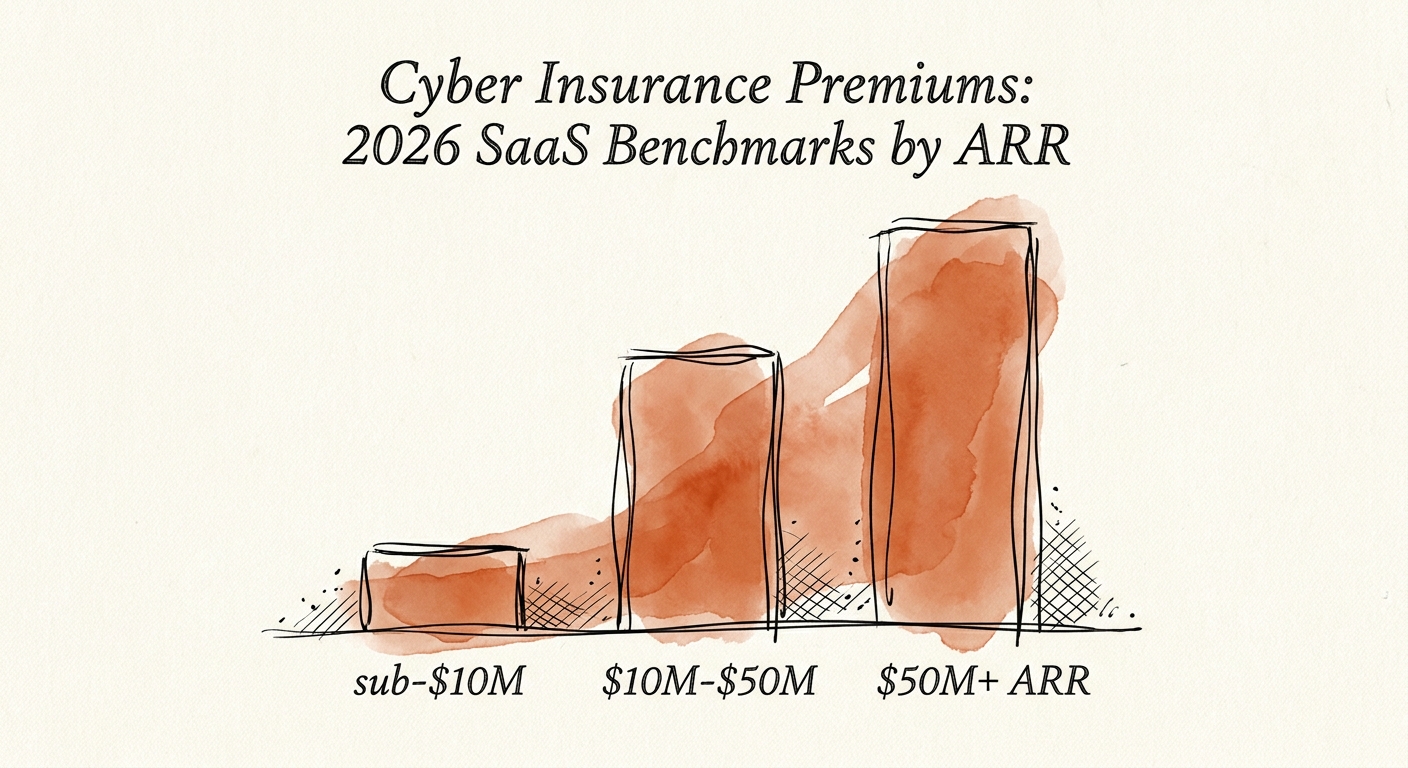
What SaaS Cyber Insurance Actually Costs by ARR in 2026
The 2026 SaaS cyber premium curve bends sharply at $10M ARR. Real benchmarks by revenue band, why deal models miss by ~40%, and how to bend the renewal back down.
42% Average PE Underestimation of SaaS Cyber Premiums
BRIEF · COMPLIANCE & SECURITY
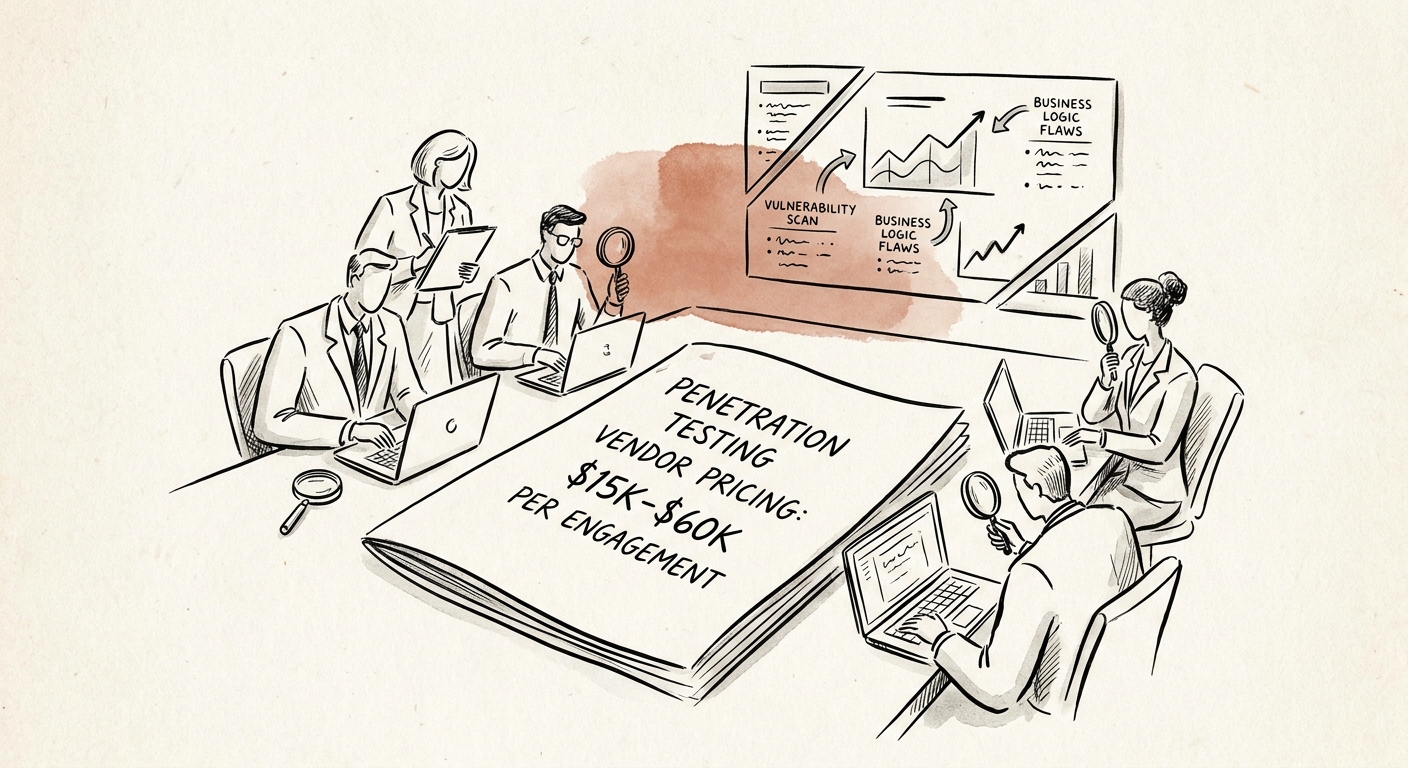
The $35,000 Vulnerability Scan: Why Your Penetration Test Will Fail PE Due Diligence
Founders routinely pay $15k-$60k for penetration tests that are nothing more than glorified automated scans. Here is how to stop burning cash and pass technical due diligence.
$4.88M Average Cost of a Data Breach (IBM 2024 Benchmark)
BRIEF · FINANCIAL INFRASTRUCTURE
How a Free Implementation Package Cost a SaaS Founder Two Turns of Multiple
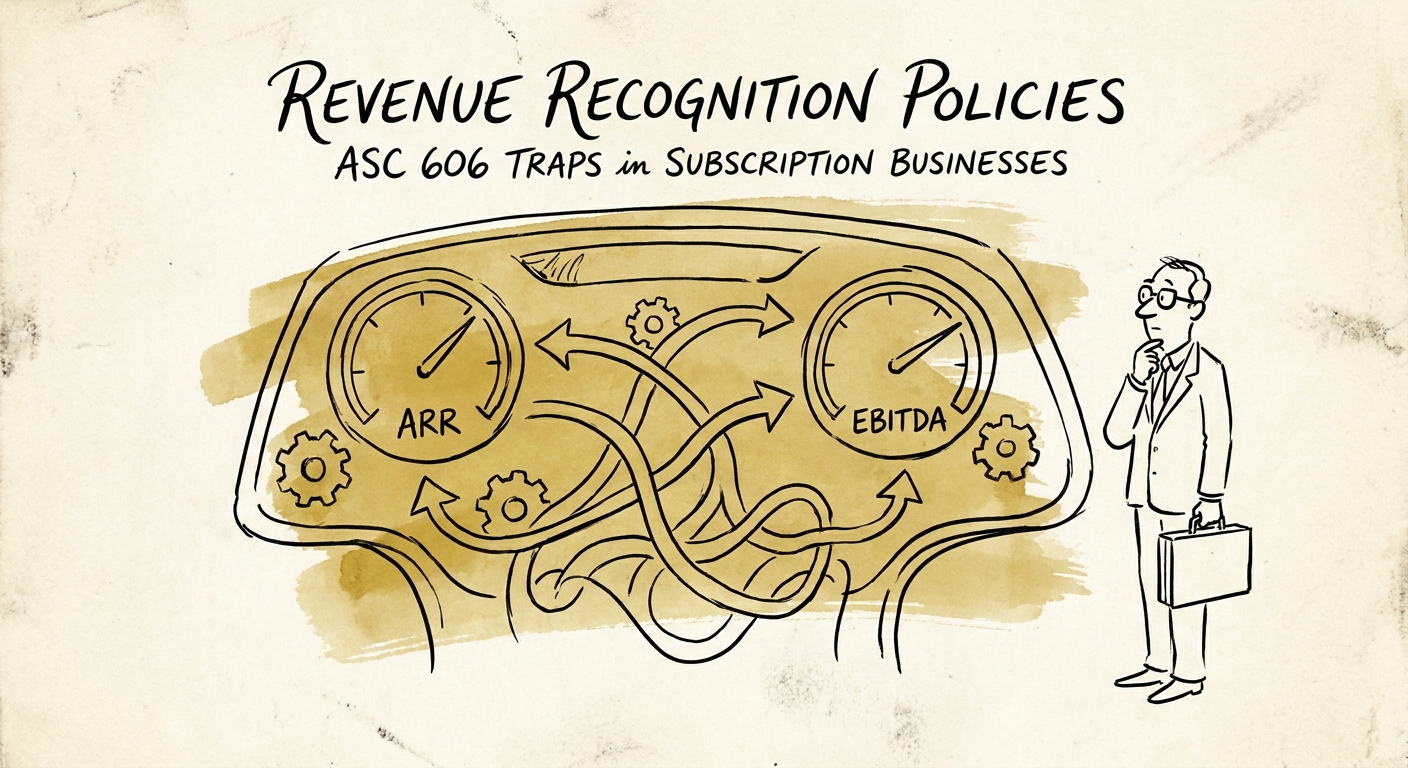
The exact ASC 606 mistakes — SSP allocation, contract mods, capitalized commissions — that surface in QofE and reprice B2B SaaS deals. With the math.
15% Potential valuation haircut from ASC 606 restatements
BRIEF · FINANCIAL INFRASTRUCTURE
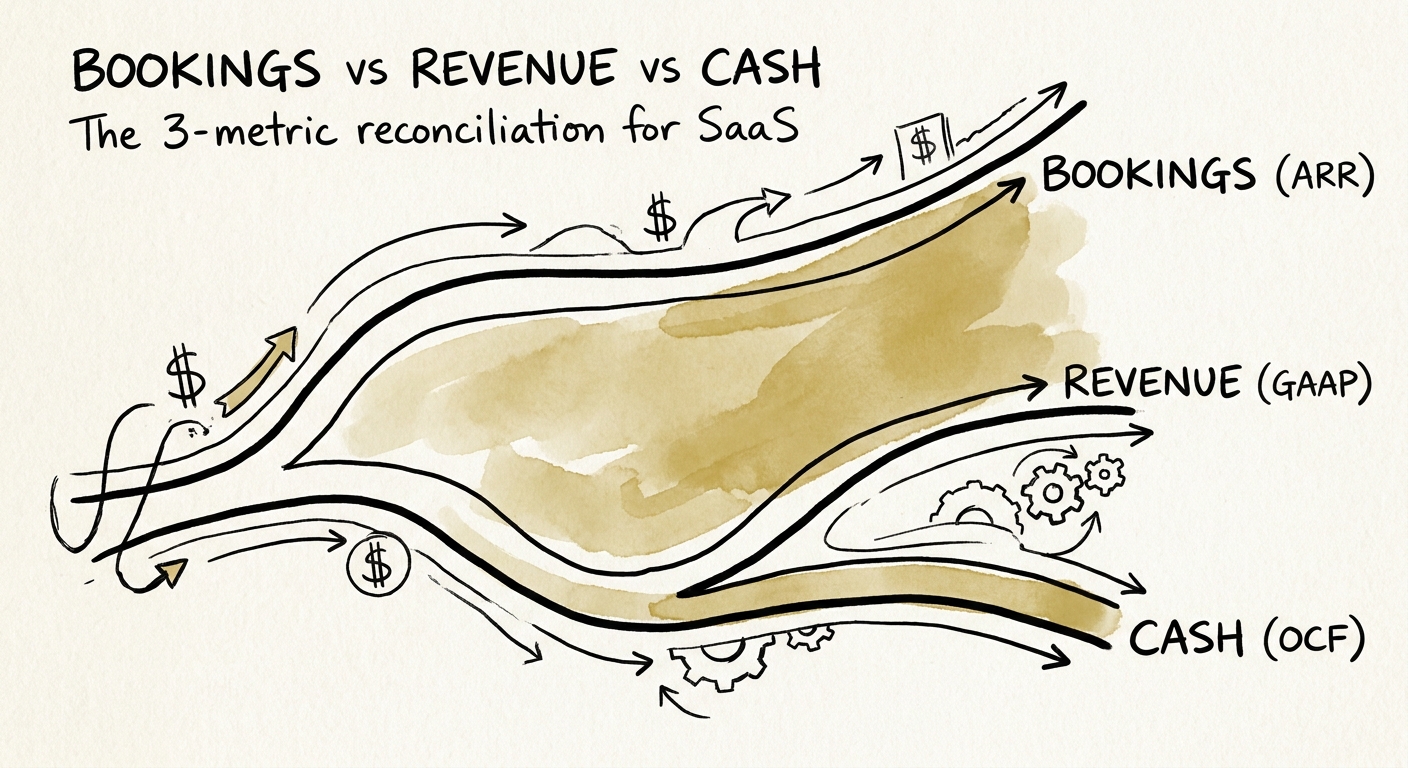
Three Numbers, One Quarter: Why Your Bookings, Revenue, and Cash Never Agree
A signed $300K SaaS deal can show full contract value, a sliver of revenue, and negative cash in the same week. Here's how to reconcile bookings, revenue, and cash before diligence does it for you.
54% of SaaS acquisitions face negative price adjustments due to ASC 606 revenue errors
BRIEF · GTM EXECUTION
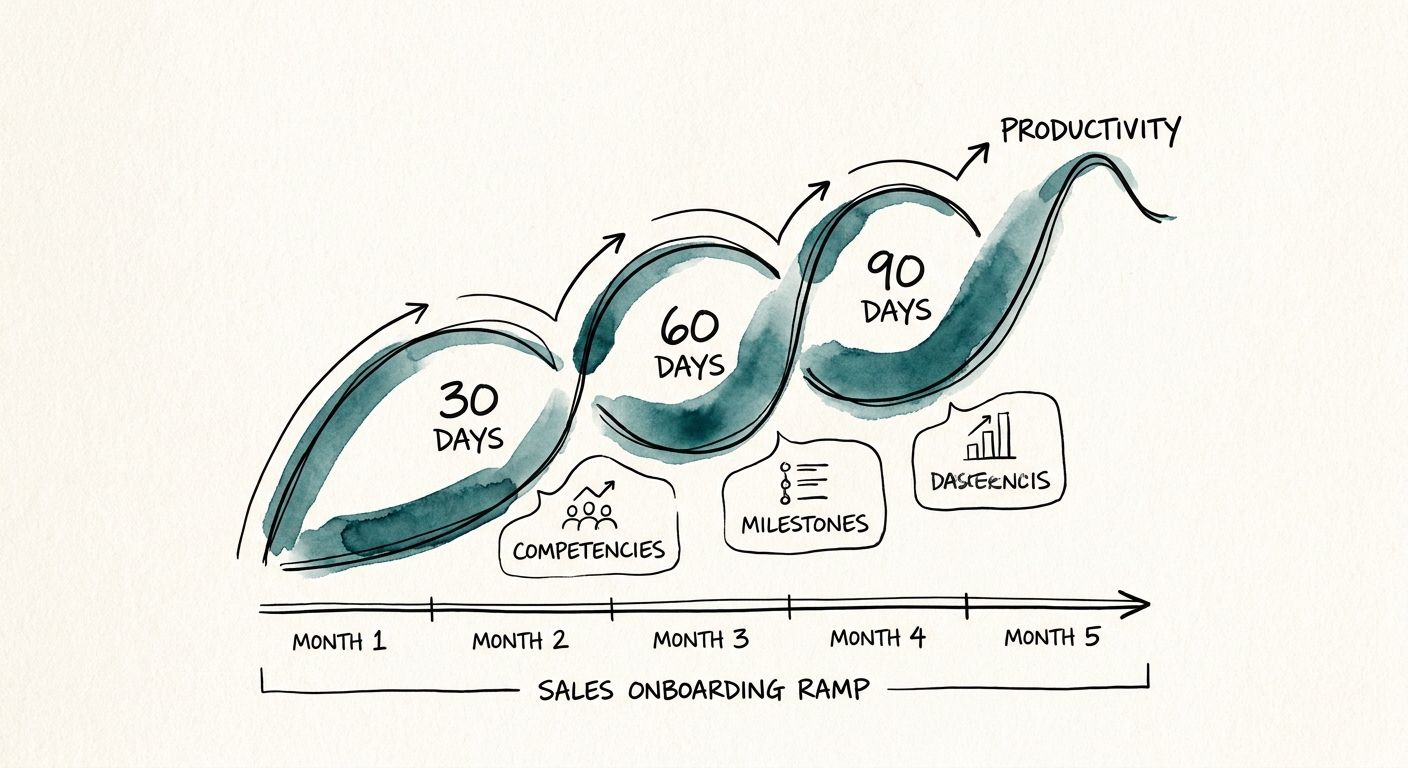
The 90-Day Ramp Illusion: 2026 Sales Onboarding Benchmarks That Actually Predict Revenue
Why the standard 90-day sales ramp is a hallucination that burns $240,000 in wasted draw. Discover the 2026 competency-based onboarding benchmarks for enterprise AEs.
5.3 Months average ramp time for enterprise SaaS AEs
BRIEF · FINANCIAL INFRASTRUCTURE
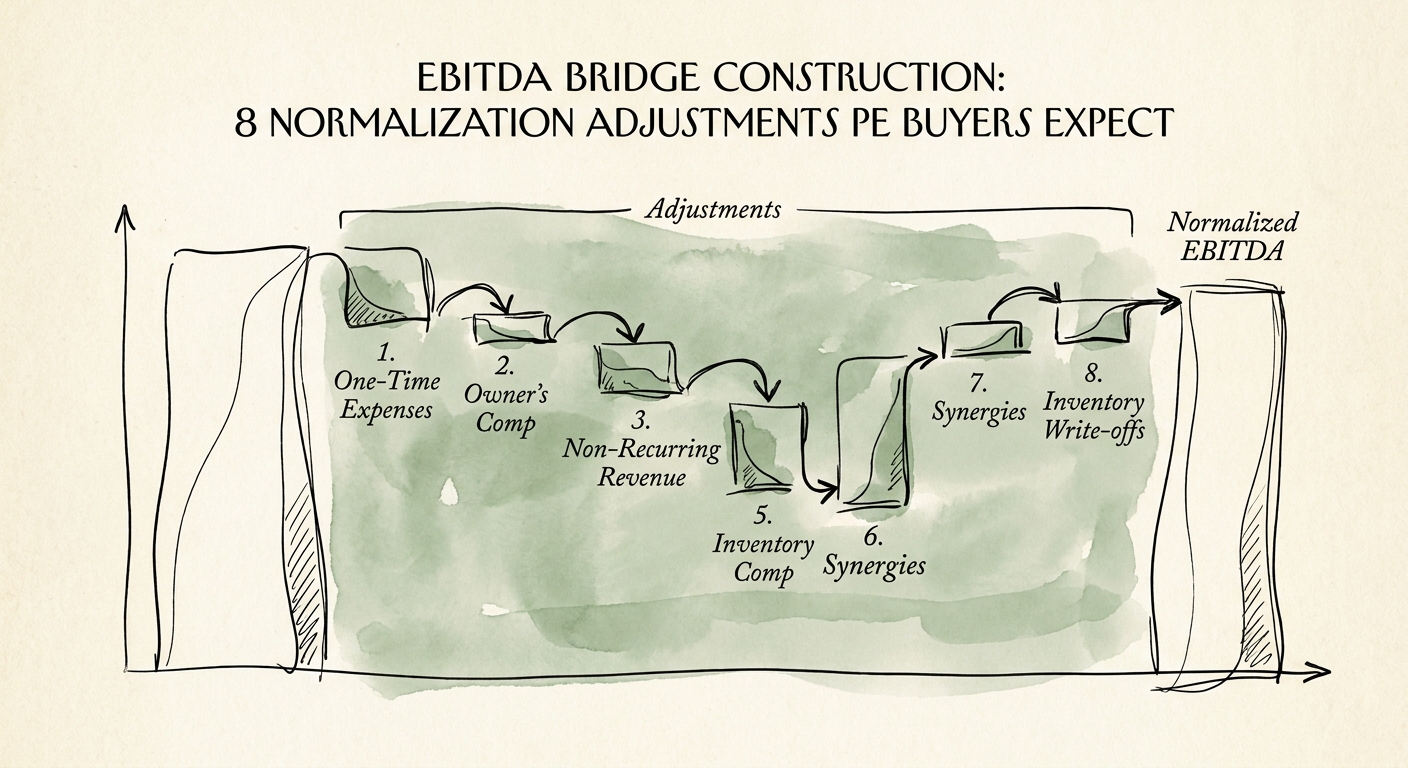
The EBITDA Bridge a Tech-Services Founder Gets Wrong: 8 Adjustments Buyers Test First
A $40M tech-services seller's EBITDA bridge, line by line. The 8 normalization adjustments PE diligence attacks first, and how to make each one survive QofE.
30% of seller-adjusted EBITDA routinely shredded during LOI-to-close due diligence
BRIEF · GTM EXECUTION
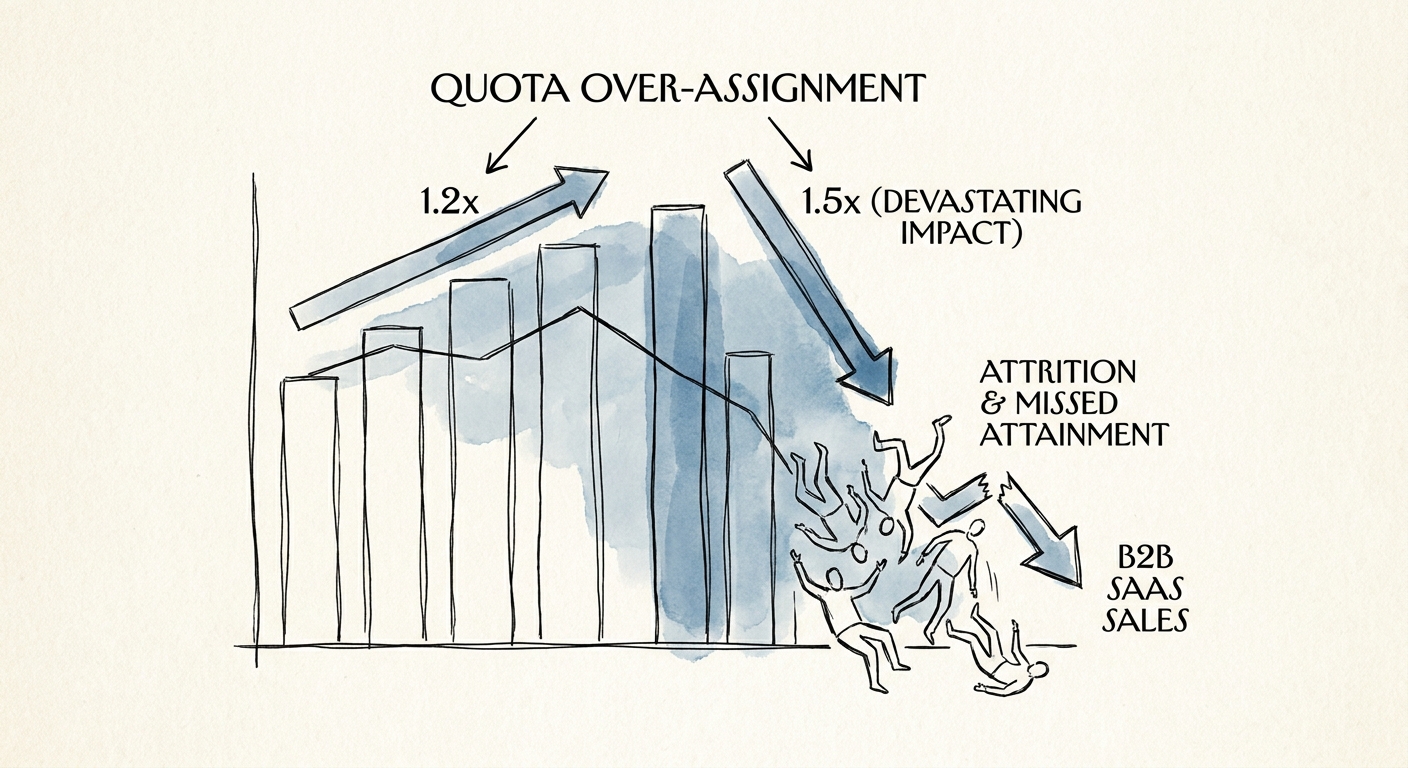
The Quota Multiplier Trap: Why 1.5x Over-Assignment Is Destroying Your Pipeline
A 1.5x quota over-assignment multiplier doesn't derisk your board plan. It guarantees ~42% sales attrition. Here's the math, and how to compress to 1.15x.
1.15x Maximum Healthy Quota Over-Assignment Multiplier
BRIEF · FINANCIAL INFRASTRUCTURE
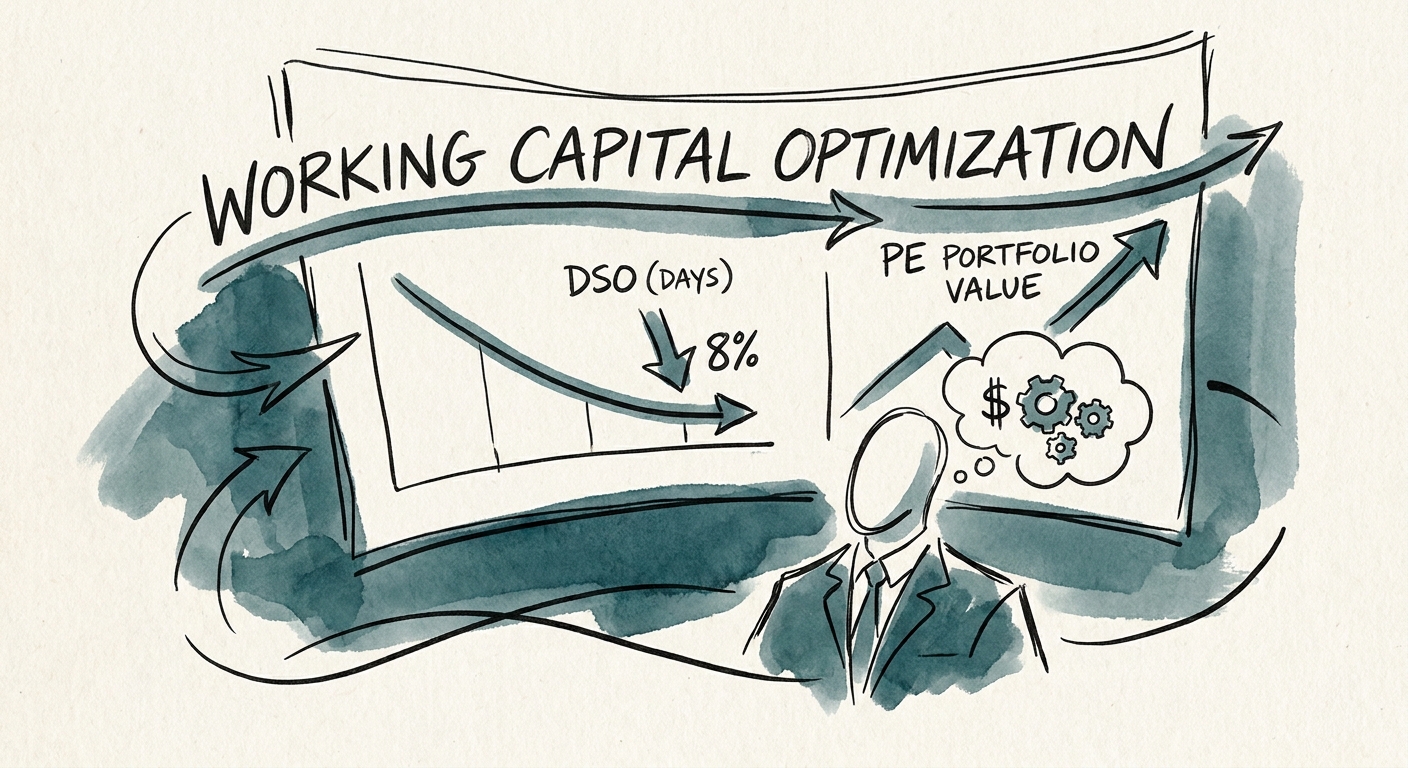
Working Capital Optimization in PE Portfolios: How to Free Up 8% of Revenue
Discover how PE operating partners optimize the cash conversion cycle to unlock up to 8% of revenue in trapped liquidity and reduce reliance on expensive debt.
8% Freed Revenue via Working Capital Optimization