BRIEF · UNIT ECONOMICS
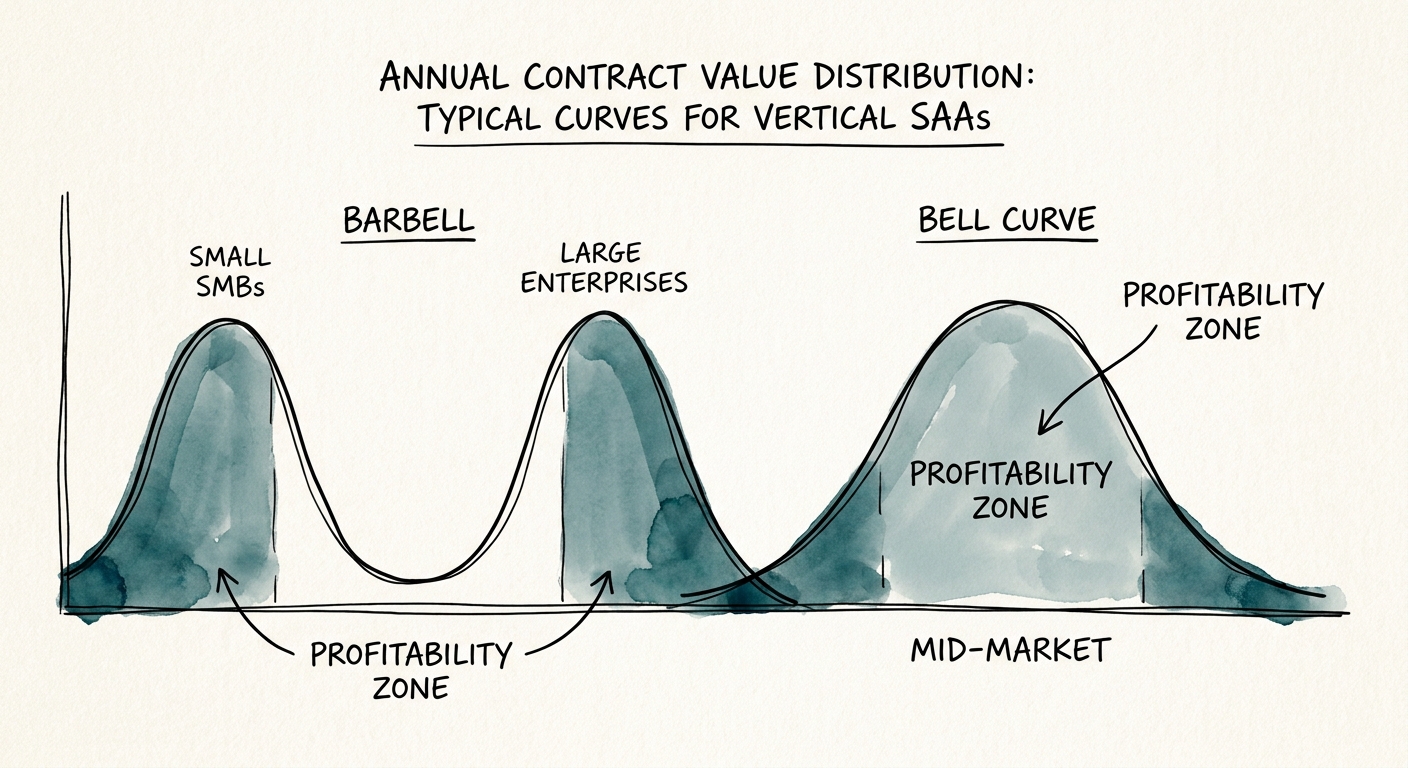
The Vertical SaaS Barbell: Why a Bell Curve ACV Distribution is Bleeding Your EBITDA
If your vertical SaaS ACV distribution looks like a perfect bell curve, you may be leaving meaningful enterprise EBITDA on the table. Learn why a barbell curve is optimal.
22% EBITDA Leakage in Mid-Market ACVs
BRIEF · TEAM & HIRING
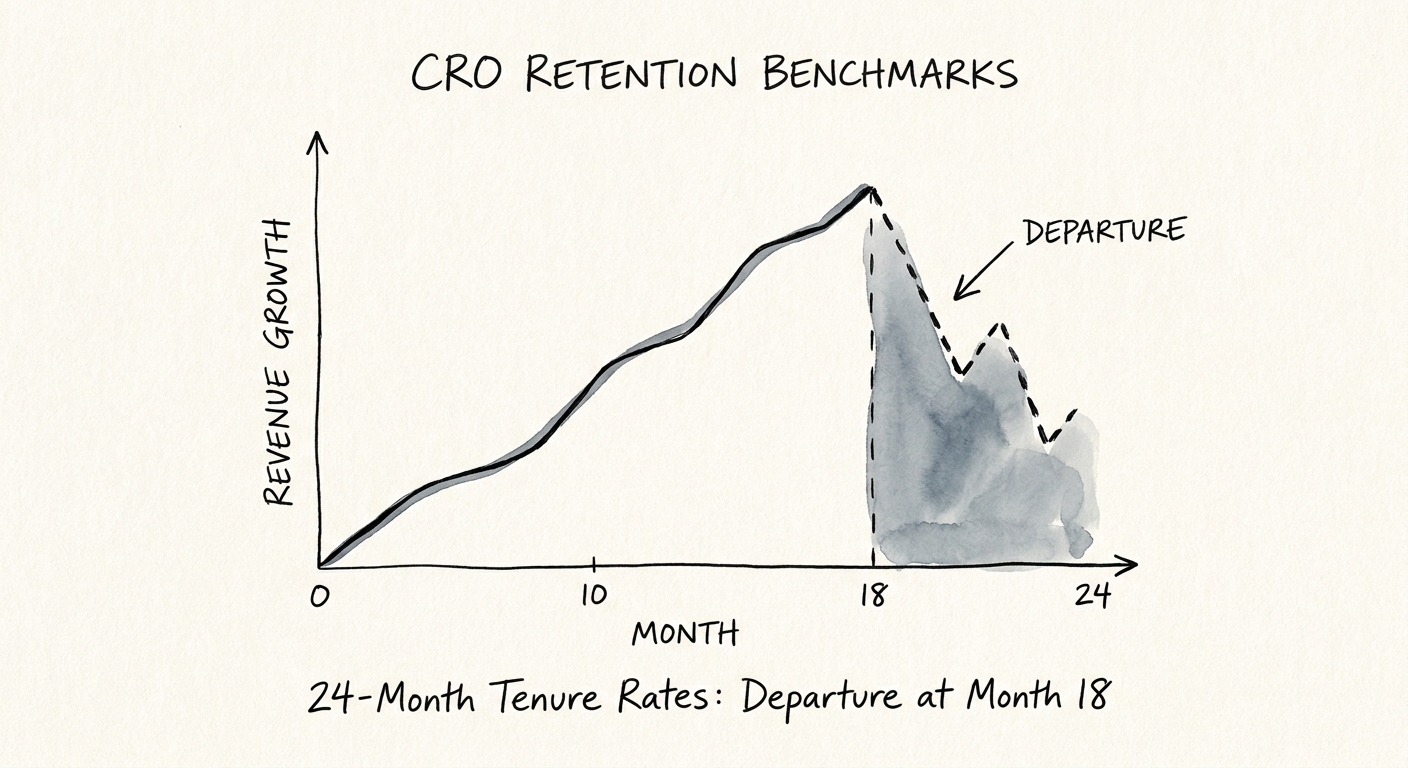
The CRO Tenure Clock: Why Your Revenue Chief Quits at Month 19 — and What That Reset Does to Your Multiple
The average CRO lasts 1.8 years — shorter than the revenue engine they were hired to build takes to compound. Here's the month-by-month tenure math and how PE boards break it.
1.8 Years Average CRO Tenure in 2026
BRIEF · UNIT ECONOMICS
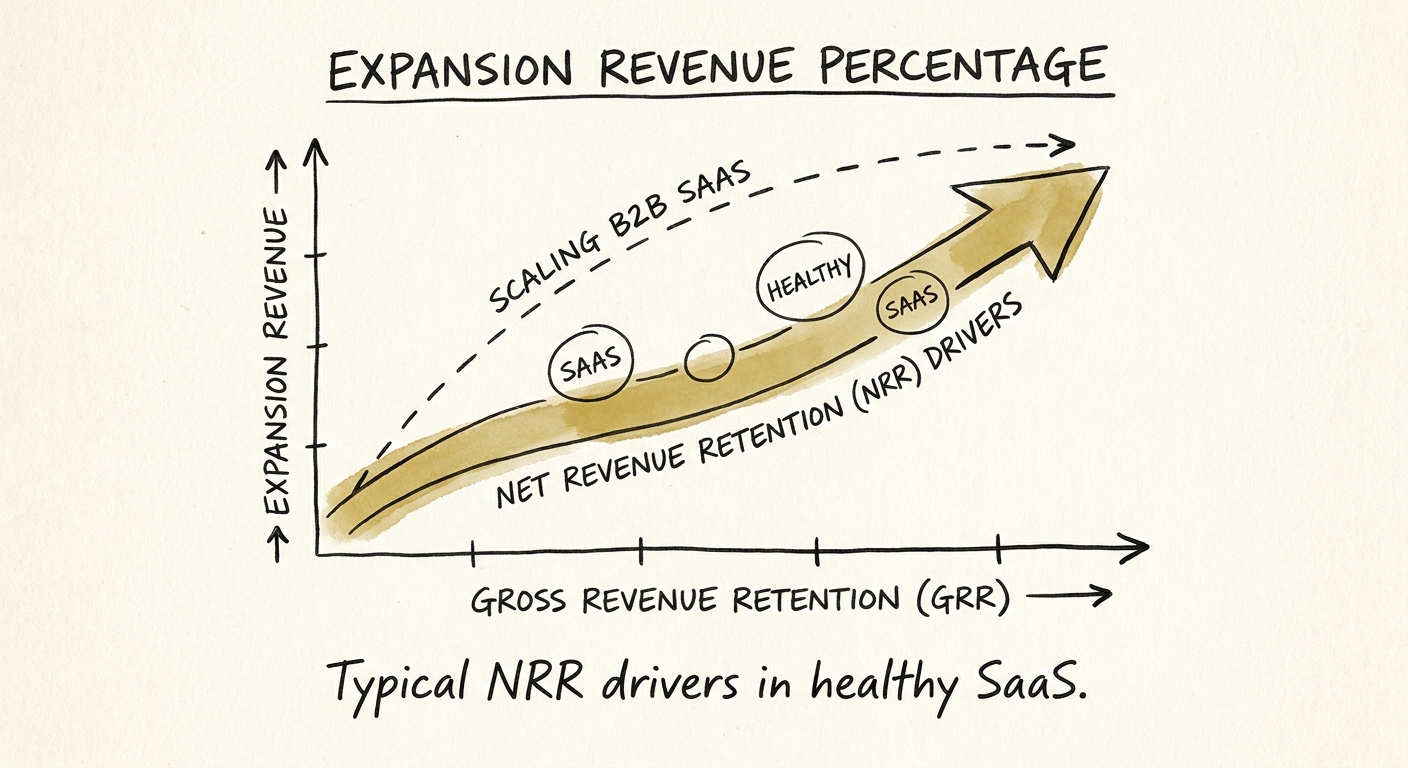
Your 115% NRR Is Lying to You: The GRR Number That Decides Your SaaS Multiple
A 115% NRR can hide a 30-point churn problem in $10M-$50M SaaS. Justin Leader shows the GRR math that decides whether your expansion revenue survives diligence.
40% Expansion Revenue as % of Total New ARR in Top-Quartile SaaS
BRIEF · MIGRATION & INTEGRATION
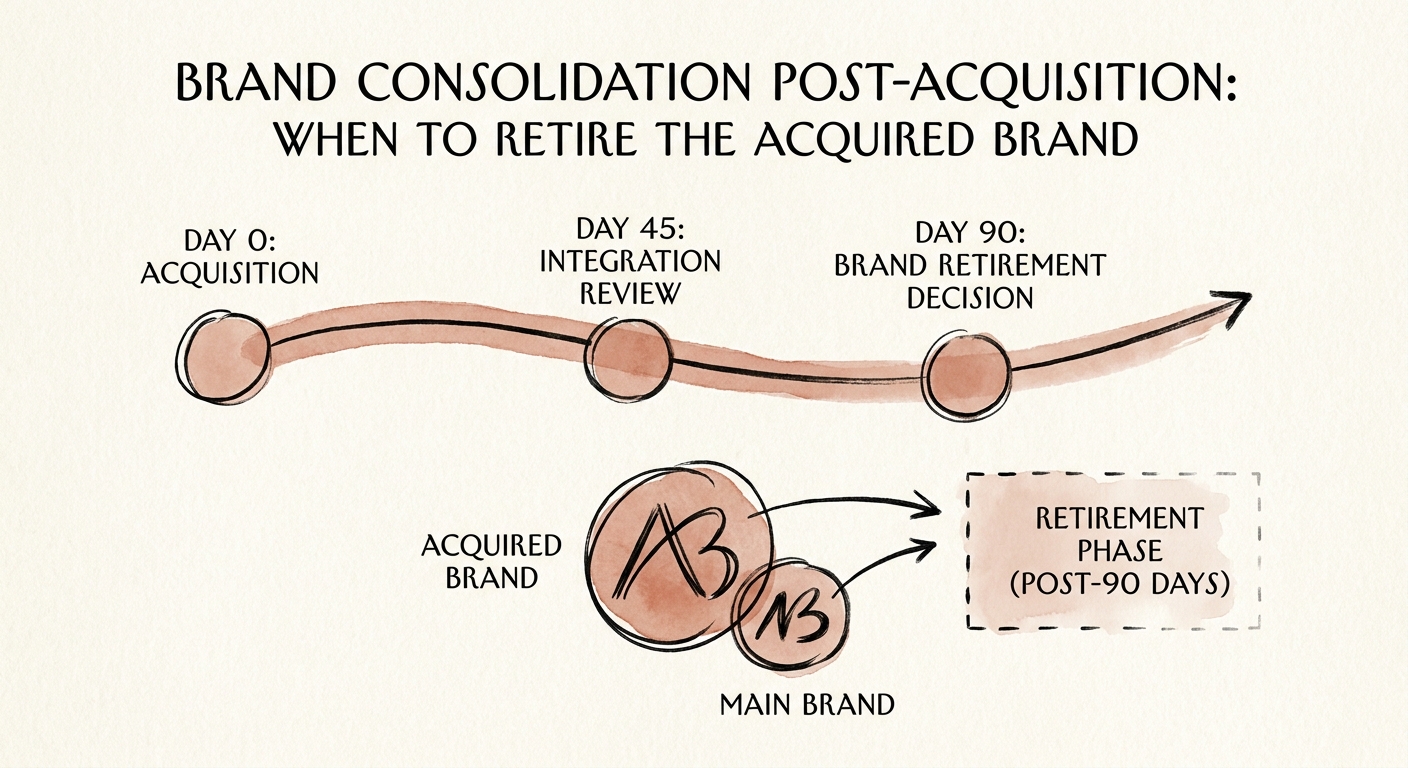
The Three-Brand Roll-Up: A Post-Acquisition Sunset Timeline That Protects Revenue
A roll-up bidding against its own three brands in the same RFP is burning EBITDA. Here is the 180-day decision window and the 90-day sunset that keeps the revenue.
3.5x Loss in Market Visibility
BRIEF · TECHNICAL DEBT
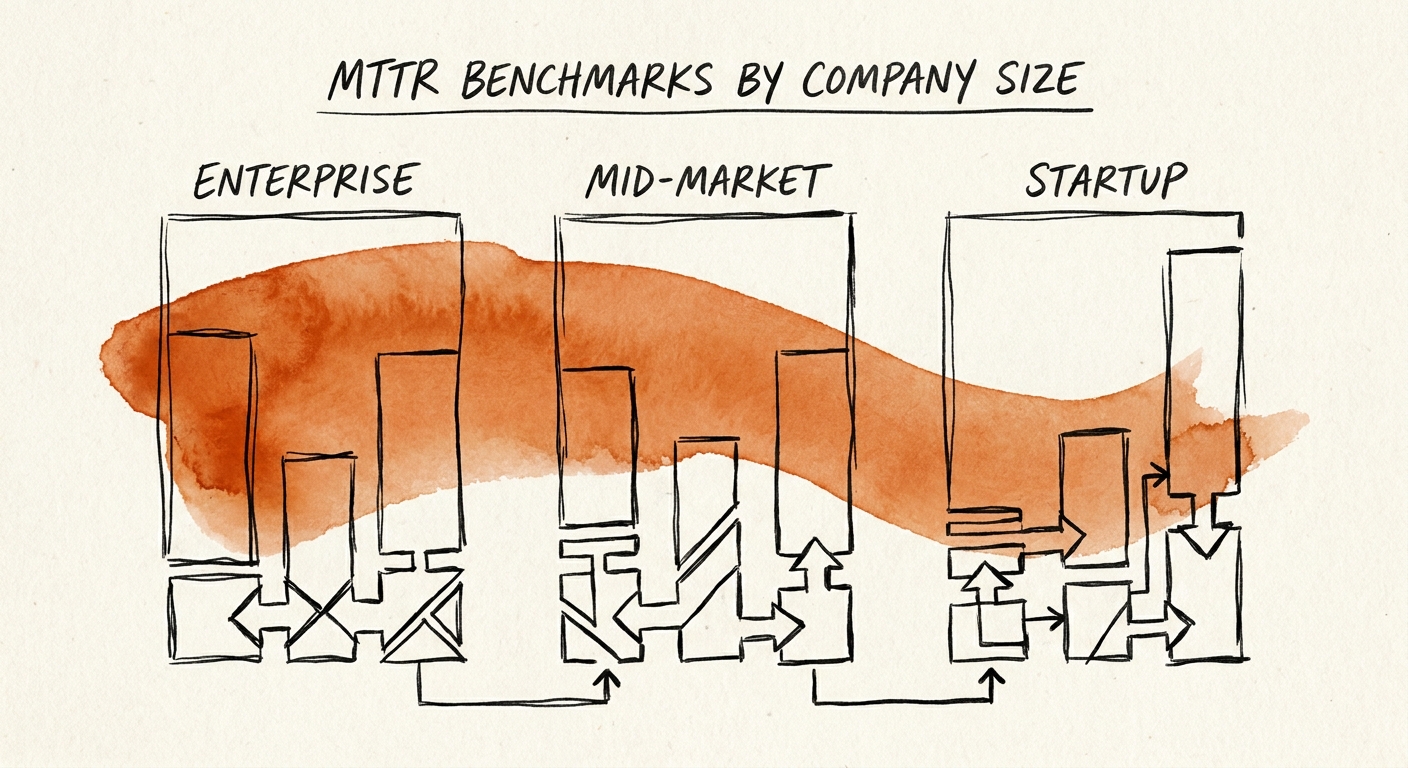
Production Incident Rates: MTTR Benchmarks by Company Size
Discover why a fast MTTR is often a red flag for technical debt. Explore 2026 MTTR benchmarks by company size and learn how PE firms assess engineering risk.
242% Increase in probability of production incidents per pull request in the mid-market
BRIEF · MIGRATION & INTEGRATION
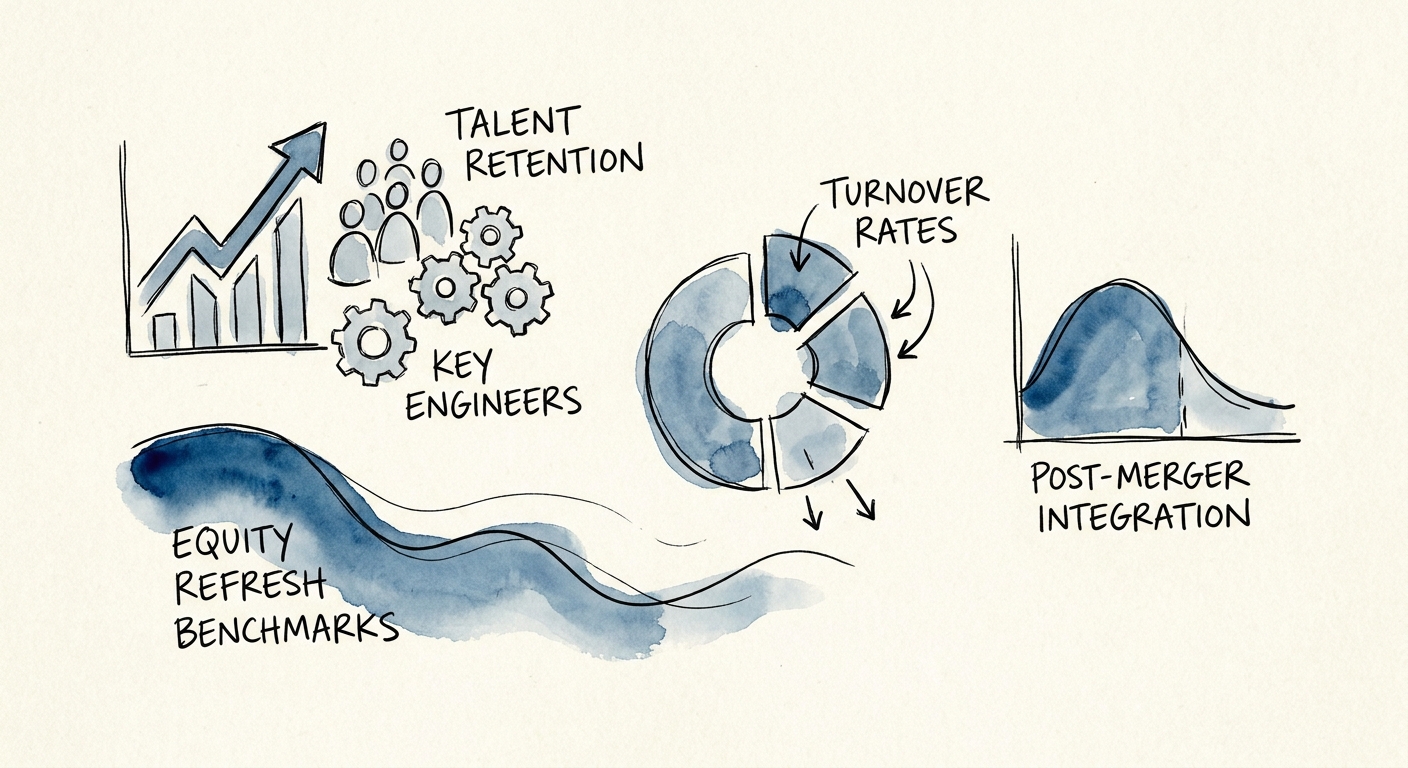
The 43% Brain Drain: Post-Merger Equity Refresh Benchmarks for Key Engineers
Private equity firms lose 43% of critical engineering talent post-close. Justin Leader breaks down the exact equity refresh benchmarks required to retain top tech talent.
43% Critical Engineer Attrition Within 14 Months Post-Close
BRIEF · TEAM & HIRING
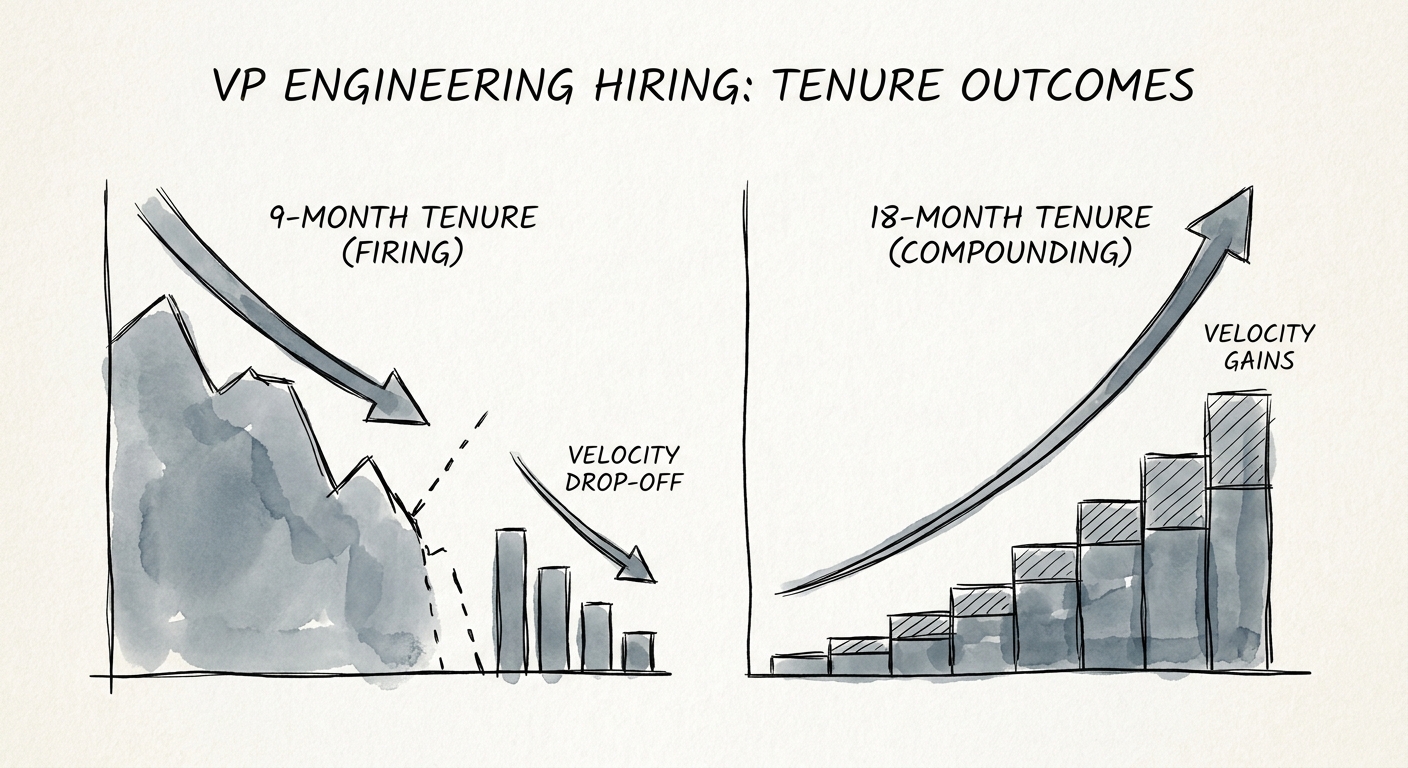
The VP Engineering Velocity Tax: Why 9-Month Tenures Hurt Series B Valuations
Replacing your VP of Engineering at the 9-month mark can trigger a hidden velocity tax. Discover the data-backed outcomes of 18-month VPE tenures and how to secure them.
$2.4M Average velocity tax and enterprise value risk from replacing a VP of Engineering at Month 9
BRIEF · TECHNICAL DEBT
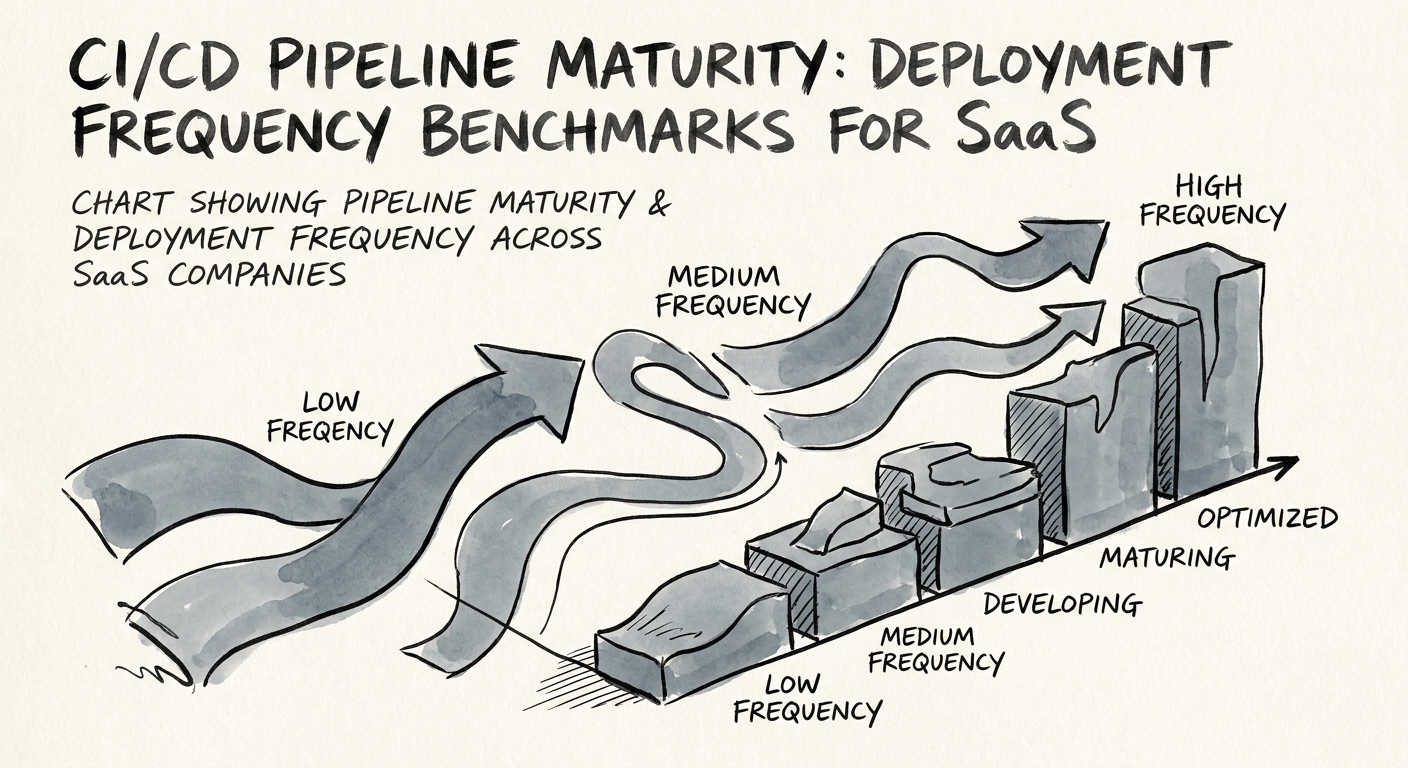
Deployment Frequency Benchmarks: What Your SaaS Release Cadence Reveals in Diligence
A "monthly release" is often a two-week freeze plus two weeks of hotfixes. Here are the SaaS deployment frequency benchmarks acquirers actually score.
34% Engineering Payroll Wasted on Stabilization
BRIEF · MIGRATION & INTEGRATION
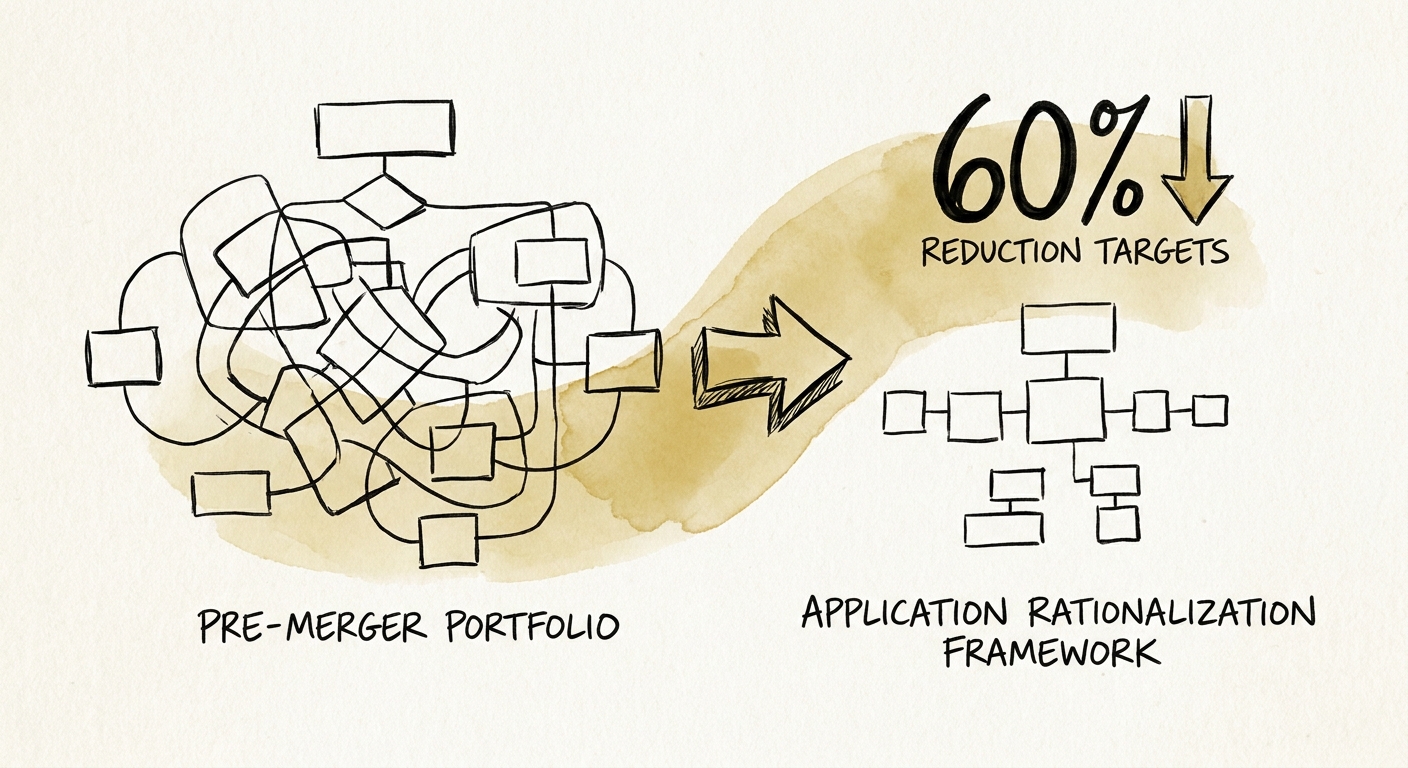
342 Apps, Four Companies, 120 Days: The Roll-Up App Rationalization Math
A 20% post-merger app-reduction target leaves money on the table. Here's the Kill/Migrate/Federate decision, the SSO cutover, and the contract-breakage math.
60% Minimum Application Reduction Target
BRIEF · TECHNICAL DEBT
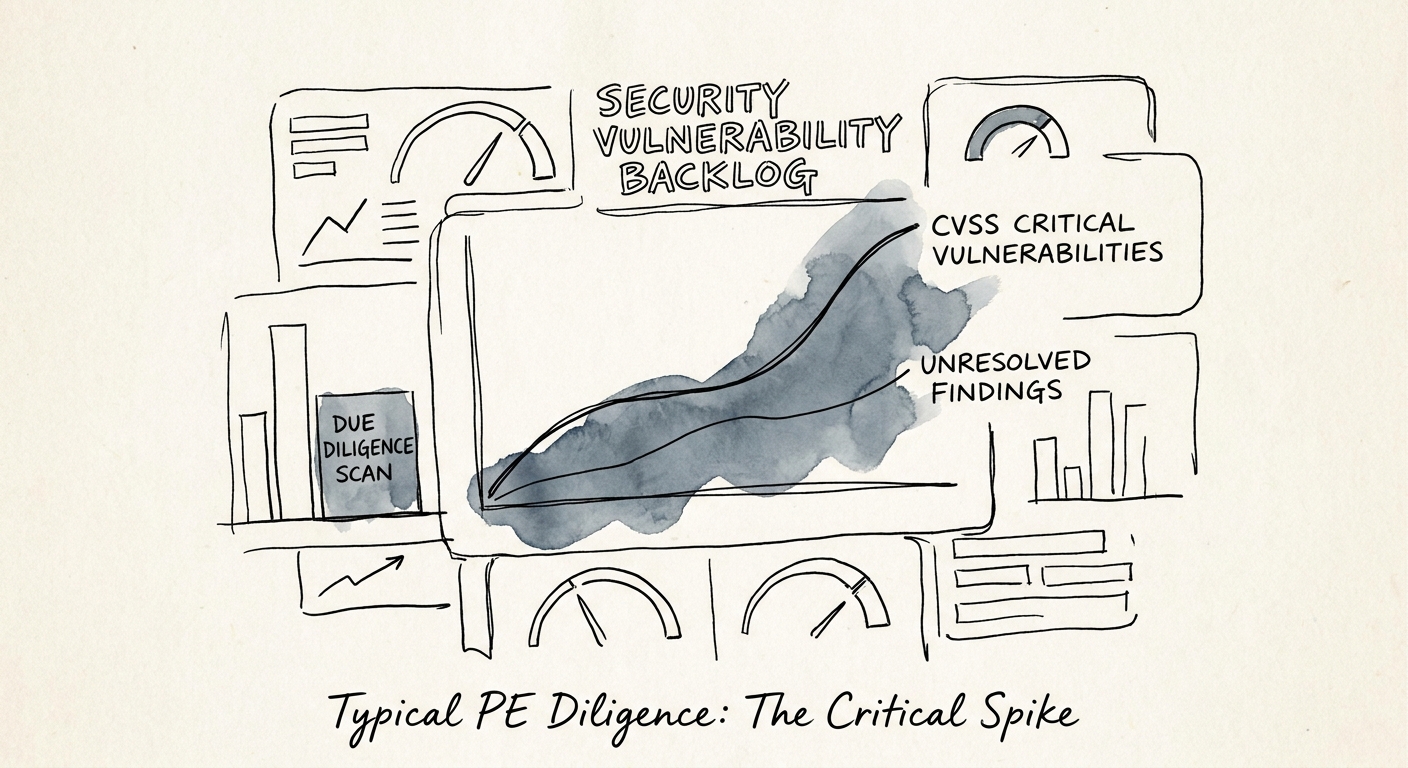
The $1.8M Diligence Blind Spot: Exposing the Security Vulnerability Backlog
Discover why security vulnerability backlogs are a $1.8M hidden liability in PE due diligence and how operating partners can translate CVSS scores to EBITDA.
$1.8M Average hidden EBITDA erosion from security backlogs in $50M B2B SaaS targets
BRIEF · TECHNICAL DEBT
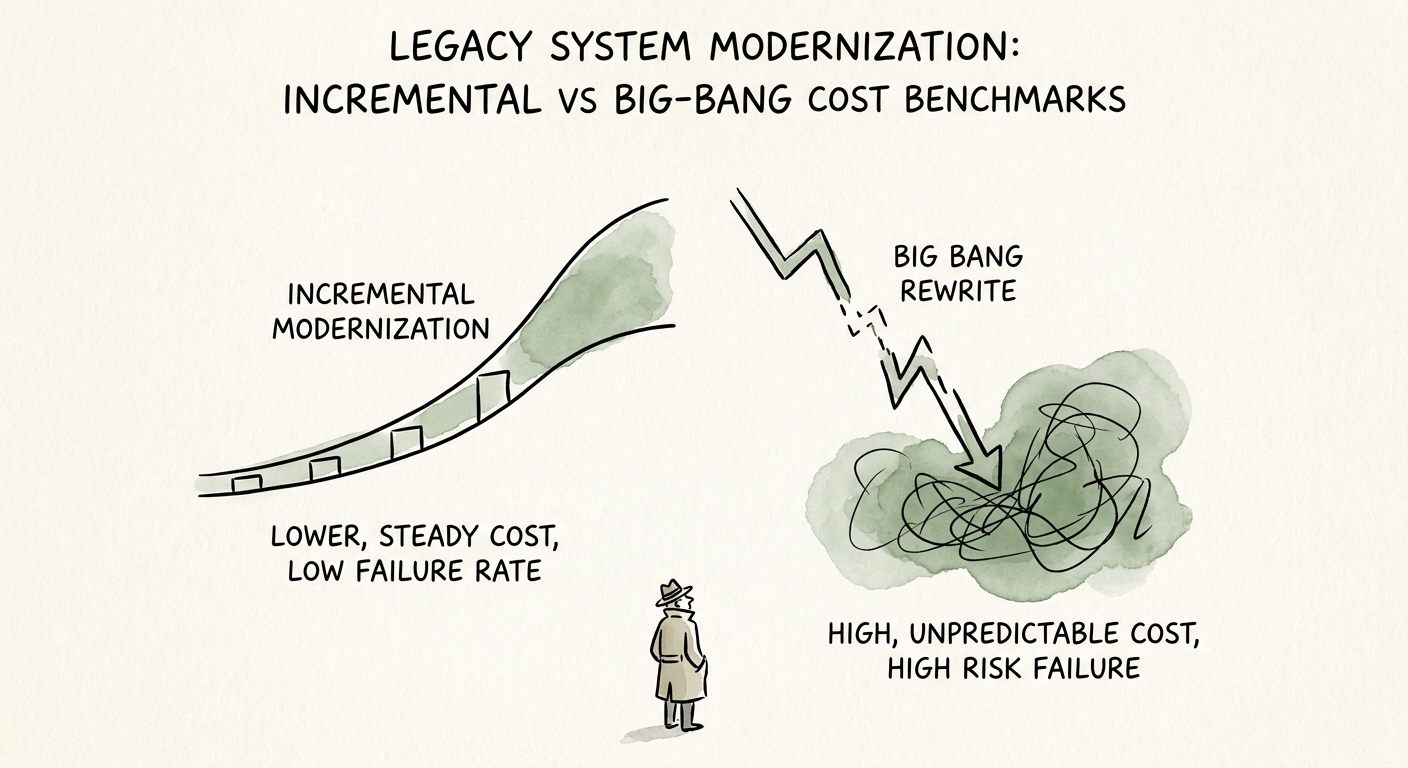
The Big-Bang Rewrite Math: Why Incremental Modernization Wins on Cost and Exit Value
Big-bang rewrites carry a 20% outright failure rate. Here is the cost-benchmark math and the Strangler Fig sequencing that protects EBITDA and your exit.
71% Success rate of incremental modernization
BRIEF · MIGRATION & INTEGRATION
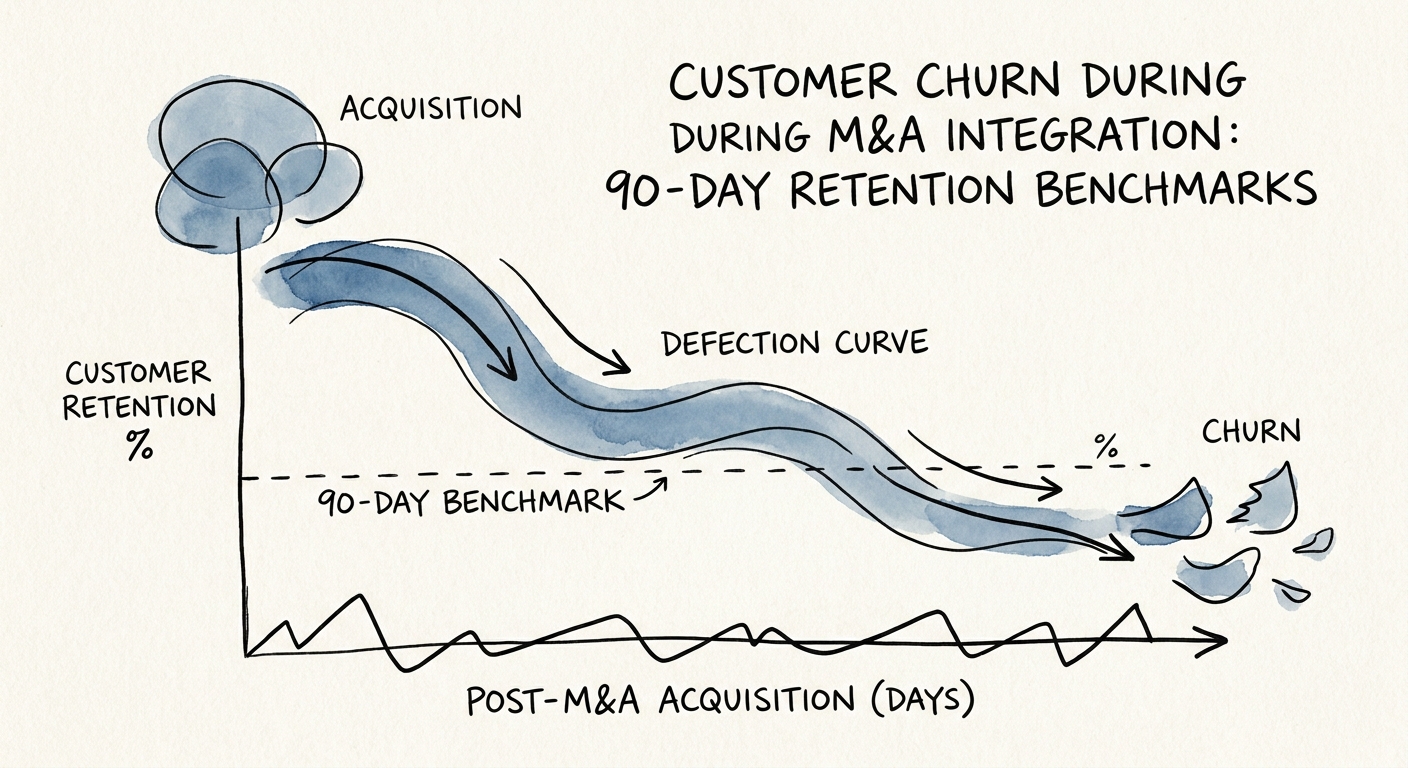
The 90-Day Retention Cliff: Customer Churn Benchmarks for Post-M&A Integration
Discover why 22.4% of acquired revenue evaporates in the first 90 days of M&A integration and how PE operating partners can protect their customer base.
22.4% Average Acquired ARR Churned Post-Close
BRIEF · MIGRATION & INTEGRATION
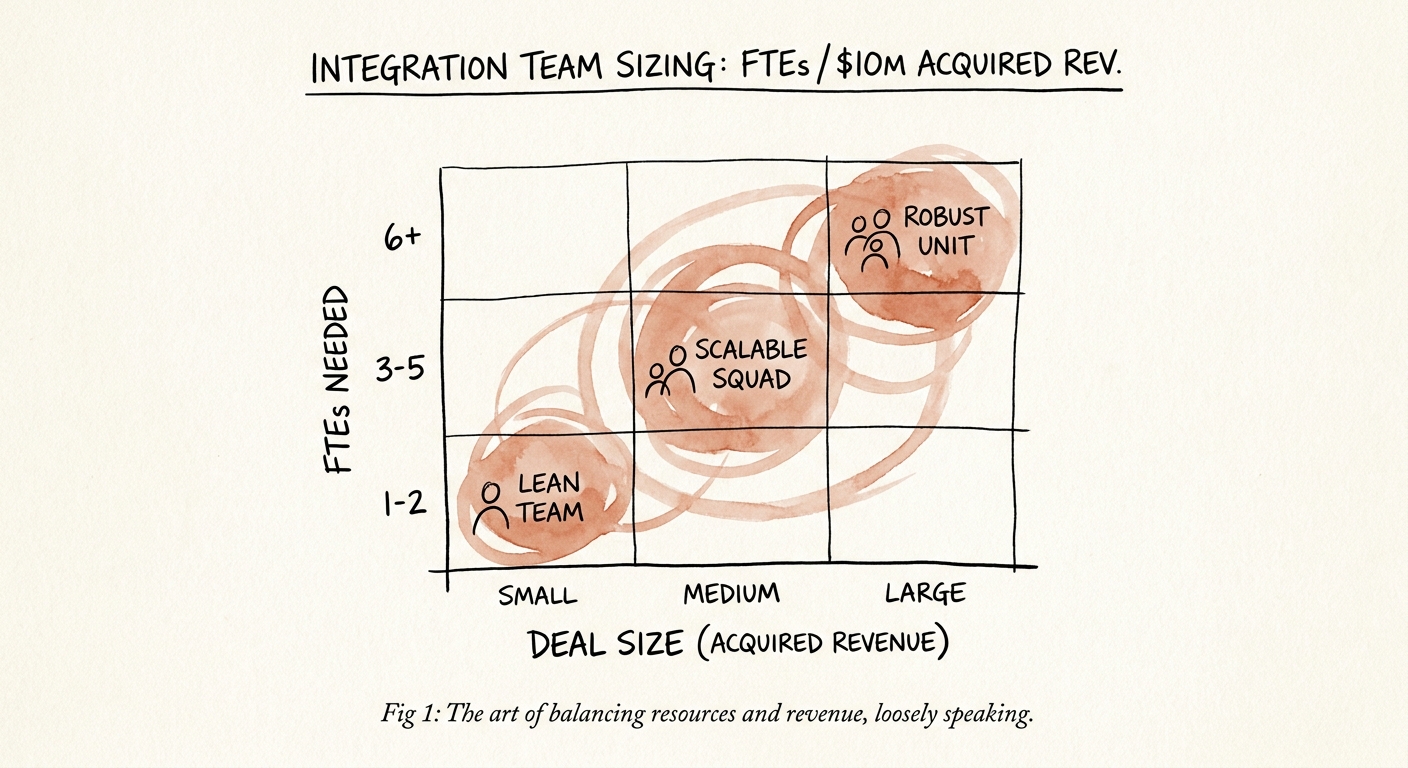
Integration Team Sizing: Why 0.5 FTEs per $10M in Acquired Revenue is Killing Your Exit
Private equity firms burn EBITDA by under-resourcing M&A integrations. Discover the exact matrix of dedicated FTEs needed per $10M of acquired revenue to protect deal value.
18% of EBITDA burned in the first 200 days due to under-resourced Integration Management Offices
BRIEF · MIGRATION & INTEGRATION
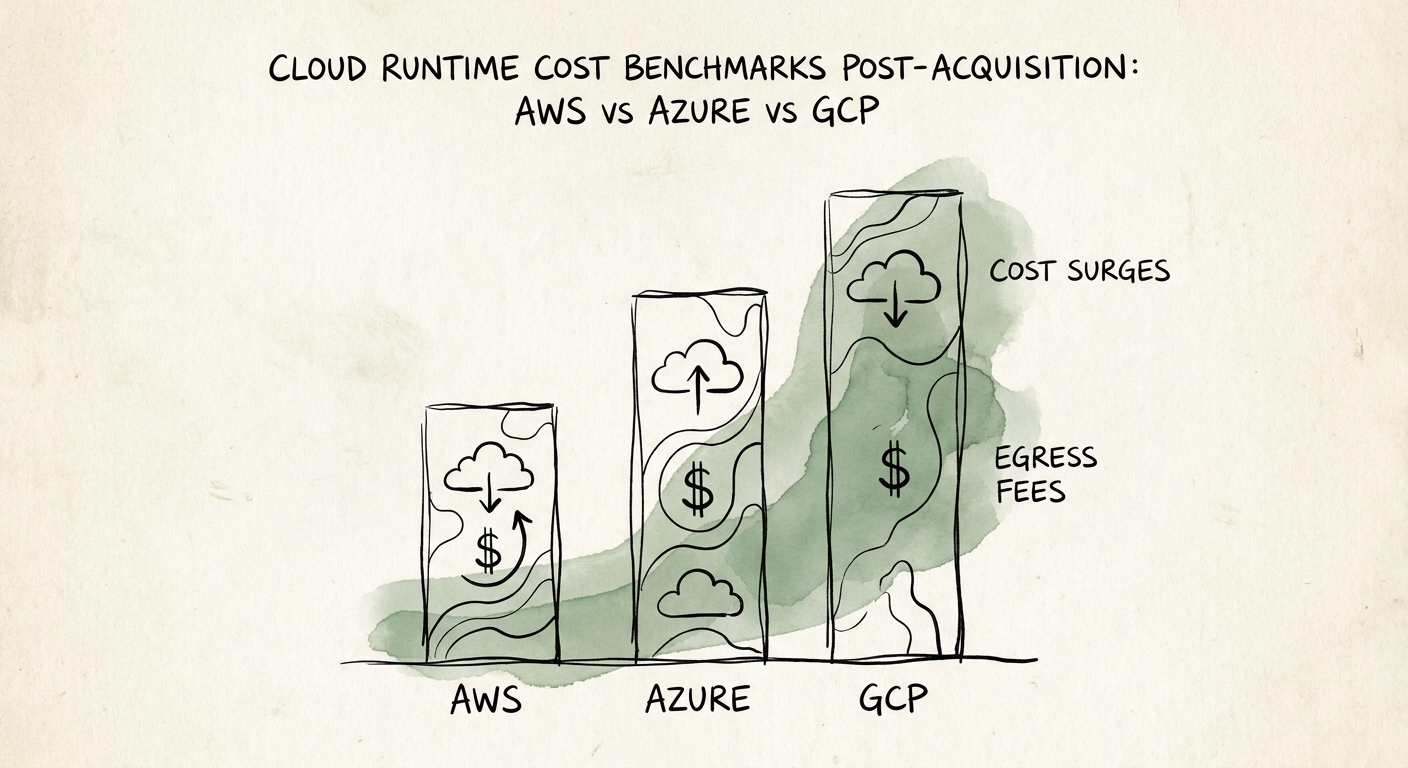
The Egress Tax: How a Cross-Cloud Sync Quietly Burned $228K in Month Two
When an AWS platform acquires a GCP target, real-time data sync becomes a margin leak. The 2026 egress numbers, the math, and the 120-day fix.
34.6% Surge in cloud runtime costs within the first 120 days post-close
BRIEF · TECHNICAL DEBT
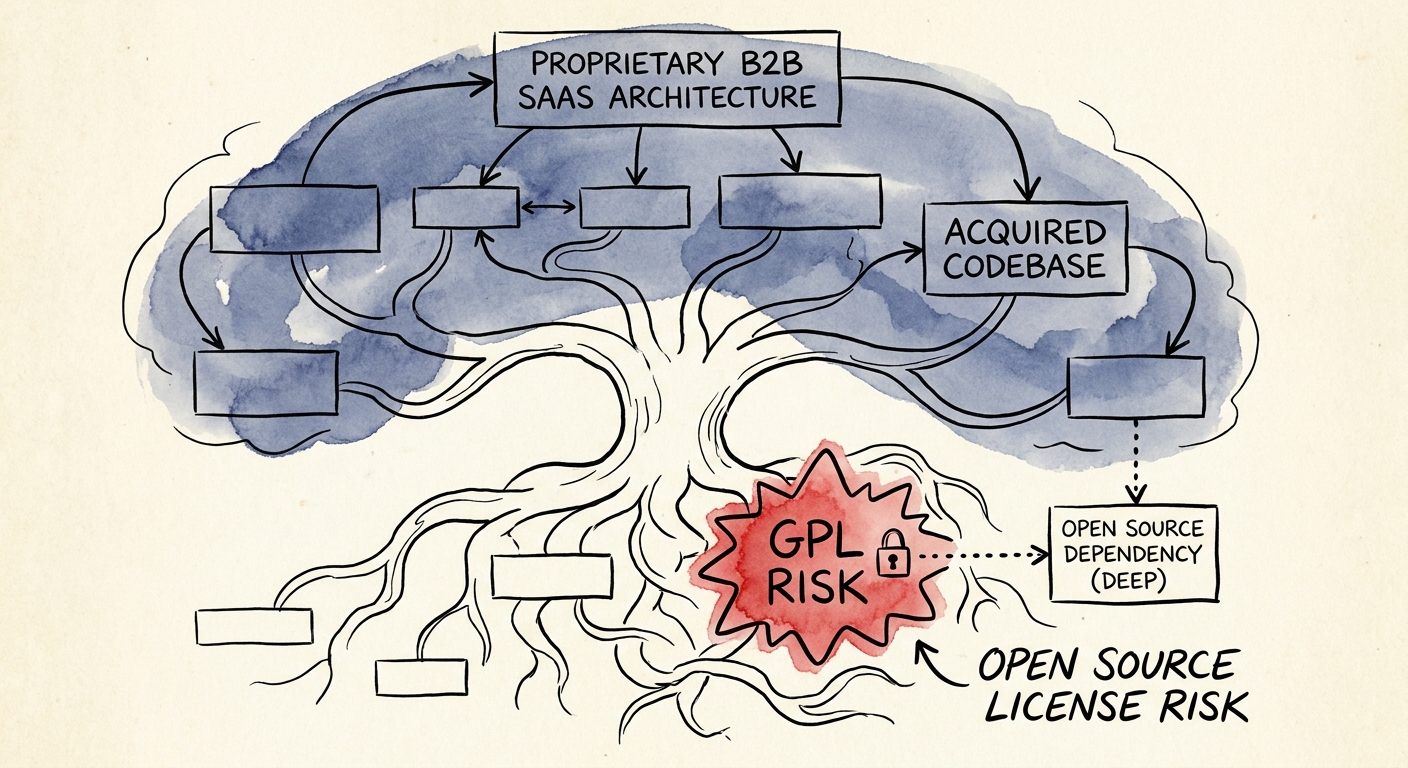
The $50M Copy-Paste: How GPL Open-Source Exposure Kills Proprietary SaaS Exits
Why restrictive GPL open-source licenses in acquired codebases are wiping out SaaS valuations in 2026, and how PE sponsors must audit for copyleft risk.
54% Commercial codebases containing active license conflicts
BRIEF · REVENUE ARCHITECTURE
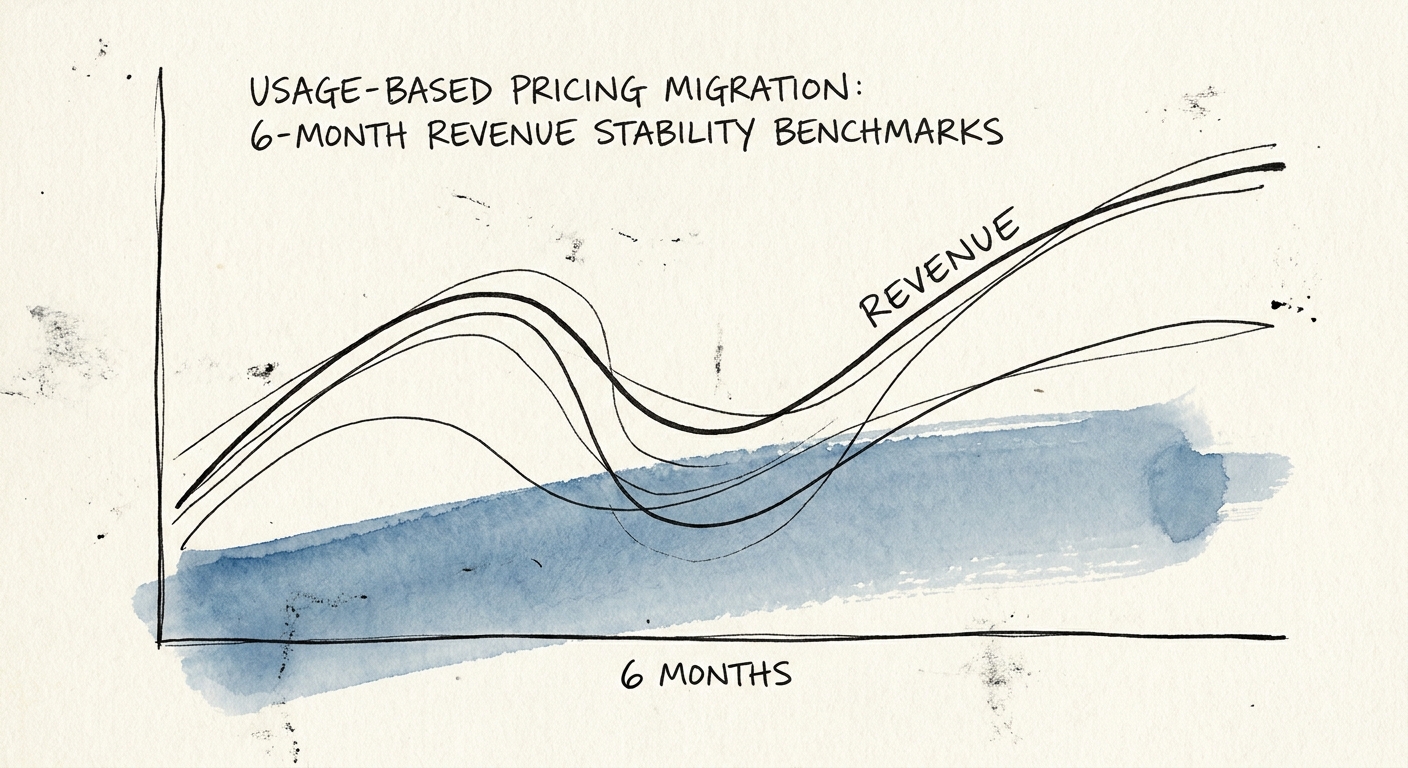
The 26% Trough: 6-Month Revenue Stability Benchmarks for Usage-Based Migrations
Migrating to usage-based pricing? Discover the 6-month revenue stability benchmarks, the predictable consumption trough, and how to protect your SaaS valuation.
26% Max Revenue Dip During Transition
BRIEF · UNIT ECONOMICS
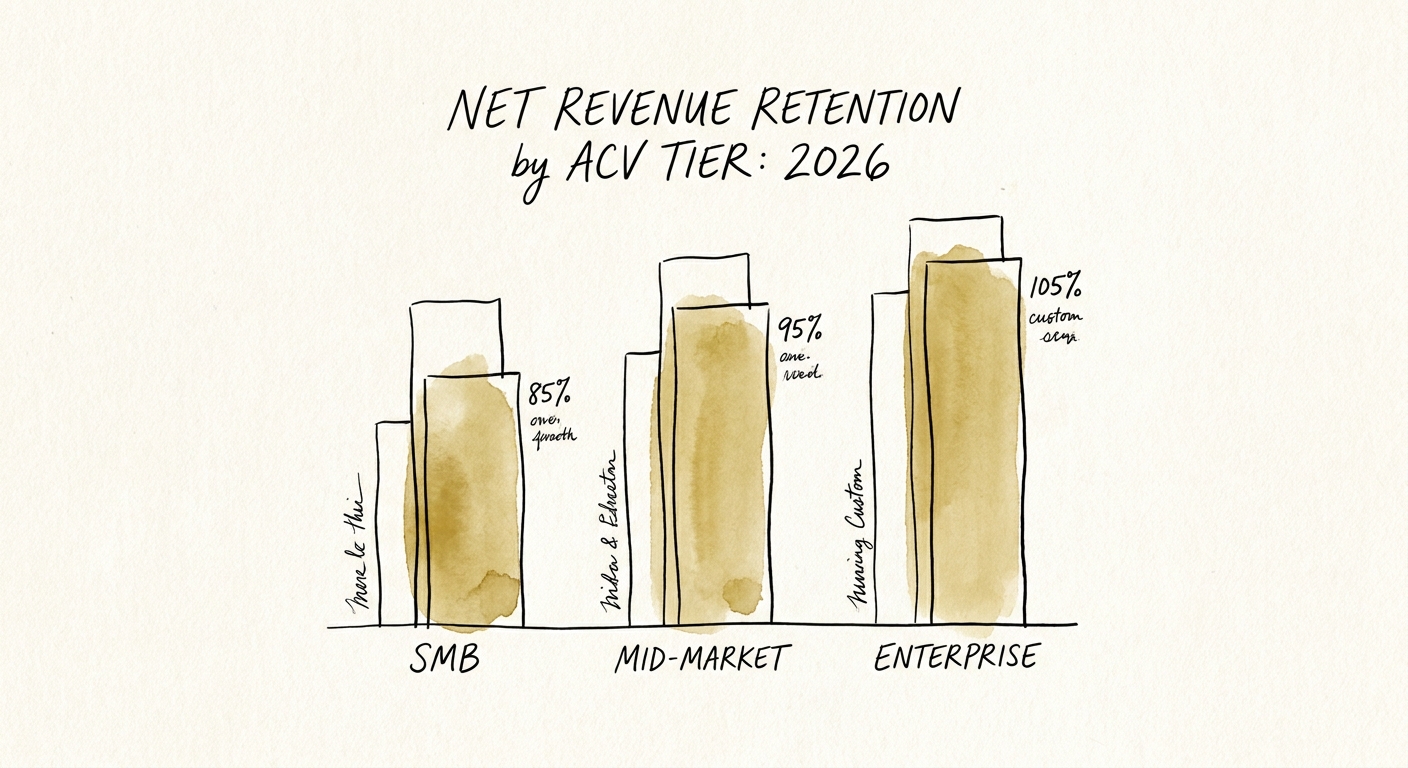
The Blended NRR Trap: Why Your 105% Retention Will Cost You 3 Valuation Turns
Why your blended 105% NRR is a lie. Discover the 2026 Net Revenue Retention benchmarks segmented by SMB, mid-market, and enterprise ACV tiers.
108% Median Mid-Market NRR
BRIEF · UNIT ECONOMICS
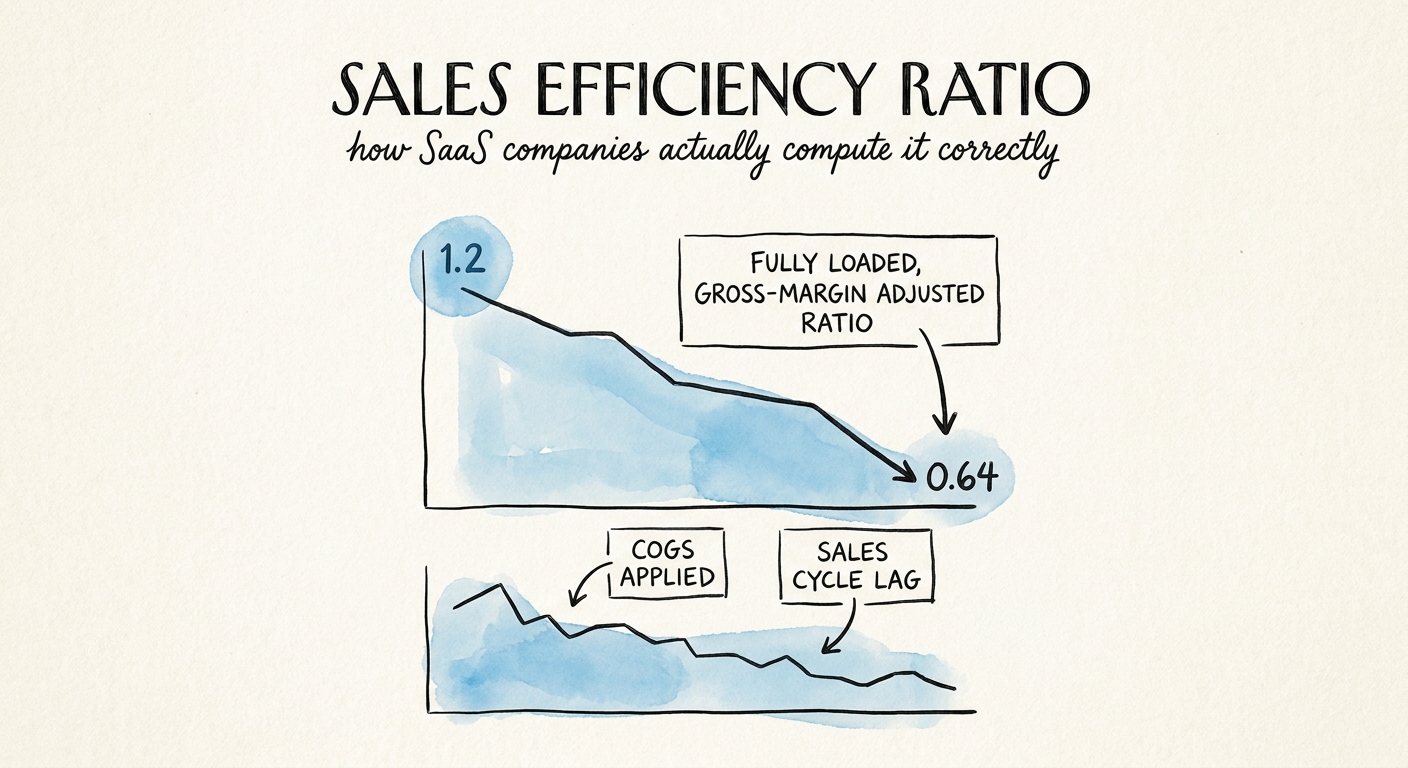
SaaS Sales Efficiency Ratio: How to Calculate the Magic Number
Learn how to calculate SaaS sales efficiency using the Magic Number, gross-margin adjustments, fully loaded Sales and Marketing spend, and sales-cycle lag.
0.75 Scaling Review Threshold
BRIEF · REVENUE ARCHITECTURE
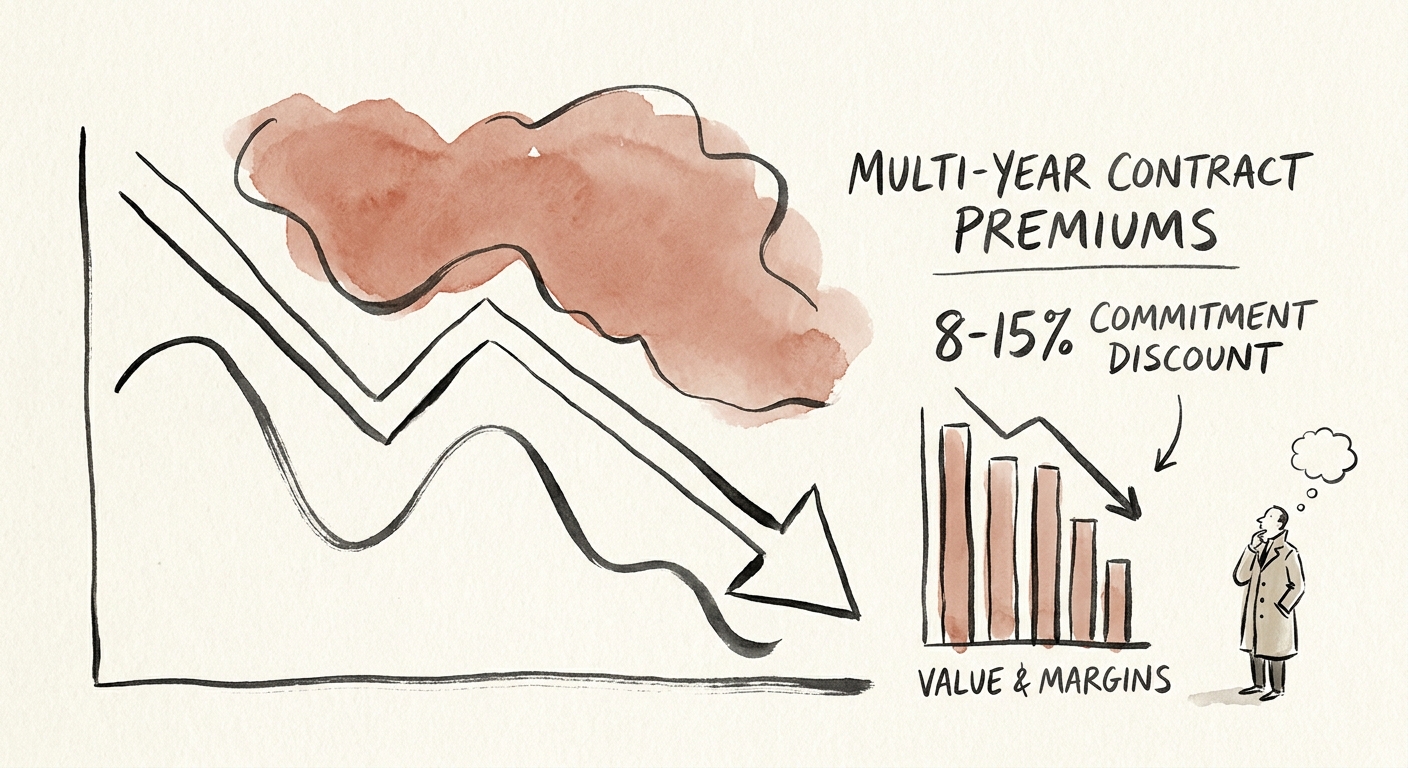
The Commitment Trap: Why Your 15% Multi-Year Discount Is Killing Your Exit Multiple
Why offering 8-15% discounts for multi-year software contracts destroys NRR, suppresses gross margins, and kills your enterprise value at exit.
44% Effective Cost of Capital
BRIEF · MIGRATION & INTEGRATION
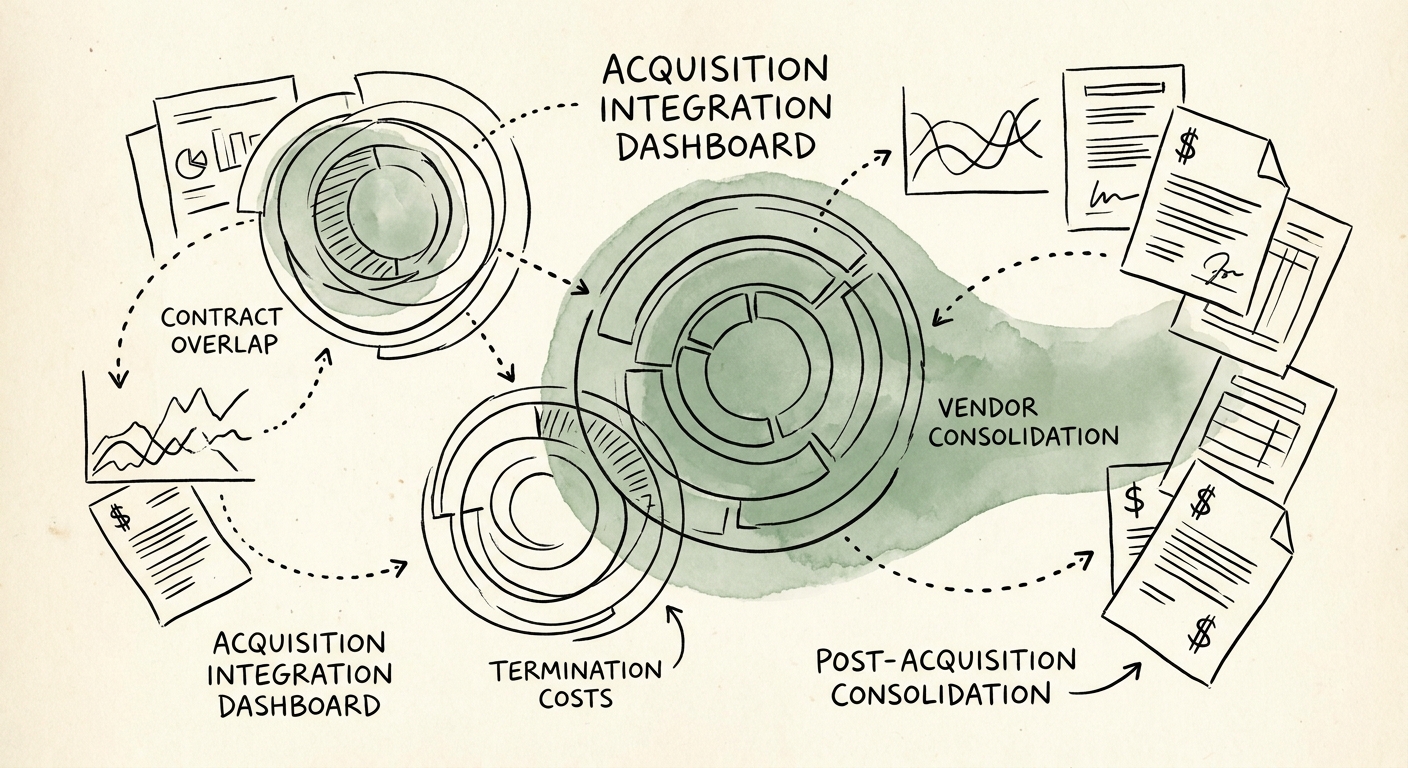
The Inactive License Tax: Why Post-Acquisition Vendor Consolidation Fails
PE sponsors model a 15% IT vendor spend reduction post-acquisition, but termination penalties and overlapping SaaS contracts often destroy M&A deal value.
82% of M&A roll-ups see a 12% increase in redundant software costs during year one
BRIEF · REVENUE ARCHITECTURE
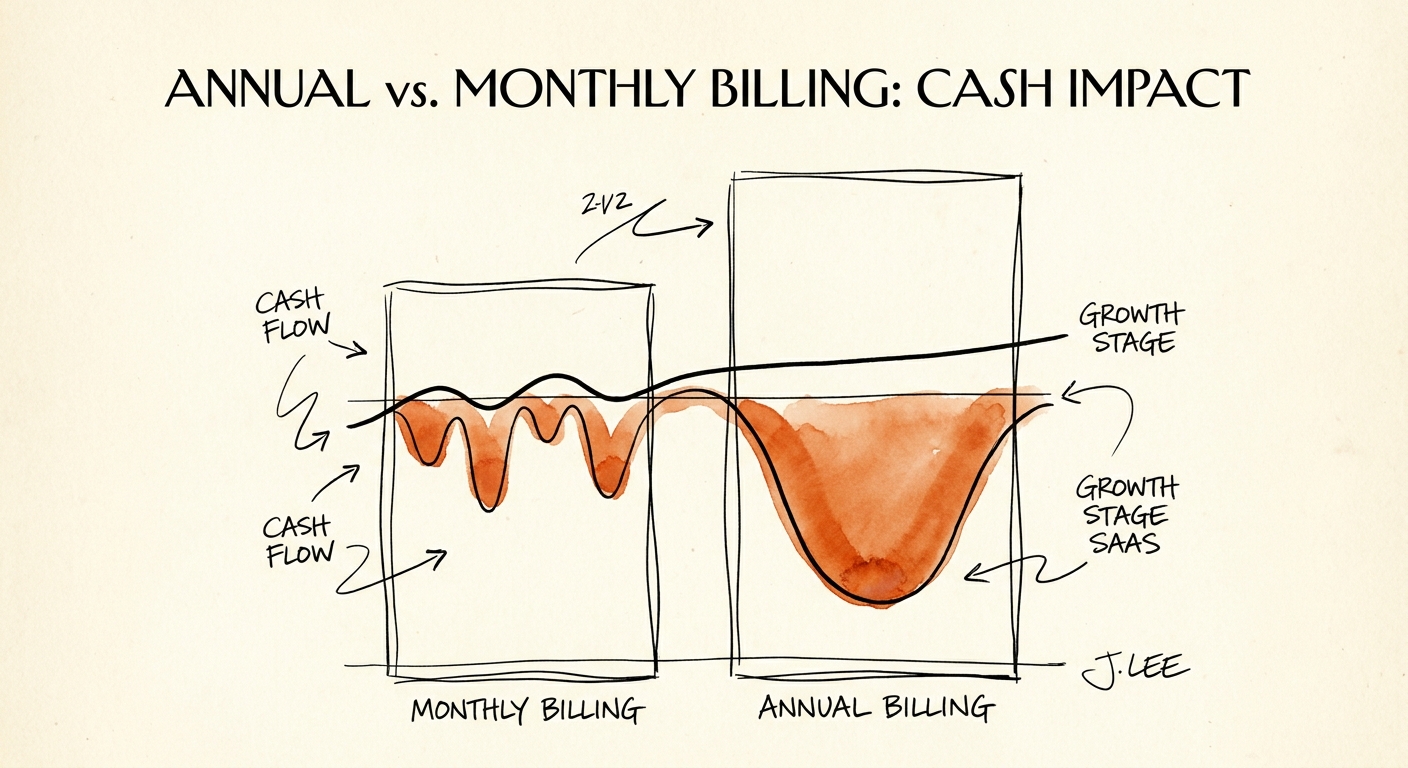
Your Series B SaaS Is Lending Customers Money — Monthly Billing Is the Loan
A $10M ARR SaaS billing monthly carries ~$2.4M more working capital than billing annually. Here is the math, the churn cost, and the exact pivot playbook.
$2.4M Working Capital Saved per $10M ARR
BRIEF · GTM EXECUTION
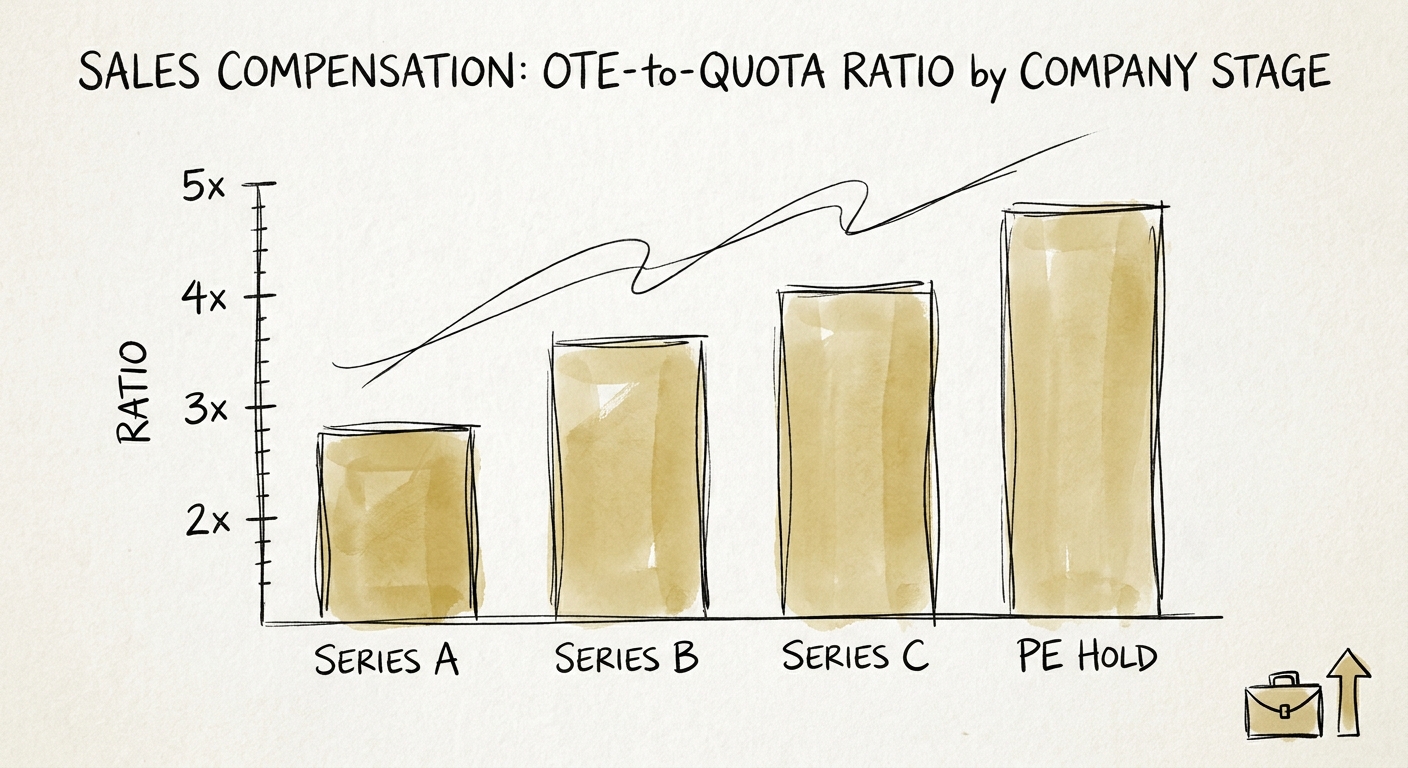
The Quota Ratio That Fits a Series A Will Quietly Bankrupt Your Series B
The 5x OTE-to-quota rule breaks at every funding stage. Here's the realistic ratio for Seed, Series B, and PE-backed SaaS in 2026 - and the math behind it.
32% Hidden EBITDA margin bleed caused by static quota ratios
BRIEF · MIGRATION & INTEGRATION
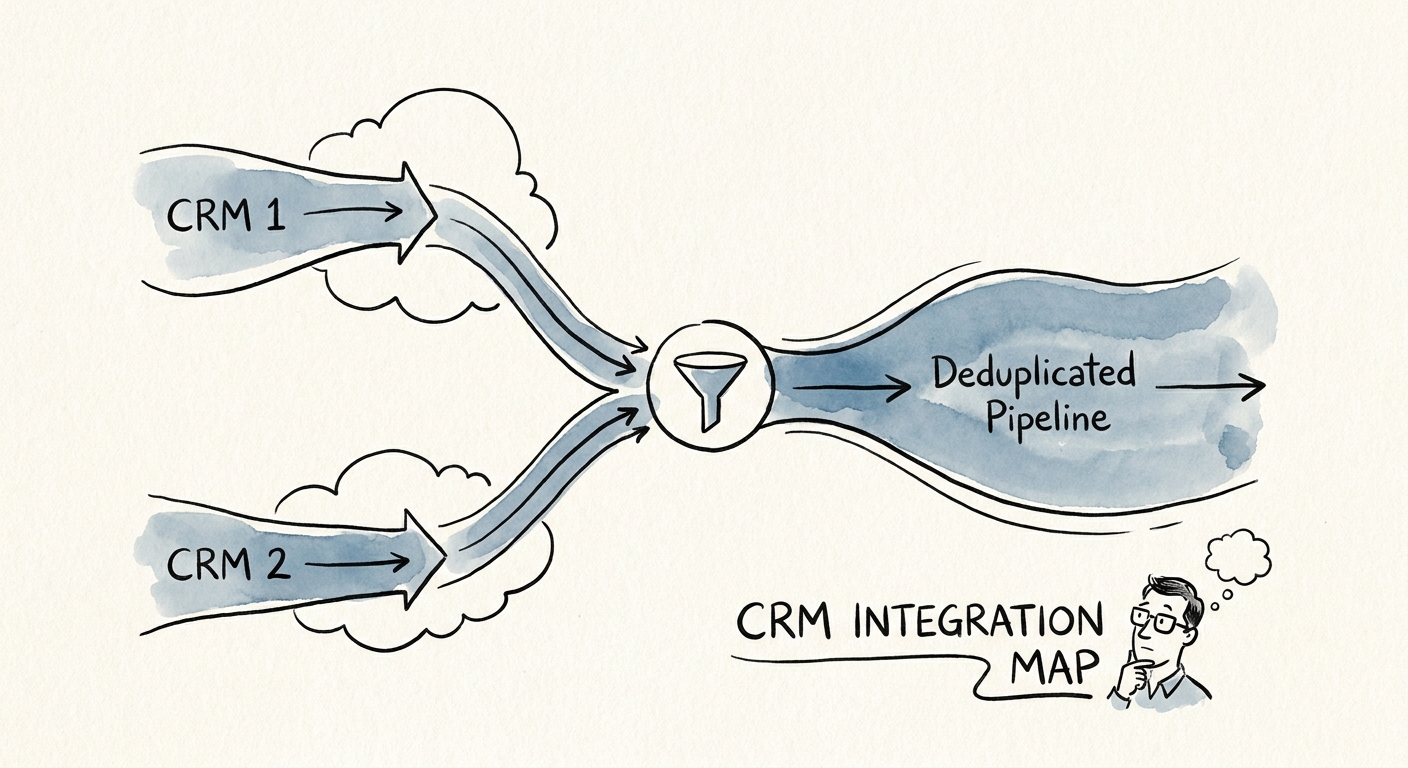
The Salesforce-to-Salesforce CRM Merger: Why Your Pipeline Forecast is a Post-Acquisition Hallucination
Merging two Salesforce instances usually triggers a 20% to 30% drop in pipeline visibility. Learn how to handle deduplication and pipeline blending to protect EBITDA.
30% Drop in Pipeline Visibility
BRIEF · FINANCIAL INFRASTRUCTURE
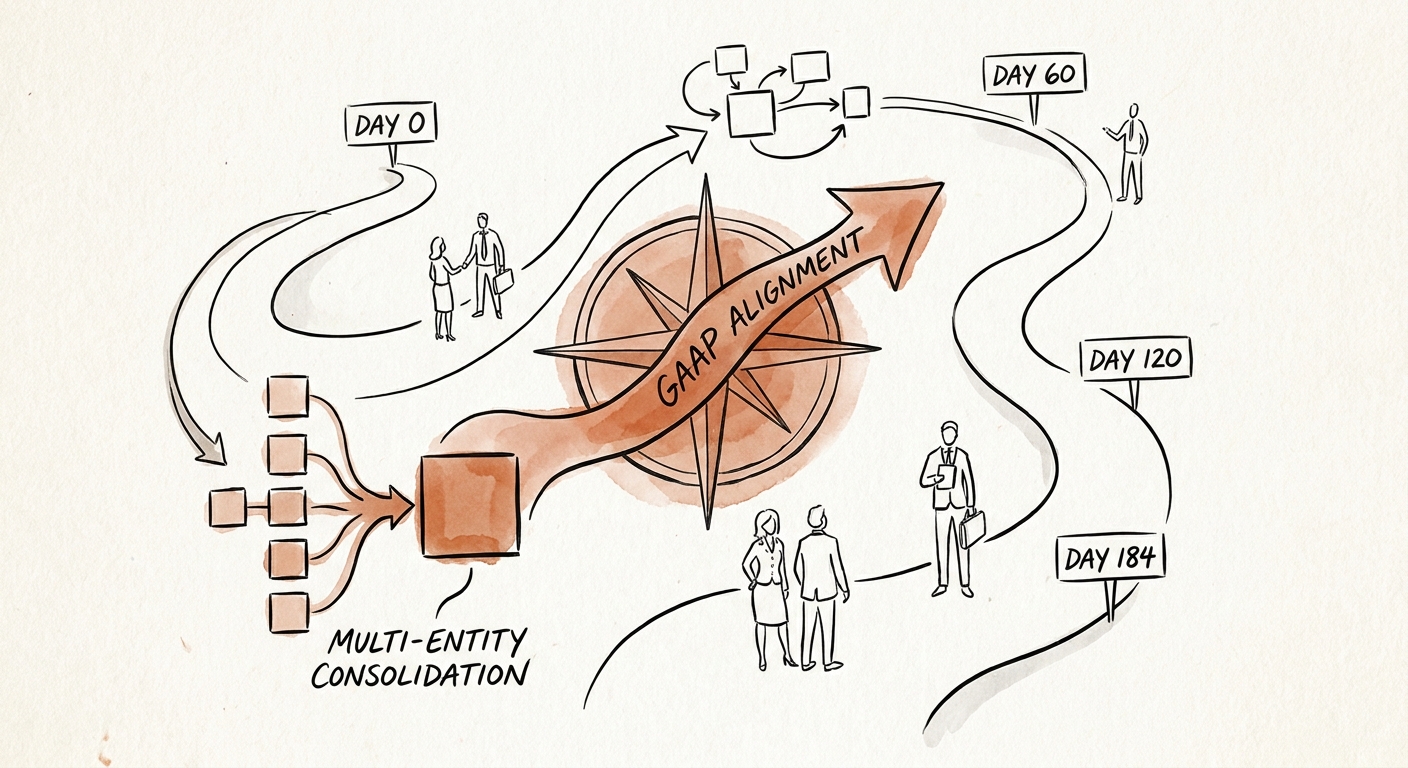
Multi-Entity Consolidation: GAAP-Alignment Timeline Benchmarks for 2026
Discover why your 90-day multi-entity consolidation plan is bleeding EBITDA, and learn the true timeline benchmarks for GAAP alignment in PE roll-ups.
184 Days to true GAAP alignment