BRIEF · UNIT ECONOMICS
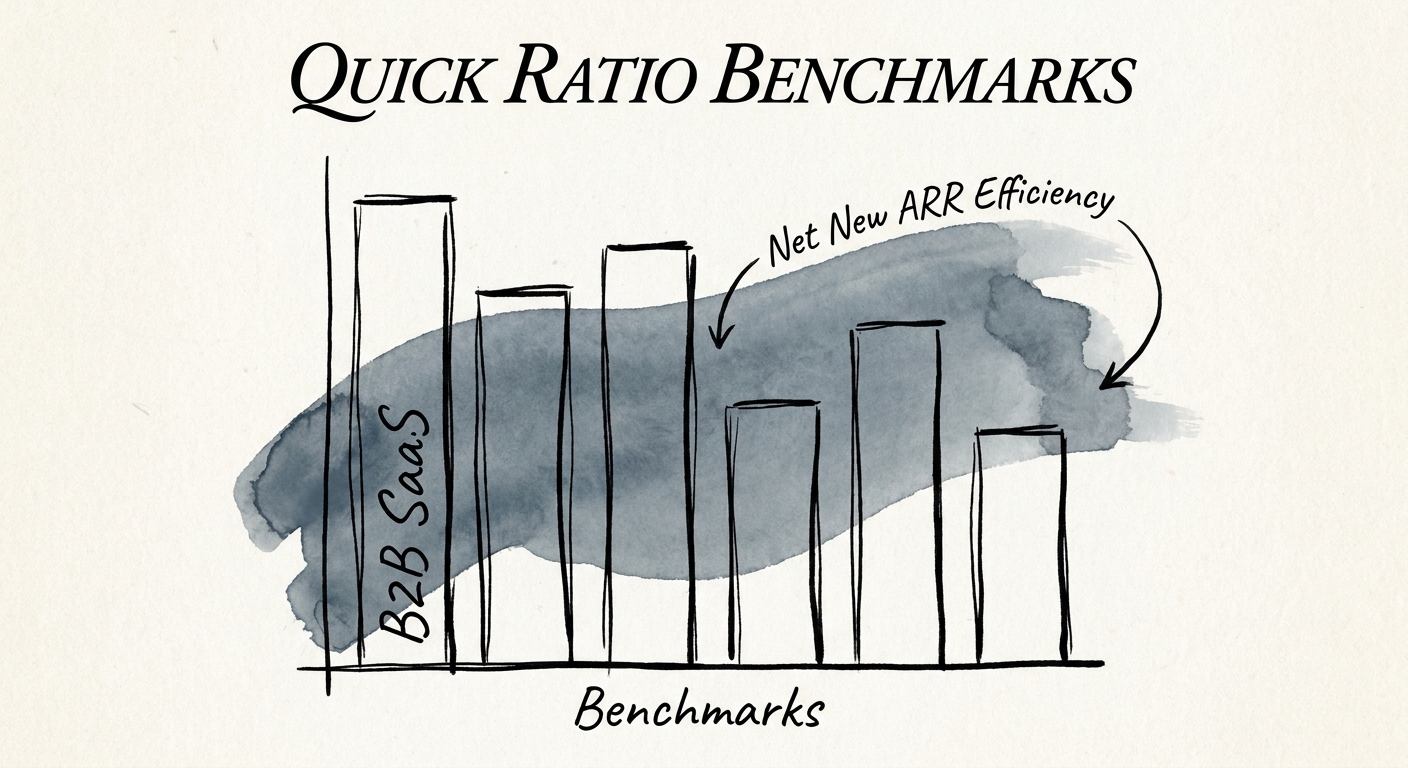
SaaS Quick Ratio Benchmarks: Why Healthy Growth Still Needs Efficiency
A 4.0 SaaS Quick Ratio can still hide expensive growth. Learn how to separate expansion ARR, new-logo ARR, contraction, churn, and CAC payback.
4.0 Traditional Quick Ratio Benchmark
BRIEF · MIGRATION & INTEGRATION
The Weekly Integration Dashboard: 12 Metrics That Catch Synergy Leakage Before the Monthly Close Does
A monthly close tells you synergies slipped 30 days ago. Here are the 12 weekly leading indicators that let PE operating partners intervene on Monday, not the 15th.
70% Projected M&A Synergies Fail to Materialize
BRIEF · PROCESS DOCUMENTATION
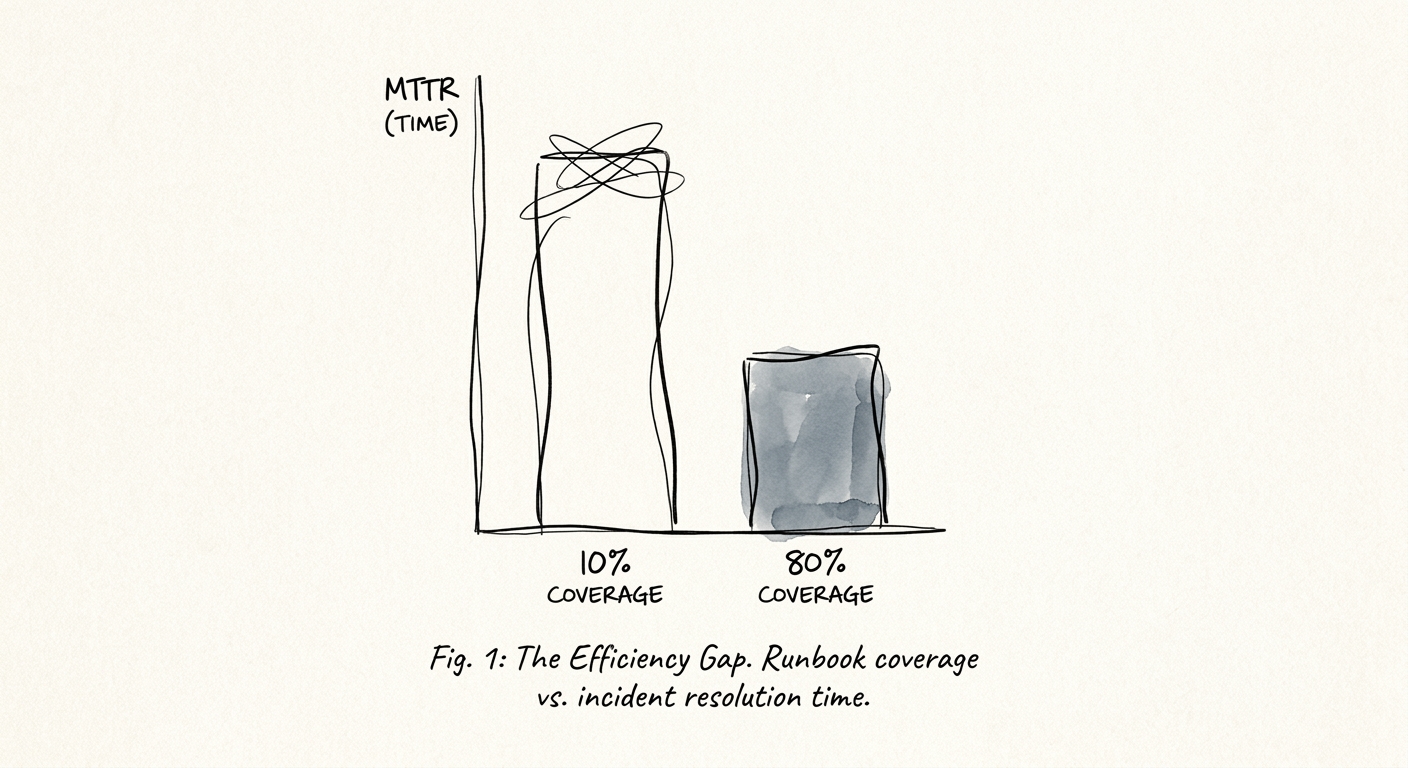
Runbook Coverage: The Only Incident Metric Private Equity Buyers Trust
Why tracking MTTR is a lagging strategy, and how achieving 80% runbook coverage eliminates the $210,000 coordination tax in scaling engineering teams.
15 Minutes burned on the undocumented 'coordination tax'
BRIEF · UNIT ECONOMICS
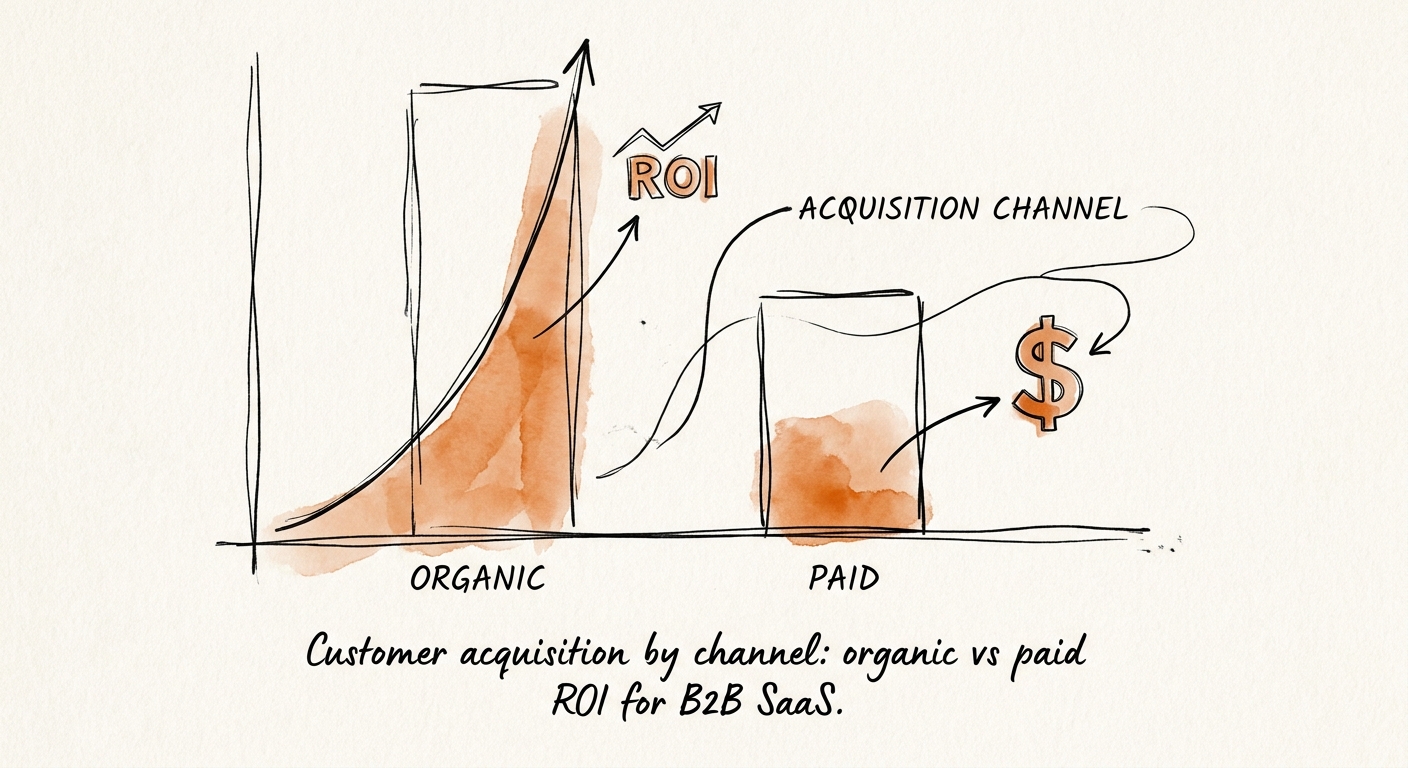
Customer Acquisition by Channel: Why Organic ROI is Crushing Paid for B2B SaaS
Discover why relying on paid search in 2026 creates a 42% margin penalty for B2B SaaS, and how to pivot to a high-ROI organic customer acquisition engine.
4.5:1 Organic LTV:CAC Ratio
BRIEF · TECHNICAL DEBT
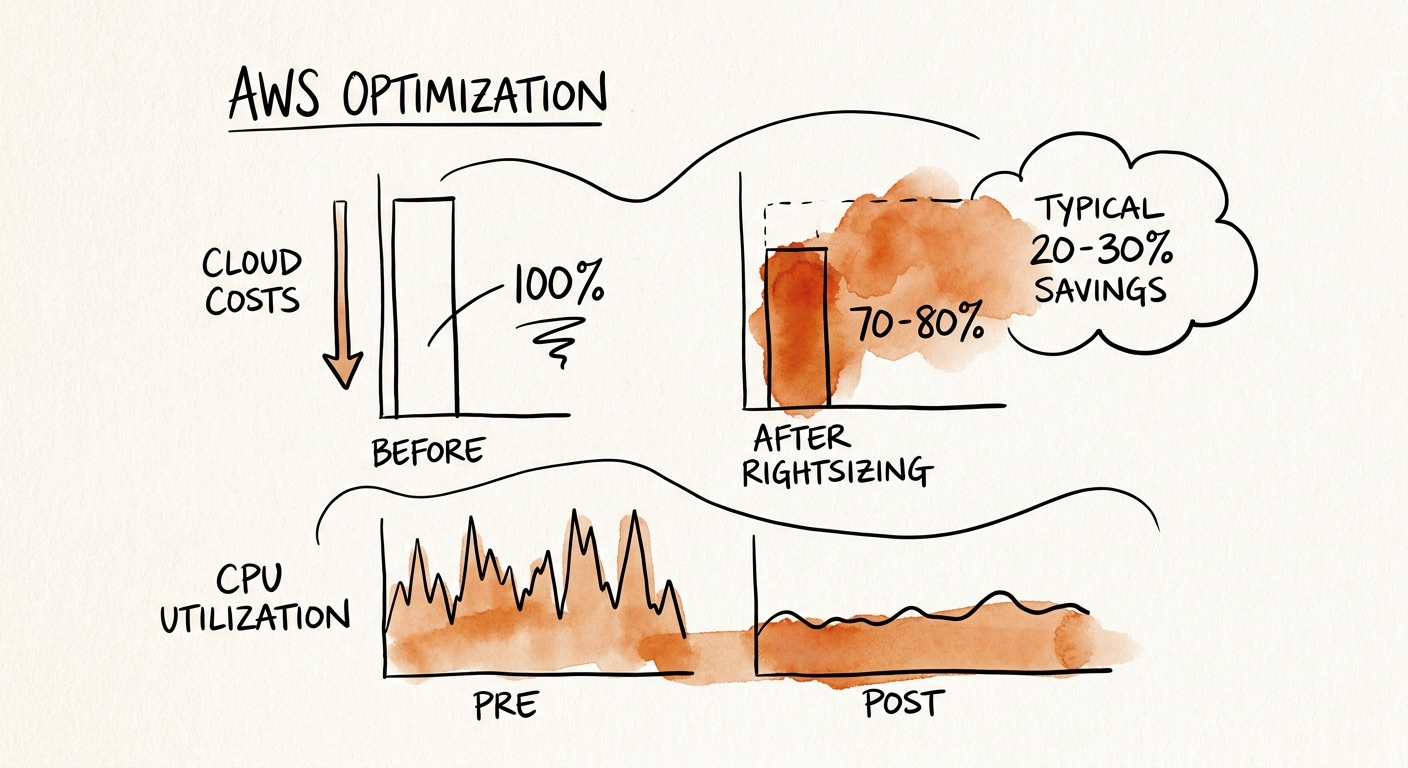
The 30% EBITDA Leak: Why Cloud Rightsizing Is Your Most Urgent Turnaround Lever
Discover how private equity operators unlock 20-30% in typical cloud cost savings through rightsizing, reclaiming EBITDA from AWS, Azure, and GCP waste.
30% Average Cloud Spend Wasted on Over-Provisioned Infrastructure
BRIEF · UNIT ECONOMICS
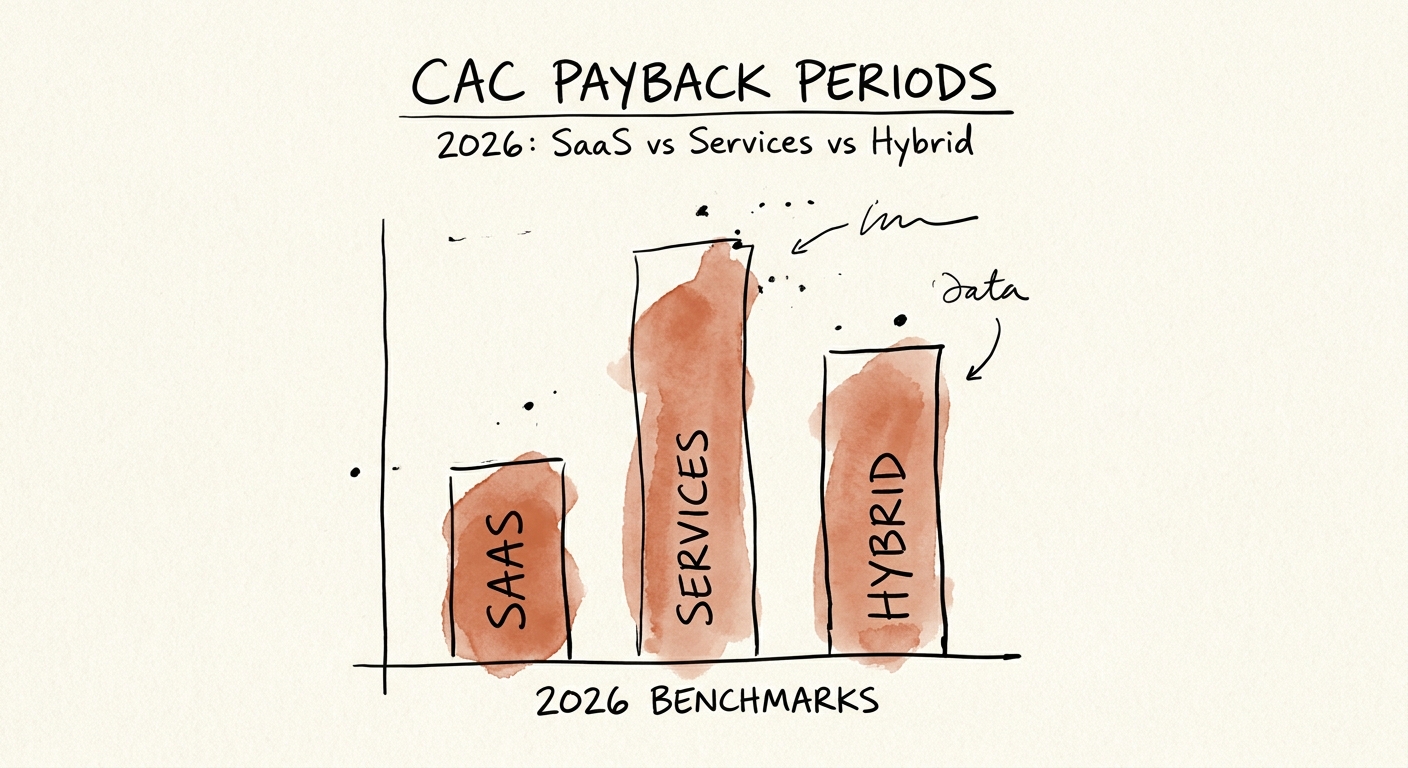
SaaS vs. Services vs. Hybrid: What a "14-Month" CAC Payback Is Hiding in 2026
2026 CAC payback benchmarks for SaaS (21.4 mo), services (4.2 mo), and hybrid models — and why one blended number hides a cash trough acquirers will find.
21.4 Months average B2B SaaS CAC Payback in 2026
BRIEF · PROCESS DOCUMENTATION
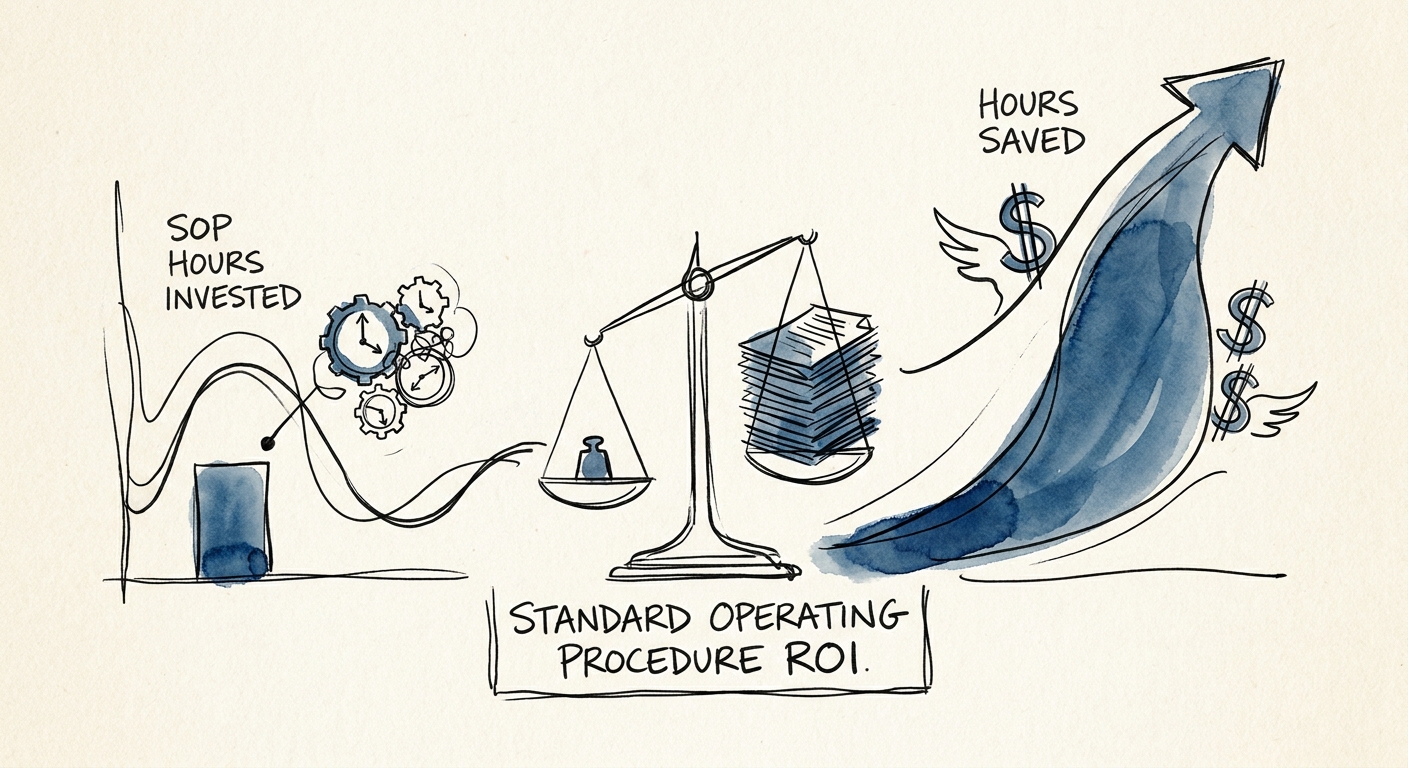
Standard Operating Procedure ROI: The Brutal Math of Hours Saved vs. Hours Invested
Discover the true ROI of Standard Operating Procedures (SOPs). We break down the math of hours invested versus hours saved, and how undocumented processes destroy valuation.
1,300% ROI on Year-One SOP Documentation
BRIEF · MIGRATION & INTEGRATION
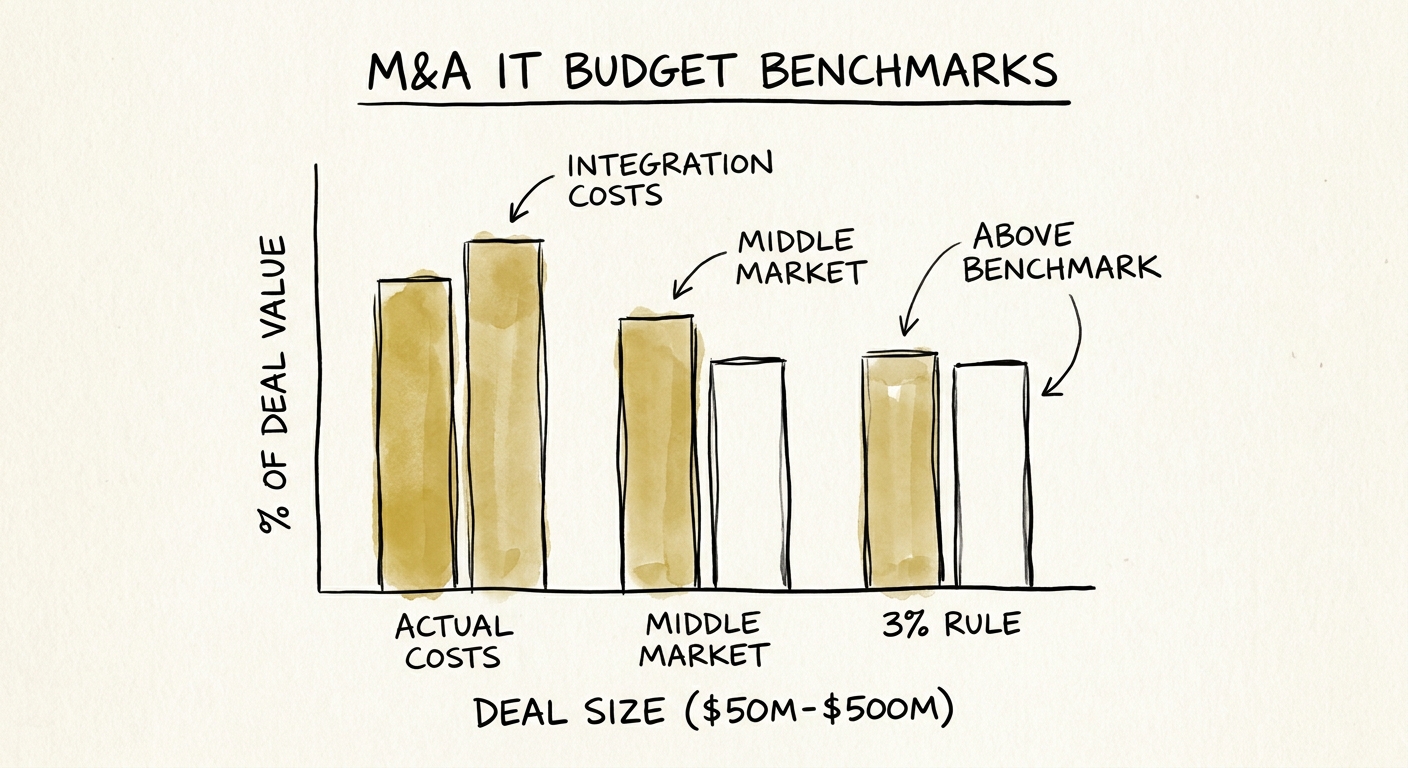
The 3% IT Integration Rule Is Quietly Wrecking $50M-$500M PE Deals
Budgeting 3% of deal value for IT integration is how mid-market PE deals stall at day 100. Here's how to build the number bottom-up instead.
64% of mid-market PE acquisitions functionally broken on day 100 due to underfunded IT budgets
BRIEF · TECHNICAL DEBT
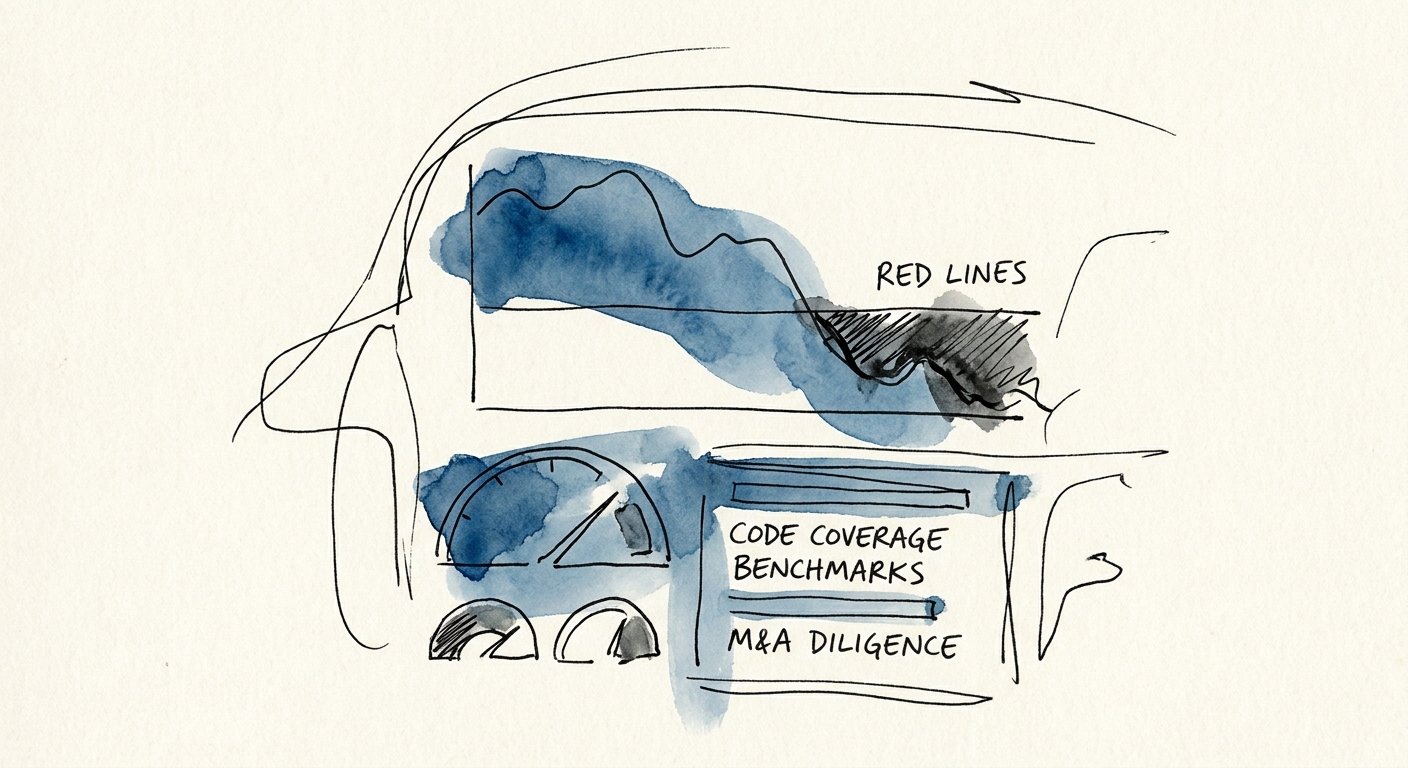
Code Coverage in M&A Diligence: Why 94% Can Cost You a Turn
A high coverage number can hide an untested billing engine. The exact code-coverage thresholds, trend signals, and distribution checks PE buyers run on SaaS deals.
70% Optimal Target Code Coverage
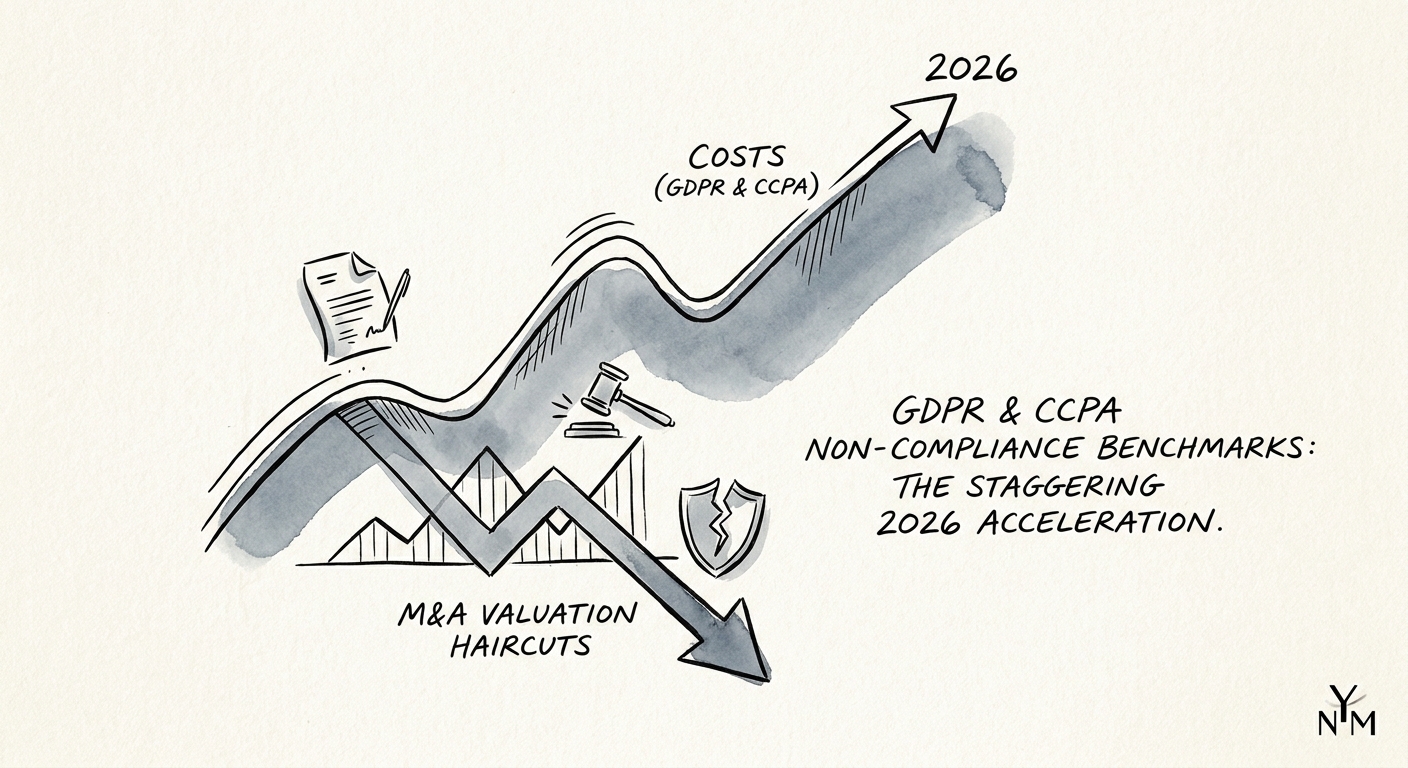
BRIEF · COMPLIANCE & SECURITY
Why GDPR and CCPA Non-Compliance Costs More Than the Fine
Discover the true cost of GDPR and CCPA non-compliance in 2026. Learn why private equity buyers apply a 15% valuation haircut for privacy architecture failures.
$10.22M IBM Reported Average U.S. Breach Cost
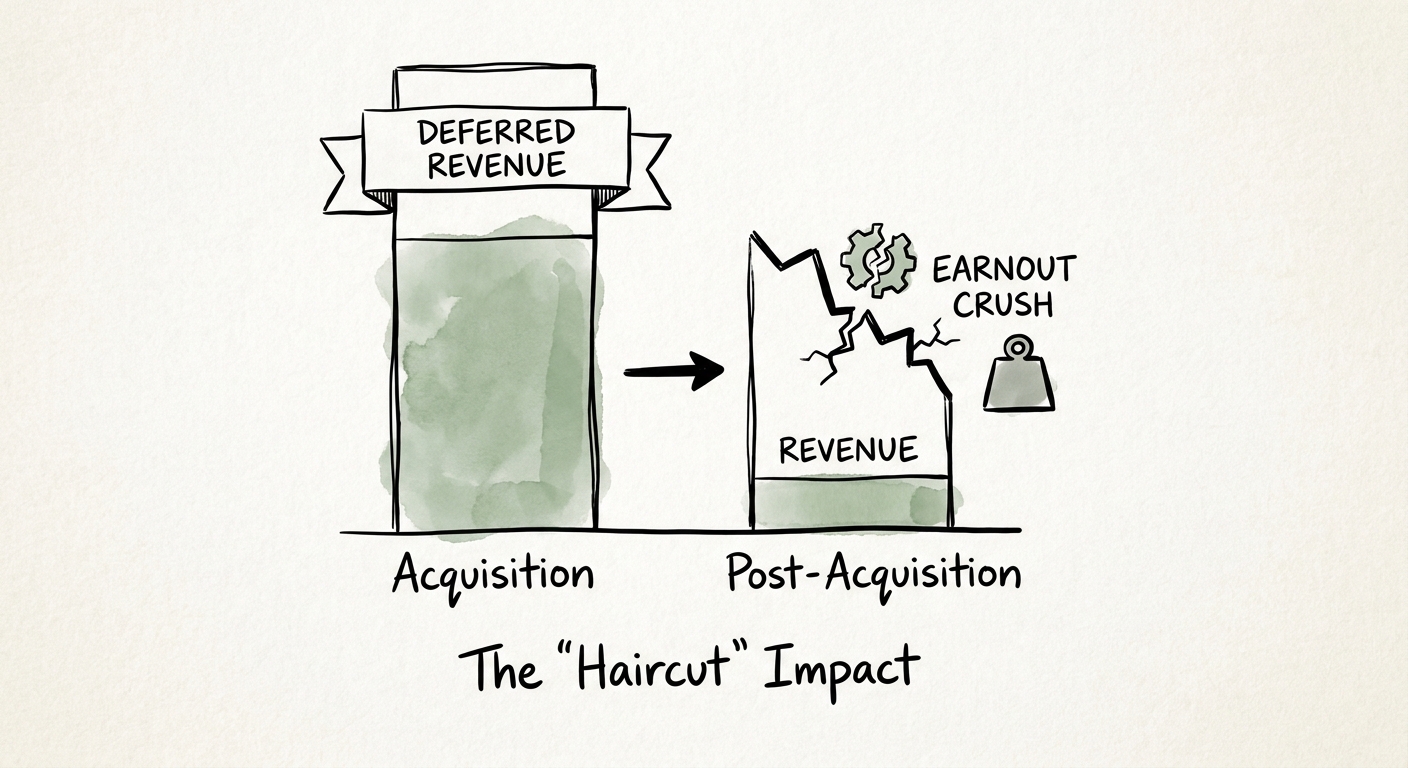
BRIEF · FINANCIAL INFRASTRUCTURE
The $78,000 That Vanishes: How the Deferred Revenue Haircut Quietly Eats Your SaaS Earnout
Annual-upfront SaaS founders lose earnouts to a purchase-accounting write-down they never see coming. Here is the exact math, and the LOI language that stops it.
40% Potential earnout loss from deferred revenue haircuts
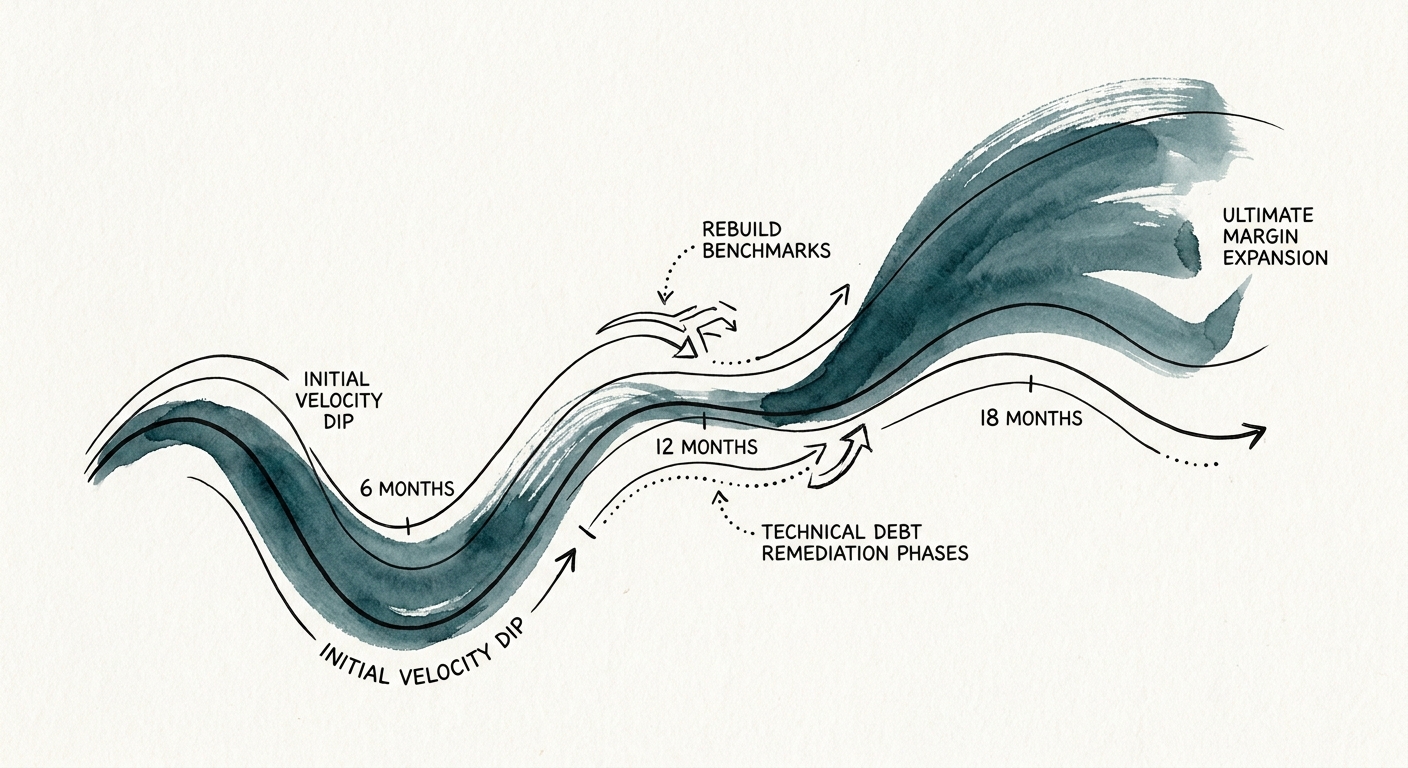
BRIEF · TECHNICAL DEBT
Technical Debt Remediation Timeline: The 6-18 Month Rebuild Benchmarks
Many grand rewrites fail to deliver ROI. Learn the exact 6-18 month technical debt remediation timeline to protect your valuation and expand margins.
68% Failure rate of grand rewrite modernization initiatives
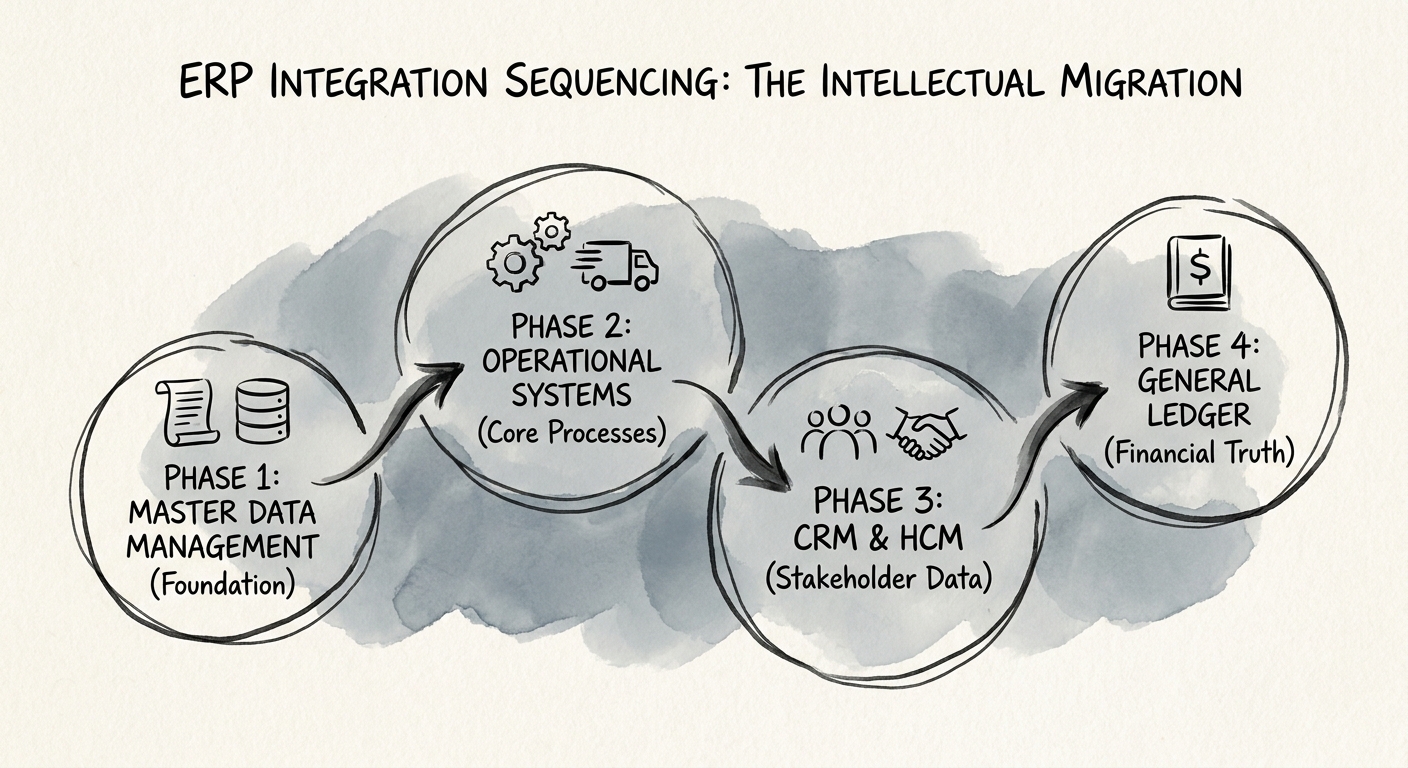
BRIEF · MIGRATION & INTEGRATION
Why the General Ledger Should Be the Last System You Migrate After an Acquisition
The board wants financial visibility, so sponsors migrate the GL first. That sequence corrupts the data feeding it. Here is the order that actually protects deal value.
75% of ERP integrations fail to realize their business case
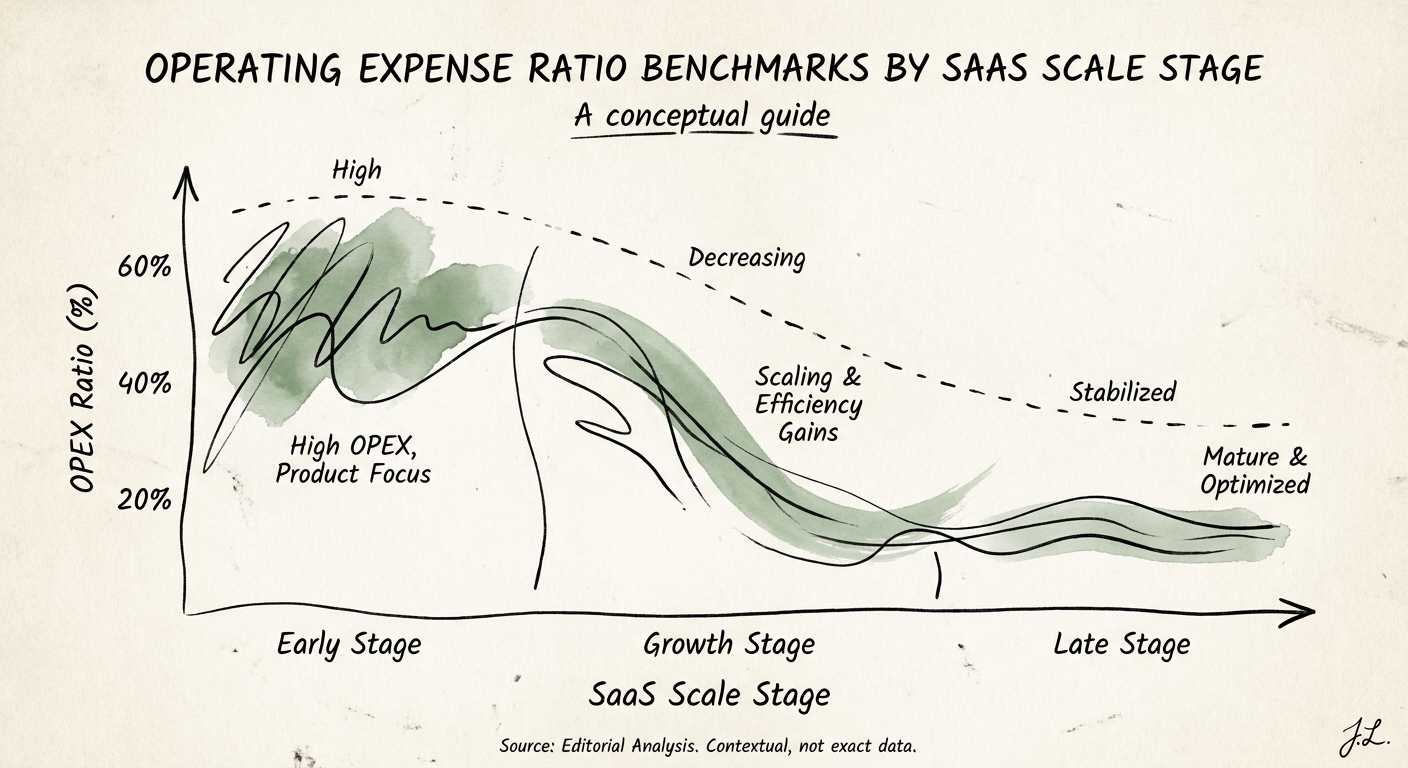
BRIEF · FINANCIAL INFRASTRUCTURE
SaaS Operating Expense Ratio Benchmarks by Scale Stage
Learn how R&D, Sales and Marketing, and G&A ratios should change as B2B SaaS companies move from sub-$20M ARR to $50M+ ARR.
3 Core Operating Expense Ratios
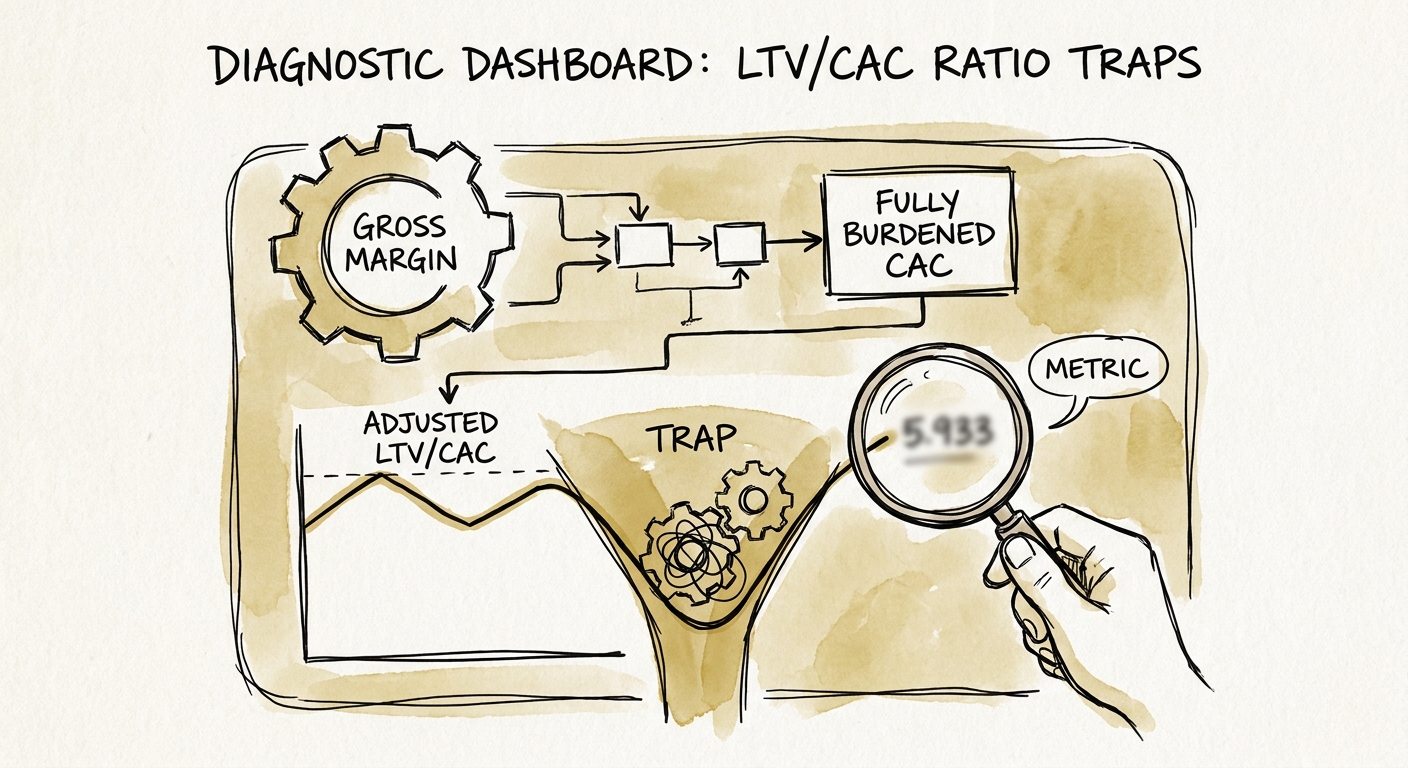
BRIEF · UNIT ECONOMICS
The LTV/CAC Ratio Lie: Traps That Flatter Your Metric and Kill Your Valuation
Discover the hidden traps inflating your LTV/CAC ratio. Learn how PE firms adjust gross margins, fully burden CAC, and apply cohort churn to reveal true SaaS unit economics.
55% PE Due Diligence LTV/CAC Discount
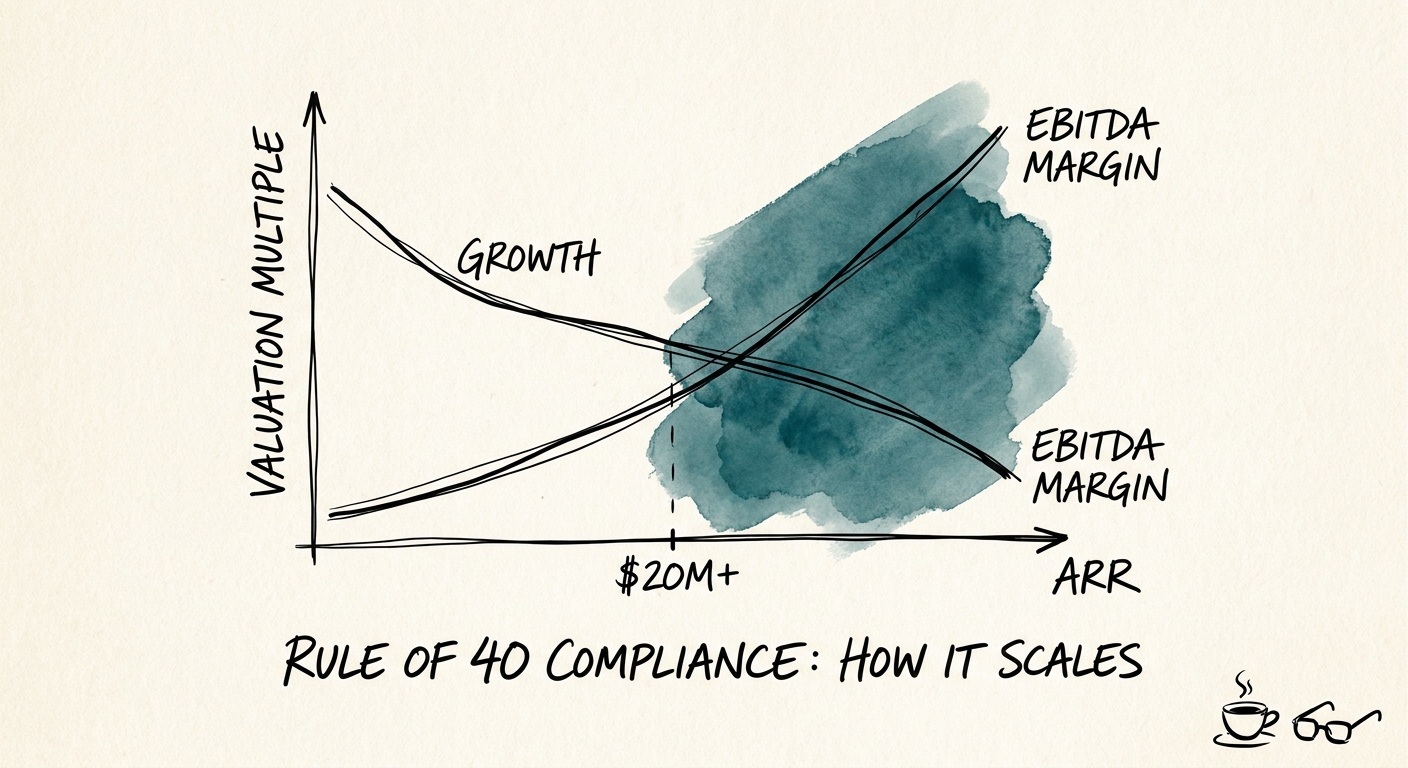
BRIEF · UNIT ECONOMICS
The Rule of 40 Fallacy: Why Scaling Too Profitably Will Kill Your Exit Multiple
Forcing Rule of 40 compliance before $20M ARR can destroy 30% of your exit valuation. Discover how growth and profitability actually scale by revenue stage.
30% Enterprise Value Haircut for Premature Profitability
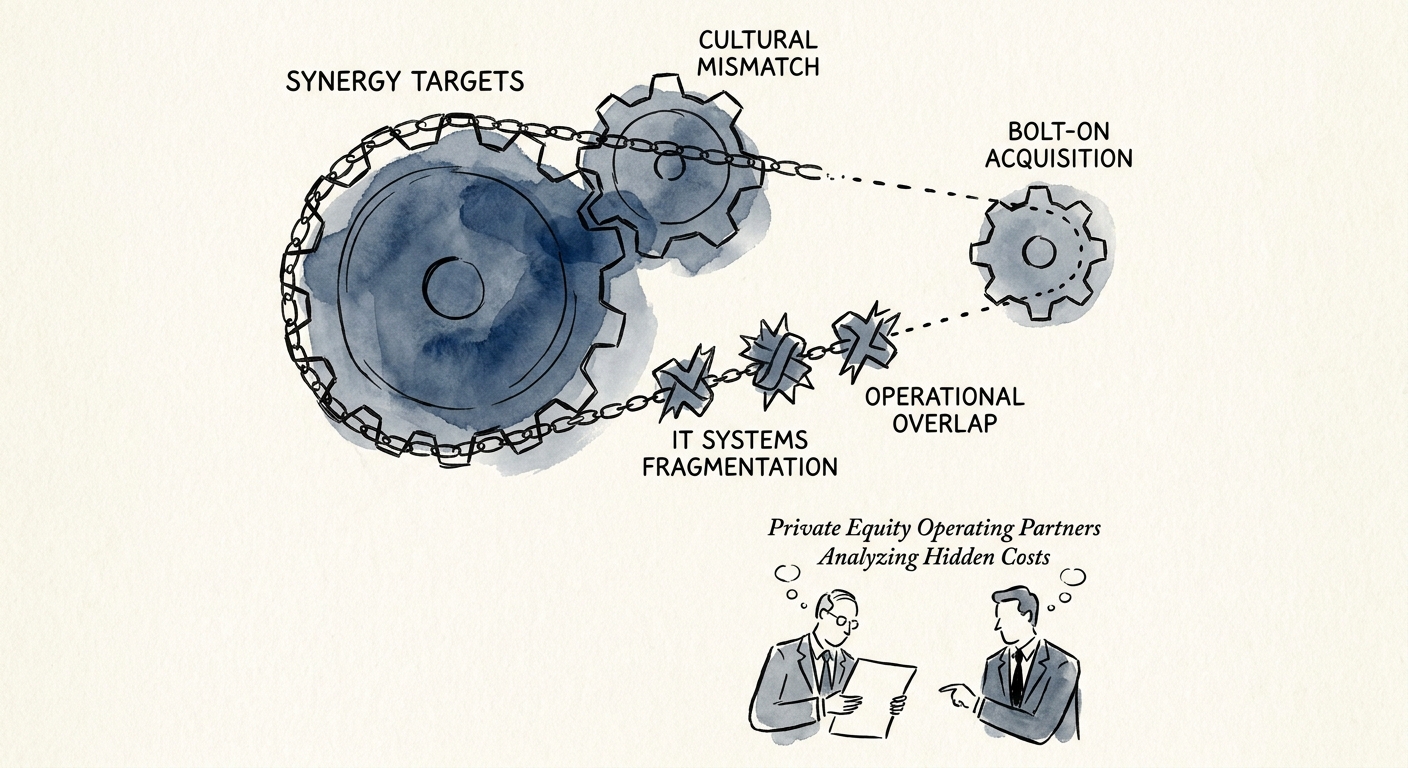
BRIEF · MIGRATION & INTEGRATION
The Bolt-On That Looked Free: 3 Integration Costs That Eat the Synergy You Paid For
The synergy model never priced the developer slowdown, the Month 6 churn cliff, or the comp-plan exodus. Where bolt-on EBITDA actually leaks — and how to plug it.
72% of bolt-on acquisitions bleed EBITDA in their first 18 months
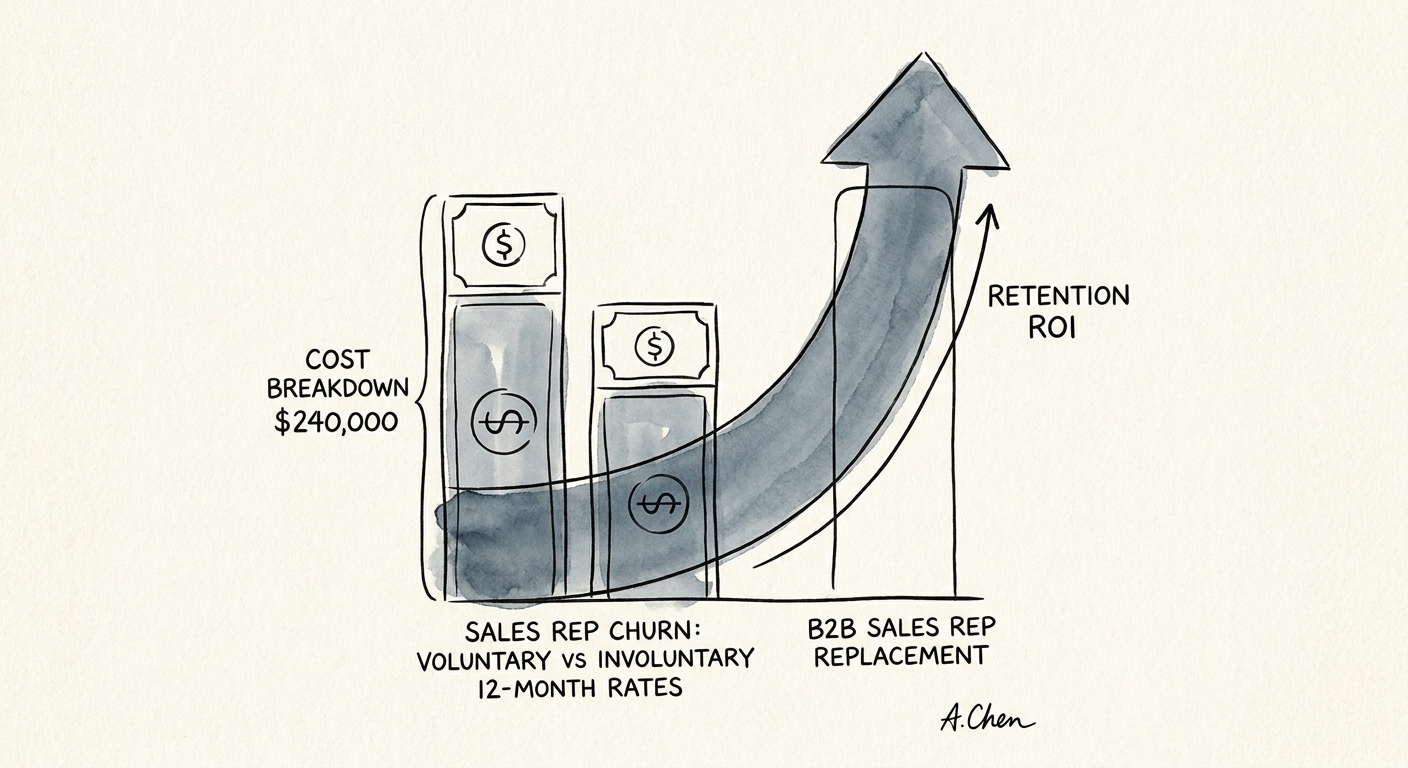
BRIEF · TEAM & HIRING
Sales Rep Churn: The $240k Mistake Hidden in Your Voluntary vs. Involuntary 12-Month Rates
A deep dive into 12-month B2B sales rep churn rates. Learn why treating 35% turnover as normal destroys EBITDA, and how to fix voluntary vs involuntary exits.
$240,000 Average total cost to replace an enterprise B2B sales rep, factoring in lost pipeline and ramp time.
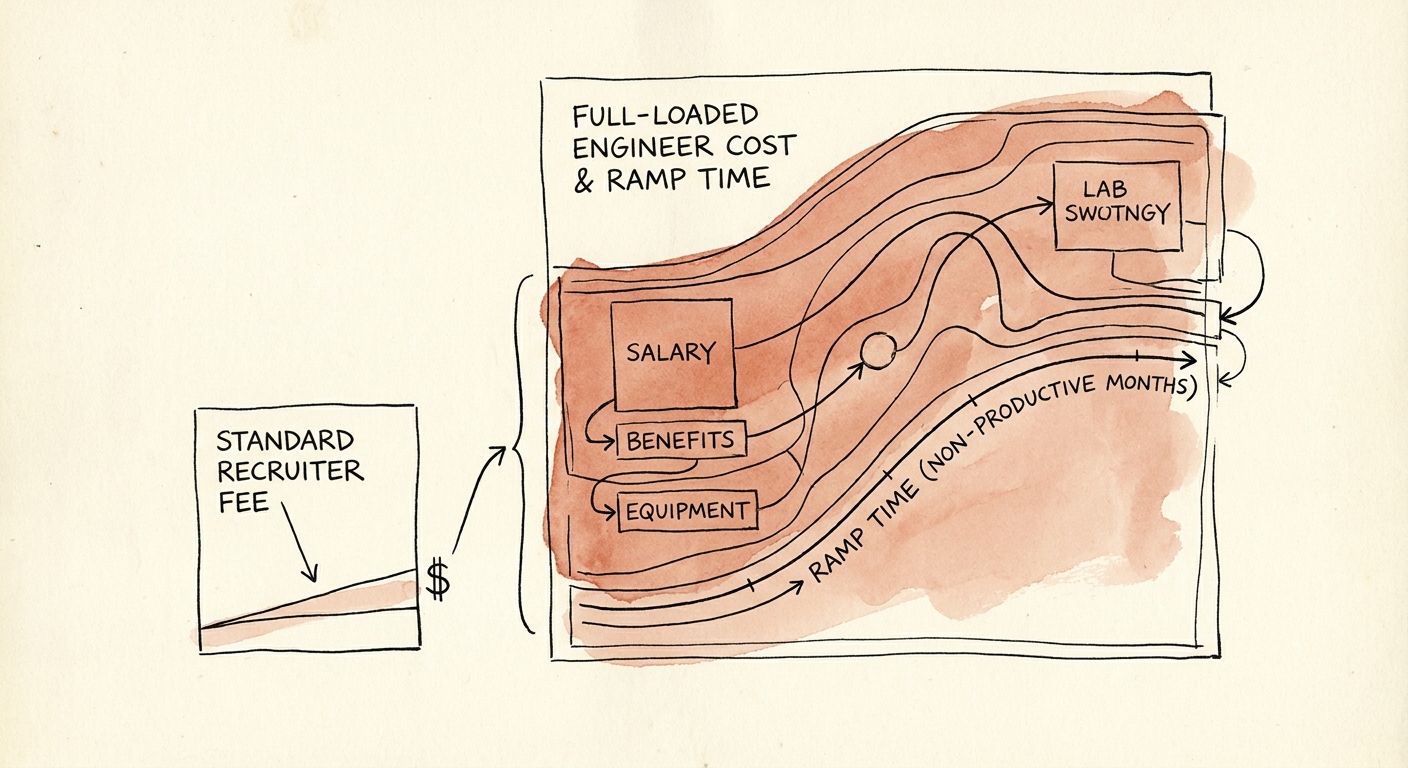
BRIEF · TEAM & HIRING
The $240,000 Engineer: What Hiring a Senior Dev Actually Costs Before They Ship a Line
The 20% agency fee is the cheap part. Here's the real fully-loaded cost of a senior engineer hire — interview hours, the ramp-period velocity tax, and how to cut it.
$240k Fully-Loaded Hire Cost
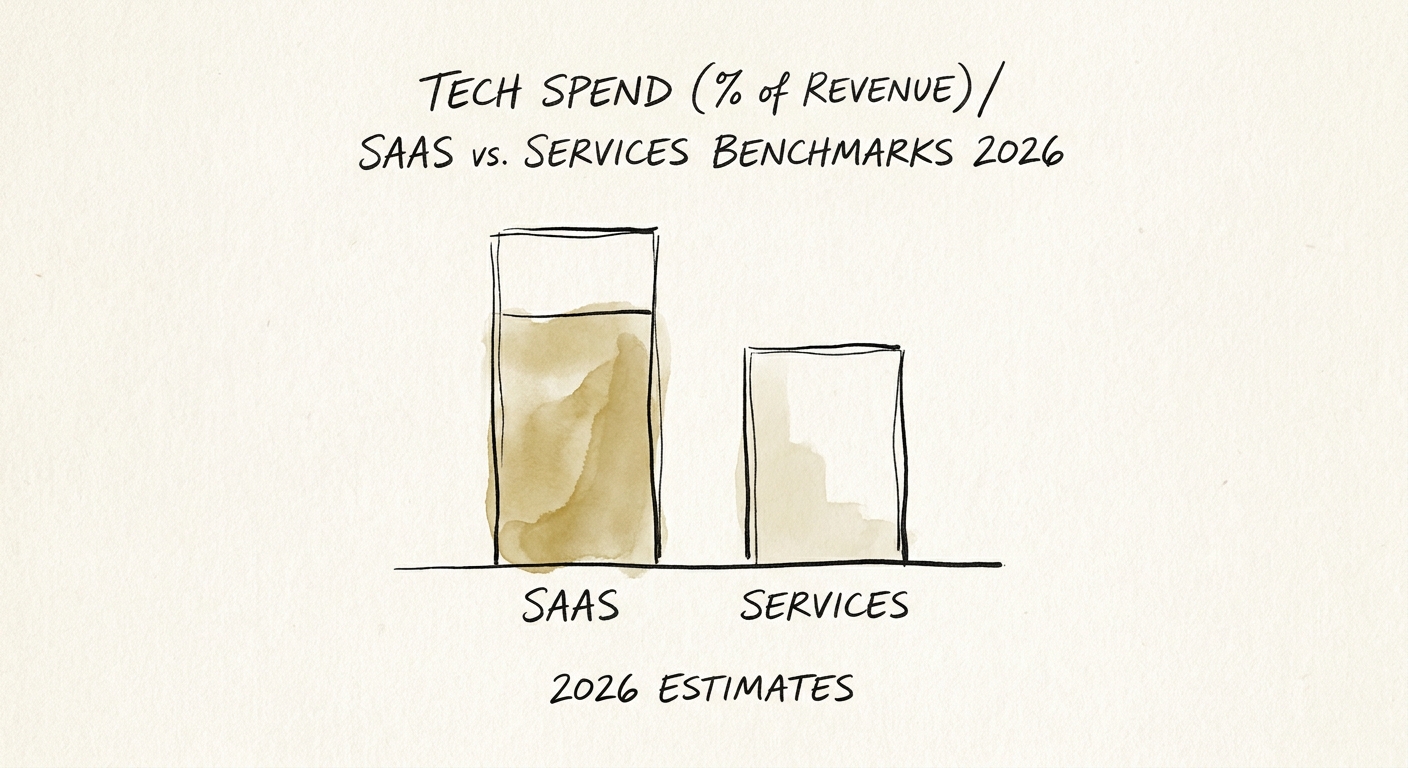
BRIEF · FINANCIAL INFRASTRUCTURE
Tech Spend as Percentage of Revenue: SaaS vs. Services Benchmarks (2026)
Compare tech spend as a percentage of revenue for SaaS, services, and mid-market operators. See when IT budget turns into margin drag.
11% The 'Danger Zone' for Services IT Spend
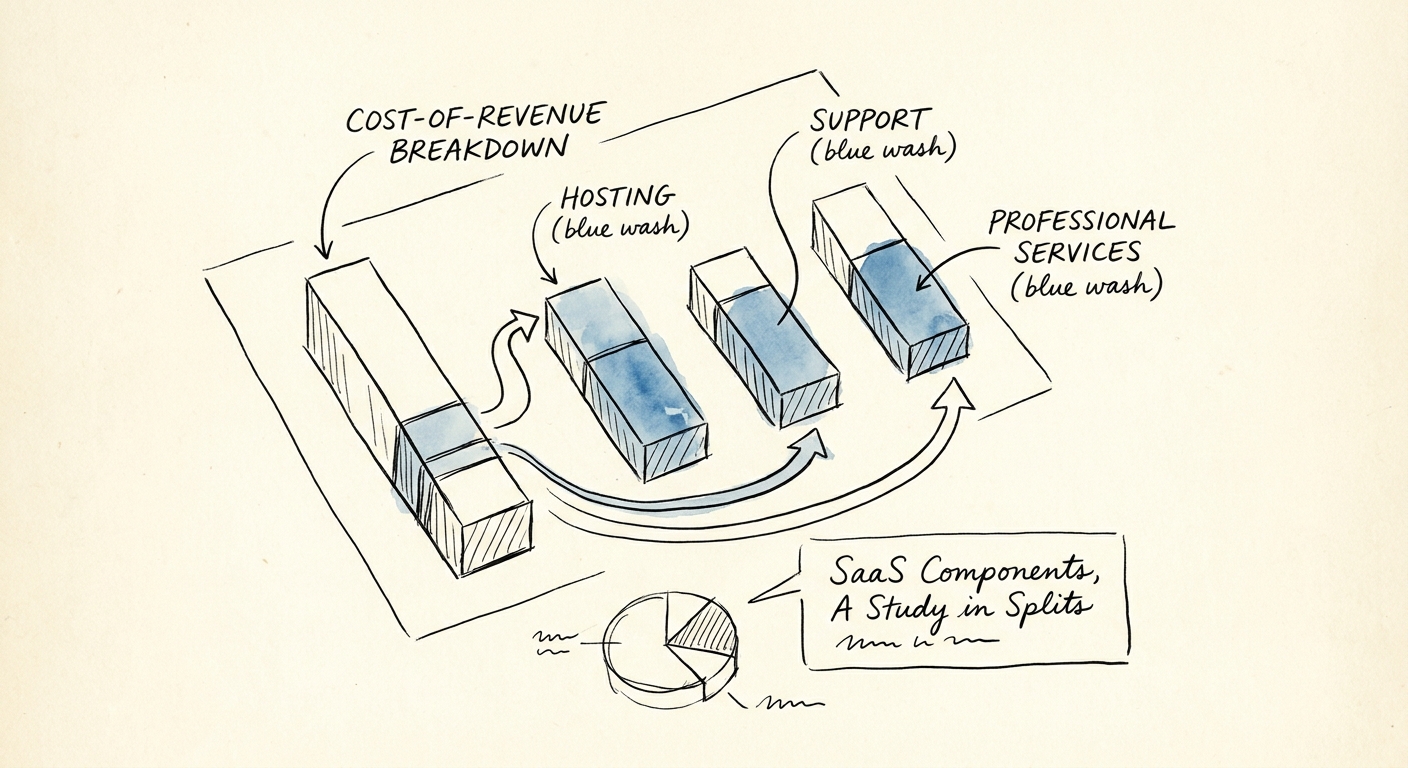
BRIEF · UNIT ECONOMICS
The Cost of Revenue Diagnostic: Benchmarking Hosting, Support, and Professional Services
A diagnostic breakdown of SaaS cost of revenue, including benchmarks for hosting, customer support, and professional services splits to protect your gross margin.
29.1% Average COGS for $250M-$500M SaaS (Bessemer Cloud Index)
BRIEF · TEAM & HIRING
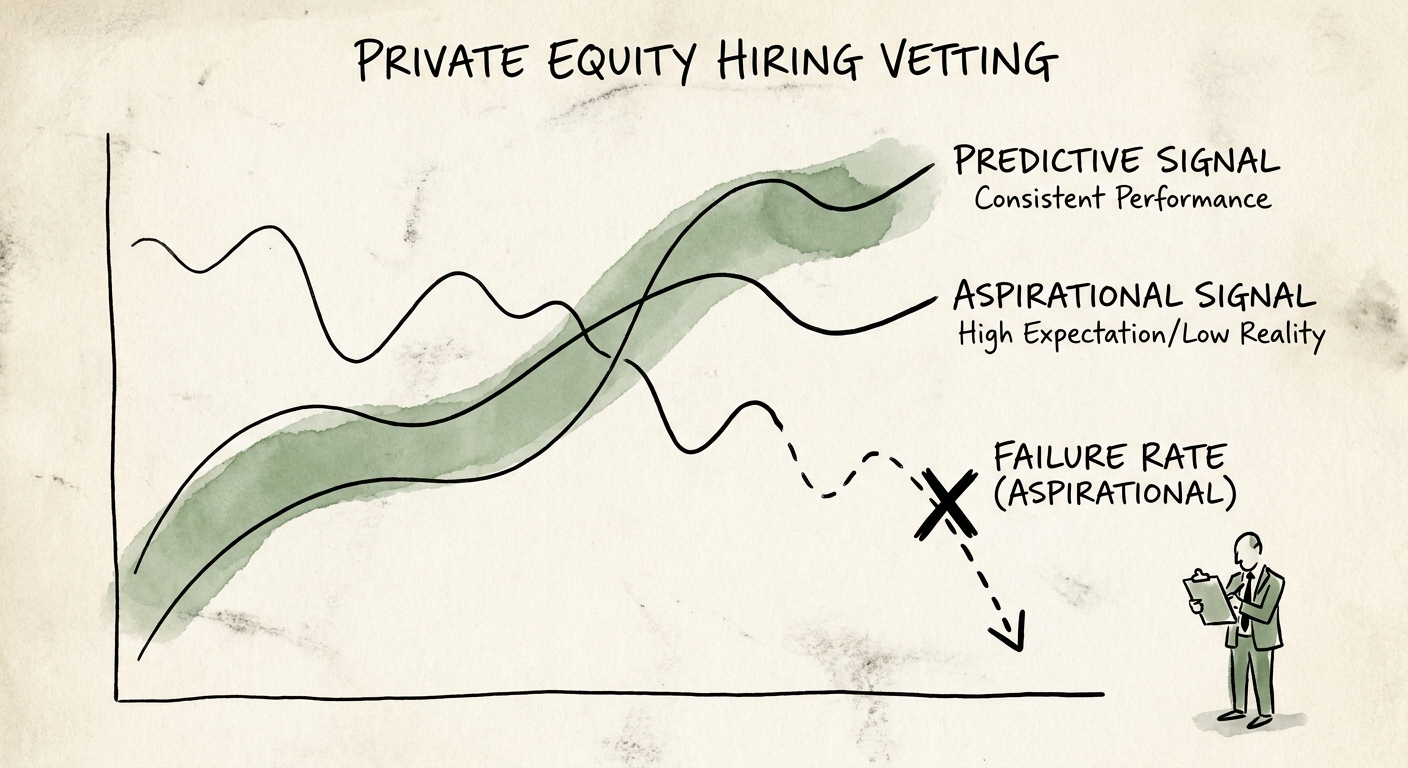
Reference Checking: The Predictive Signals That Save Millions
Eighty-two percent of executive reference checks are useless aspirational rubber stamps. Learn how PE operators extract predictive signals to avoid $2.4M hiring mistakes.
82% Useless Reference Checks in PE Due Diligence
BRIEF · UNIT ECONOMICS
Your NRR Says 115%. Your Logo Count Says You're Dying.
A 115% NRR can hide a 68% logo retention rate. Here's the divergence math PE buyers run in week one of diligence — and how to fix it 18 months out.
15% Max Acceptable Divergence Between GRR and Logo Retention
BRIEF · MIGRATION & INTEGRATION
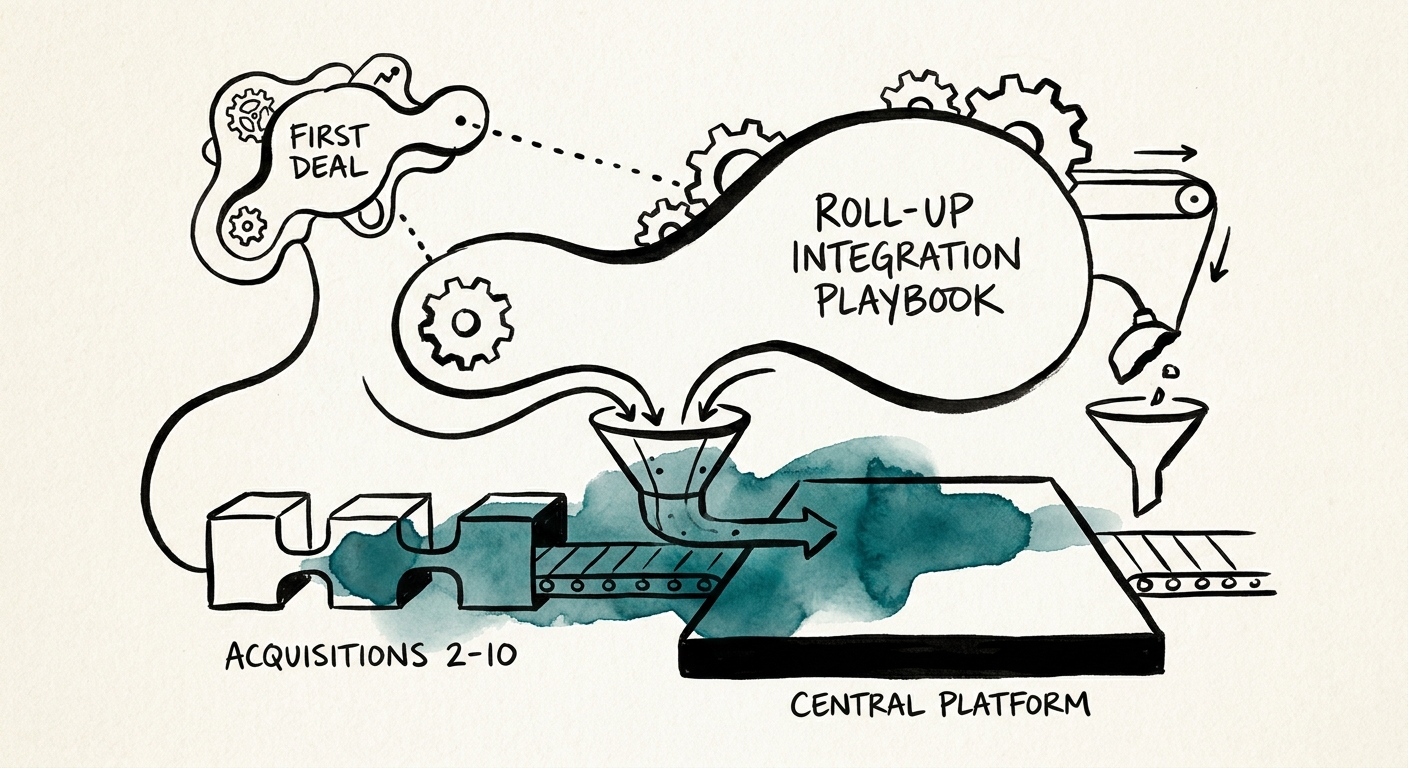
Your First Acquisition Taught You Bad Habits: The Integration Playbook for Deals 2 Through 10
The bespoke playbook that worked on your platform deal silently destroys margin on bolt-ons 2-10. Here's the 30-day ingestion model that protects the thesis.
14% Hidden Tax on Bolt-on Integrations