
BRIEF · PROJECT RECOVERY
Bridge Financing Negotiation: Getting Runway Without Giving Away the Company
Discover how scaling founders can negotiate bridge financing without surrendering their cap table. Learn the 2026 benchmarks for tranches, discounts, and terms.
3 Core Bridge Economics to Negotiate
BRIEF · PROCESS DOCUMENTATION
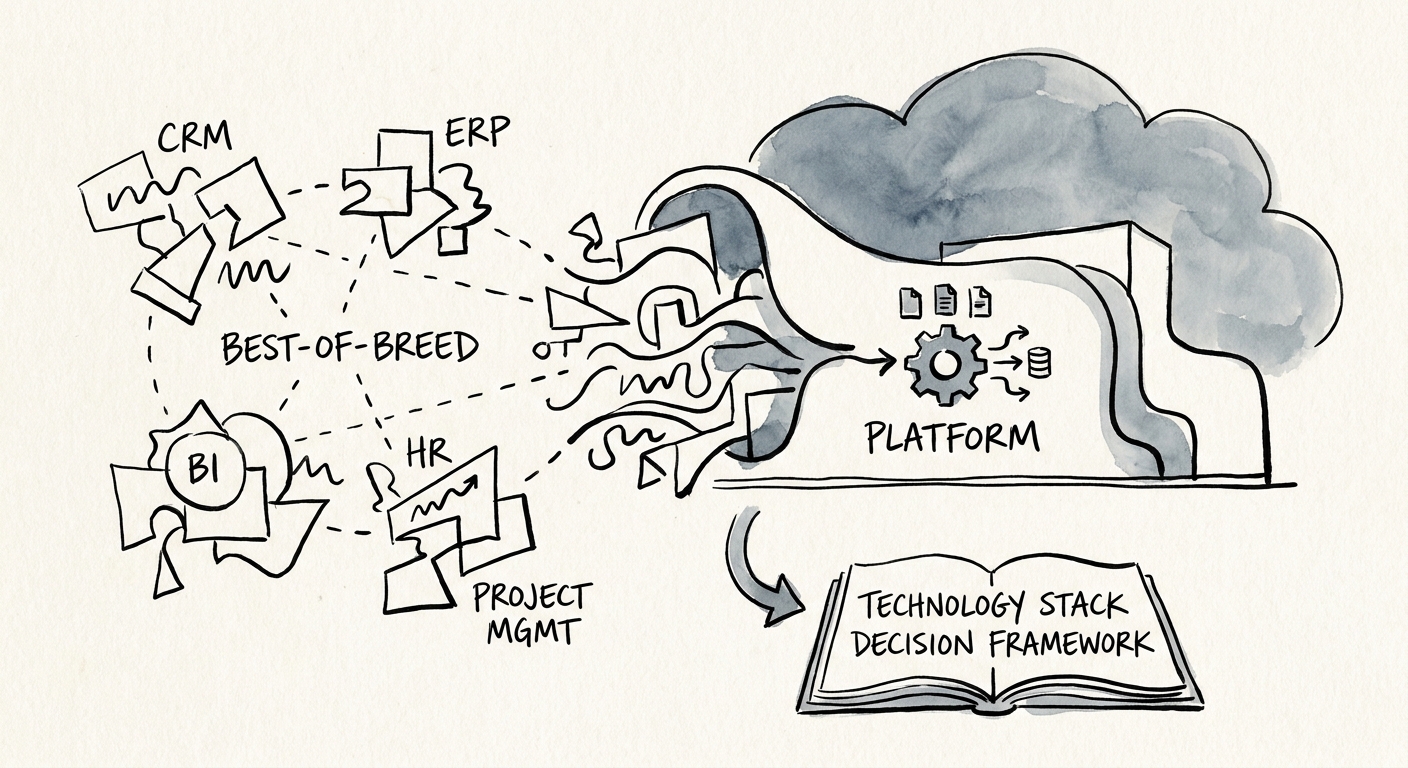
Best-of-Breed vs. Platform: What Your Stack Costs You at Exit
The integration tax of a best-of-breed stack quietly discounts your exit. Here is how a diligence buyer reads 17 point tools, and when to consolidate.
22% EBITDA Bleed from Integration Tax
BRIEF · PROCESS DOCUMENTATION
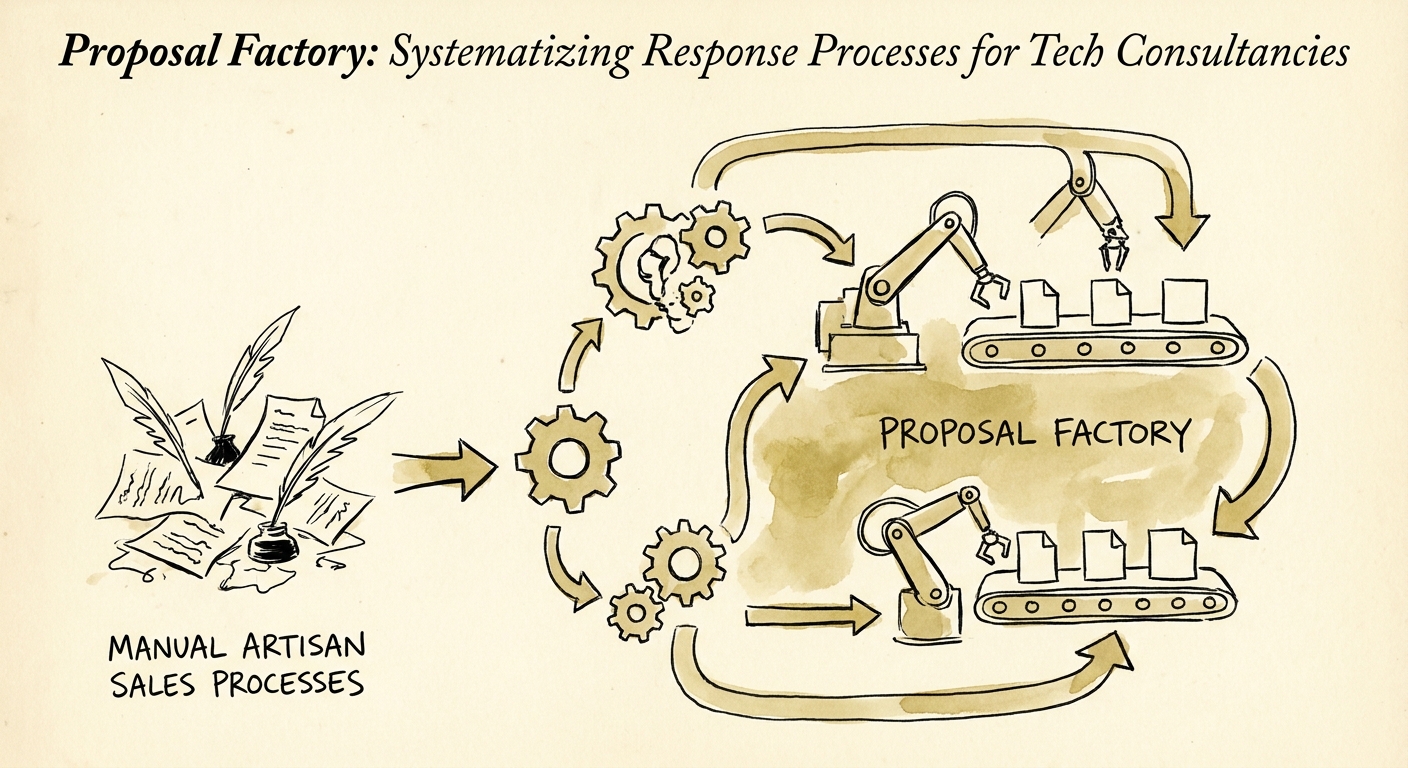
The Proposal Factory: How to Systematize Tech Consultancy Response Processes
Learn how technology services firms can systematize proposal work with reusable components, clearer governance, and better sales to delivery handoffs.
5 Proposal components to standardize before the next enterprise pursuit
BRIEF · UNIT ECONOMICS
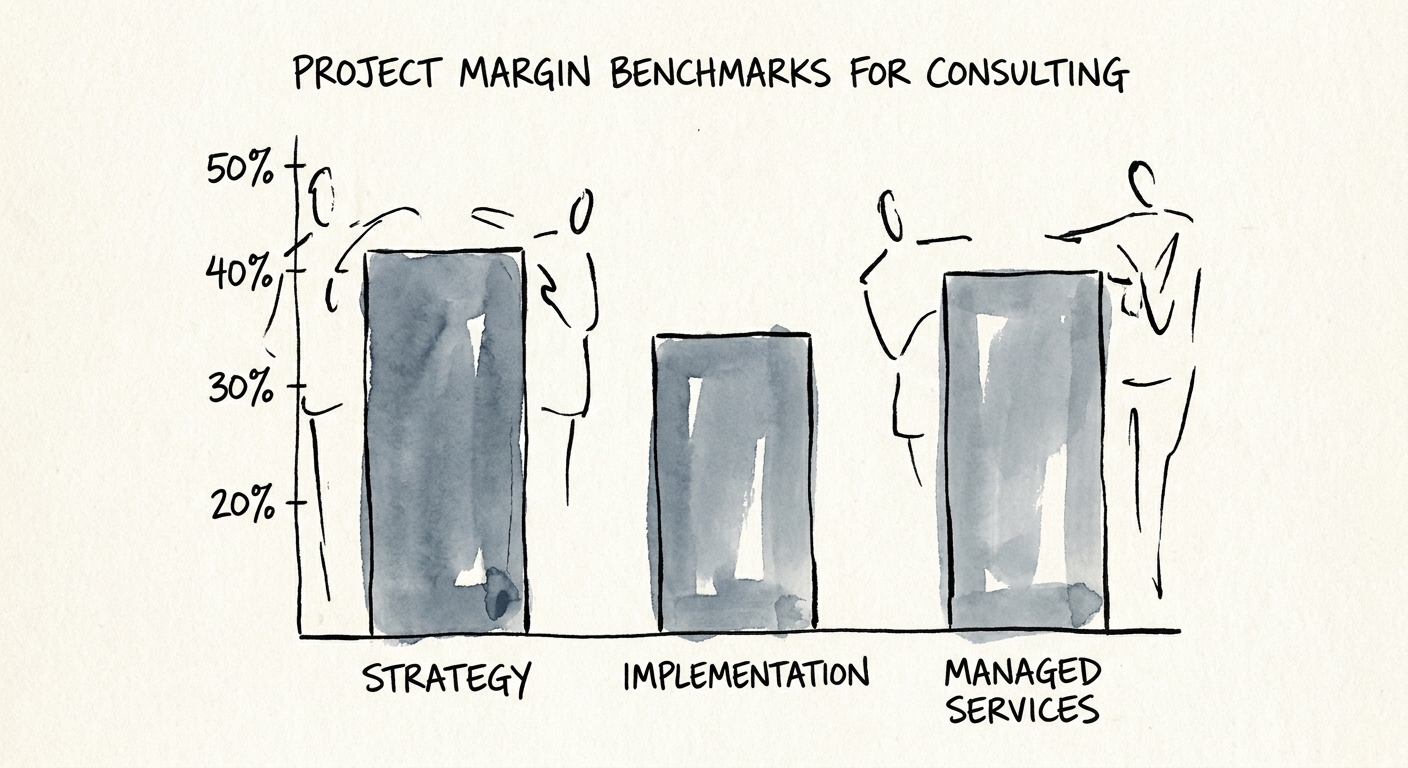
The 2026 Project Margin Benchmarks for Consulting Engagements
Discover the 2026 project margin benchmarks for consulting firms. Learn why blending strategy and implementation margins is destroying your EBITDA and valuation.
32% Average Implementation Gross Margin
BRIEF · COMPLIANCE & SECURITY
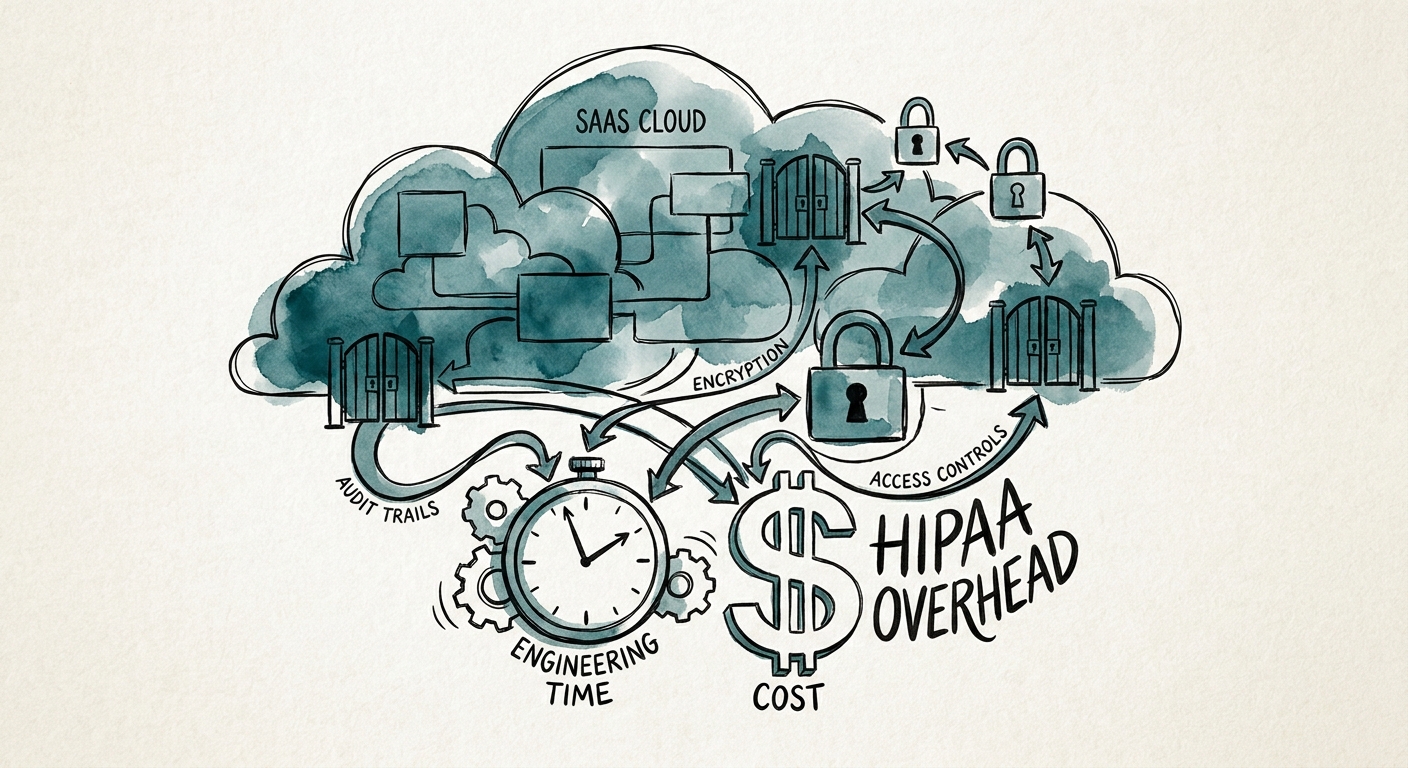
HIPAA Compliance Overhead for SaaS: Engineering and M&A Costs
Adding HIPAA-sensitive healthcare workflows to SaaS requires more than a checklist. See the engineering, vendor, logging, and M&A diligence costs founders need to plan for.
6 figures Typical Readiness Cost Profile
BRIEF · GTM EXECUTION
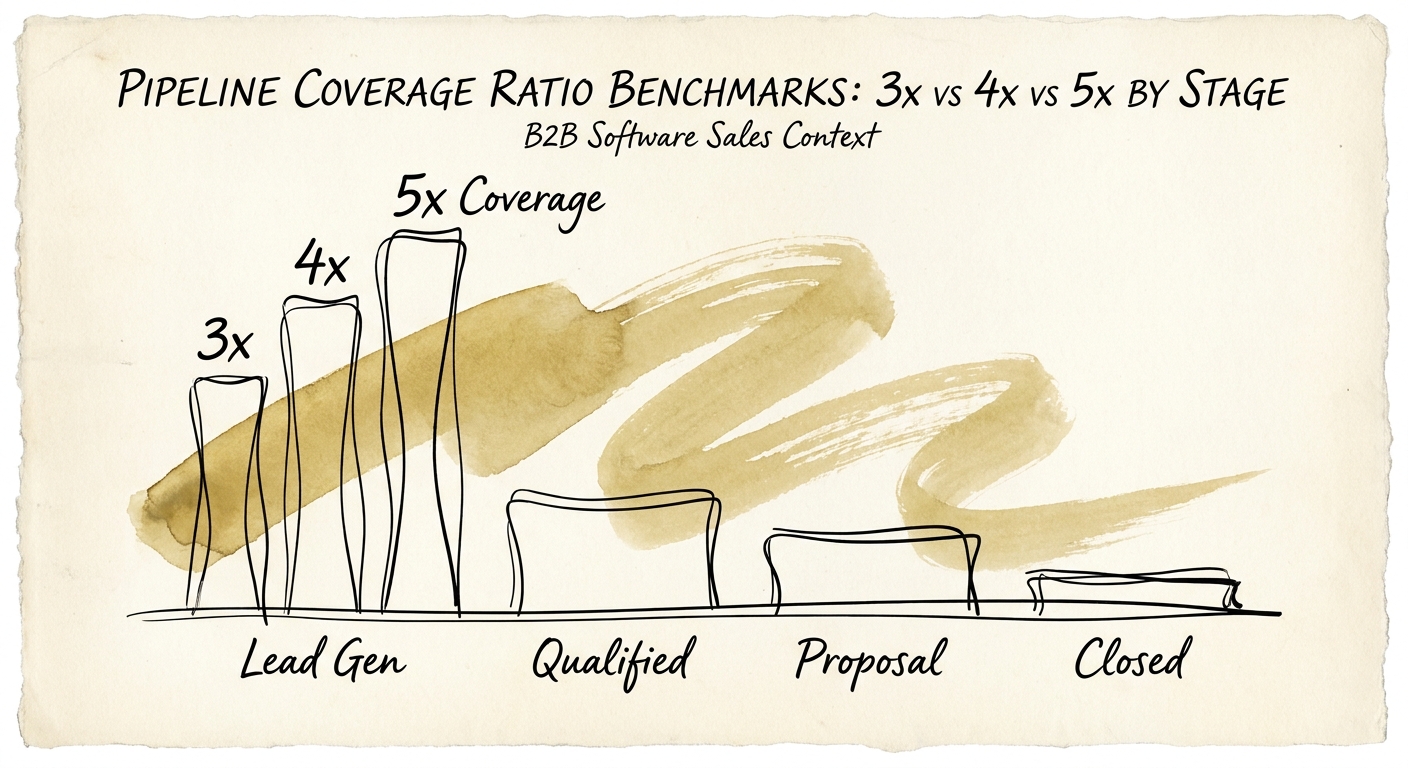
Pipeline Coverage Ratio Benchmarks: Why the 3x Rule Is Killing Your Forecast
Discover why the flat 3x pipeline coverage ratio is a valuation trap. Get the 2026 stage-by-stage coverage benchmarks required to accurately forecast B2B revenue.
22% Revenue Deficit Caused by Flat 3x Pipeline Modeling
BRIEF · FINANCIAL INFRASTRUCTURE
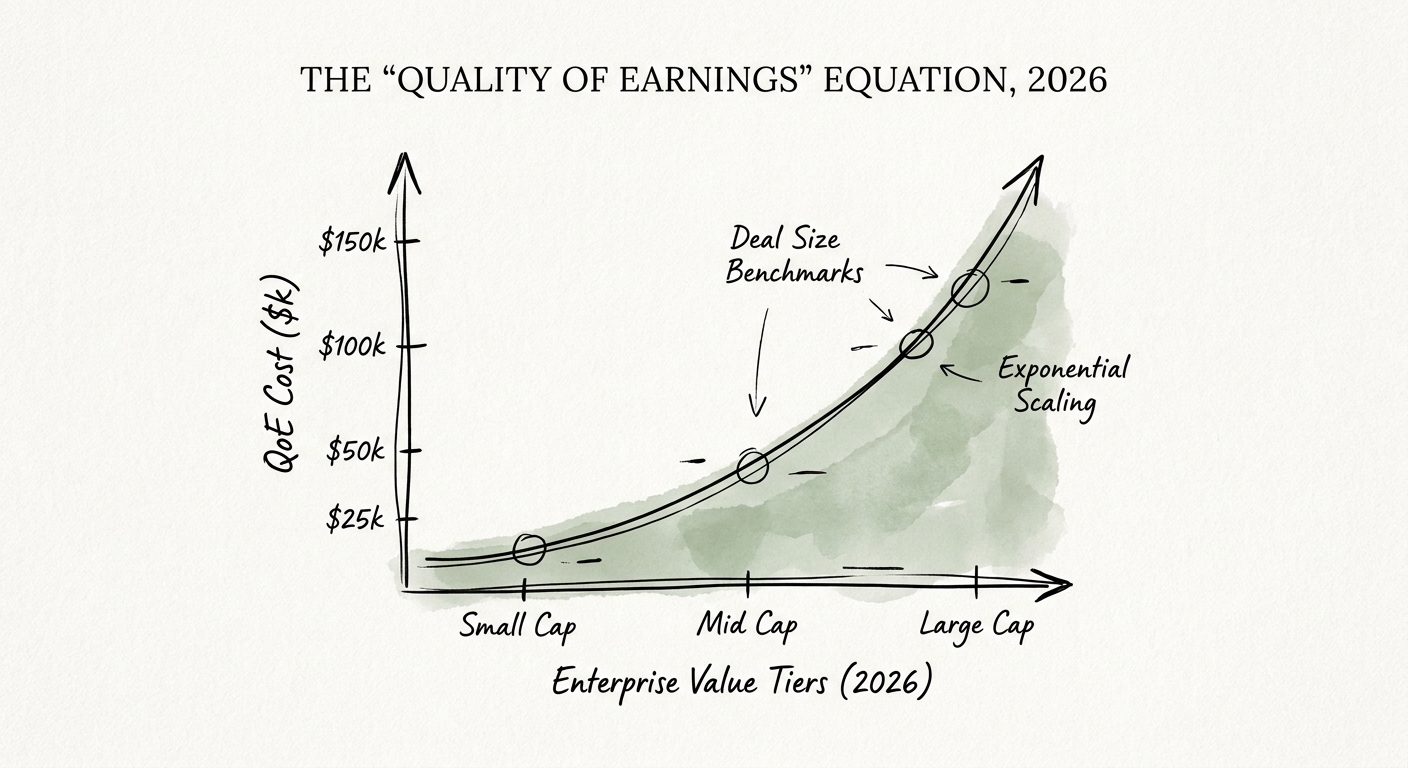
Quality of Earnings Report Cost: $25k to $150k Benchmarks by Deal Size
An operator's guide to Quality of Earnings report costs, with $25k-$150k benchmarks by deal size and the seller preparation areas that protect enterprise value.
$25k-$150k Common QoE Cost Range
BRIEF · MIGRATION & INTEGRATION
The 100-Day Scorecard PE Firms Should Run on a Tech Roll-Up (and the One They Track Instead)
The green IMO dashboard hides where a tech-services deal is bleeding. Here are the day-by-day integration KPIs a PE operating partner should track for 100 days.
40% Engineering Output Drop During Integration
BRIEF · COMPLIANCE & SECURITY
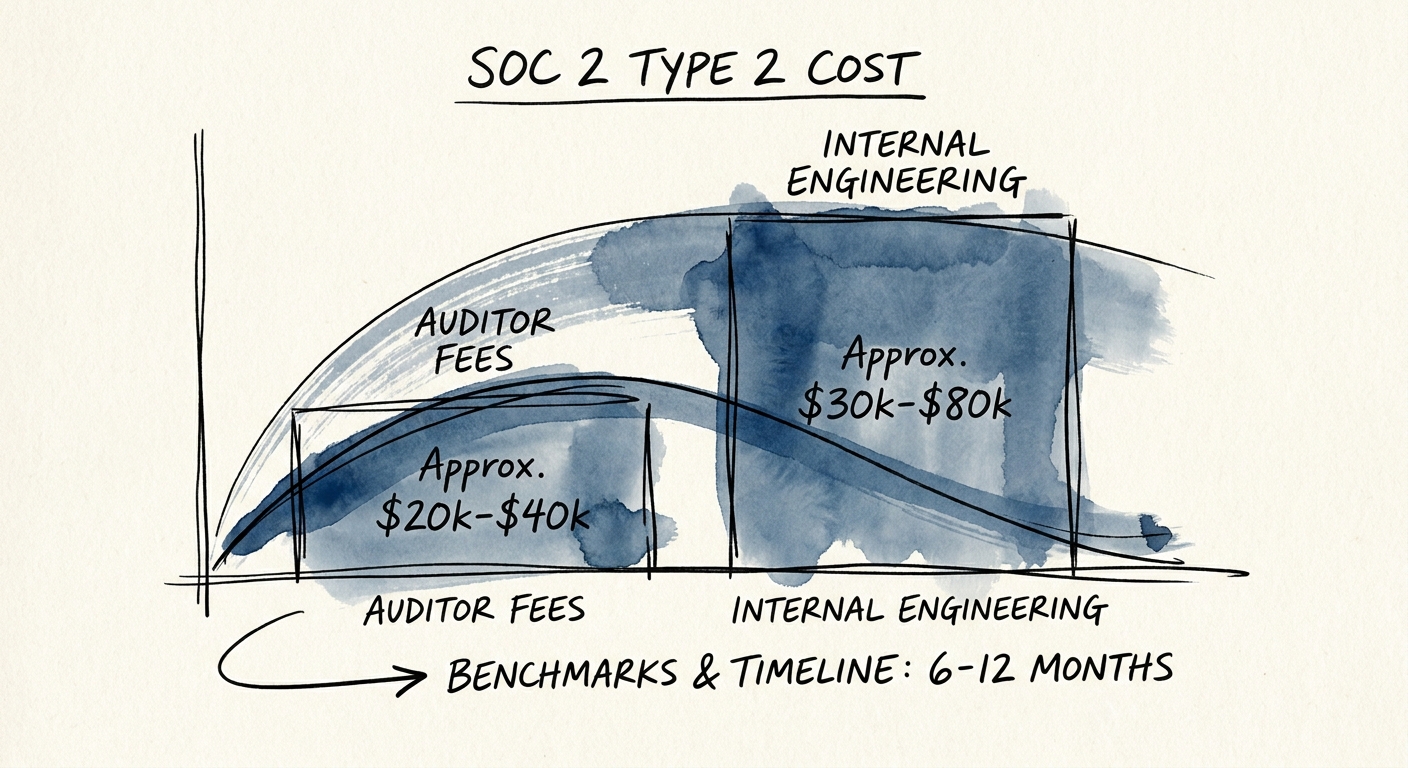
SOC 2 Type 2 Cost Benchmarks: Why the $50k Budget is a Lie
Founders budgeting $50k for their first SOC 2 Type 2 are guaranteed to blow their budget. Discover the true 2026 cost benchmarks, timeline realities, and hidden R&D taxes.
140% Average Budget Overrun for First-Time SOC 2 Audits
BRIEF · TEAM & HIRING
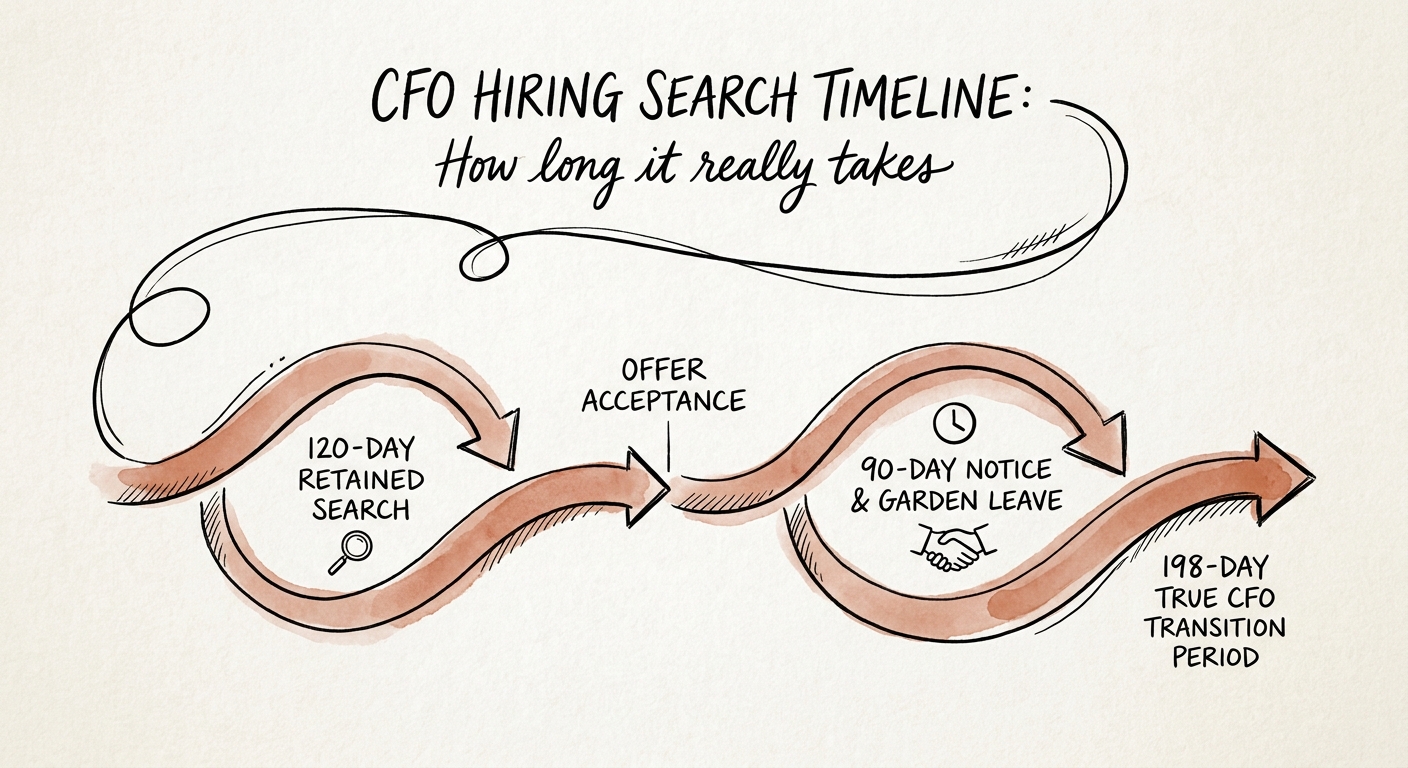
The 198-Day CFO Search: Why Your "90-Day Backfill" Is Off by Two Quarters
You budgeted 90 days to replace a PE-backed SaaS CFO. The real number from kickoff to a closed quarter is 198. Here is where the days hide and how to bridge them.
198 Average Days for CFO Transition
BRIEF · UNIT ECONOMICS
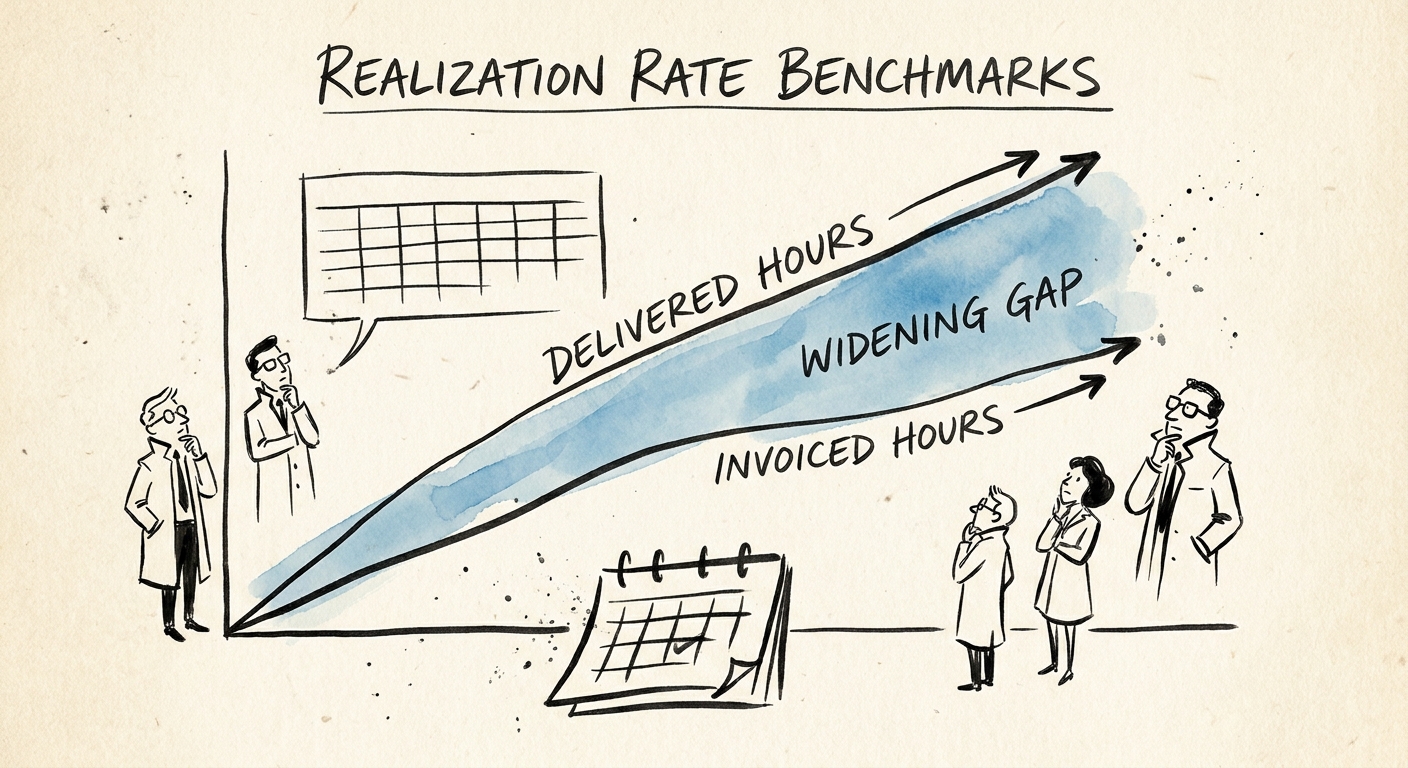
Realization Rate Benchmarks: Why Your 'Invoiced vs. Delivered' Gap Is Killing Your EBITDA
Diagnostic guide for PE sponsors and founders on realization rate benchmarks. Discover why 11% of billable hours are written down and how to bridge the gap between delivered and invoiced time.
82% Average IT Services Realization Rate
BRIEF · TEAM & HIRING
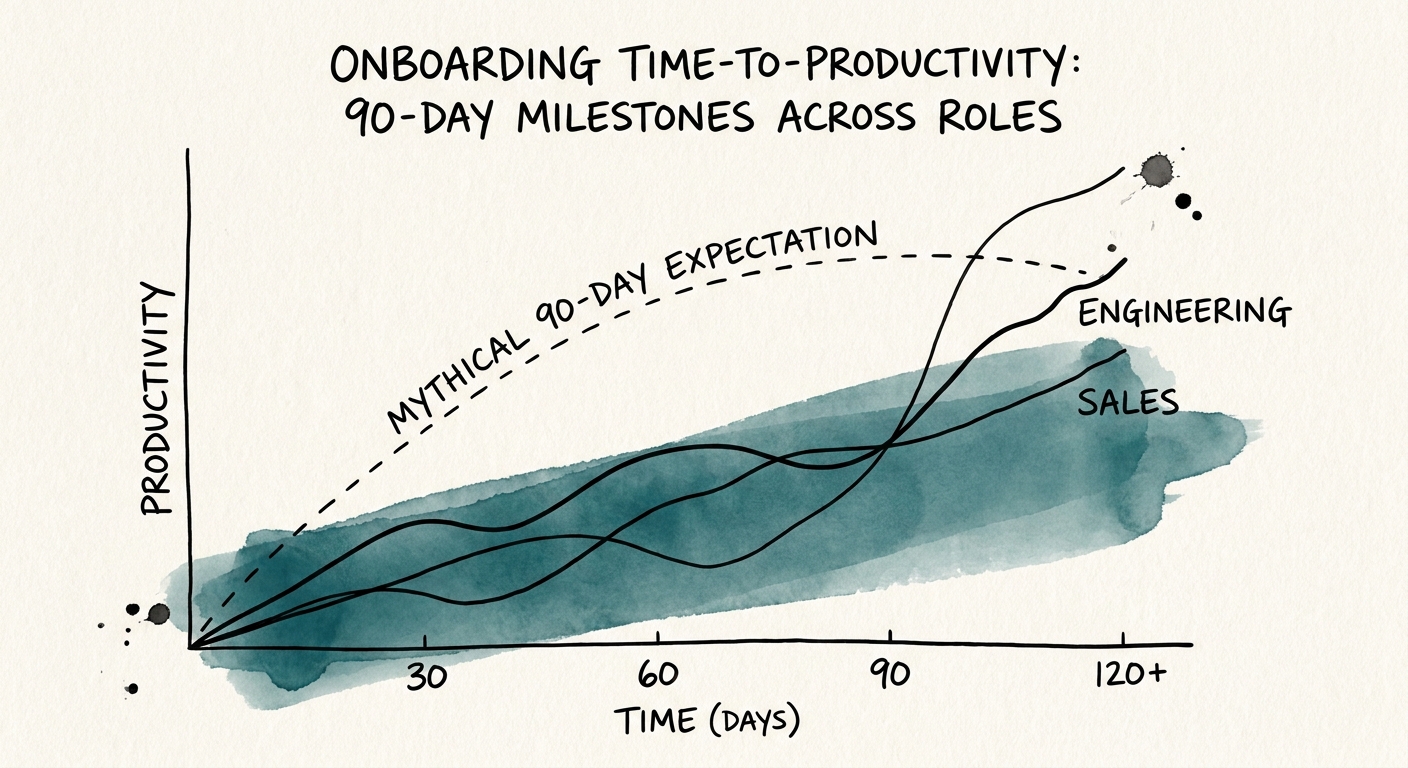
The 90-Day Ramp Illusion: Time-to-Productivity Benchmarks That Actually Predict Scale
The standard 90-day ramp is a costly misconception. Discover the true onboarding time-to-productivity benchmarks and 30-60-90 day milestones for scaling tech teams.
30-60-90 Onboarding Milestone Cadence
BRIEF · FINANCIAL INFRASTRUCTURE
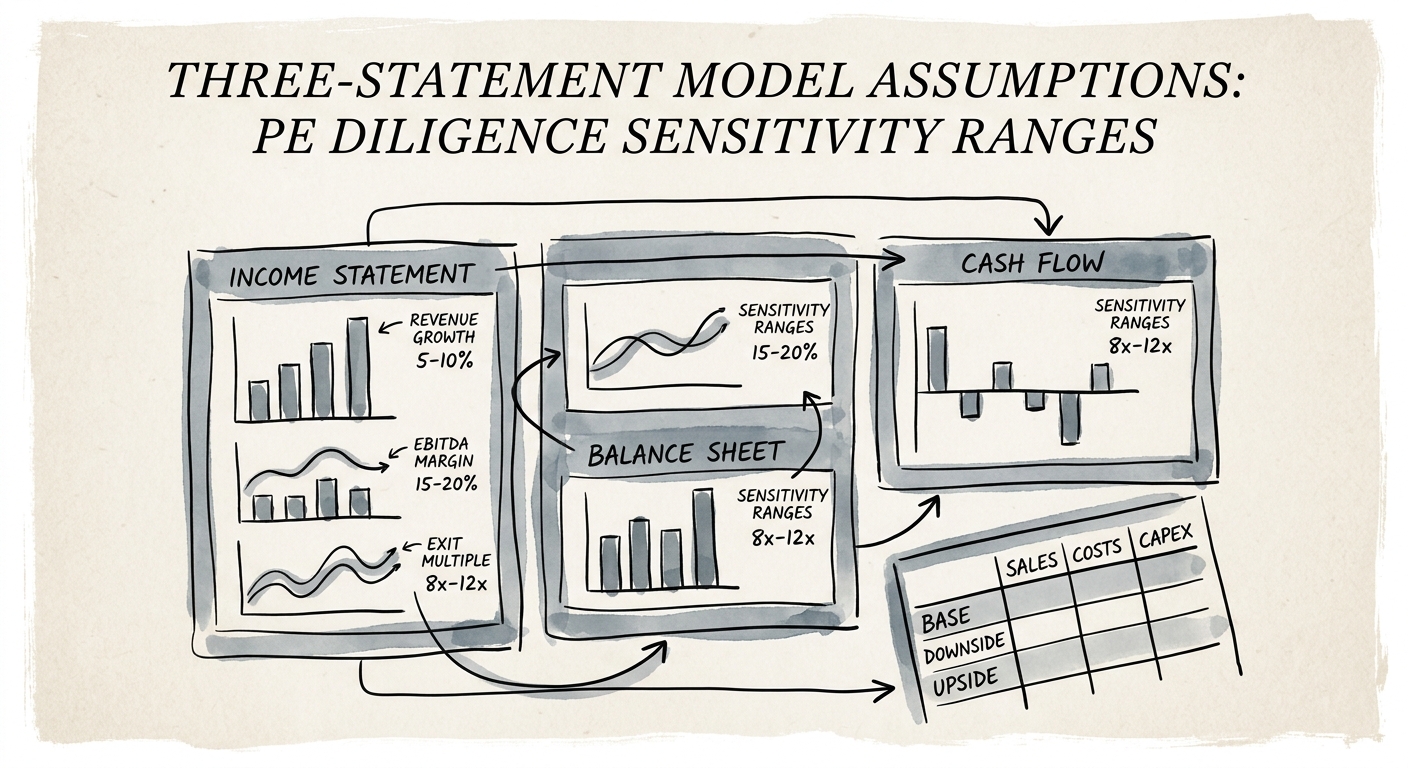
Three-Statement Model Assumptions: The PE Diligence Sensitivity Playbook
Discover the exact three-statement model sensitivity ranges Private Equity buyers apply during financial due diligence to test your growth, COGS, and working capital.
68% tech M&A deals suffer multiple haircuts due to failed model sensitivities
BRIEF · MIGRATION & INTEGRATION
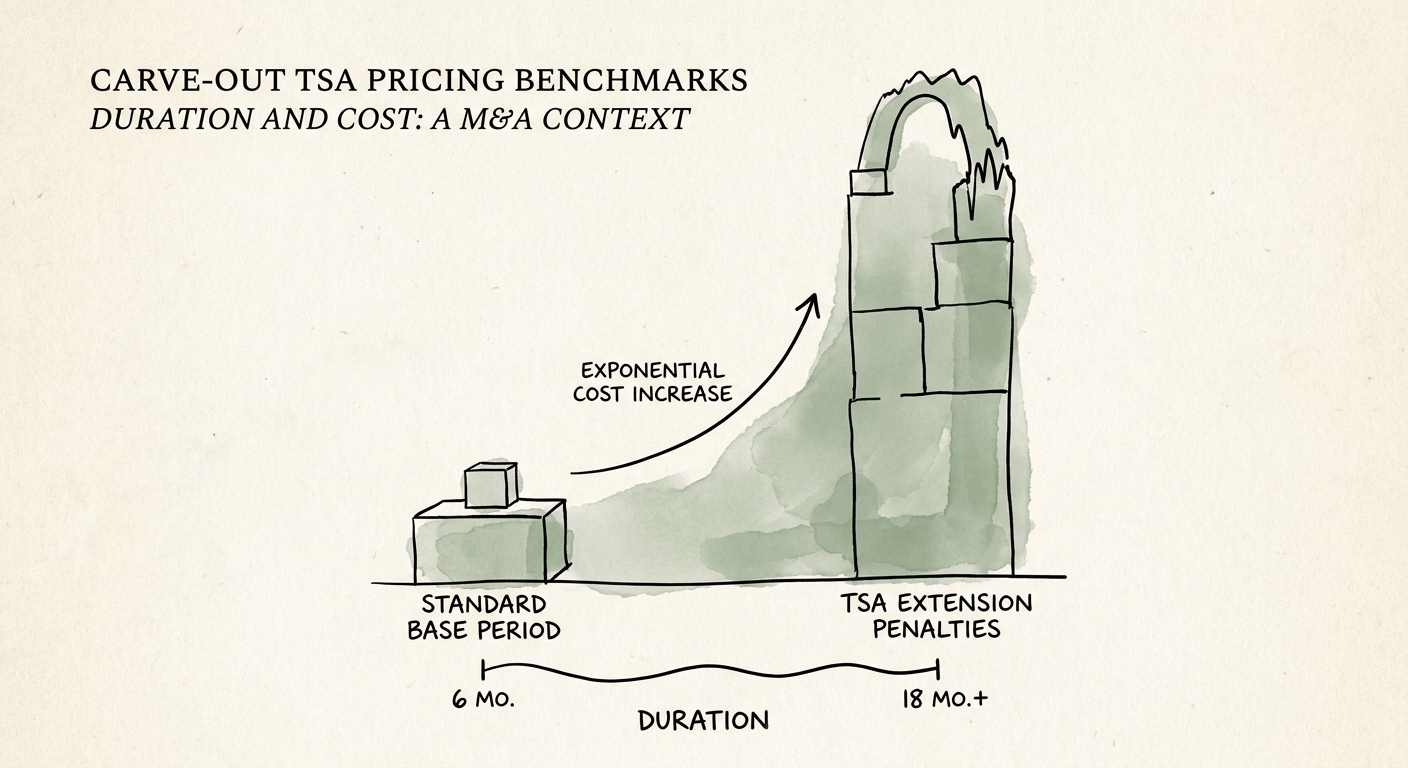
Carve-Out TSA Pricing: Why Month Seven Is Where the Money Disappears
A 12-month TSA meets a 14.2-month migration, and the gap costs 3-5% of deal value. The pricing clauses, exit ramps, and extension math PE buyers miss.
14.2 Months average duration for stand-alone ERP carve-out migrations
BRIEF · GTM EXECUTION
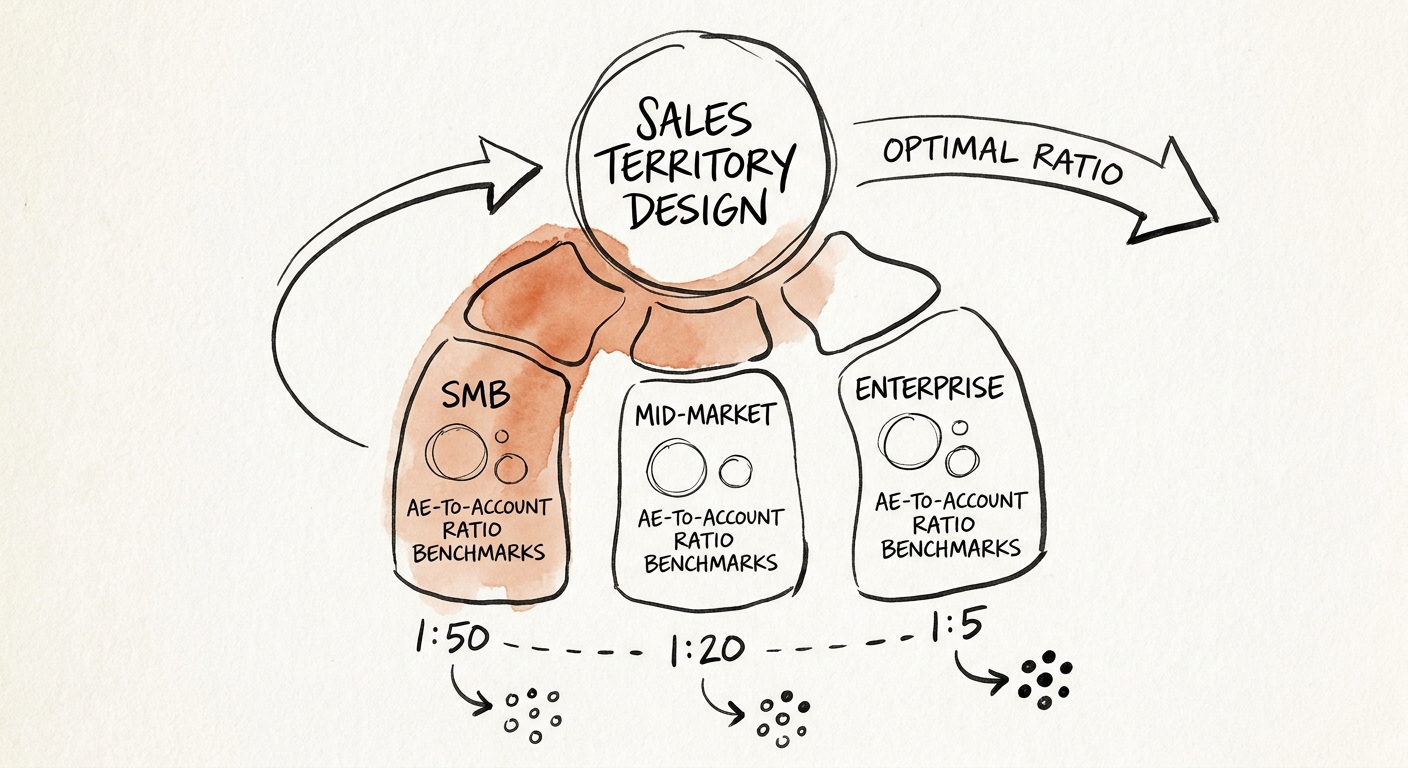
Sales Territory Design: 2026 AE-to-Account Ratio Benchmarks
Shrinking an Account Executive's territory by 40% is the fastest way to increase pipeline. Discover the 2026 AE-to-account ratio benchmarks for PE-backed SaaS.
40% Territory Size Reduction Required to Boost Win Rates
BRIEF · UNIT ECONOMICS
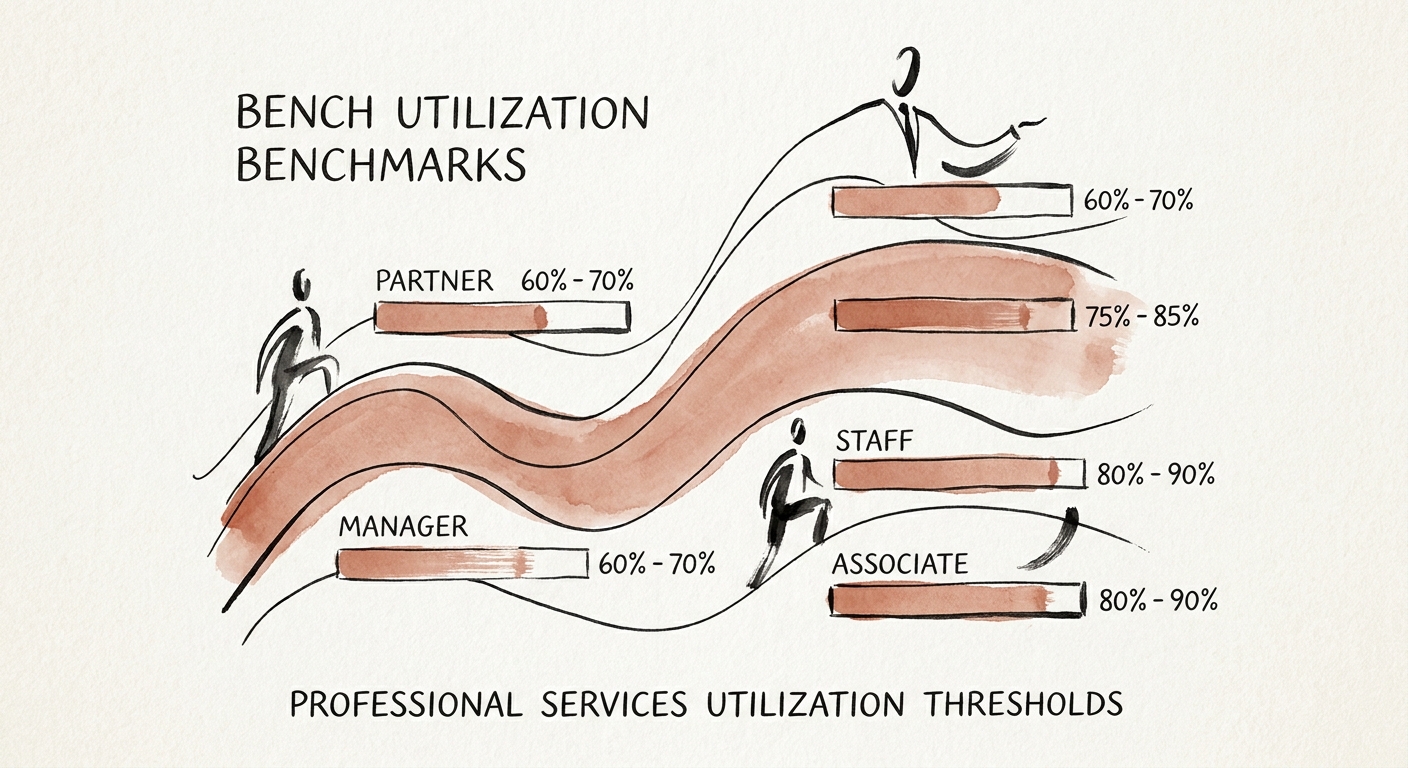
Why 85% Utilization Is a Valuation Trap: 2026 Professional Services Benchmarks by Role
Pushing professional services utilization above 85% destroys EBITDA. Justin Leader breaks down 2026 bench utilization benchmarks by role to protect your valuation.
72.3% Target Blended Utilization Rate
BRIEF · FINANCIAL INFRASTRUCTURE
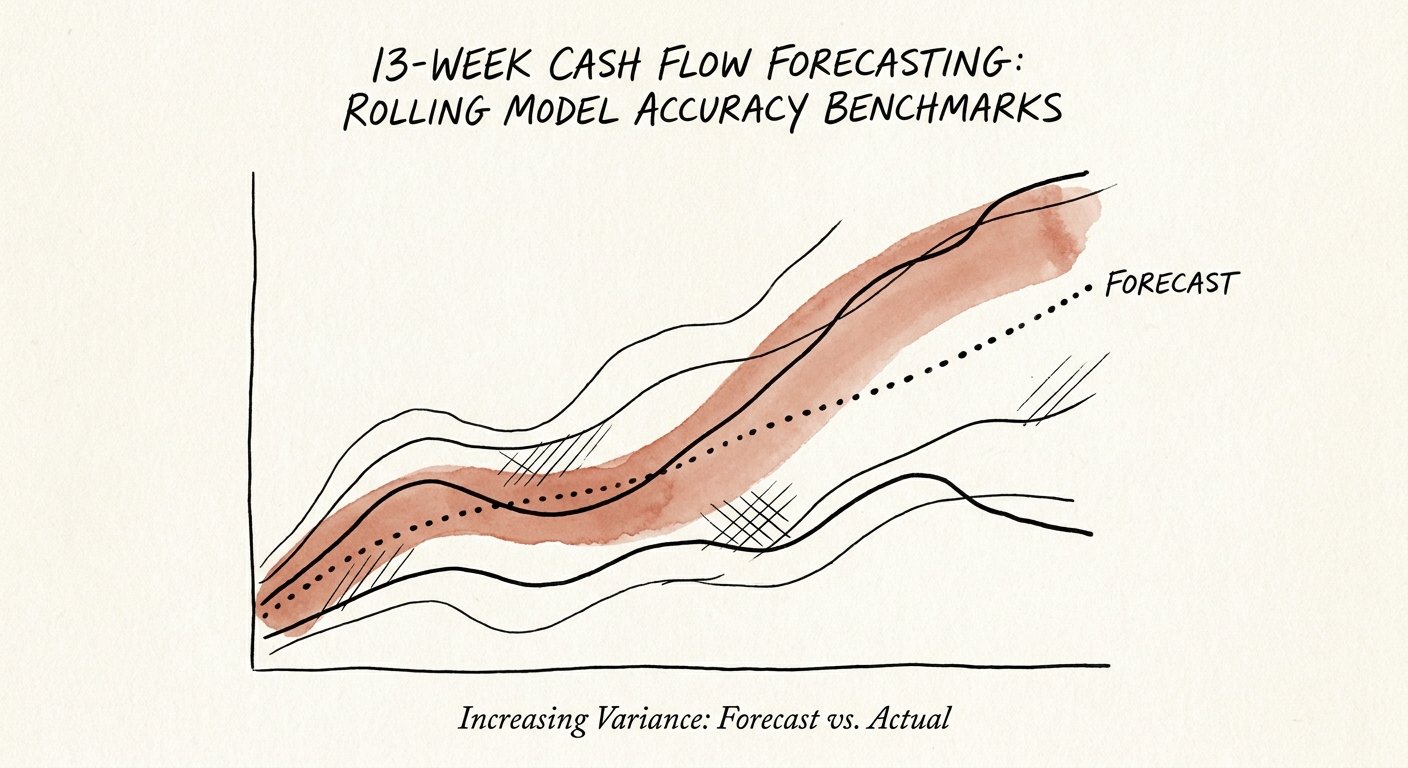
The 13-Week Cash Forecast That Was Right on Monday and Wrong by Thursday
Most 13-week cash models miss by 18.4% by week eight. The fix isn't a bigger spreadsheet — it's pricing every receivable by the customer who owes it.
18.4% Average Week-8 Variance in 13-Week Cash Flow Models
BRIEF · MIGRATION & INTEGRATION
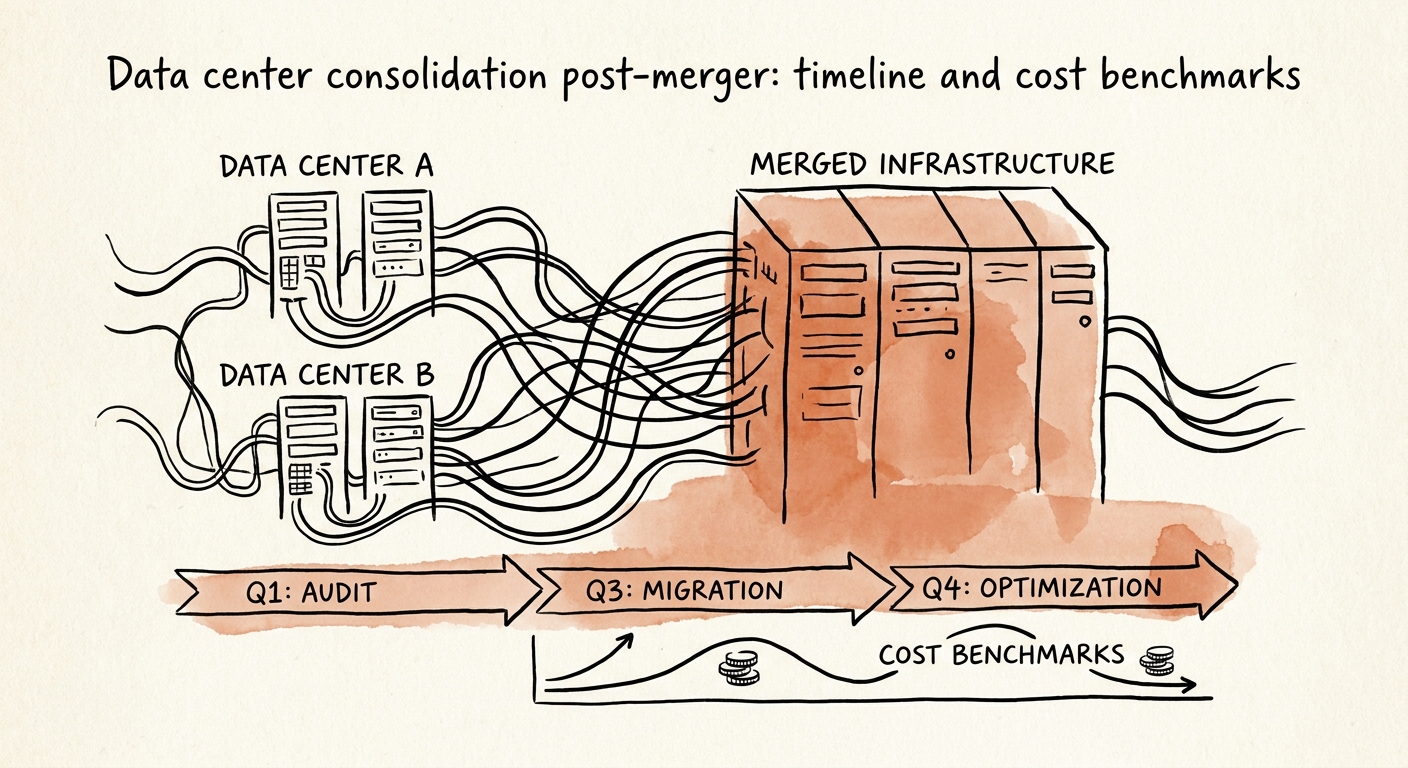
Post-Merger Data Center Consolidation: Why "9 Months" Becomes 18.5, and What It Costs
The deal model says collapse three data centers in 9 months. The average is 18.5, with 43% overruns. Here is where the time and money actually go.
43% Average Cost Overrun in Post-Merger Consolidations
BRIEF · UNIT ECONOMICS
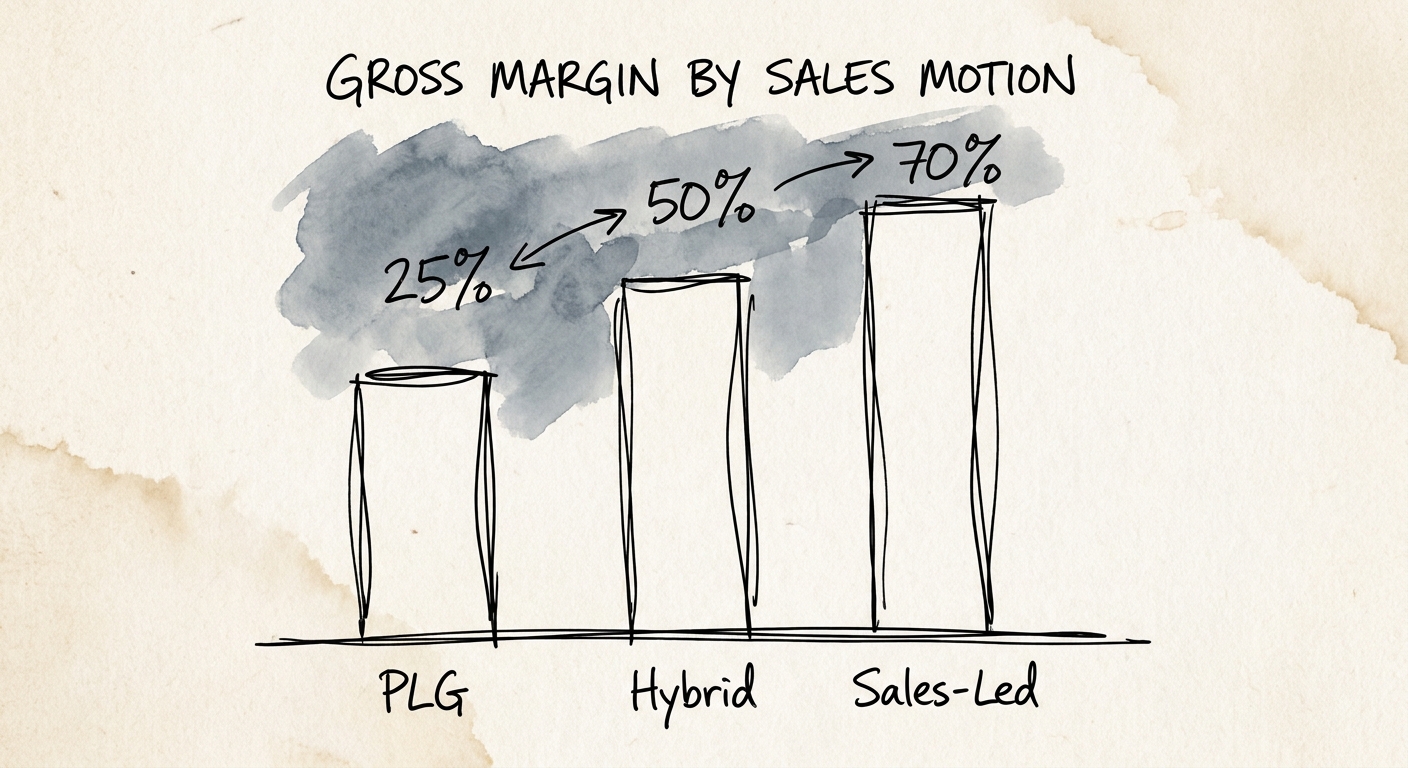
The Gross Margin Reality Check: PLG, Hybrid, and Sales-Led Unit Economics
Discover why hybrid and PLG sales motions are dragging down B2B SaaS gross margins, and how to re-architect your COGS to protect your 2026 exit valuation.
68.4% Gross Margin for Pure PLG SaaS (<$50M ARR)
BRIEF · MIGRATION & INTEGRATION
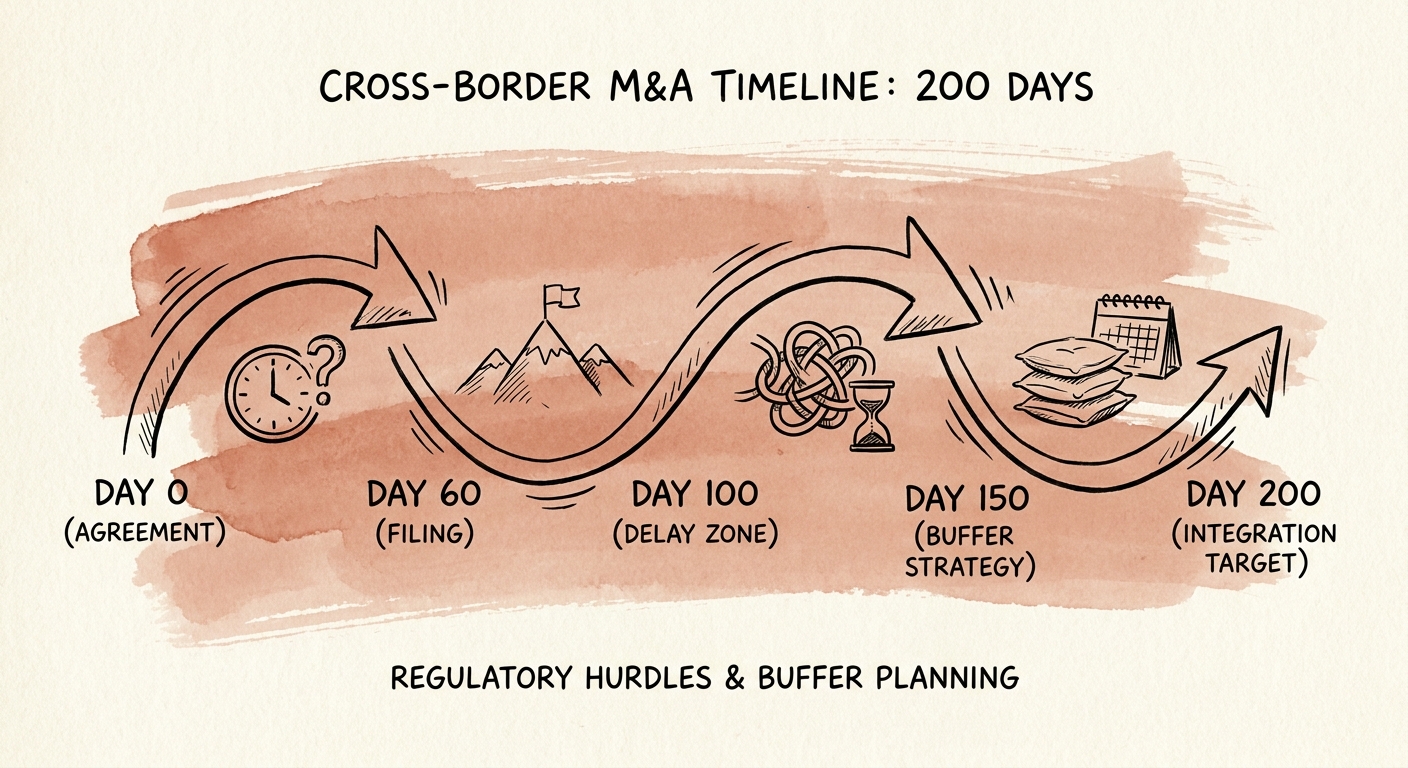
Cross-Border M&A: How to Integrate While the Antitrust Clock Holds You Hostage
FDI reviews and antitrust second requests freeze cross-border deals 4-6 months. Here's how clean teams and federated architecture let you integrate anyway.
4-6 Months Average M&A Timeline Extension Due to Regulatory Review
BRIEF · UNIT ECONOMICS
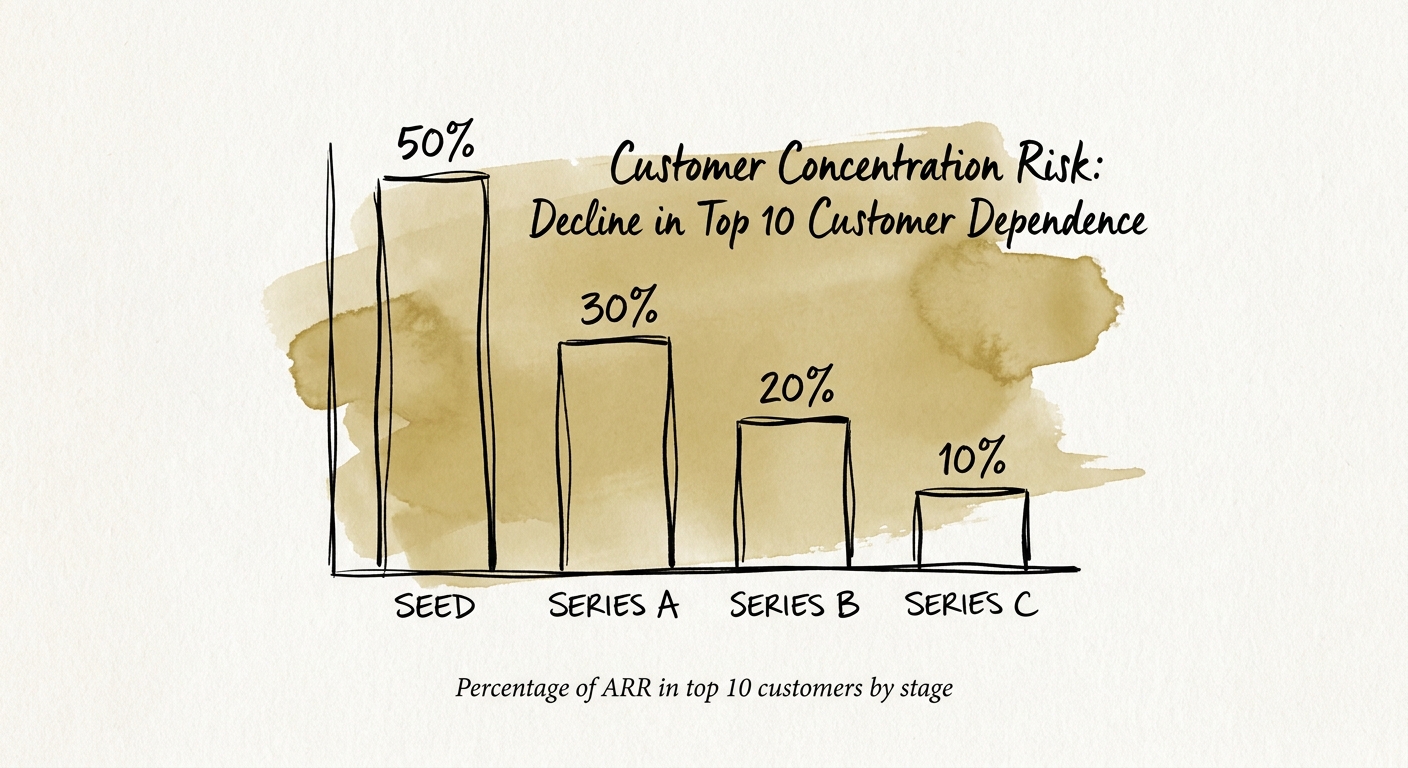
The Concentration Cliff: What Your Top-10 Accounts Are Doing to Your SaaS Valuation at Every Stage
The exact top-10 customer ARR concentration a $10M-$50M SaaS company can carry at each stage before buyers apply a 15-20% valuation haircut, and how to fix it.
15-20% Valuation Haircut for >25% Top-10 Concentration
BRIEF · TECHNICAL DEBT
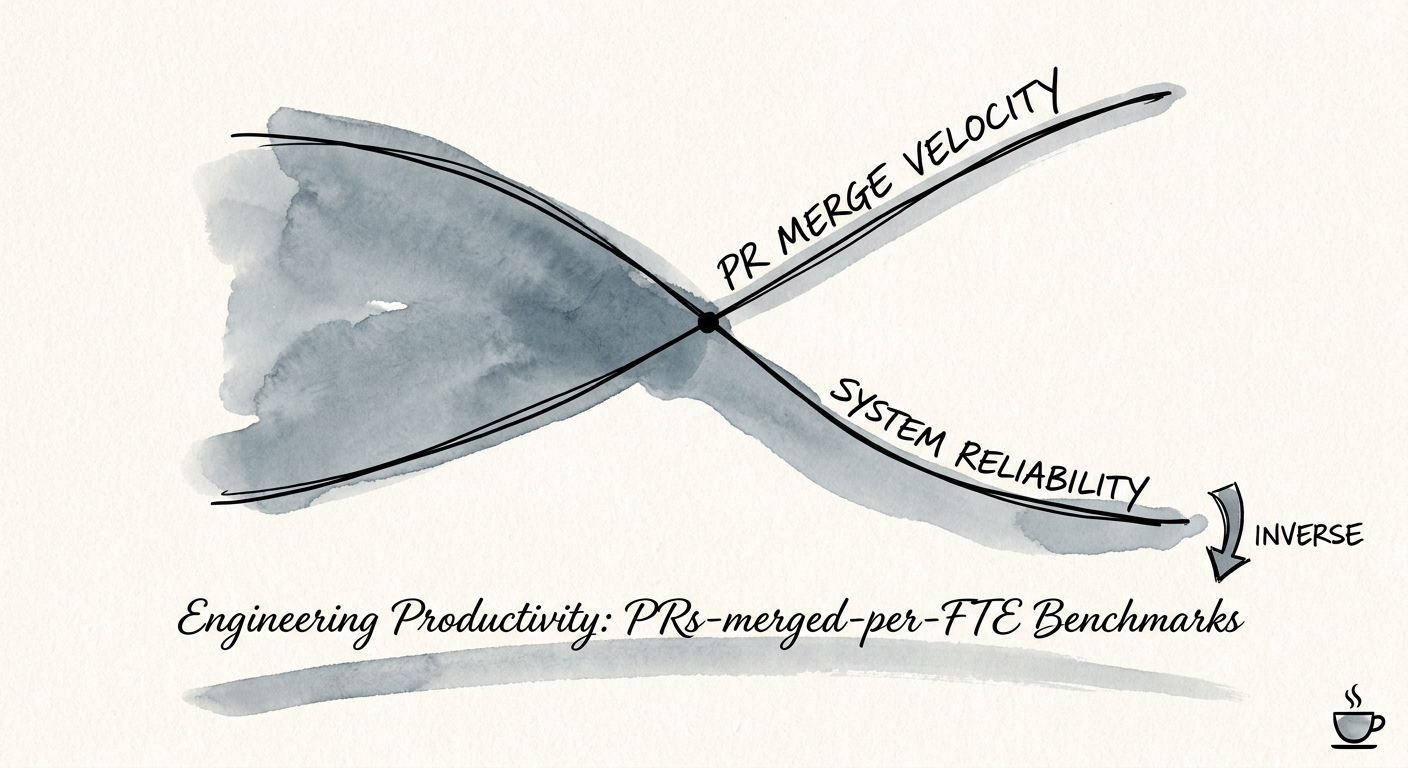
The PR Volume Trap: Why Pull Request Counts Can Mislead Engineering Leaders
Why measuring PRs merged per FTE is a vanity metric that masks compounding technical debt, destroys engineering productivity, and kills SaaS exit multiples.
3 Core Engineering Health Metrics
BRIEF · UNIT ECONOMICS
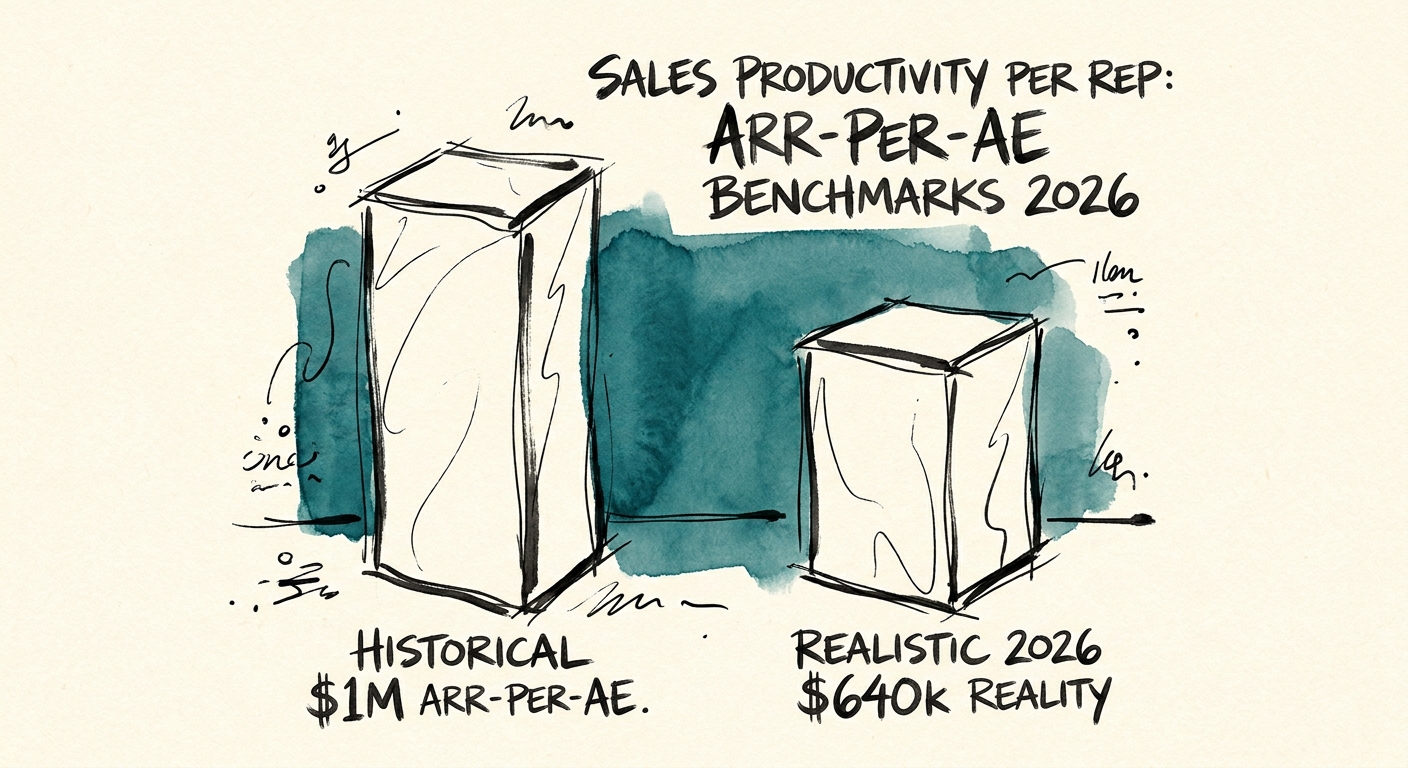
Sales Productivity Per Rep: ARR-per-AE Benchmarks 2026
Discover why the $1M ARR per AE quota is weakening SaaS unit economics in 2026, and learn the new unit economics benchmarks private equity buyers actually trust.
$640,000 Median ARR per Mid-Market Account Executive
BRIEF · TECHNICAL DEBT
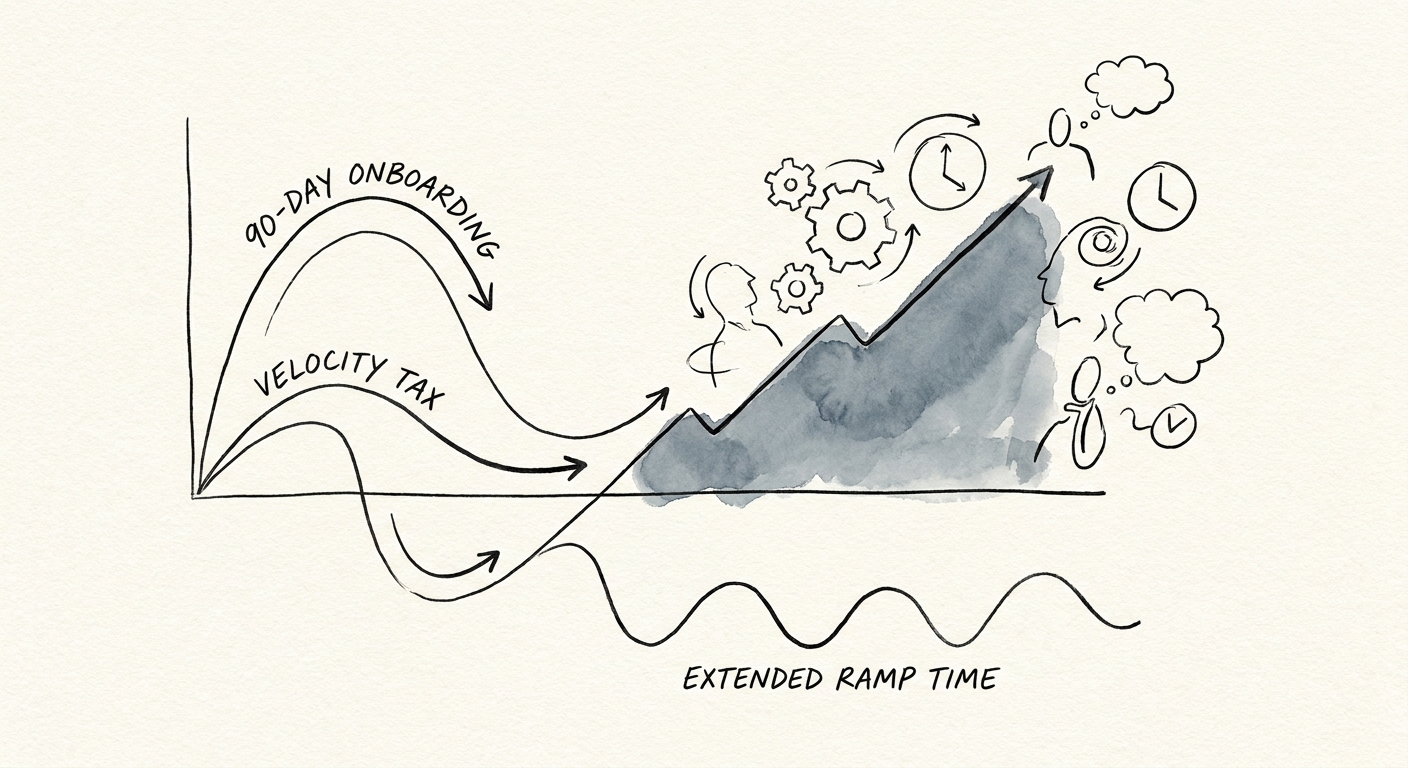
The 90-Day Onboarding Lie: Surviving Engineering Hires in Turnaround Environments
Why standard 90-day engineering onboarding fails in turnaround environments. Learn how technical debt destroys ramp times and how to implement a 120-day remediation-first playbook.
120 days Recommended Remediation-First Ramp