BRIEF · EXIT READINESS
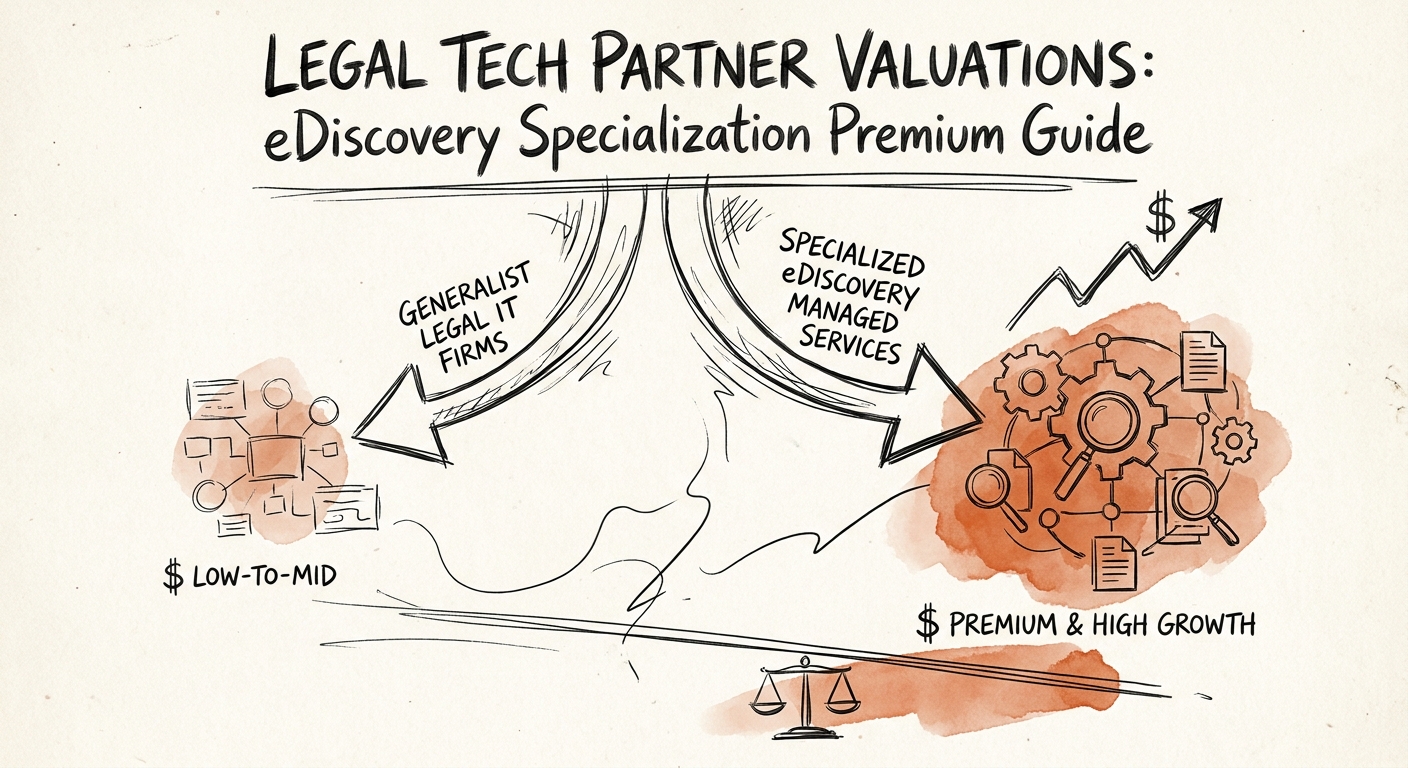
Why Two Legal-Tech Firms With the Same Revenue Sell at Different Multiples
Two legal-tech firms, identical revenue, very different offers. What makes eDiscovery revenue defensible enough to underwrite — and what gets it discounted as project work.
Specialized workflow valuation story buyers can diligence
BRIEF · GTM EXECUTION
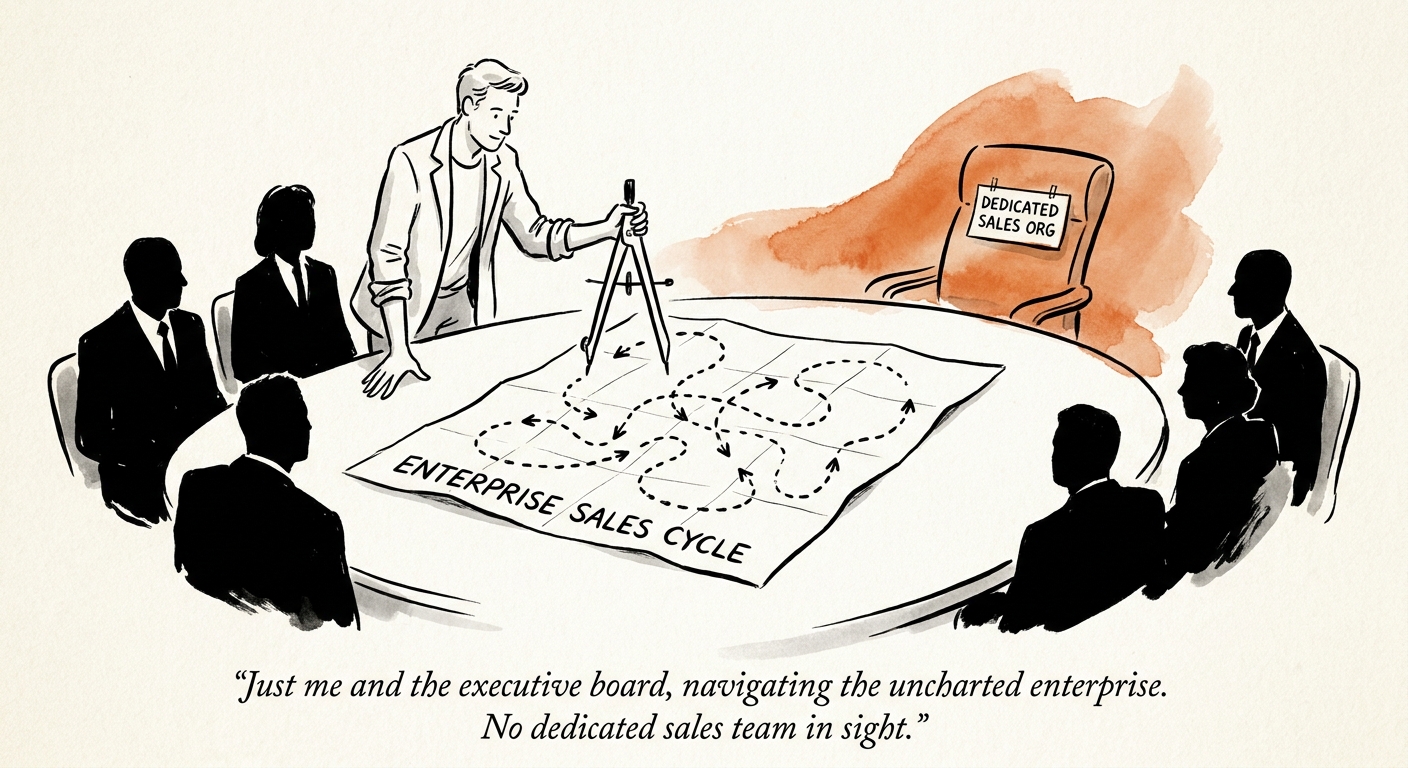
No Sales Org, No Funding, Fortune 500 Buyers: How Bootstrapped Founders Actually Close Enterprise Deals
Bootstrapped, no AE budget, chasing Fortune 500 logos? Here is how founders close six-figure enterprise deals using the team they already employ.
11.4 Decision-Makers in Enterprise Deals
BRIEF · PROJECT RECOVERY
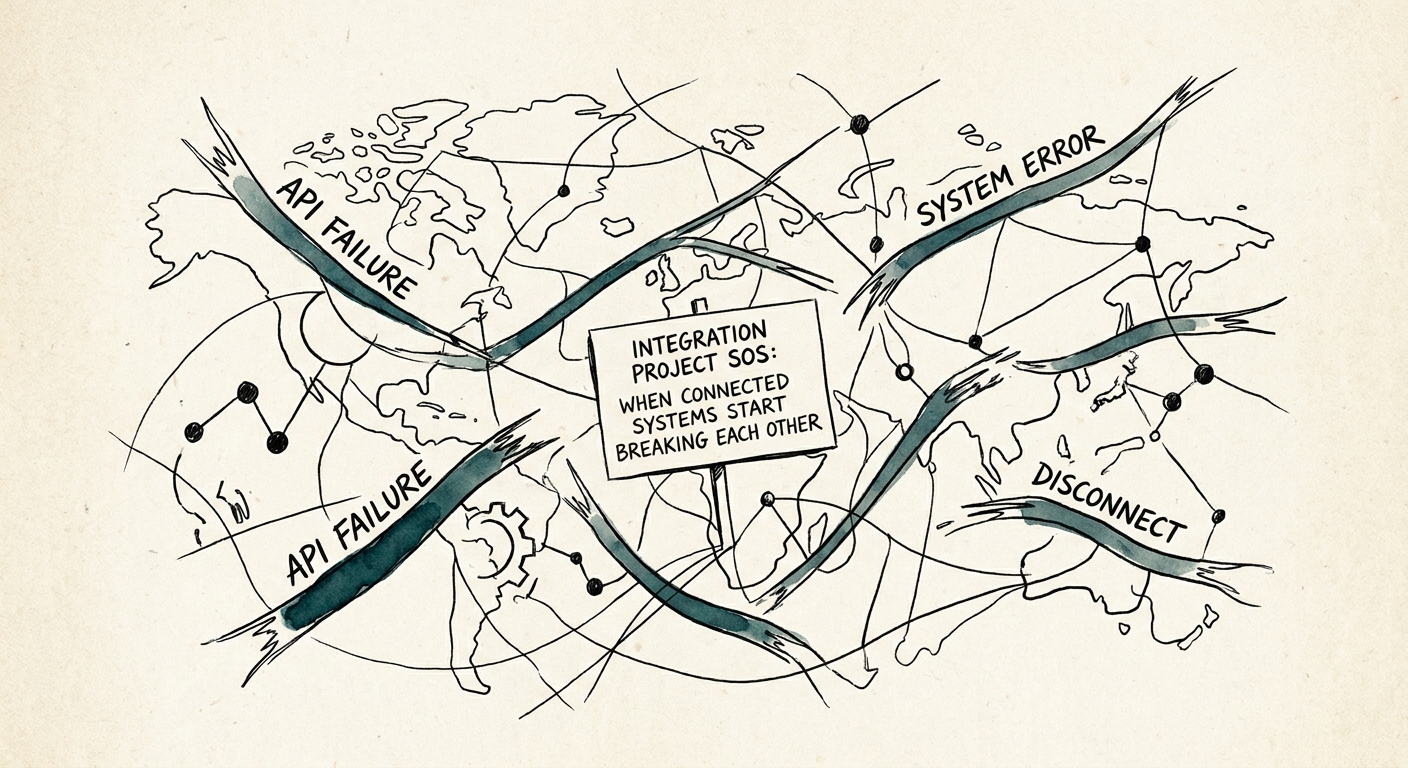
When Your APIs Start Breaking Each Other: A Recovery Playbook
Cascading API failures are rarely one bad connector. Map ownership, isolate the three drifts, and rebuild integrations a buyer can diligence.
Control plane first recovery milestone for brittle integrations
BRIEF · GTM EXECUTION
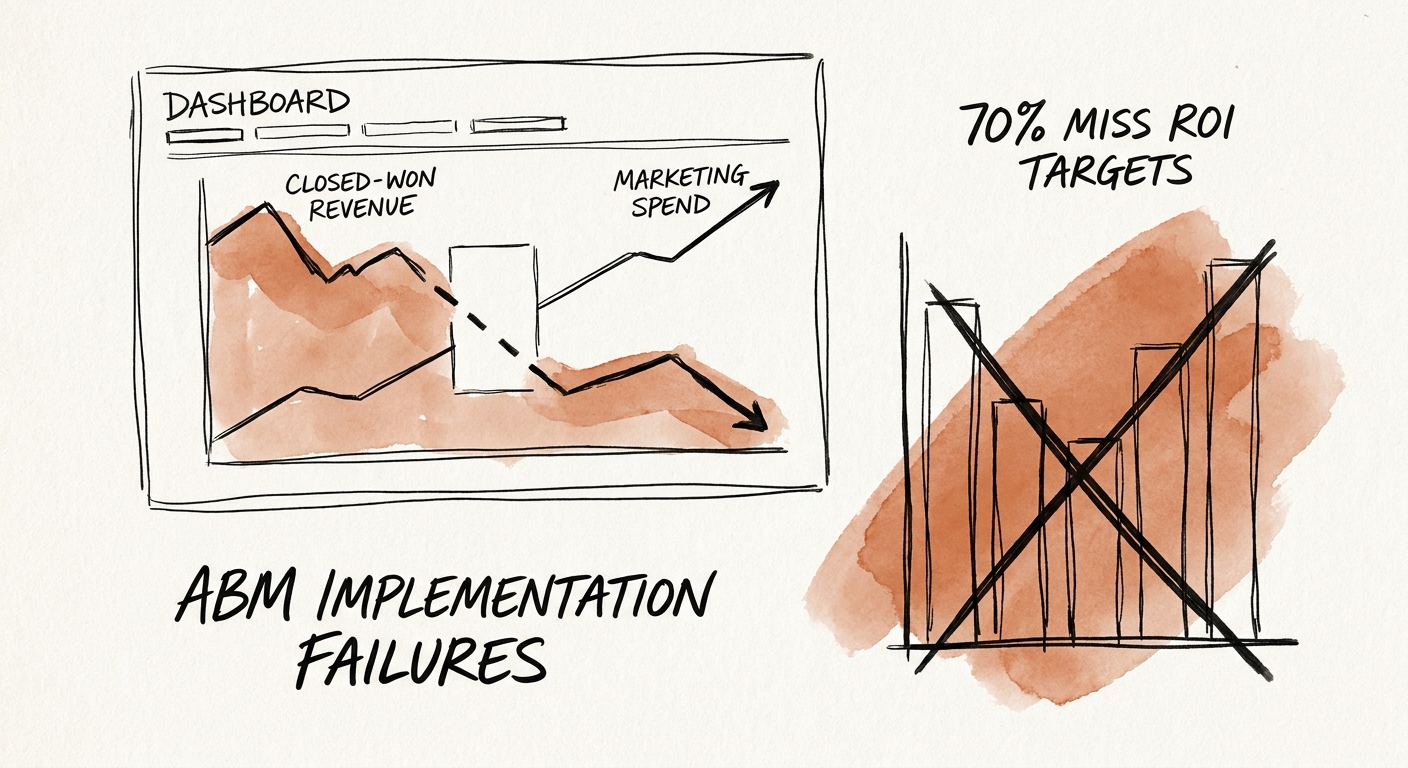
Your $220K ABM Program Closed Zero Deals. Here's the Audit That Explains Why.
A PE-portfolio SaaS company spent $220K on ABM and closed nothing. The failure wasn't the software — it was sales coverage. Here's the diagnostic.
70% of ABM programs fail to hit ROI targets in year one
BRIEF · PROJECT RECOVERY
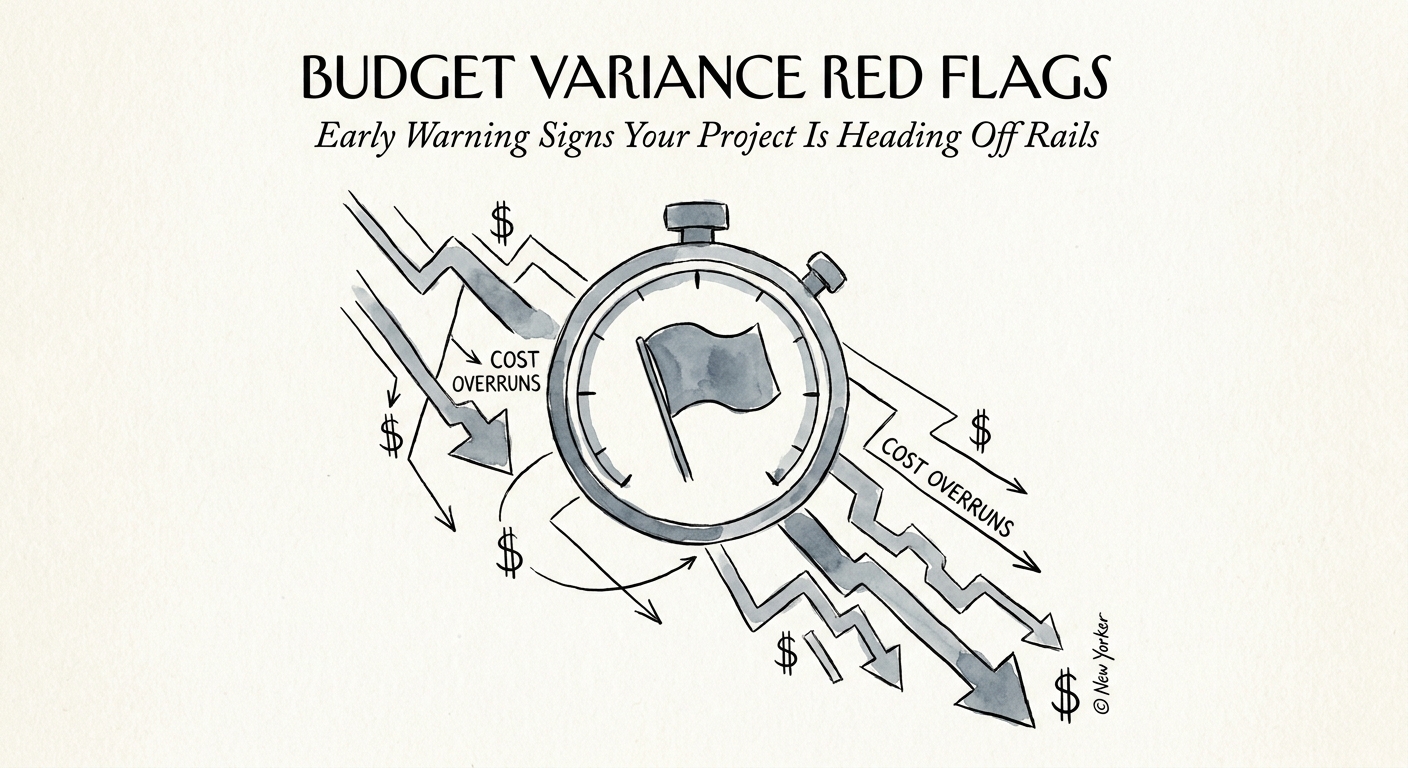
The 5% Budget Variance That Becomes a $1.2M Hole: Reading IT Project Red Flags Early
A 5% variance in month one is a leading indicator, not a rounding error. How operators read burn-vs-earned-value and intervene before a project becomes a black swan.
45% Average Cost Overrun for Large IT Projects
BRIEF · REVENUE ARCHITECTURE
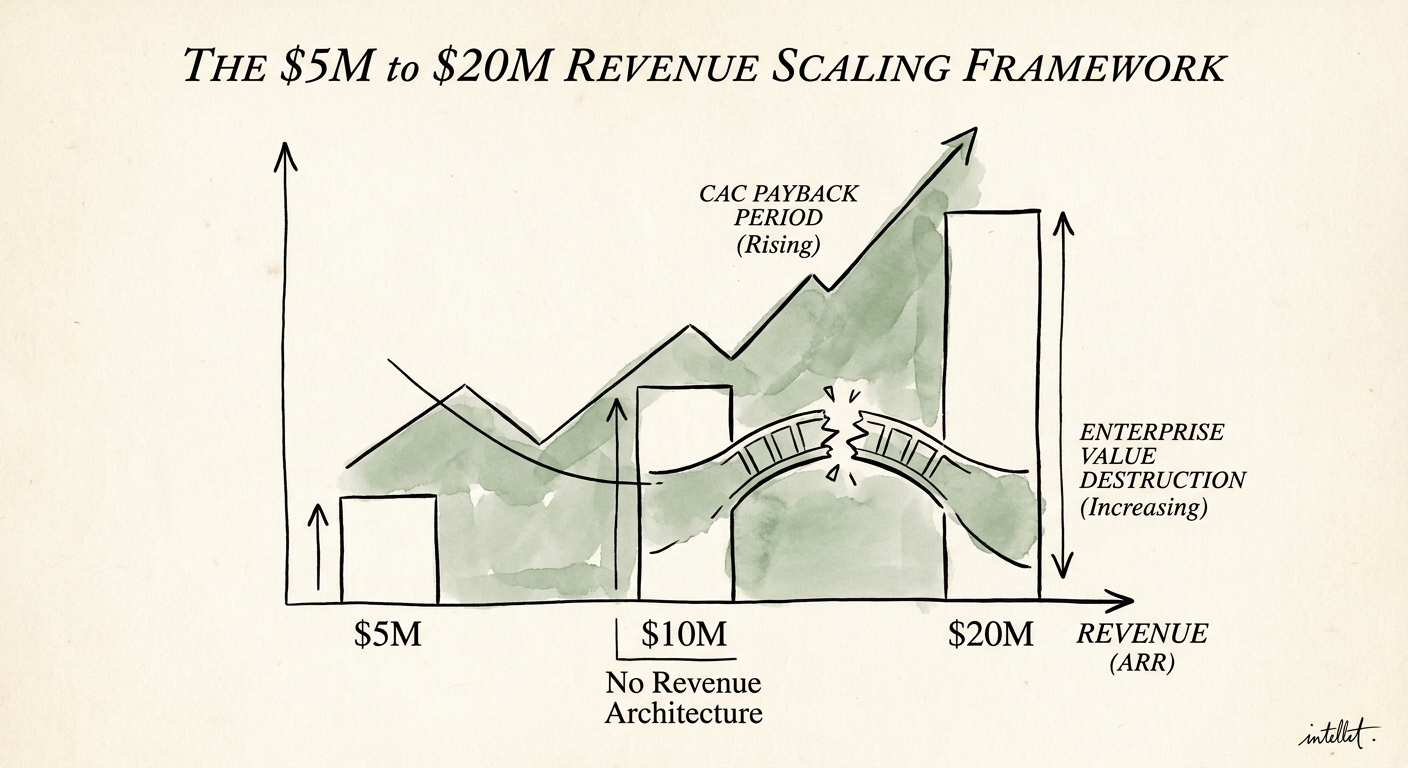
$5M to $20M ARR: Why Your Second Sales Hire Closes Half What the Founder Did
The systems that got you to $5M ARR break at $10M. Here's the revenue architecture that has to exist before you hire the next rep — not after.
3 GTM foundations to validate before scaling headcount
BRIEF · MIGRATION & INTEGRATION
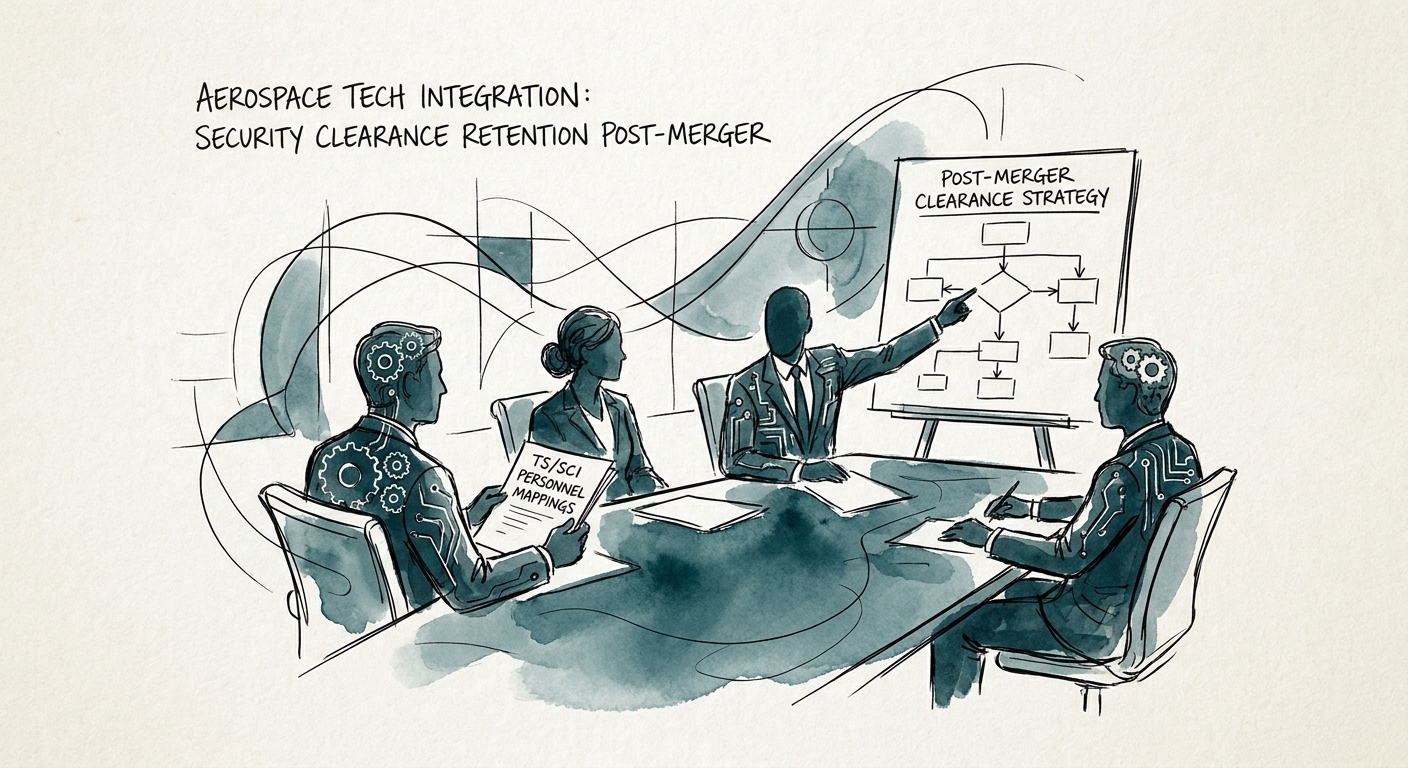
Aerospace M&A: Why Your TS/SCI Engineers Walk Before Day One
In aerospace defense M&A, a single resigned TS/SCI engineer can strand months of contract billings. How to map the flight risk and hold the cleared bench.
$200,000 Uncaptured Revenue per Departed TS/SCI Engineer
BRIEF · PROJECT RECOVERY
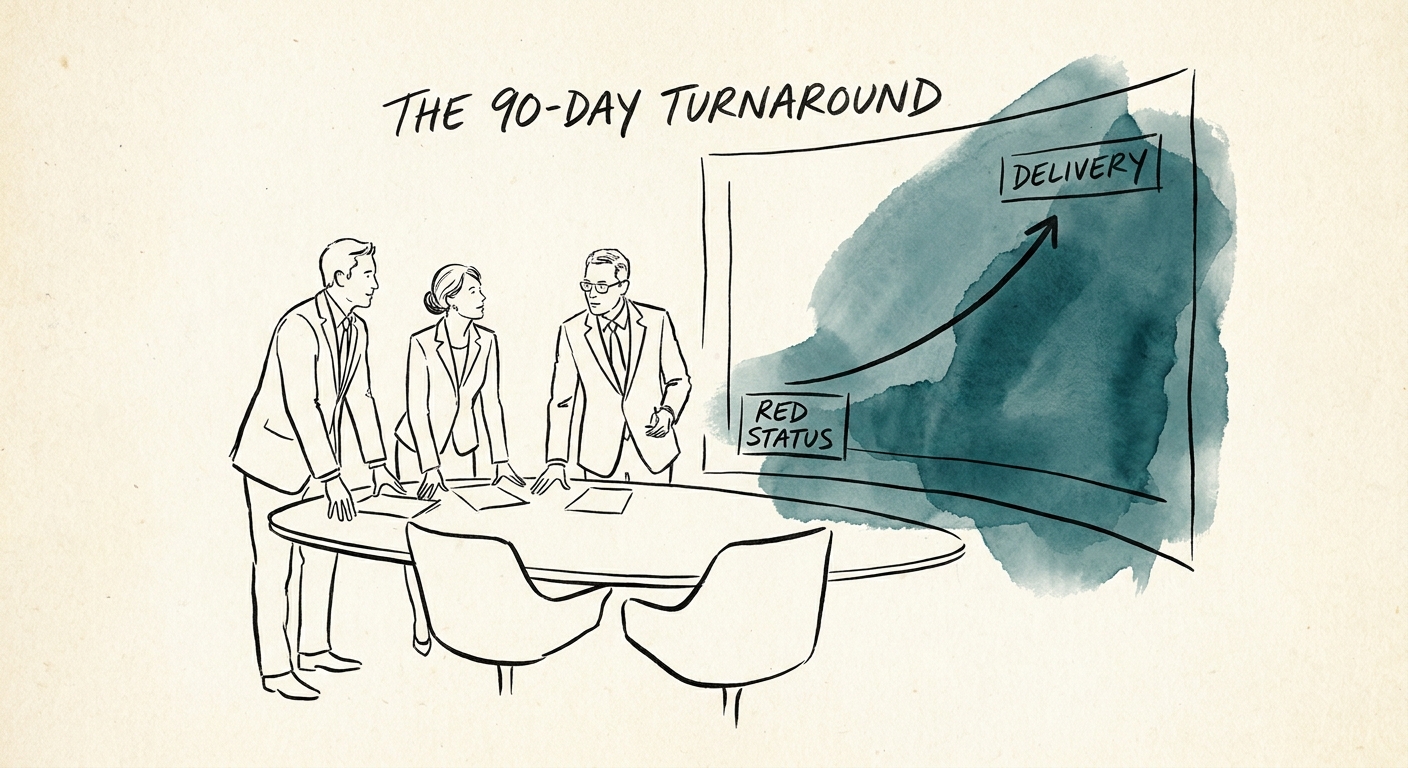
Red Status, 90 Days: How to Pull an Enterprise IT Project Back From the Brink
Your dashboard says yellow. The math says red. A 90-day playbook for CIOs to freeze, reset governance, and prune a stalled enterprise IT project back to live.
14.3% monthly budget bleed on stalled enterprise IT projects
BRIEF · GTM EXECUTION
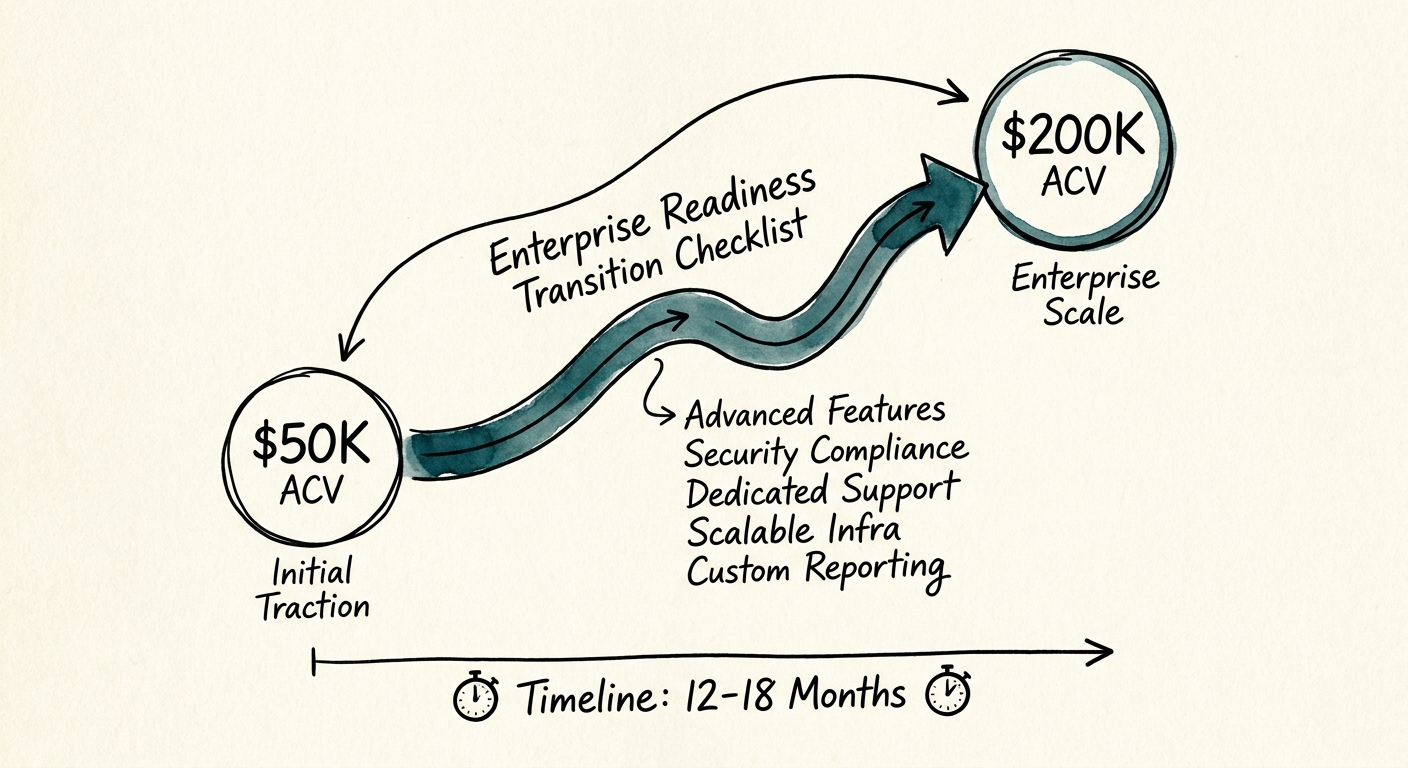
$50K to $200K ACV: What Actually Breaks When You Go Upmarket
The jump from $50K to $200K ACV quadruples your price and doubles your sales cycle. Here is what breaks first — and the checklist to clear before you commit.
42 Days Added to sales cycles for enterprise infosec reviews
BRIEF · PROJECT RECOVERY
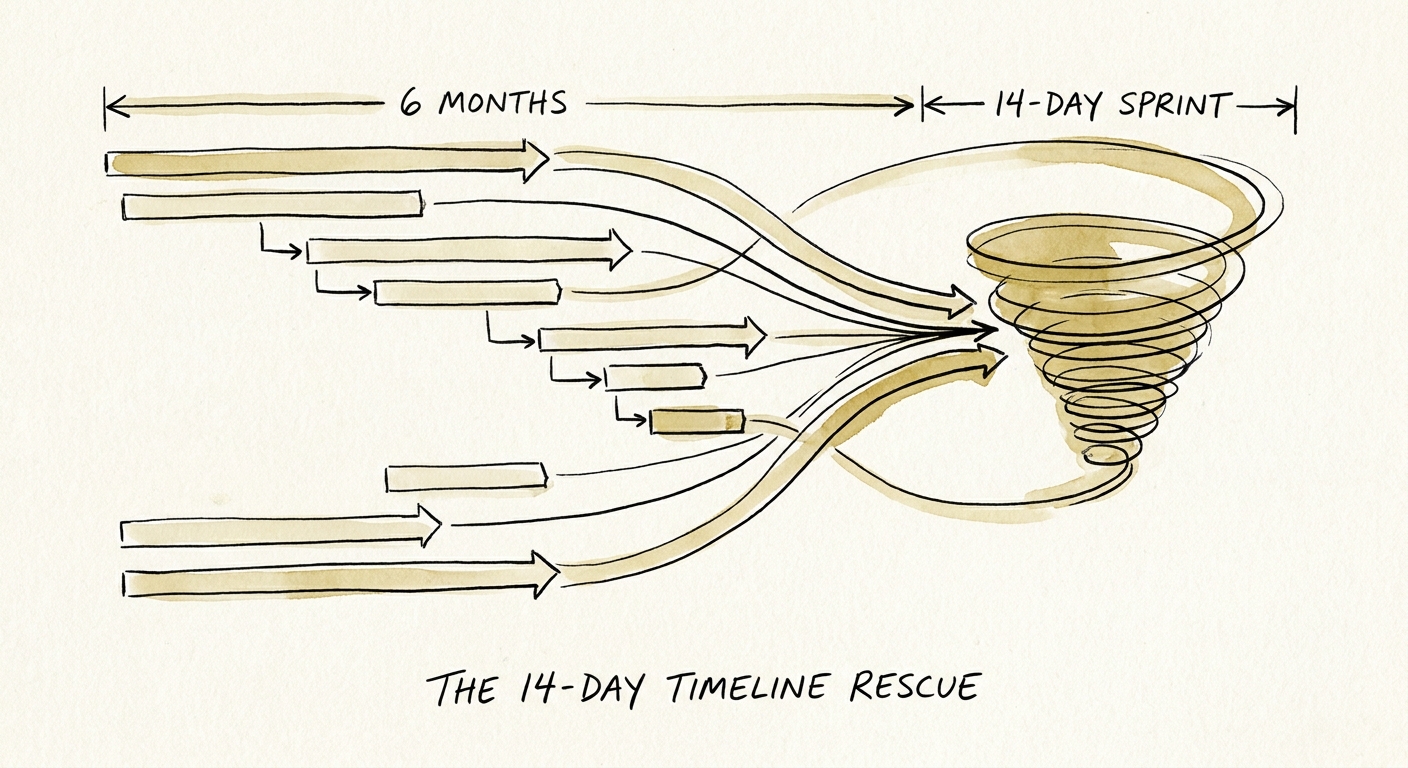
The 14-Day Timeline Rescue: Compressing 6 Months of Work Into Achievable Sprints
A delayed software implementation destroys 56% of projected ROI. Learn the 14-day sprint compression strategy to rescue stalled projects and regain board trust.
45% Average budget overrun for large IT projects
BRIEF · PROJECT RECOVERY
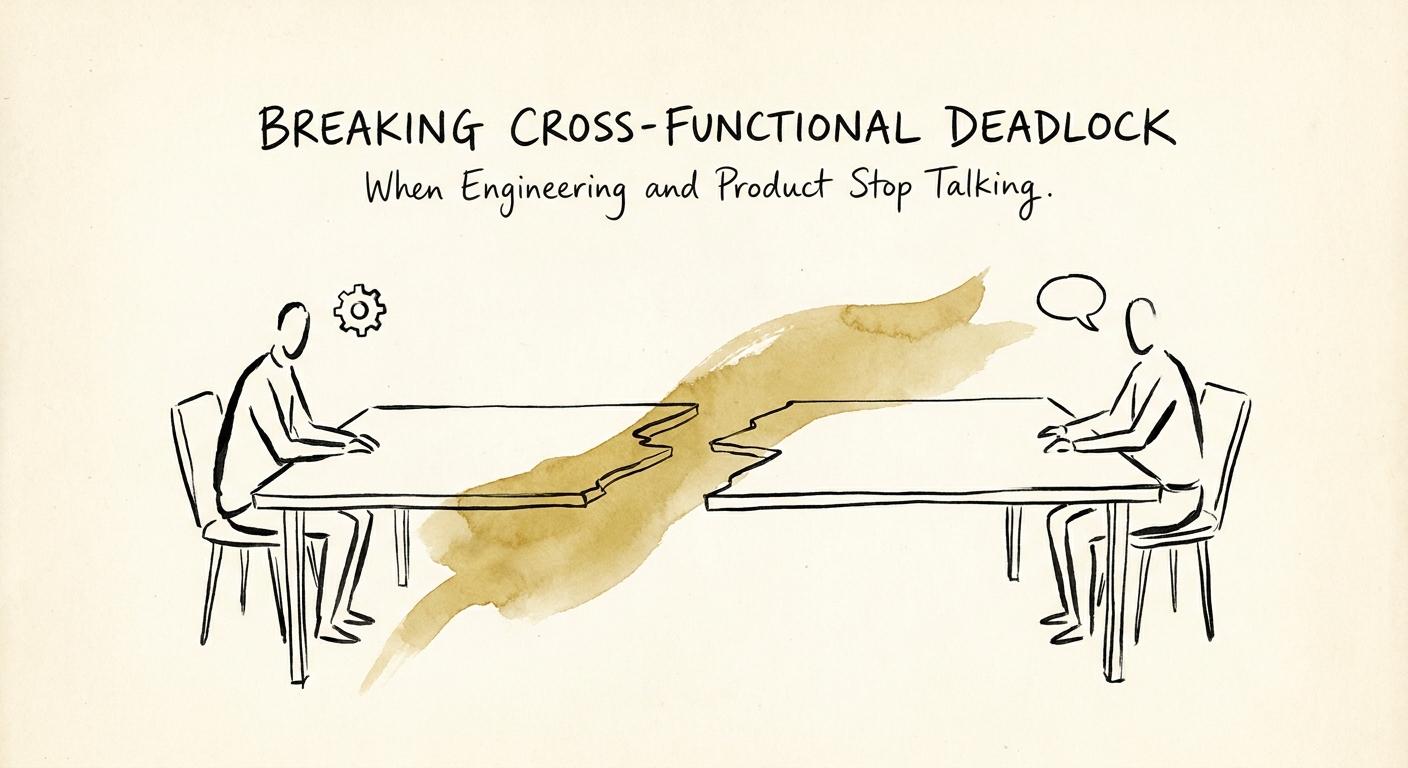
When Product and Engineering Stop Talking at $50M ARR (And How to Force the Reconnect)
At $50M ARR, a silent product-engineering standoff quietly drains millions in idle dev capacity. Here's how to spot the three tells and force the reconnect.
$4.2M Annual Cost of Product-Engineering Deadlock
BRIEF · PROJECT RECOVERY
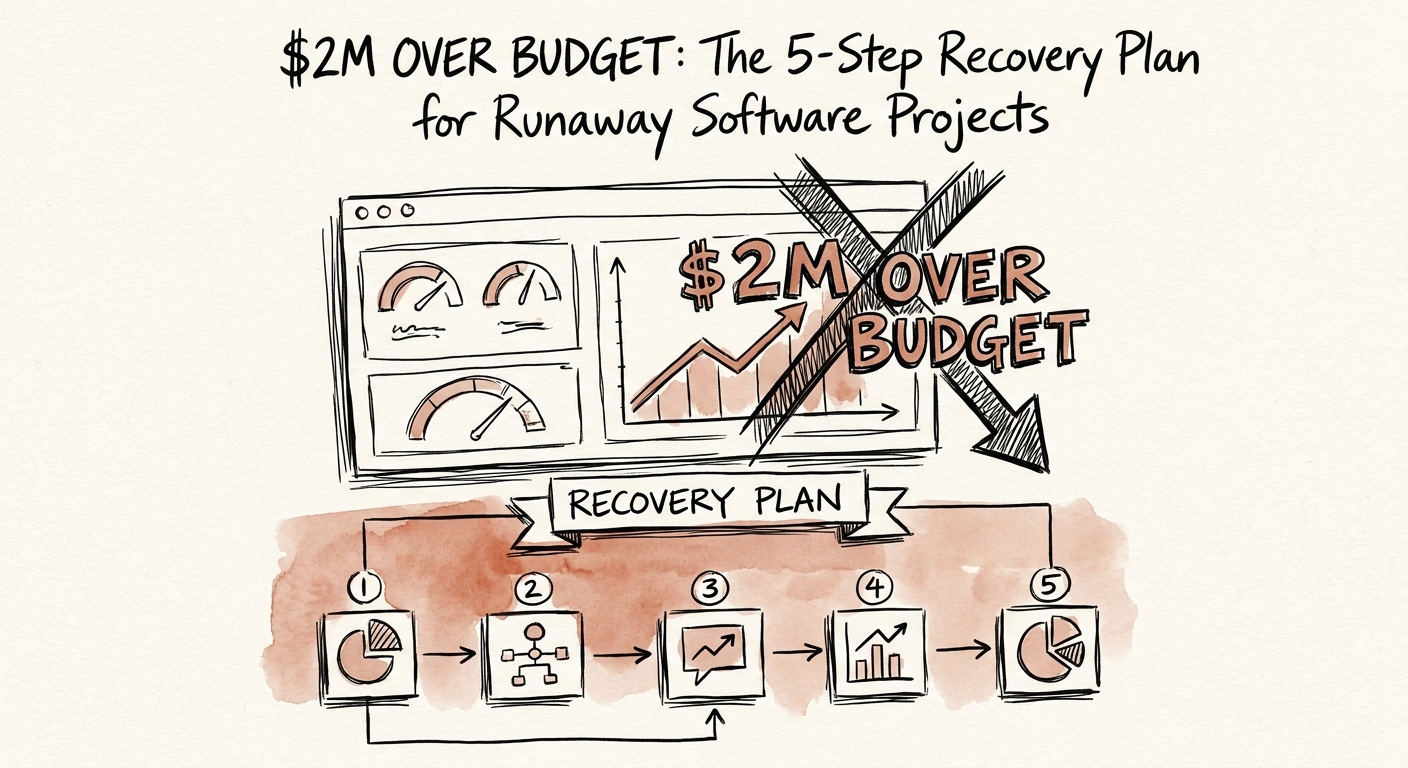
$2M Over Budget: The 5-Step Recovery Plan for Runaway Software Projects
When your portfolio company's software project blows past its budget, traditional PMO fixes won't save it. Justin Leader outlines the 5-step recovery plan to stop the bleeding and salvage EBITDA.
45% Average IT Project Budget Overrun
BRIEF · FINANCIAL INFRASTRUCTURE
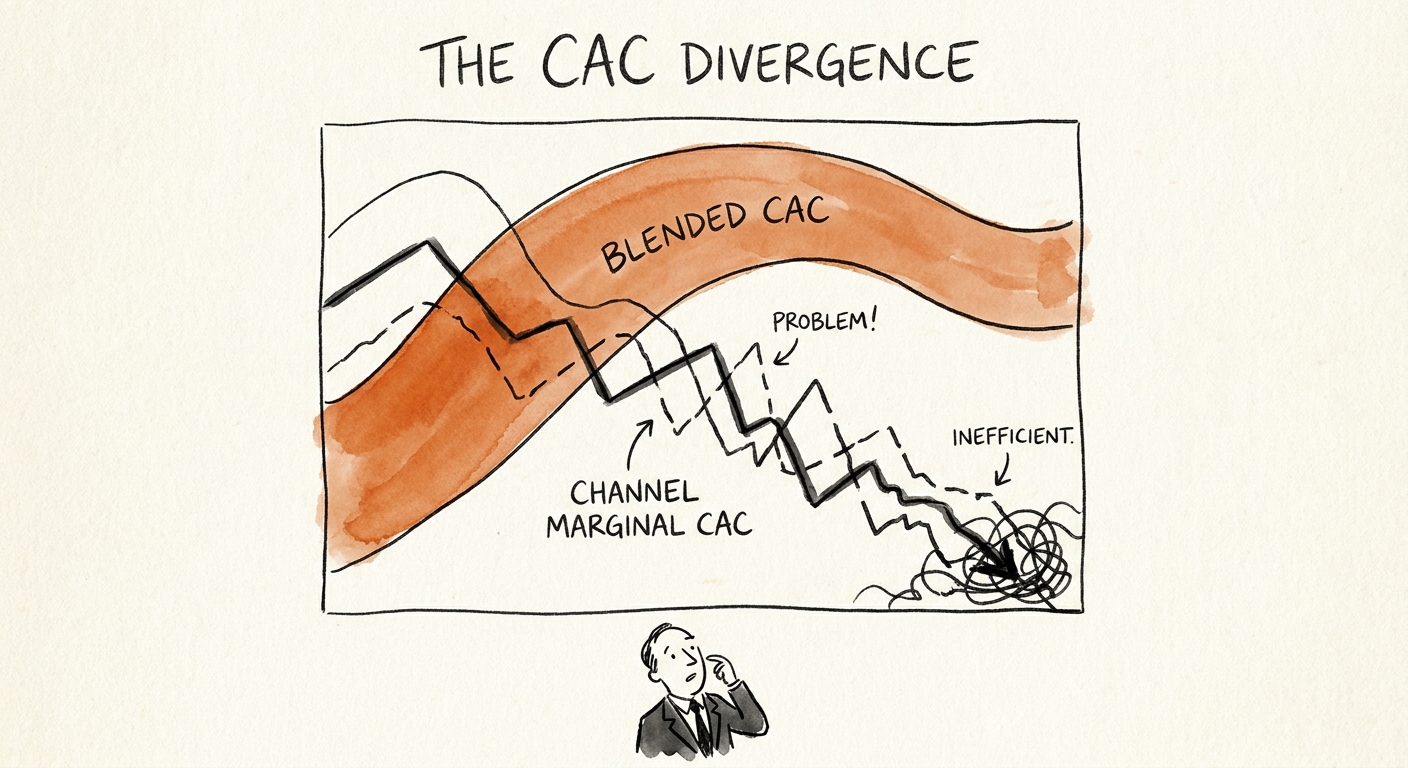
Your $12K Blended CAC Is Three Numbers Wearing a Trenchcoat
A $40M ARR SaaS company showed a 14-month CAC payback. Its paid search was actually 38 months. How blended CAC hides the channel eating your EBITDA.
3.5x Variance between worst and best channel CAC in mid-market SaaS
BRIEF · REVENUE ARCHITECTURE
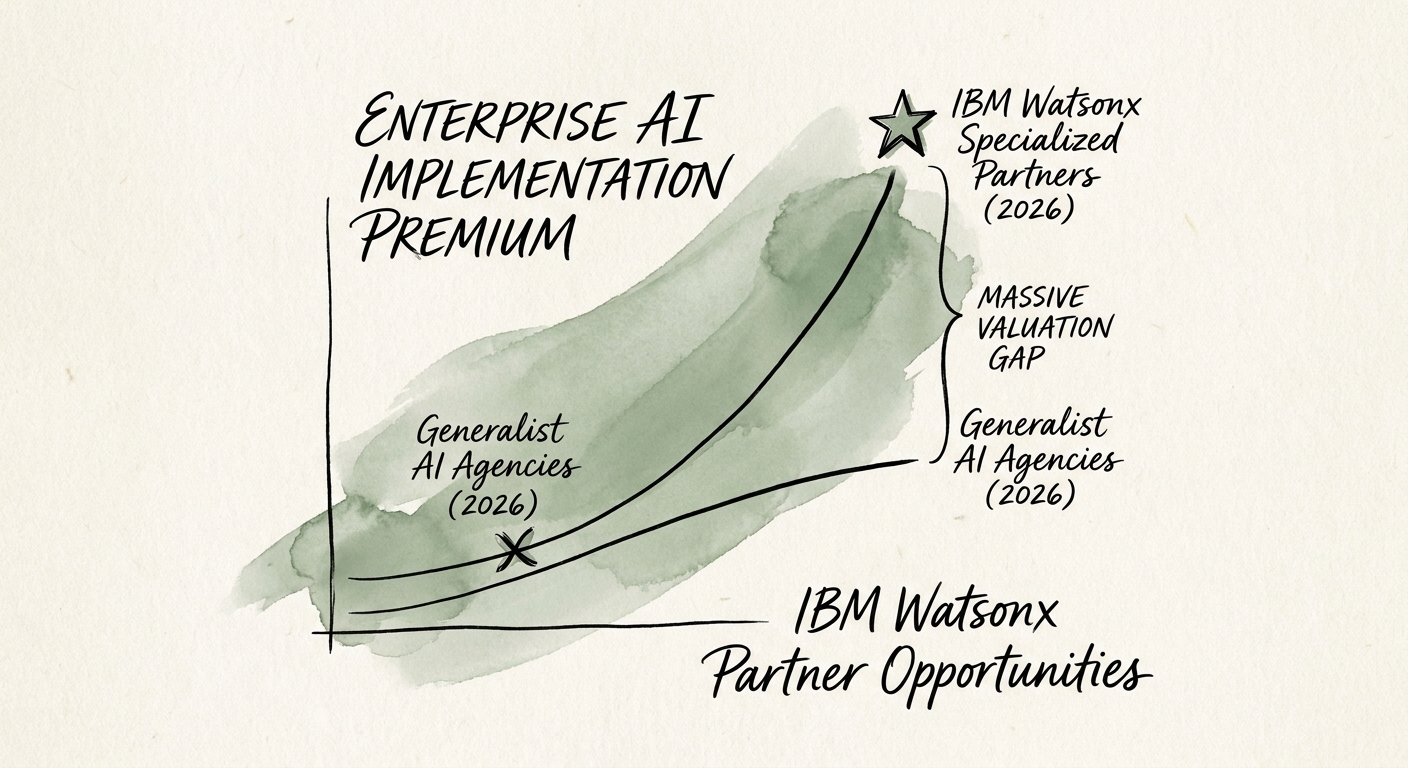
Should Your Firm Build a watsonx Practice? The Partner Math That Actually Matters
A watsonx badge doesn't sell work. Here's how an AI implementation firm decides whether a watsonx practice will compound margin or just collect dust.
3 practice capabilities buyers expect beyond tool access
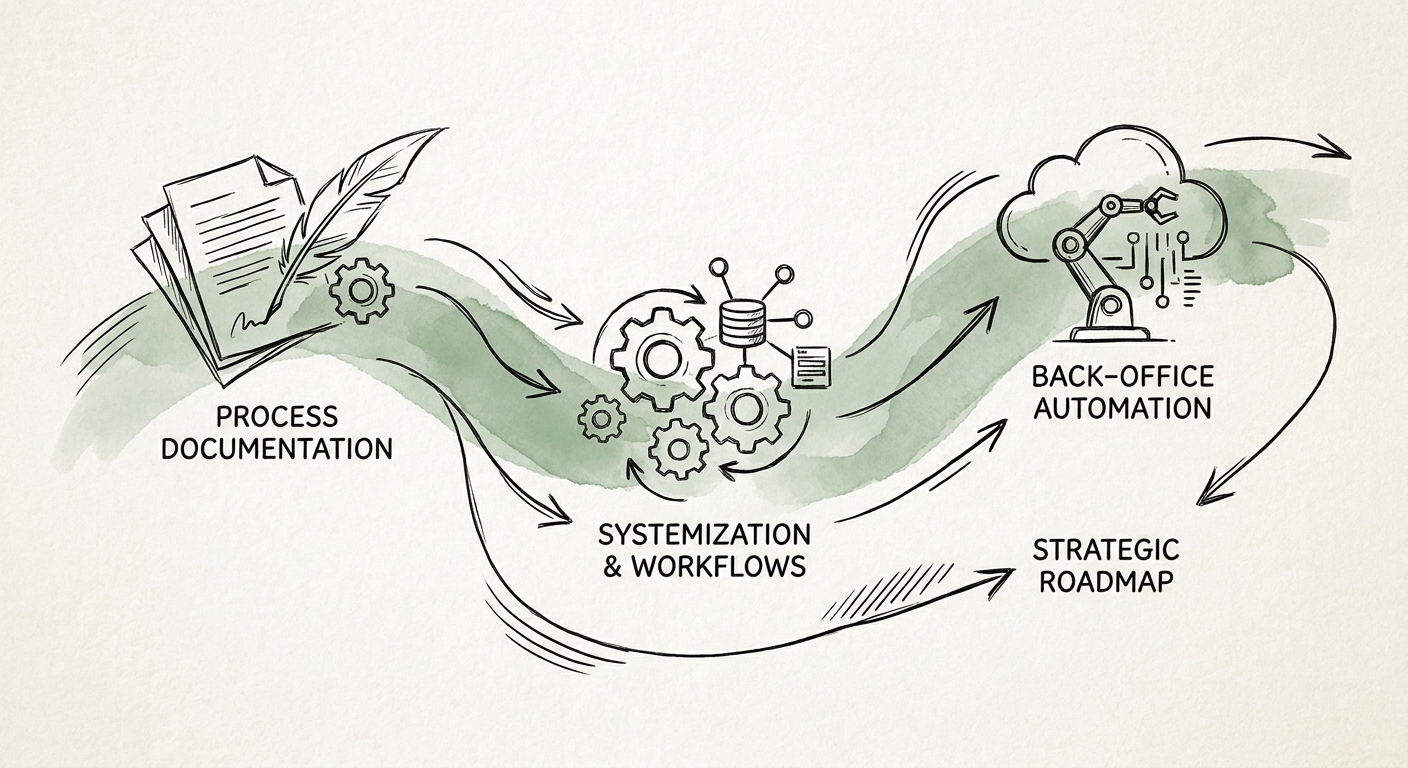
BRIEF · PROCESS DOCUMENTATION
The VLOOKUP Tax: Why Your SaaS Back Office Hires Linearly (And How to Stop)
Eight people reconciling Stripe against NetSuite by hand is not a staffing problem — it's a margin leak. How SaaS scale-ups break linear back-office hiring.
73% Failure rate of automation implementations due to undocumented underlying processes
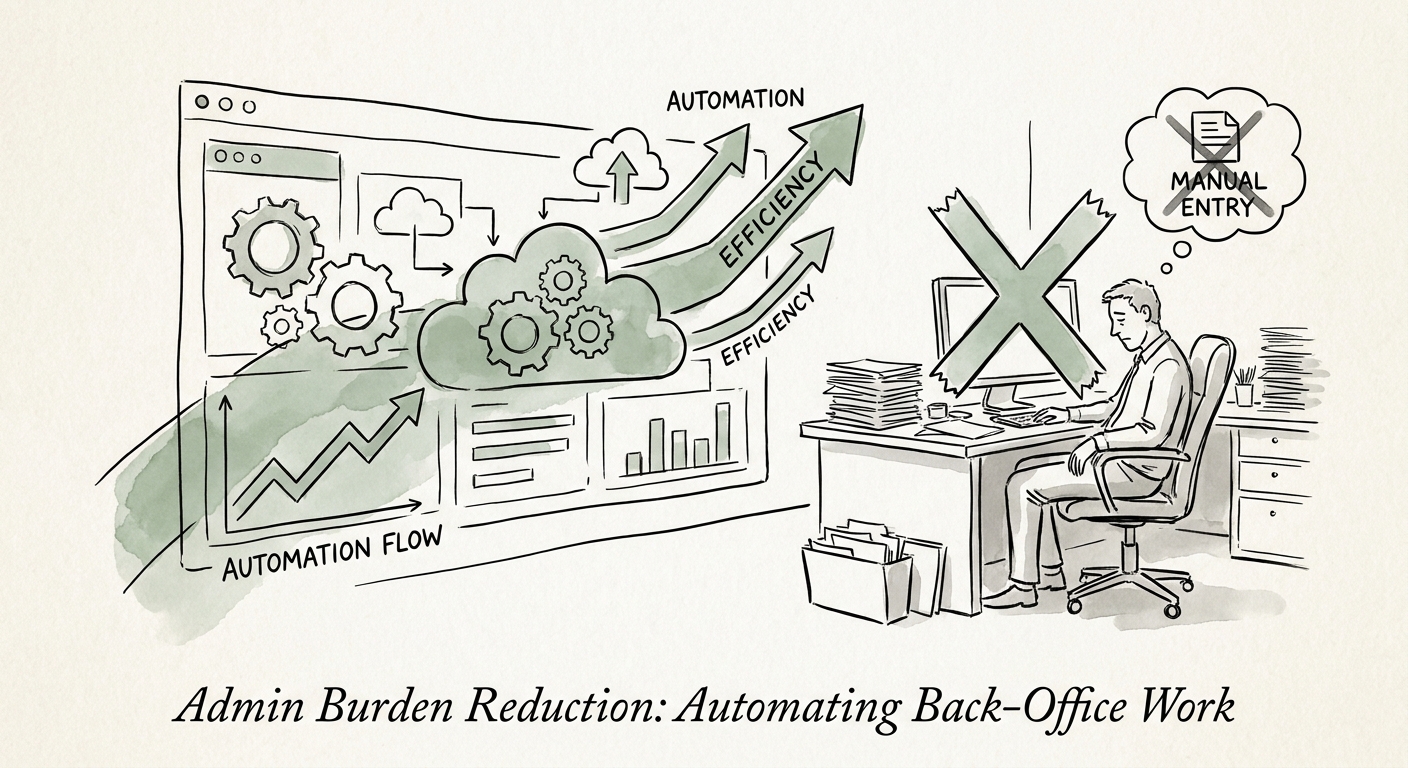
BRIEF · PROCESS DOCUMENTATION
What Tech Services Firms Should Automate First (Hint: Not Delivery)
Most tech services firms automate the wrong thing first. Here is the exact sequence — quote-to-cash, bench, onboarding — that protects margin and lifts your exit multiple.
2.5x EBITDA Multiple Premium for Automated Operations
BRIEF · MIGRATION & INTEGRATION
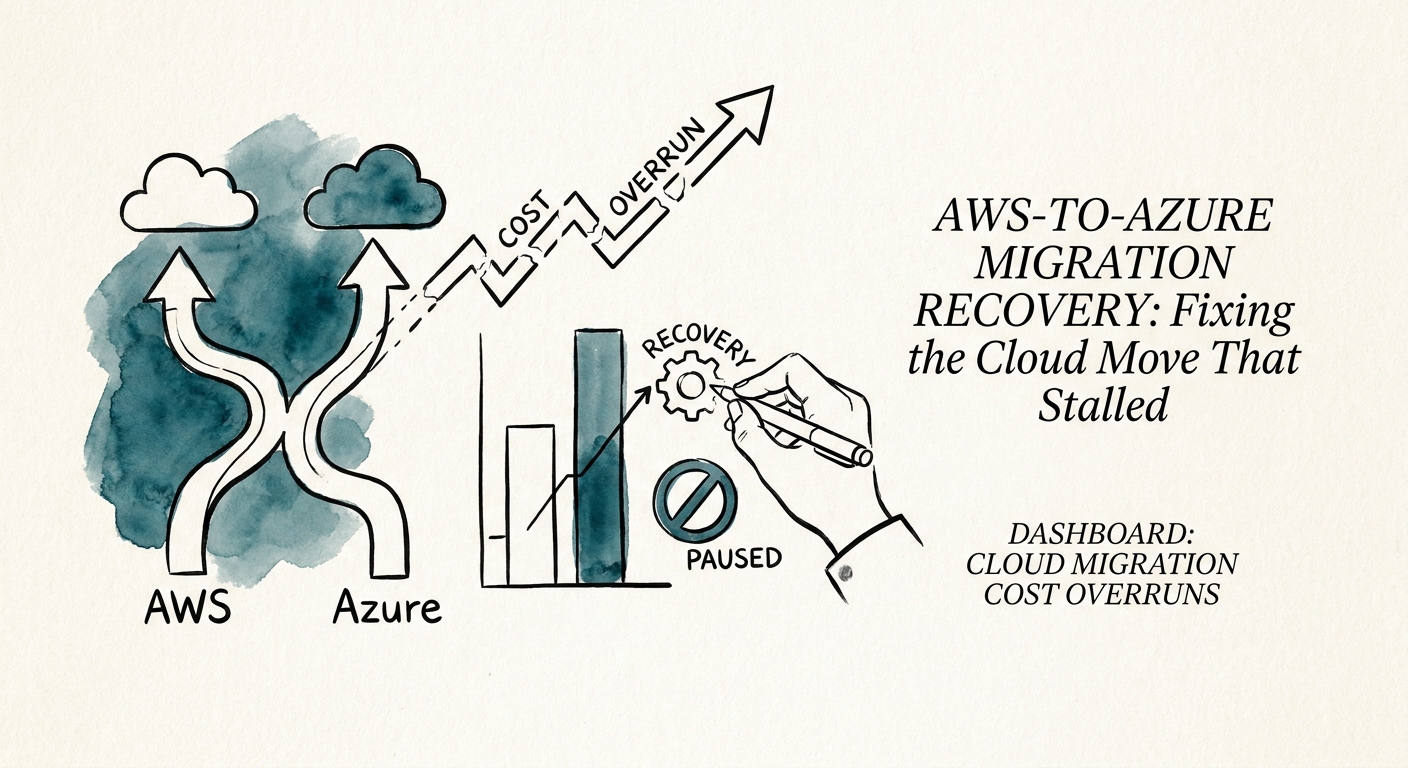
The AWS-to-Azure Migration That Stalled on an Enterprise Agreement: A Recovery Playbook
A Microsoft EA discount looked like free money. Then DynamoDB, IAM, and S3 egress froze the migration. Here is how to triage and restart it.
43% of cloud migrations experience significant cost overruns
BRIEF · TEAM & HIRING
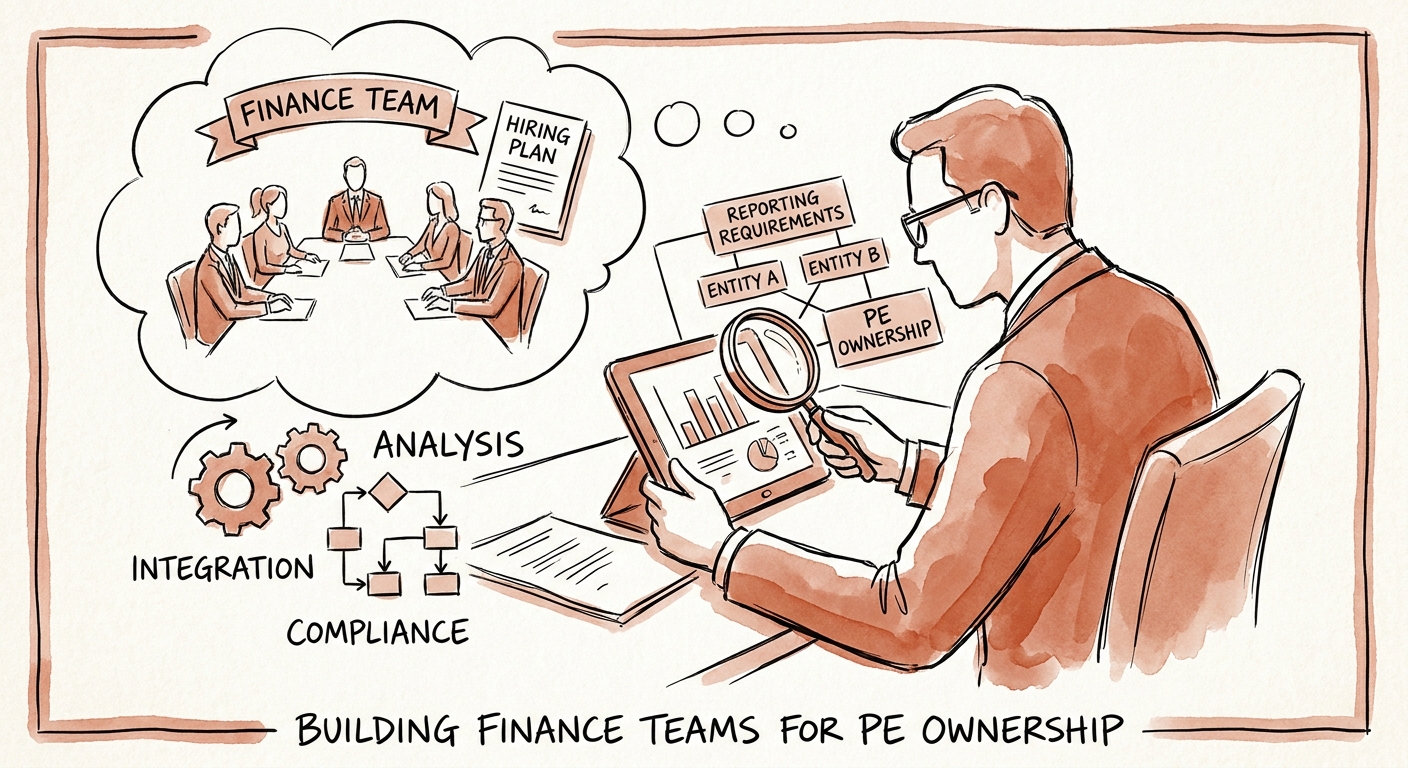
Building a Finance Team After a PE Buyout: The Reporting Cadence That Decides Your Hires
Your new sponsor wants a 13-week cash forecast in 60 days and a hard close in under 5. Here's who to hire, who to cut, and the order to do it post-close.
14% Exit Valuation Loss Due to Slow Financial Close
BRIEF · TEAM & HIRING
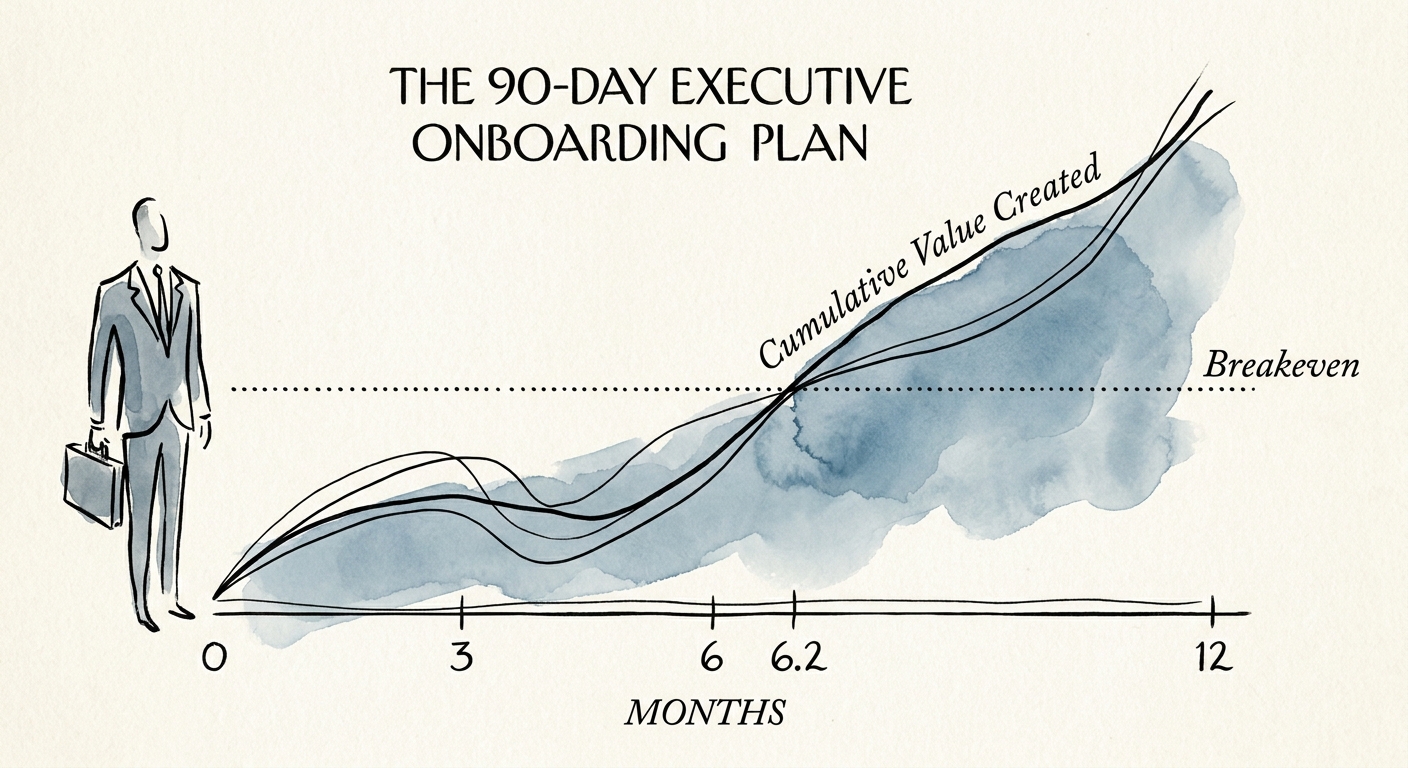
The 90-Day Onboarding Plan That Decides Whether Your New Executive Survives
Most new execs take 6.2 months to break even — and 60% underperform for two years. Here's the 30-60-90 onboarding architecture that fixes both.
6.2 Months to Executive Breakeven Point
BRIEF · COMPLIANCE & SECURITY
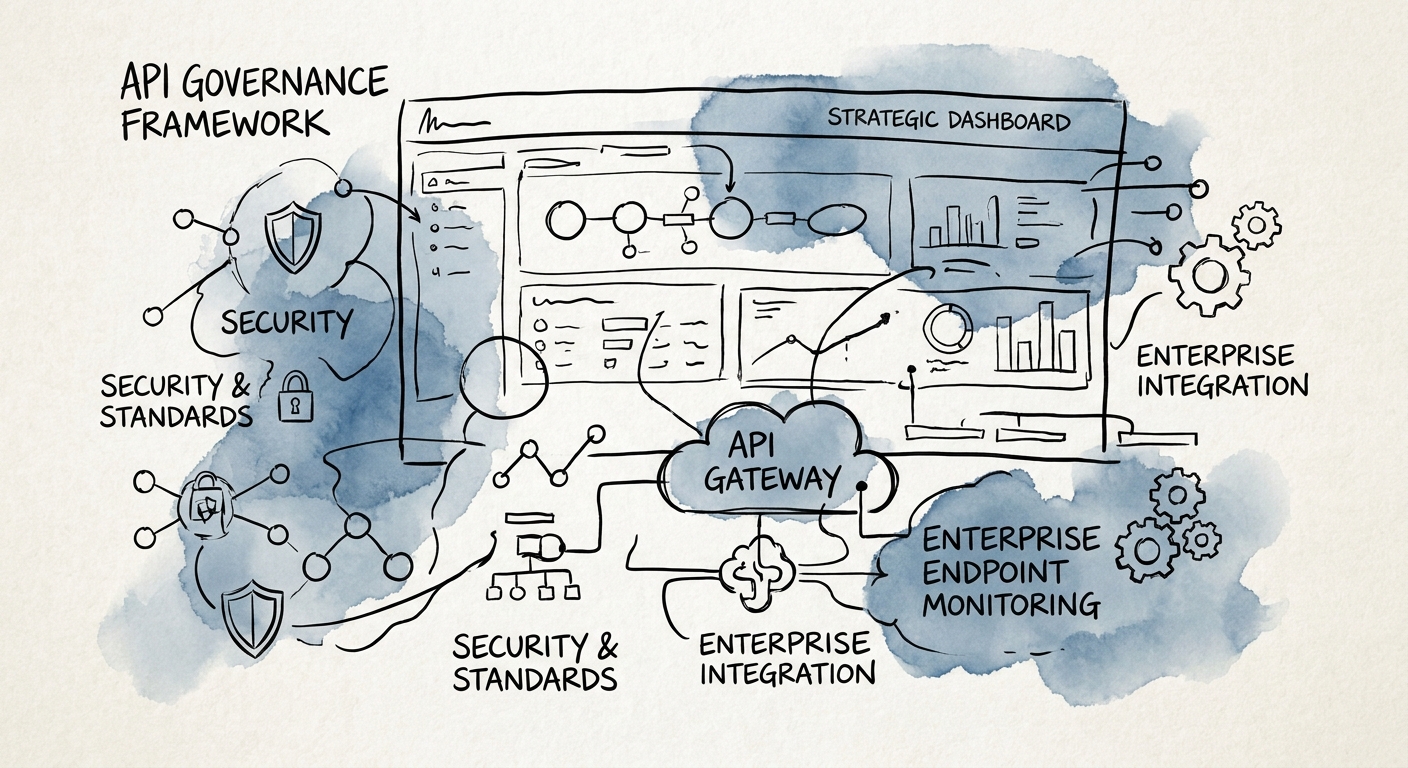
The API Nobody Owned: How Shadow Endpoints Get Priced Into Your Deal
In tech M&A, an unmapped API a buyer's auditor finds in week two becomes a price adjustment. Here's how API governance gets dissected — and how to be ready.
10% Organizations that fully document their APIs
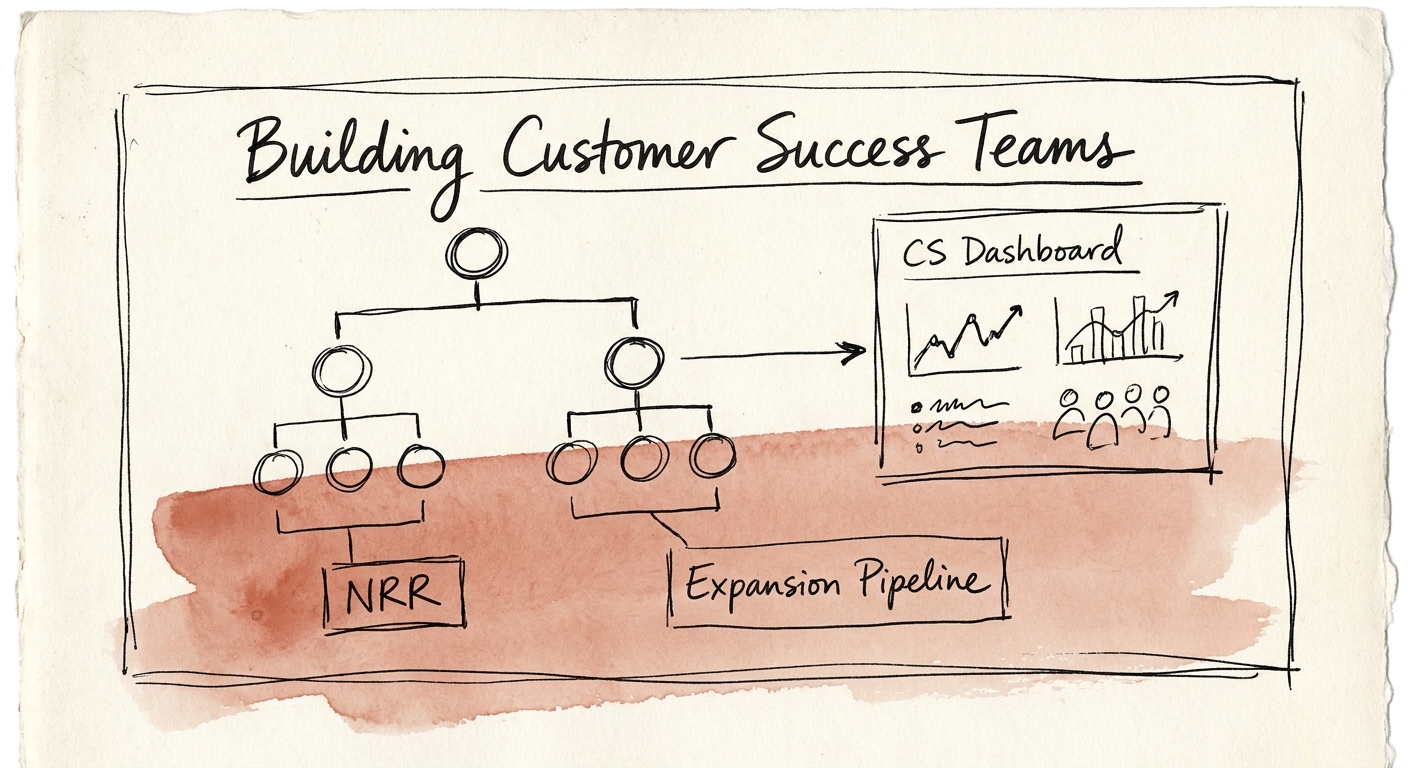
BRIEF · TEAM & HIRING
Customer Success in a Tech Services Firm: Who You Hire and Who They Report To
Re-titling account managers as CSMs is a margin trap for $15M tech services firms. Here is who to hire, the reporting line that matters, and what buyers check.
1.5x Valuation Discount on Co-Mingled CS Teams
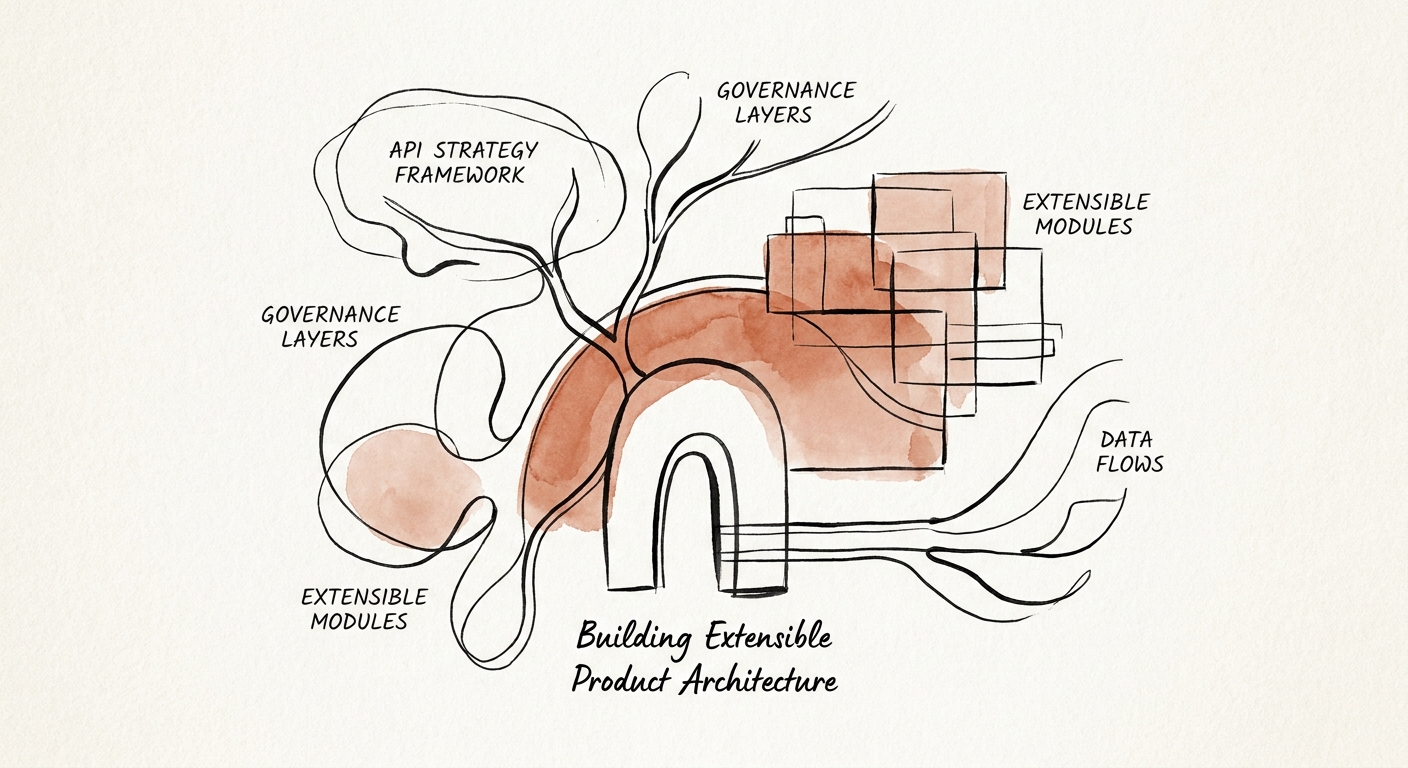
BRIEF · PROCESS DOCUMENTATION
Your API Is a Product. Right Now It's Priced Like a Liability.
A scaling SaaS platform failed diligence over 142 undocumented endpoints. Justin Leader on turning API sprawl into an extensible architecture buyers pay for.
22% Valuation haircut for undocumented APIs
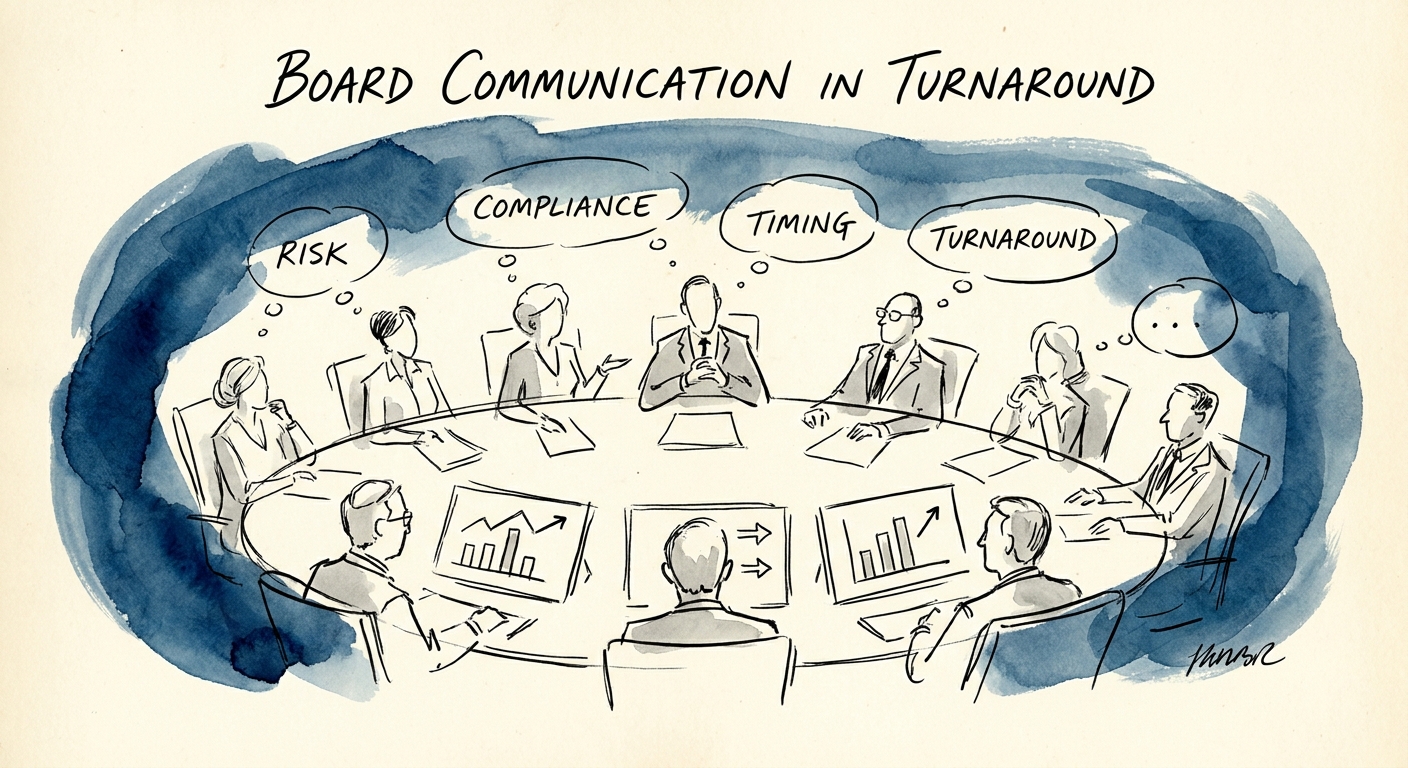
BRIEF · COMPLIANCE & SECURITY
The 13-Week Cash Flow Won't Show You the Breach Building in Your RIF
In a PE turnaround, the cuts that fix liquidity quietly erode security and compliance. Here is how to put cyber risk on the board agenda in dollars, not jargon.
$10.22M Average U.S. Cyber Incident Cost
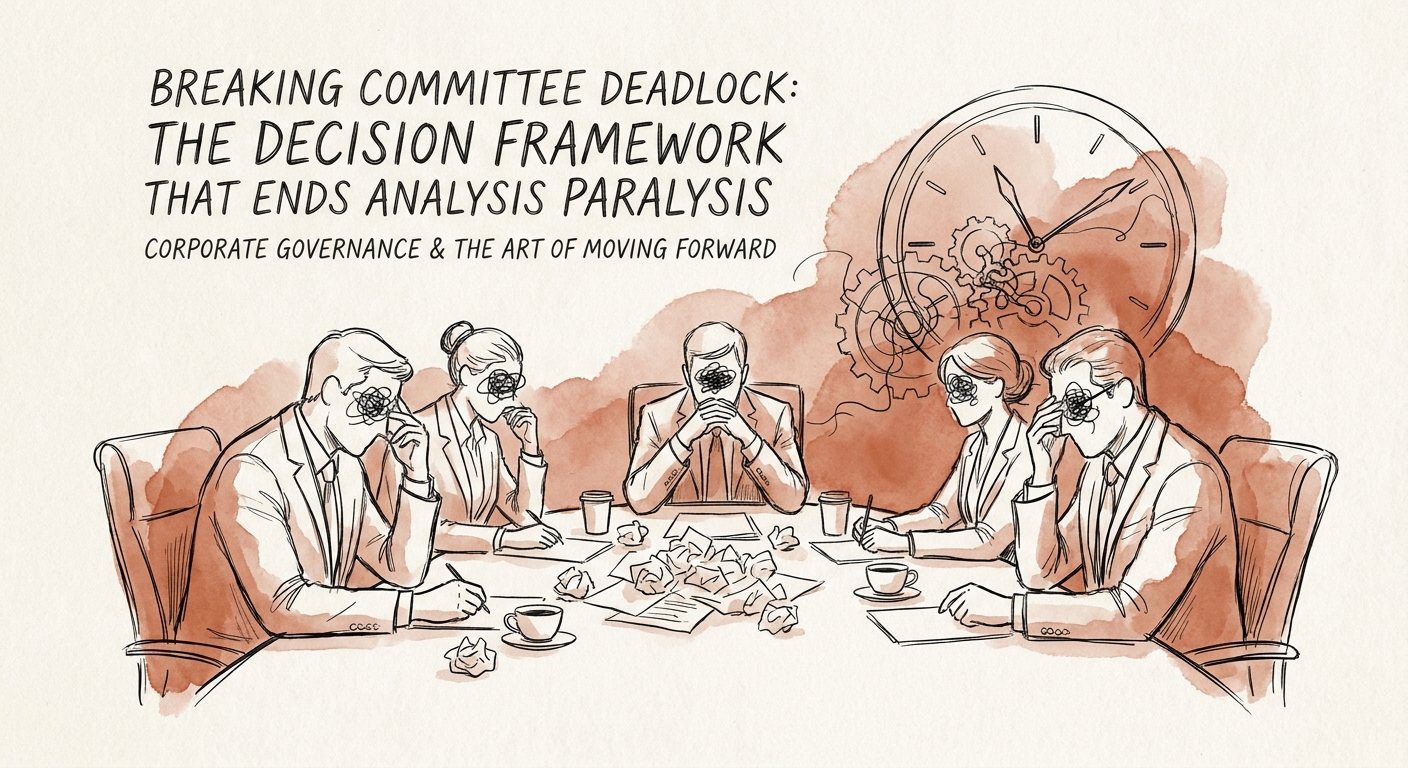
BRIEF · COMPLIANCE & SECURITY
Your Security Steering Committee Is the Vulnerability: Killing Deadlock Before Diligence
A 14-person security steering committee debated zero-trust for six months and opened a $2.4M gap. Here's the consent model that kills deadlock before diligence.
56% Value Destruction Due to Governance Delays