BRIEF · EXIT READINESS
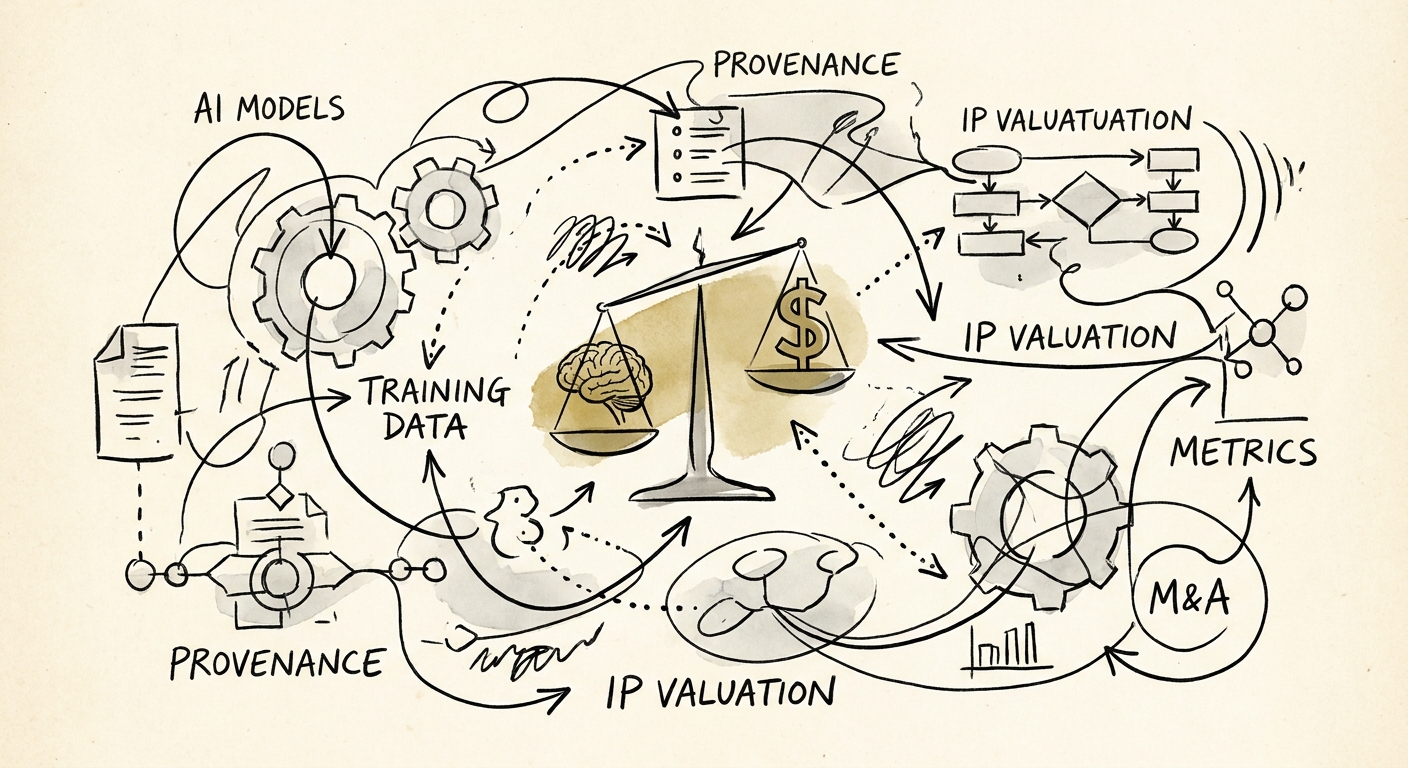
Your AI Model Is Worth $0 If You Can't Trace the Training Data
Acquirers discount AI IP up to 60% when data provenance is murky. How to prove lineage on your models and training sets before a PE deal team arrives.
60% Valuation haircut on undocumented AI IP
BRIEF · MIGRATION & INTEGRATION
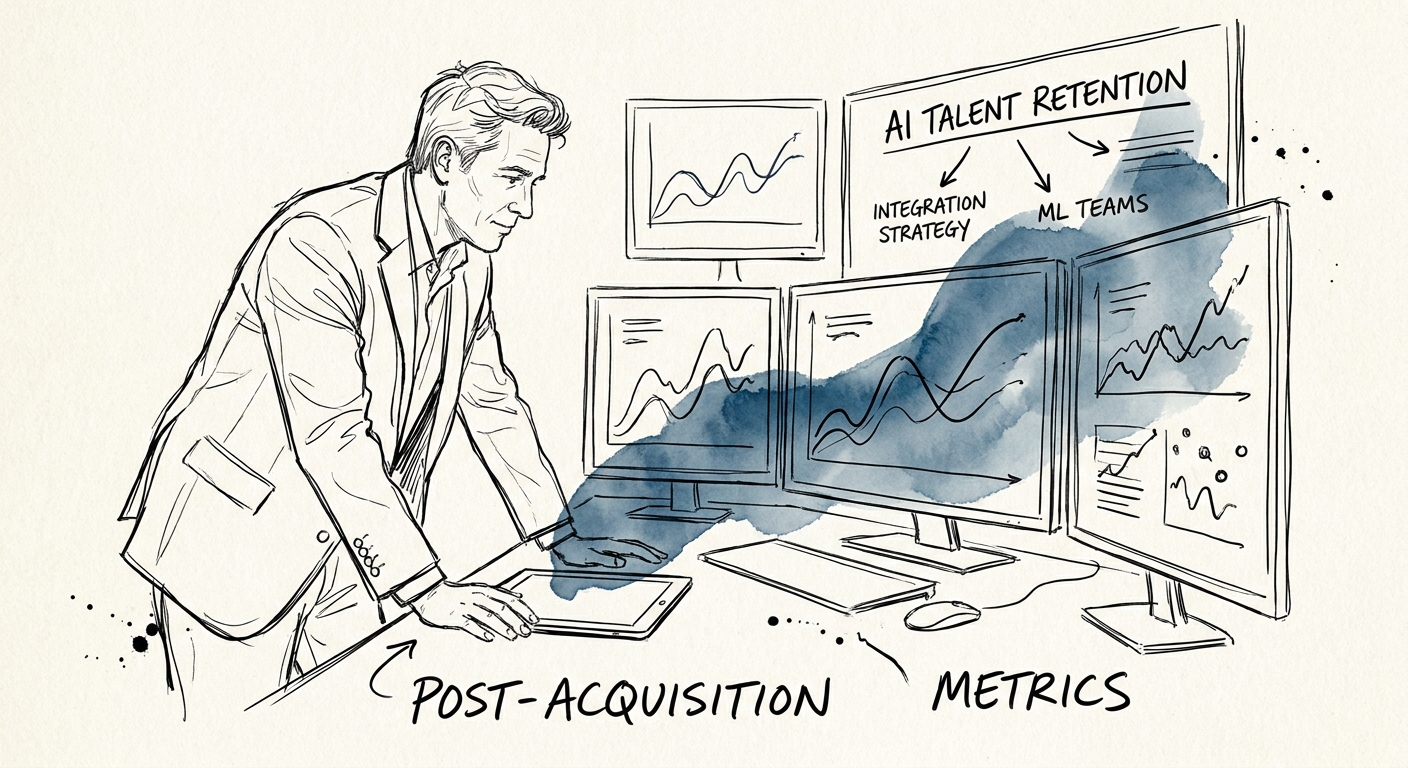
The Day Your Acquired ML Team Starts Interviewing: A Post-Close Retention Playbook
Acquired ML engineers don't quit over money. They quit the week IT puts a two-week ticket between them and a GPU. Here's the post-close playbook that keeps them.
68% AI Talent Churn in First 9 Months
BRIEF · PROJECT RECOVERY
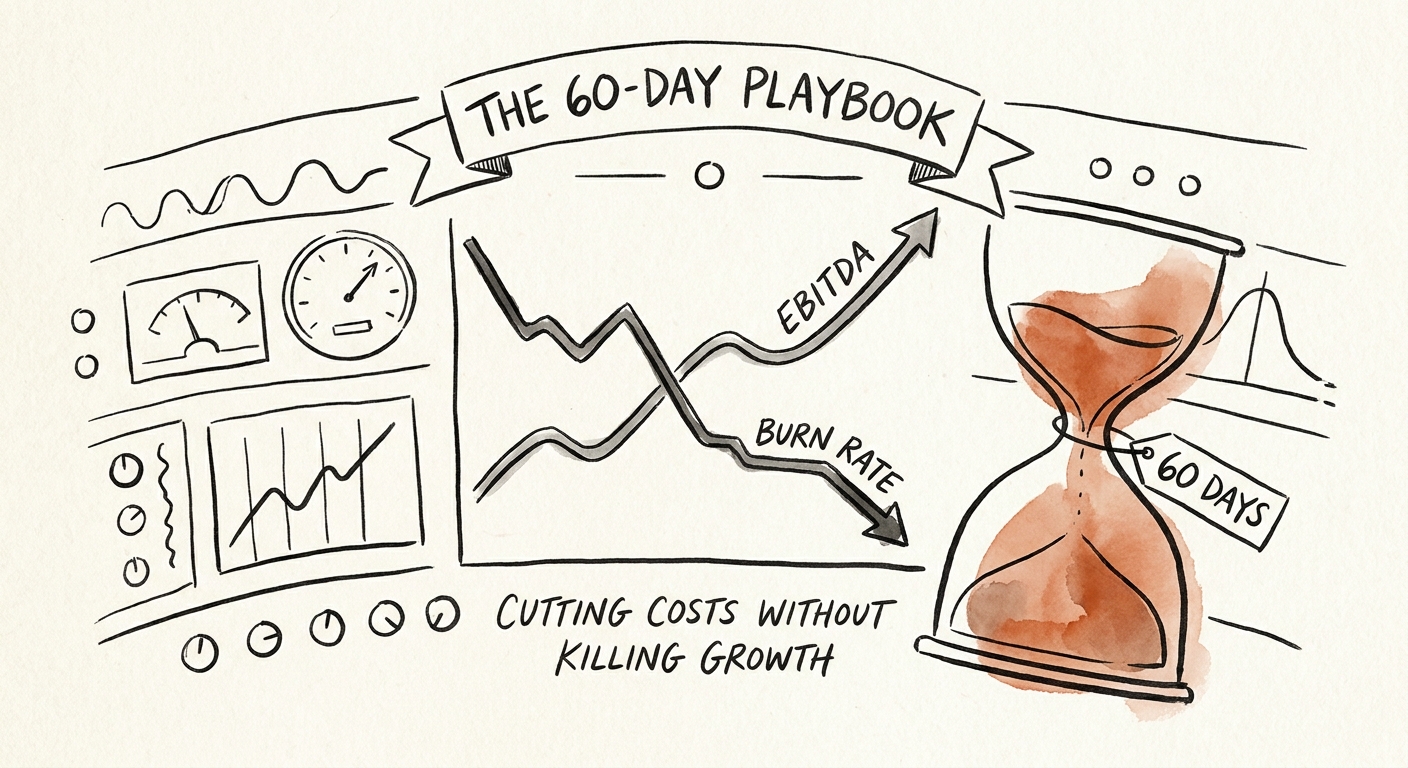
The 60-Day Burn Rate Cut That Doesn't Torch Your Next Raise
A day-by-day sequence to cut SaaS burn in 60 days: kill software and cloud waste in weeks 1-4, then realign GTM by CAC payback — without starving pipeline.
30% Cloud Spend Often Wasted Without FinOps
BRIEF · TECHNICAL DEBT
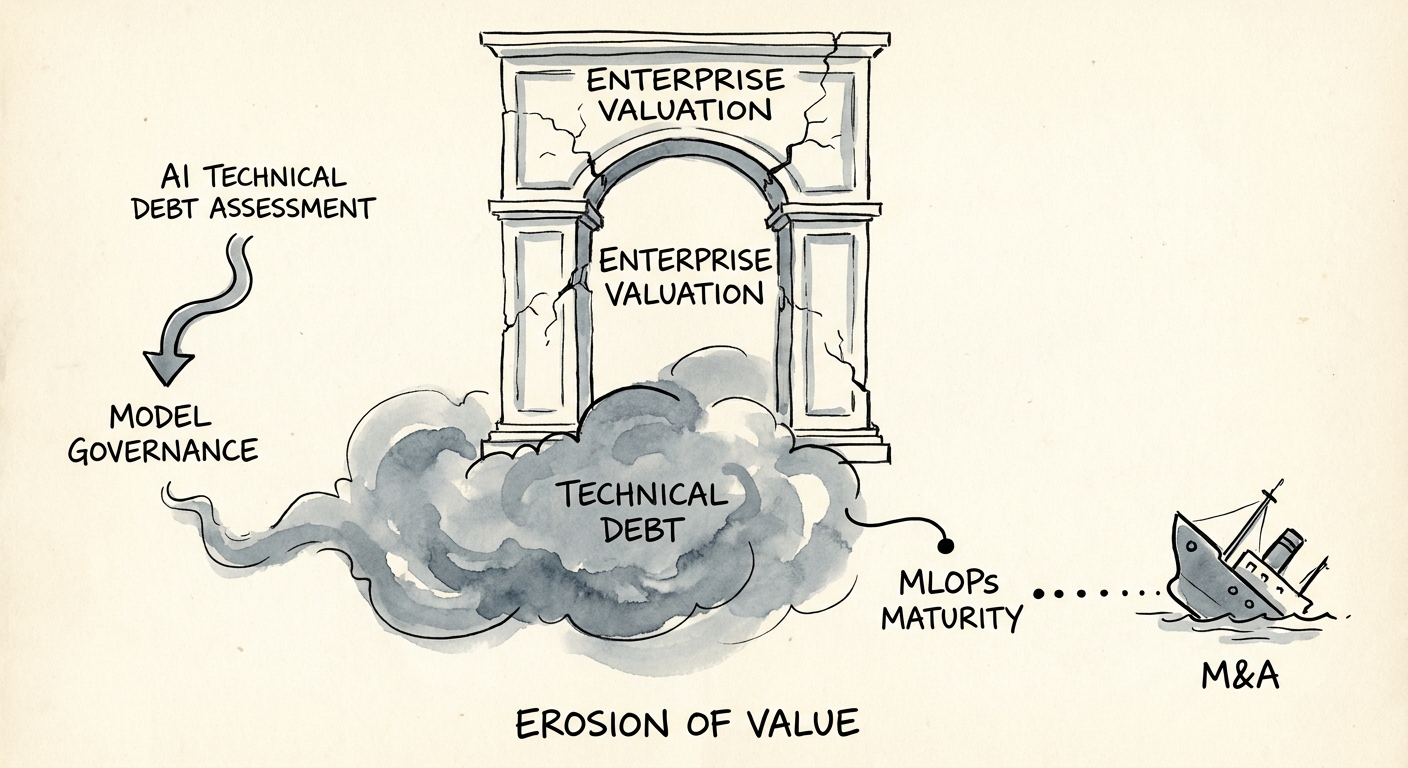
The MLOps Audit: How to Price an AI Target Before the Models Quietly Rot
AI targets don't fail in the codebase—they fail in the retraining pipeline. A buyer's field guide to auditing MLOps maturity, model drift, and registry gaps.
400% Maintenance vs. Development Cost Ratio for Ungoverned AI
BRIEF · TECHNICAL DEBT
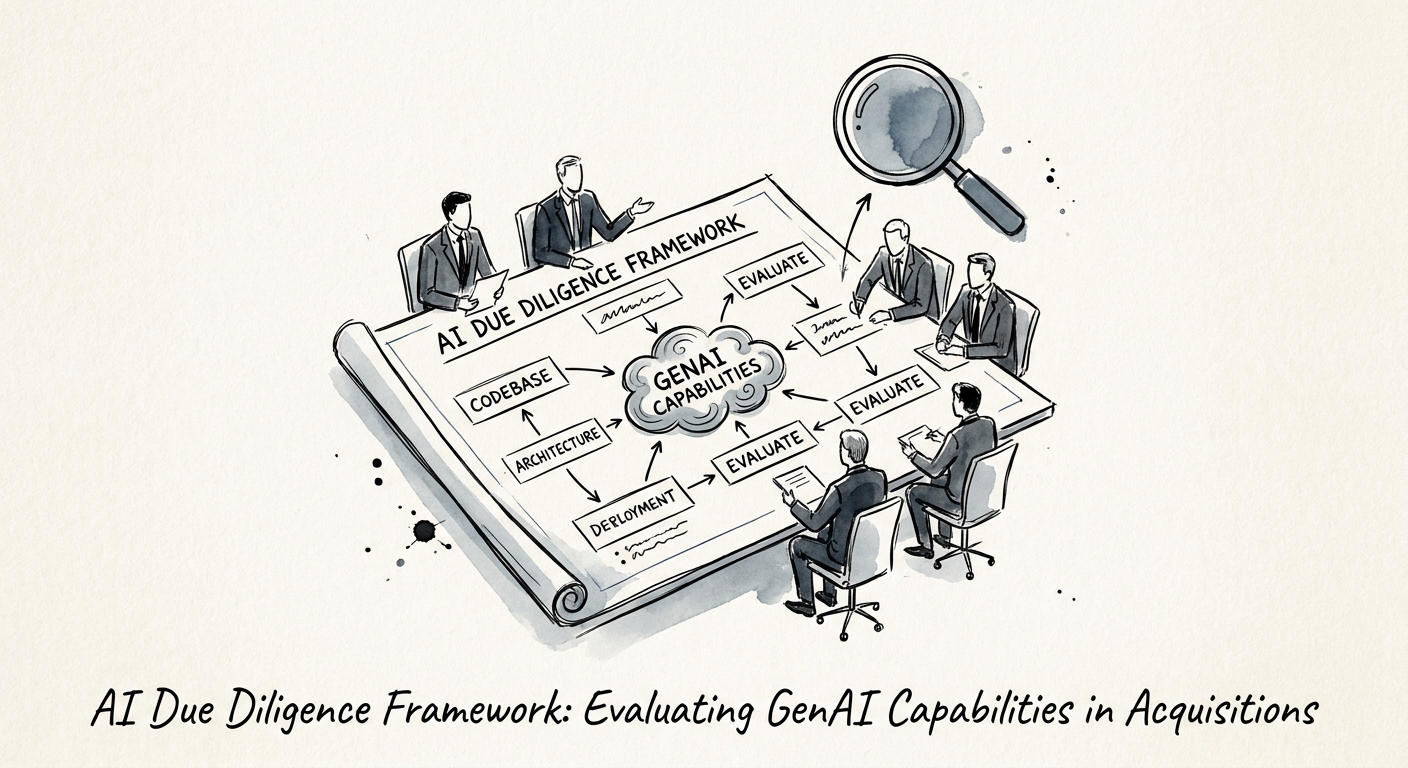
How to Diligence a GenAI Acquisition: Reading the CIM Against the Inference Bill
A PE diligence playbook for tech M&A: separate a real GenAI moat from a $25/month API wrapper, audit the IP chain, and price inference cost before you sign.
95% GenAI Pilot Failure Rate
BRIEF · TECHNICAL DEBT
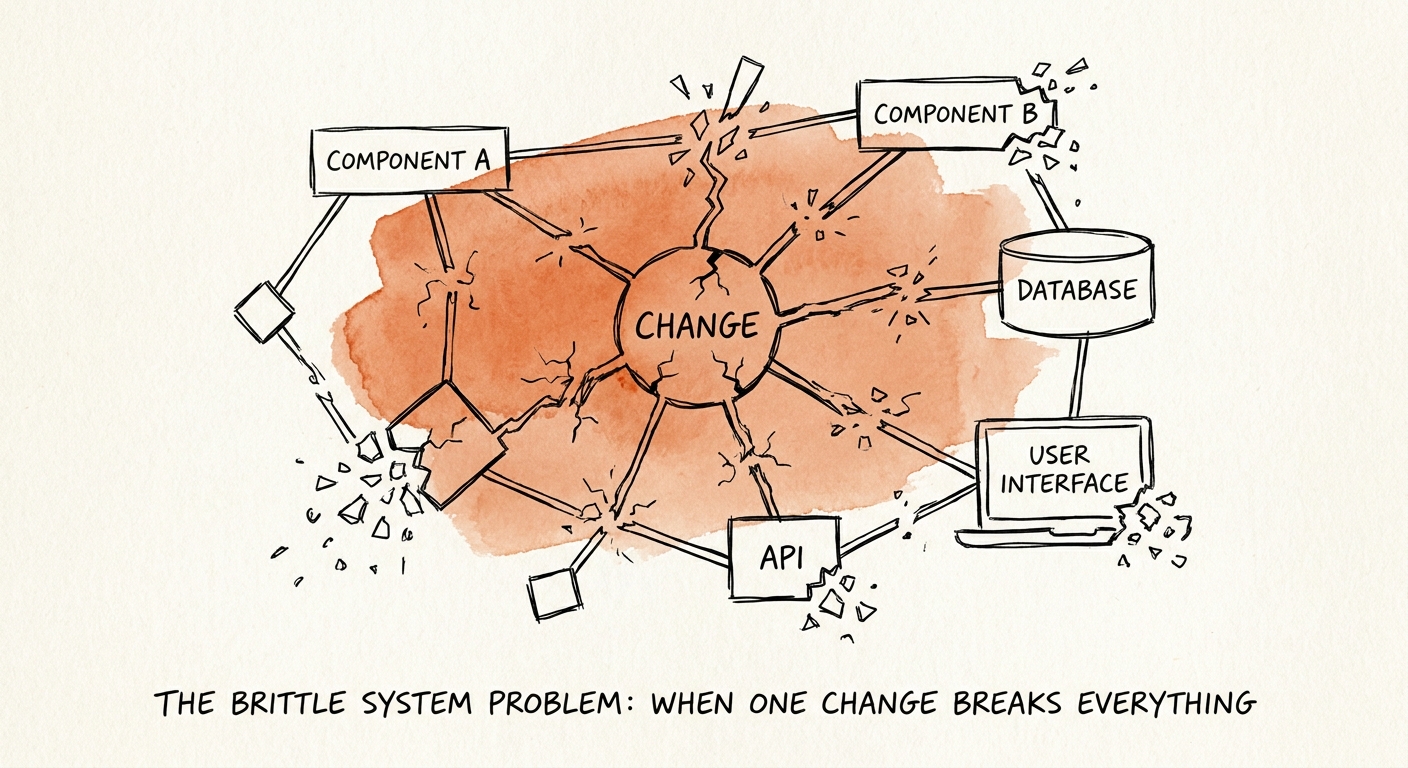
The Brittle System Problem: When a Dashboard Tweak Takes Down Billing
A two-line change to a reporting page shouldn't crash your payment gateway. When it can, buyers cut the price. Here's how brittleness becomes a 22% discount.
22% M&A Valuation Discount Applied to Brittle Architectures
BRIEF · AI MEASUREMENT AND ROI
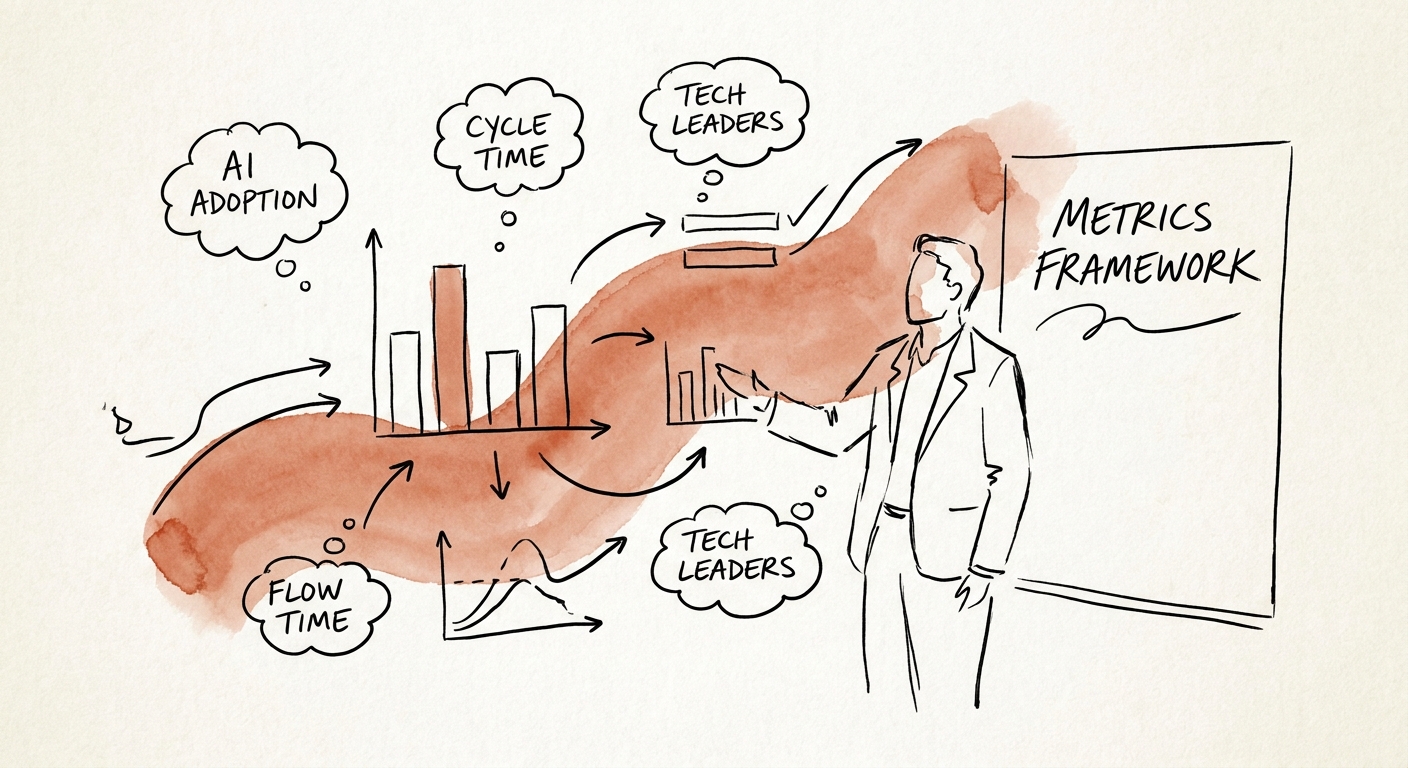
Your AI Adoption Dashboard Is Lying: What B2B SaaS Leaders Should Measure Instead
Seat activation is a vanity metric. A B2B SaaS adoption framework that ties Copilot, support, and GTM AI usage to cycle time, rework, and review behavior.
5 metrics for real AI adoption
BRIEF · FOUNDER EXTRACTION
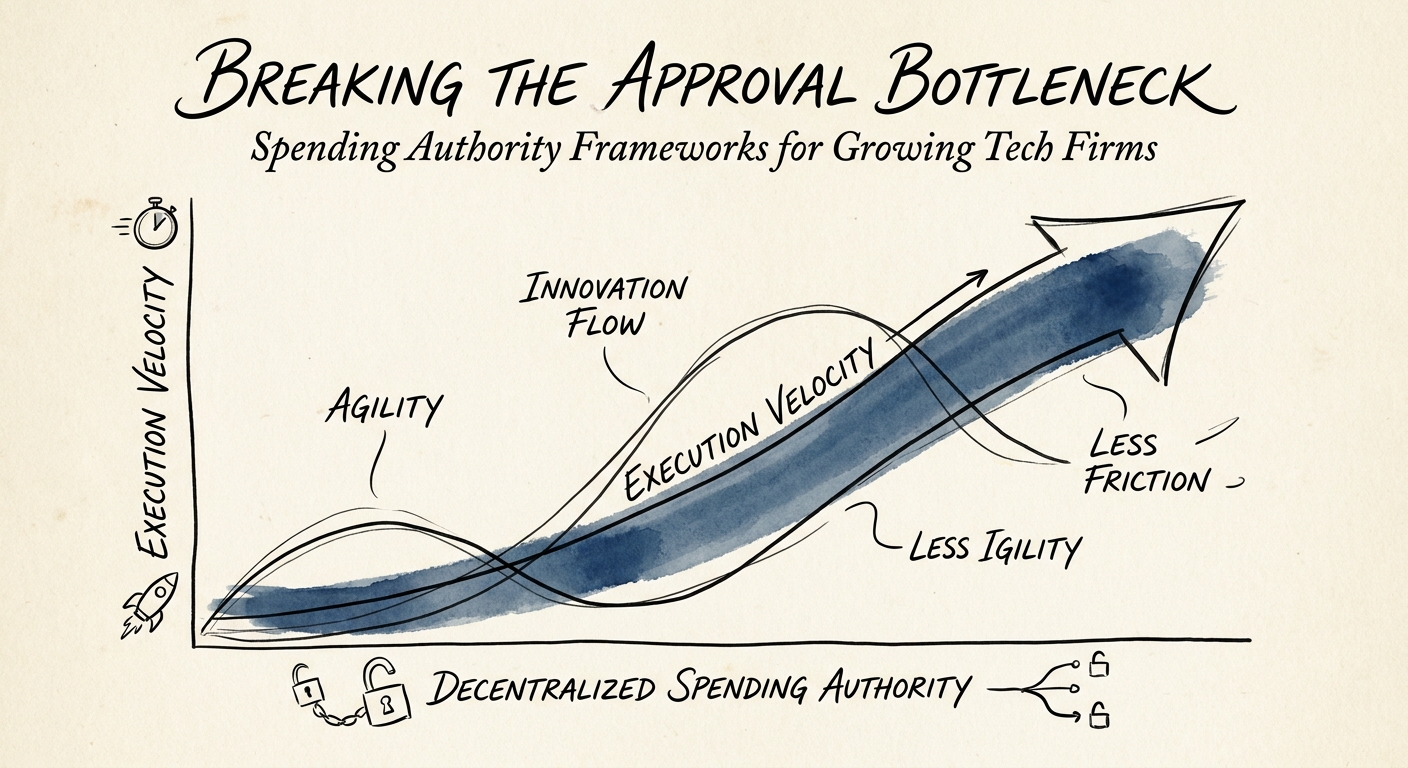
The $5,000 Signature: Why CEO Spending Approval Caps Your Software Company at $20M ARR
A $5K approval threshold feels like discipline at $20M ARR. It's a 30% burn tax and a valuation discount. Meet the variance-based delegation matrix that replaces your signature.
30% Increase in project costs due to approval delays
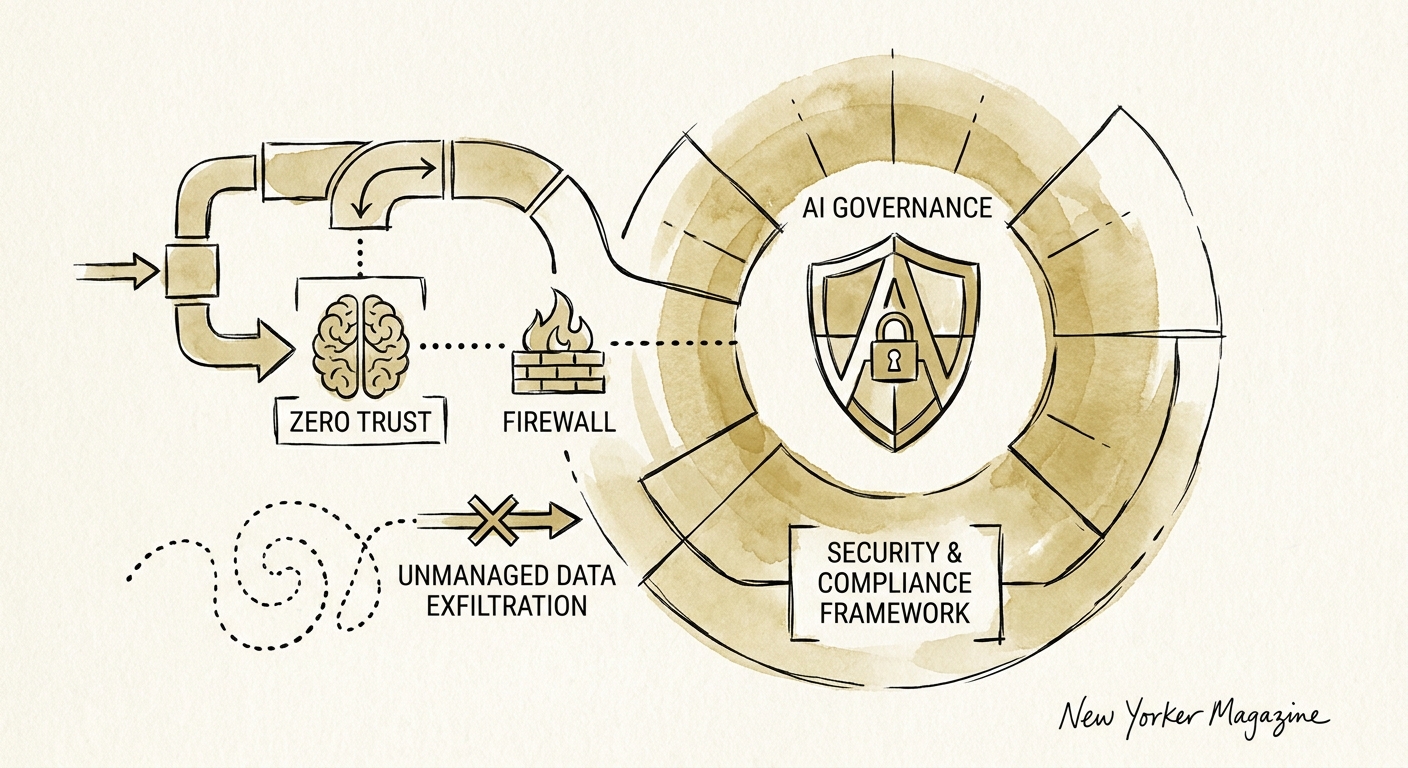
BRIEF · COMPLIANCE & SECURITY
AI Assistant Governance for SaaS: Why Shadow AI Quietly Poisons Your Codebase Before Diligence Finds It
Shadow AI doesn't just leak data — it contaminates the codebase you're selling. A governance framework for SaaS firms that survives a buyer's repo scan.
40% of enterprises will suffer shadow AI security incidents by 2030
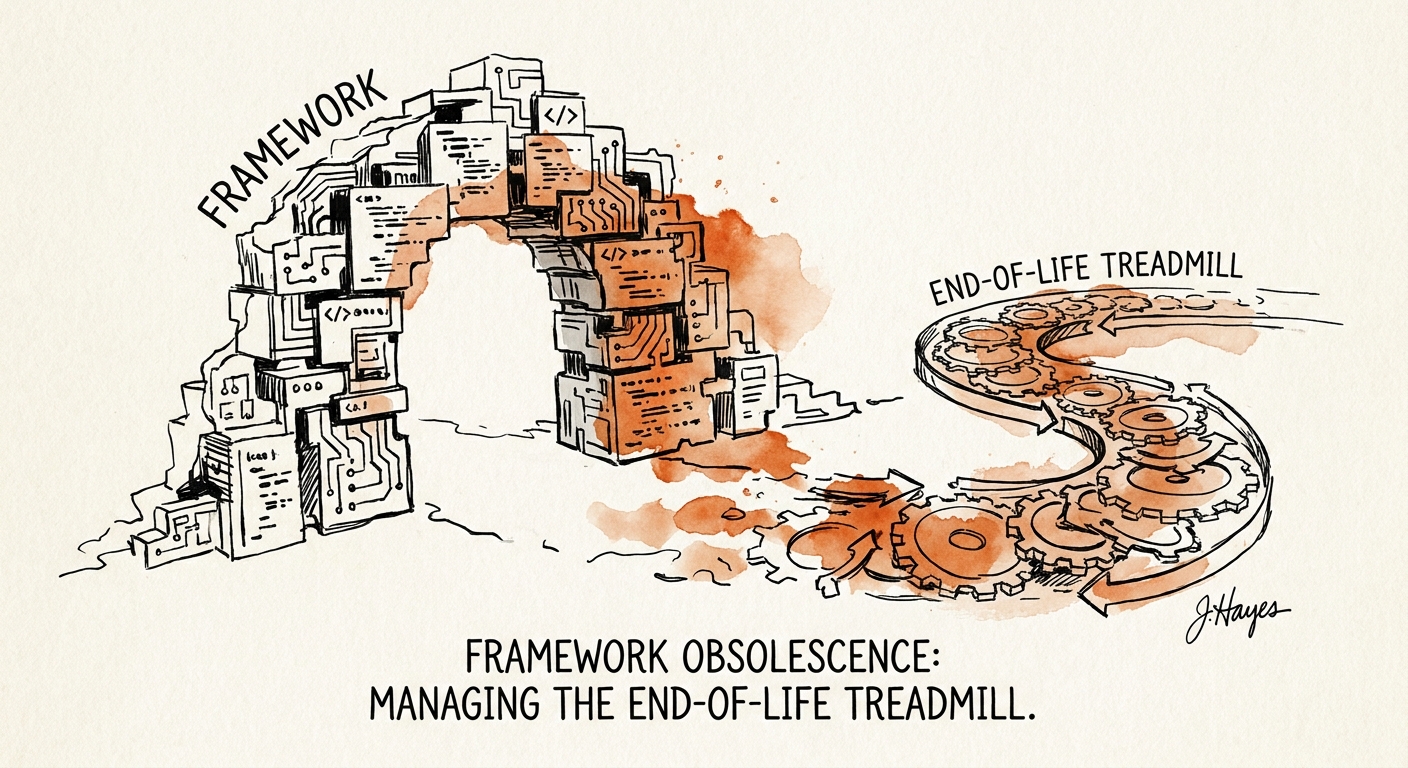
BRIEF · TECHNICAL DEBT
The End-of-Life Treadmill: How Dead Frameworks Sink SaaS Valuations
A frozen framework version is a diligence landmine. How SaaS leaders inventory end-of-life dependencies and run AI-assisted migration without freezing the roadmap.
EOL register first control for framework obsolescence
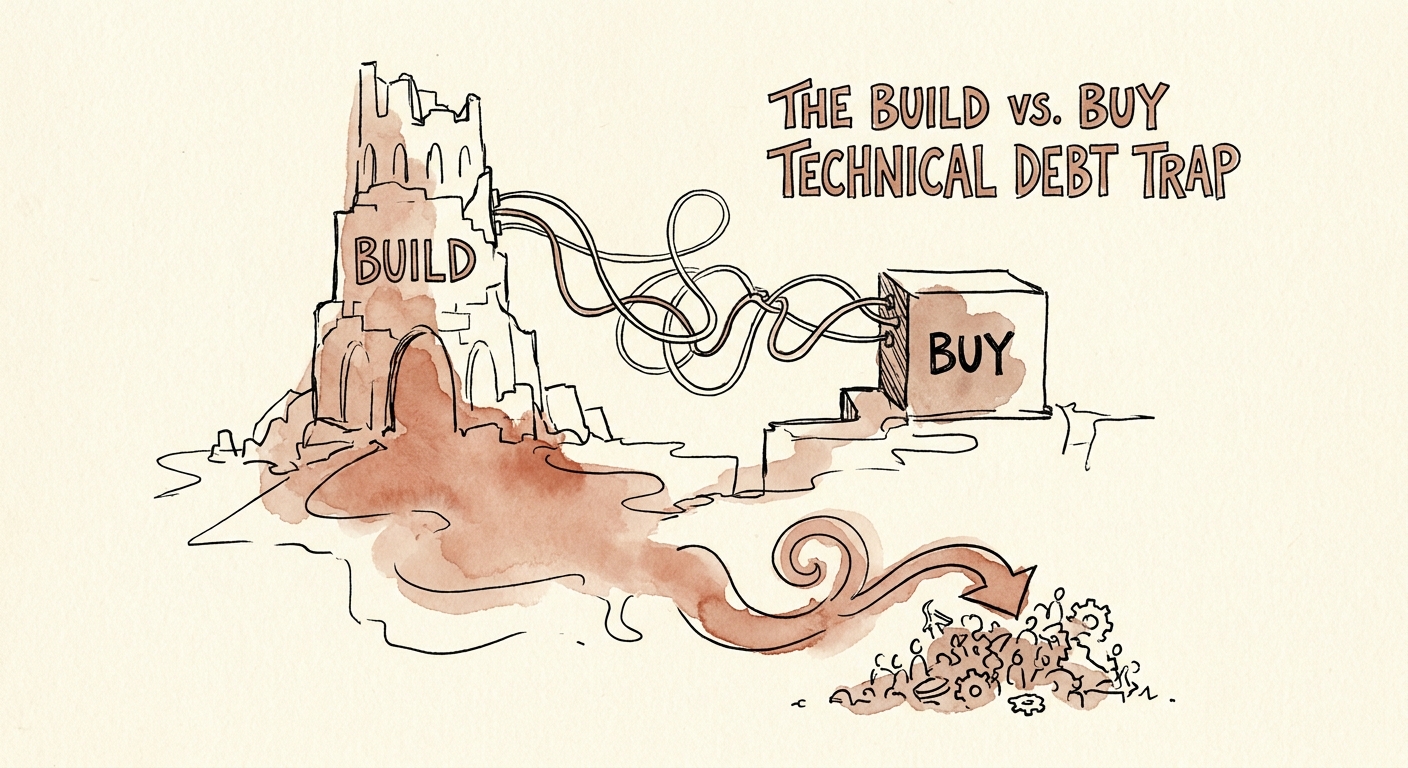
BRIEF · TECHNICAL DEBT
The 14-Month Billing Engine: How Series B SaaS Teams Build Their Way to a Lower Multiple
A Series B SaaS team built billing in-house to dodge a $50k vendor fee. The hidden cost: $850k in debt and a lower exit multiple. Here's the line to draw.
34% Engineering Capacity Lost to Custom Tool Maintenance
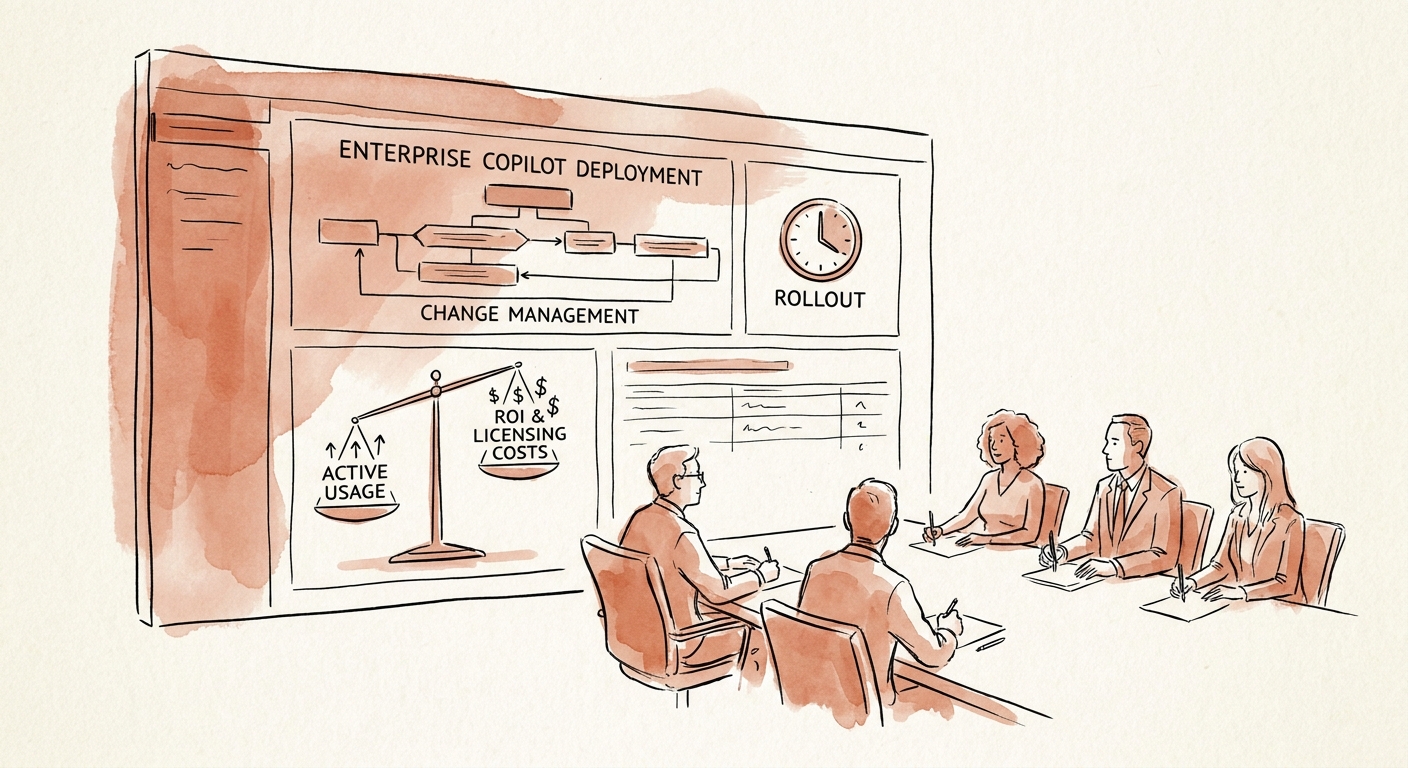
BRIEF · MIGRATION & INTEGRATION
Microsoft Copilot Will Surface Every File You Forgot to Lock Down
Microsoft 365 Copilot reads everything an employee can already open. A rollout that skips permission review turns quiet oversharing into a search box.
6 rollout controls before scale
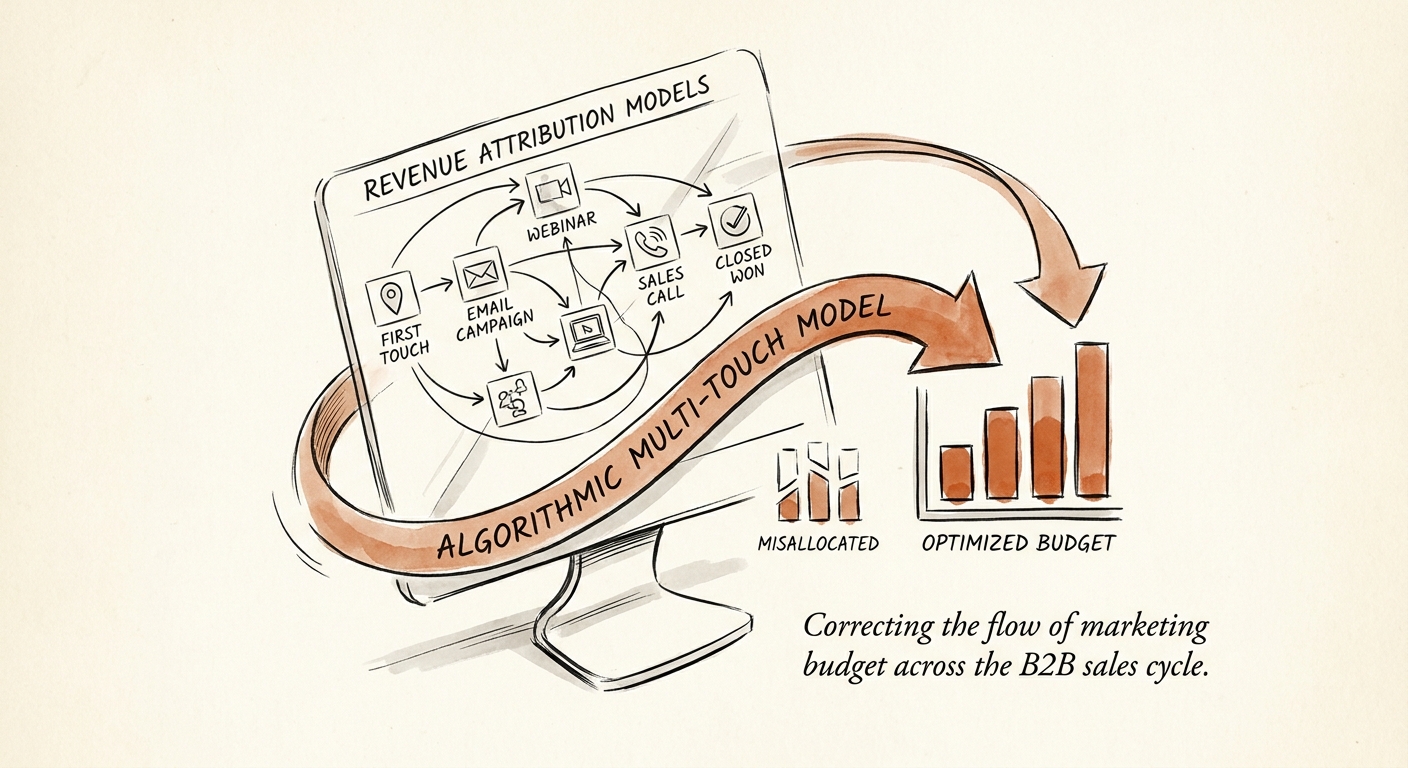
BRIEF · REVENUE ARCHITECTURE
Your CRM Says SDRs Built the Pipeline. The Other 26 Touches Say Otherwise.
Last-touch attribution tells boards to cut marketing and double SDRs. Here's how W-shaped and algorithmic models expose the real B2B buyer journey.
42% Wasted GTM Budget
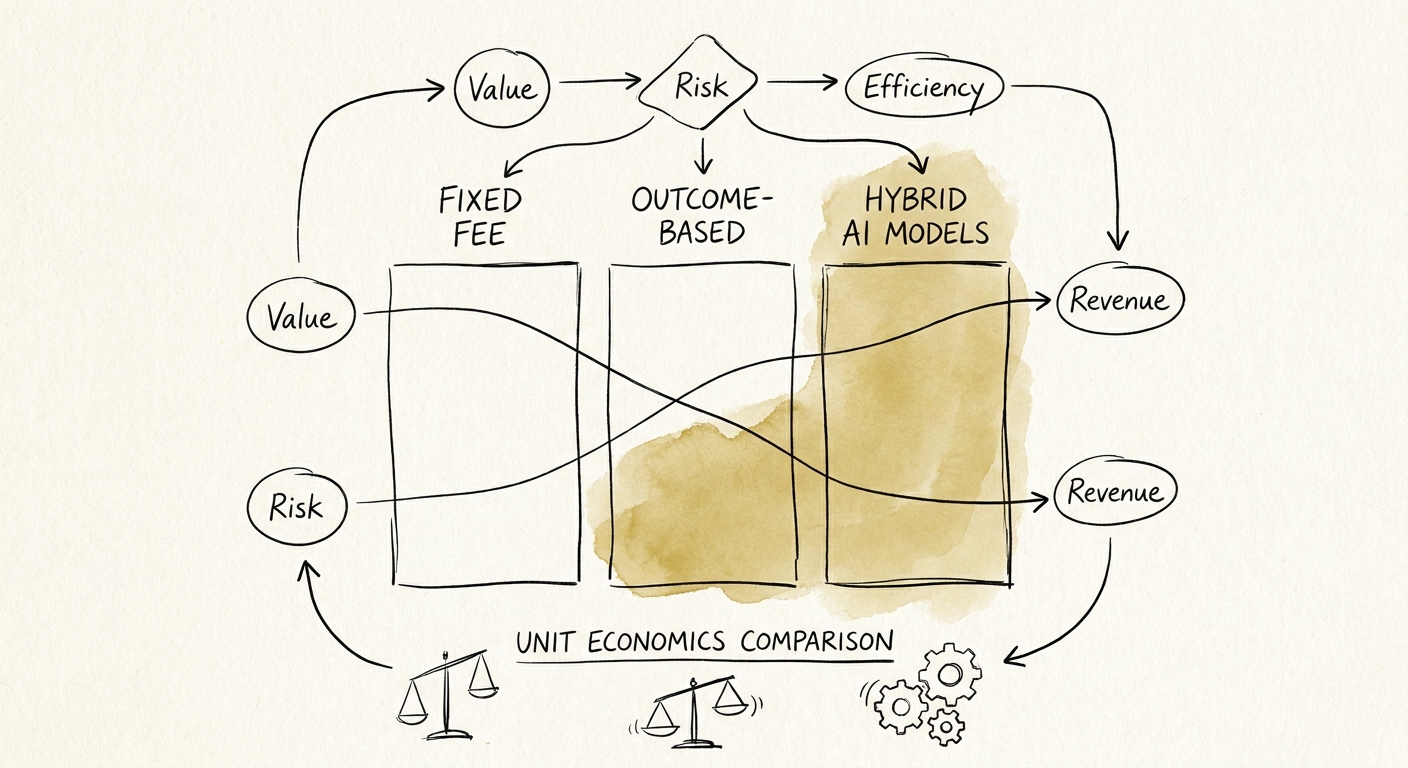
BRIEF · UNIT ECONOMICS
How to Price a Generative AI Build: Why One Number Wrecks Your Margin
Quoting one fixed number for a generative AI build means absorbing the client's data debt and uncapped inference costs. Here's the three-layer pricing fix.
3 Pricing layers to separate
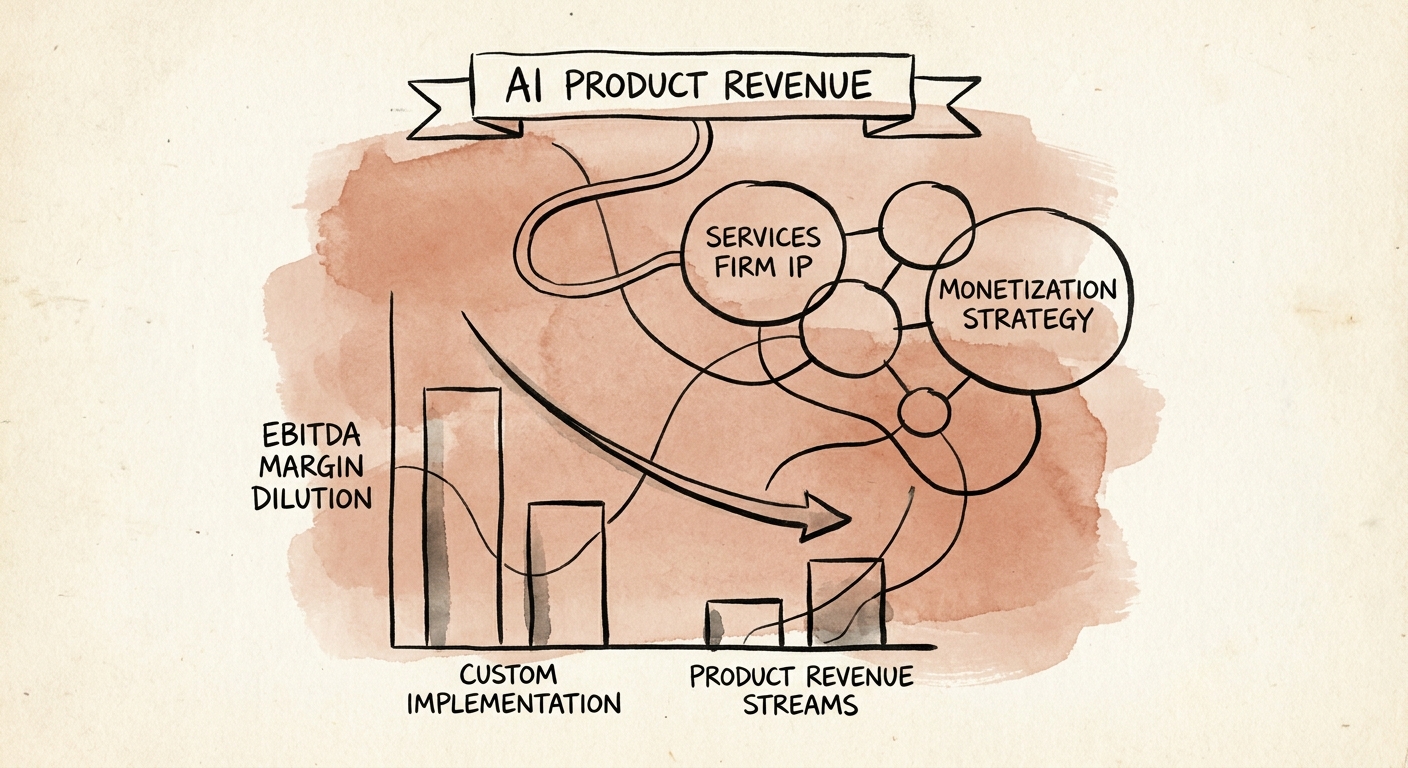
BRIEF · REVENUE ARCHITECTURE
Your AI Product Is Quietly Reclassifying Your Whole Firm as Services Revenue
When a services firm bolts an AI product onto a billable-hours P&L, buyers reprice both. Here's how to carve AI IP so it earns a software multiple, not a haircut.
14 EBITDA Margin Dilution Points
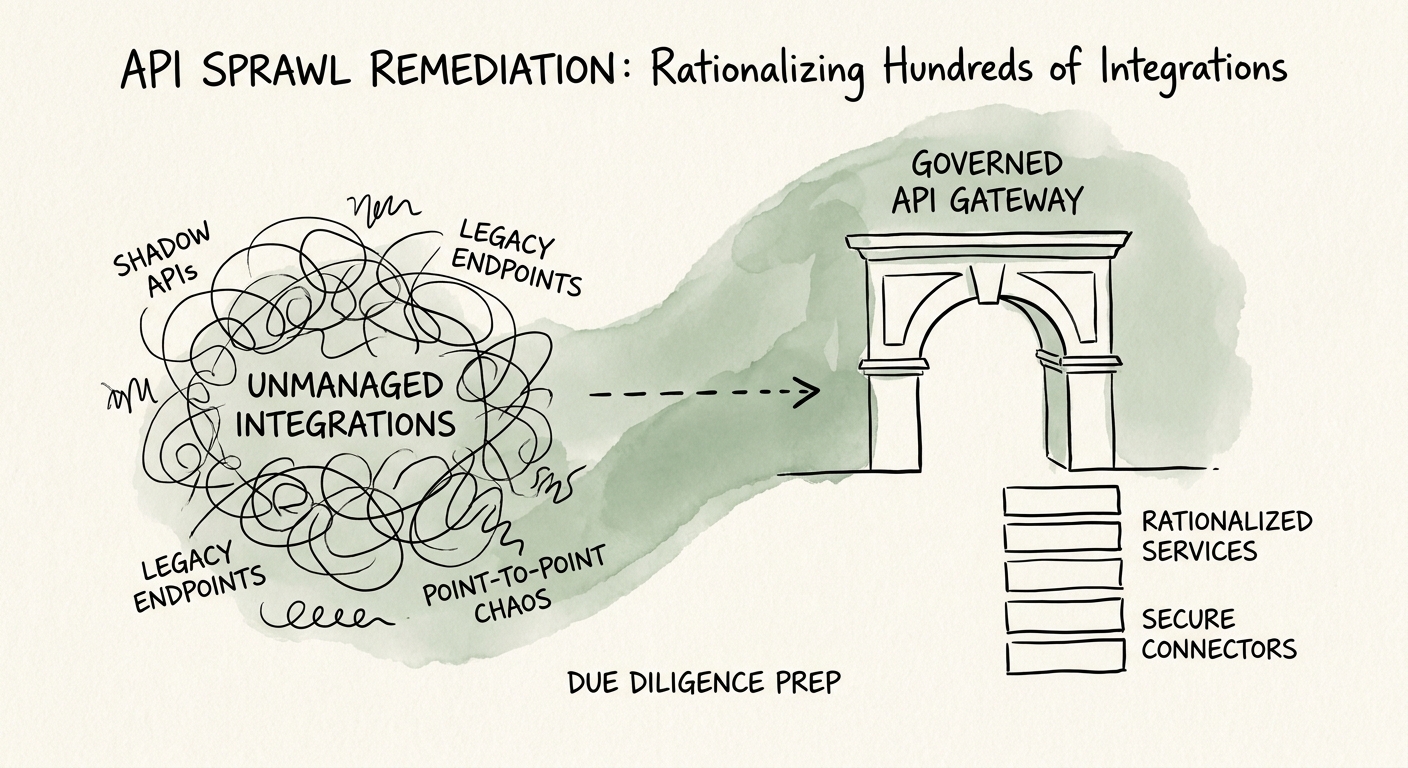
BRIEF · TECHNICAL DEBT
342 APIs, 115 You Can Explain: What That Gap Costs You in Diligence
A Series B SaaS had 342 live APIs and could explain 115. Here's how buyers price that gap, and the 90-day cleanup that closes it before LOI.
$591k Avg. Cost to Remediate a Single API Breach
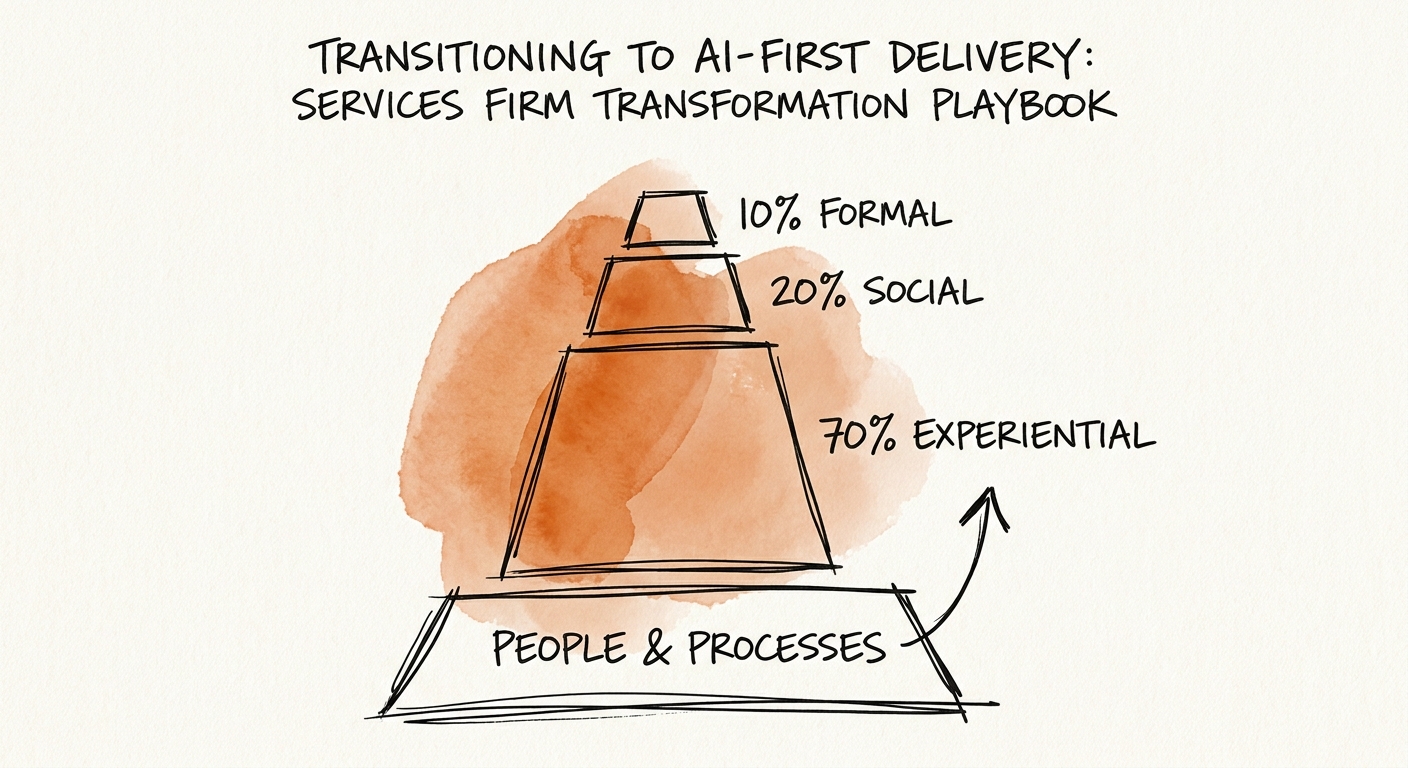
BRIEF · PROCESS DOCUMENTATION
AI-First Delivery for Services Firms: Rebuild the Workflow, Not the Pitch Deck
A services firm bills hours but sells outcomes. Here's how to move one delivery lane to AI-first without quietly breaking your own margin math.
4 delivery-model changes before AI-first scale
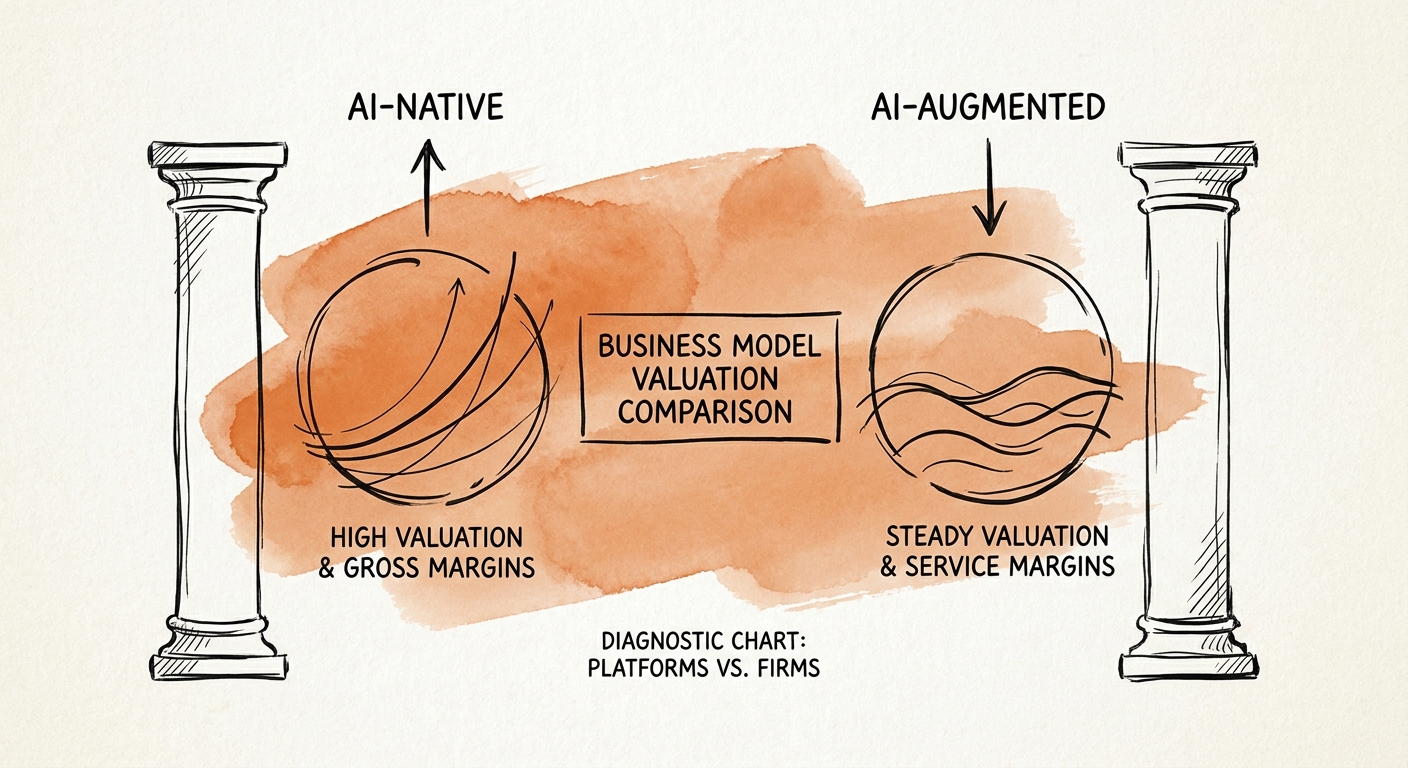
BRIEF · EXIT READINESS
AI-Native or AI-Augmented? The Margin Line That Decides Your Multiple
Two services firms, same AI pitch, wildly different worth. How PE sponsors tell a software multiple from a body-shop multiple in 2026 diligence.
80% Companies reporting zero significant bottom-line gain from GenAI investments
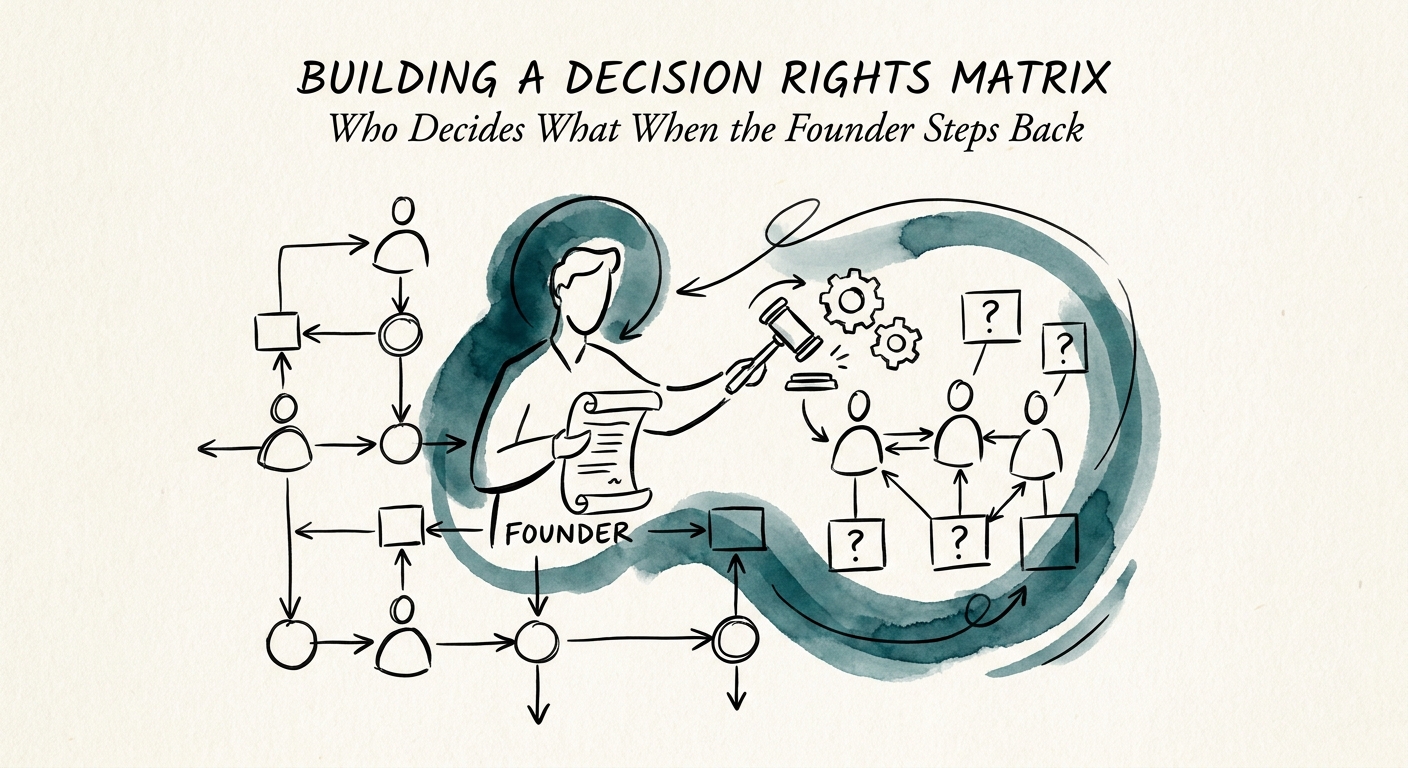
BRIEF · FOUNDER EXTRACTION
The Decision Rights Matrix: How Series B SaaS Founders Stop Being the Bottleneck
Your new VPs keep "checking with you" on $50K calls. Here is the one-page decision rights matrix that ends the shadow veto and protects your B2B SaaS valuation.
$2.4M Annual cost of delayed execution without a formal decision rights matrix
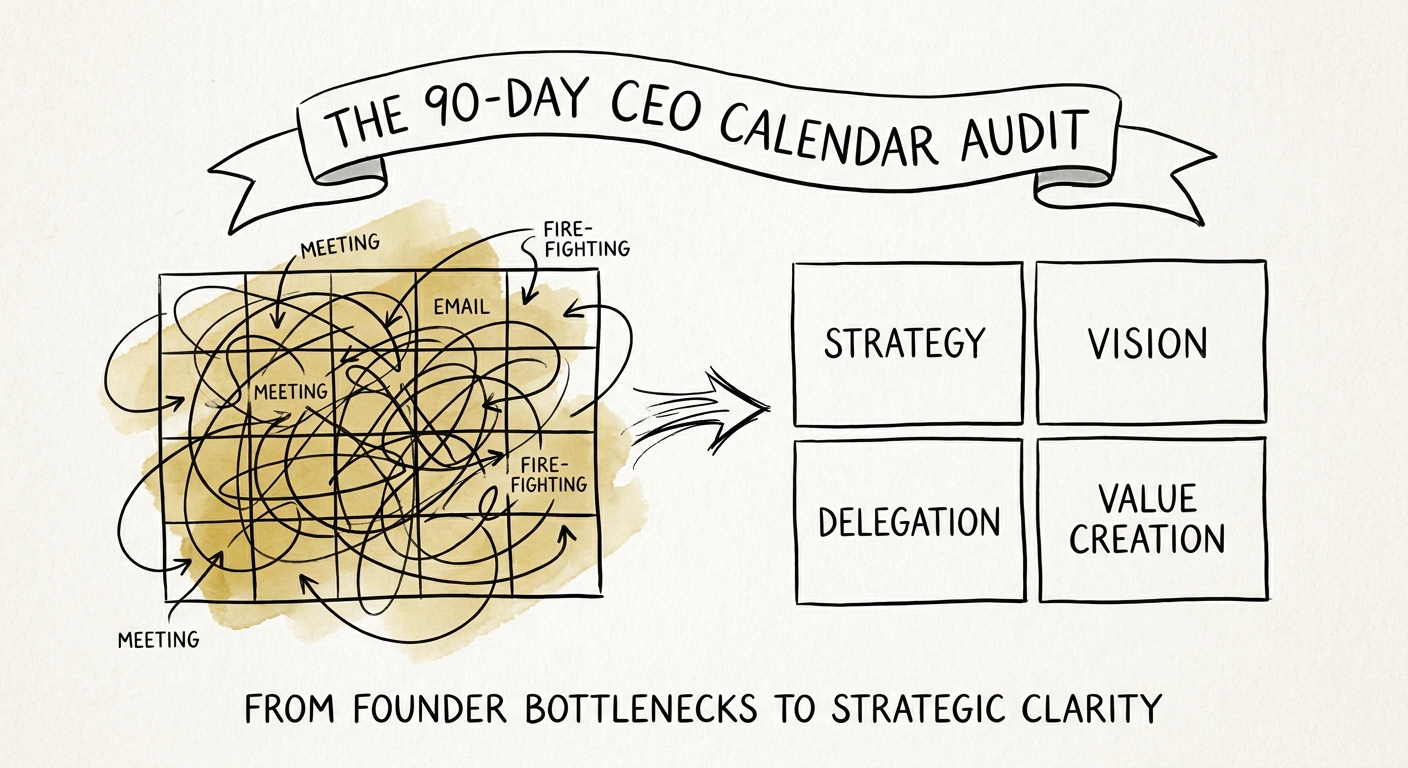
BRIEF · FOUNDER EXTRACTION
Your Calendar Is the First Page of the Data Room: A 90-Day CEO Audit Before PE Diligence
PE buyers reverse-engineer your founder dependency from your calendar. Here's the 90-day audit that finds the discount before diligence does — and fixes it.
30% Valuation Discount
BRIEF · UNIT ECONOMICS
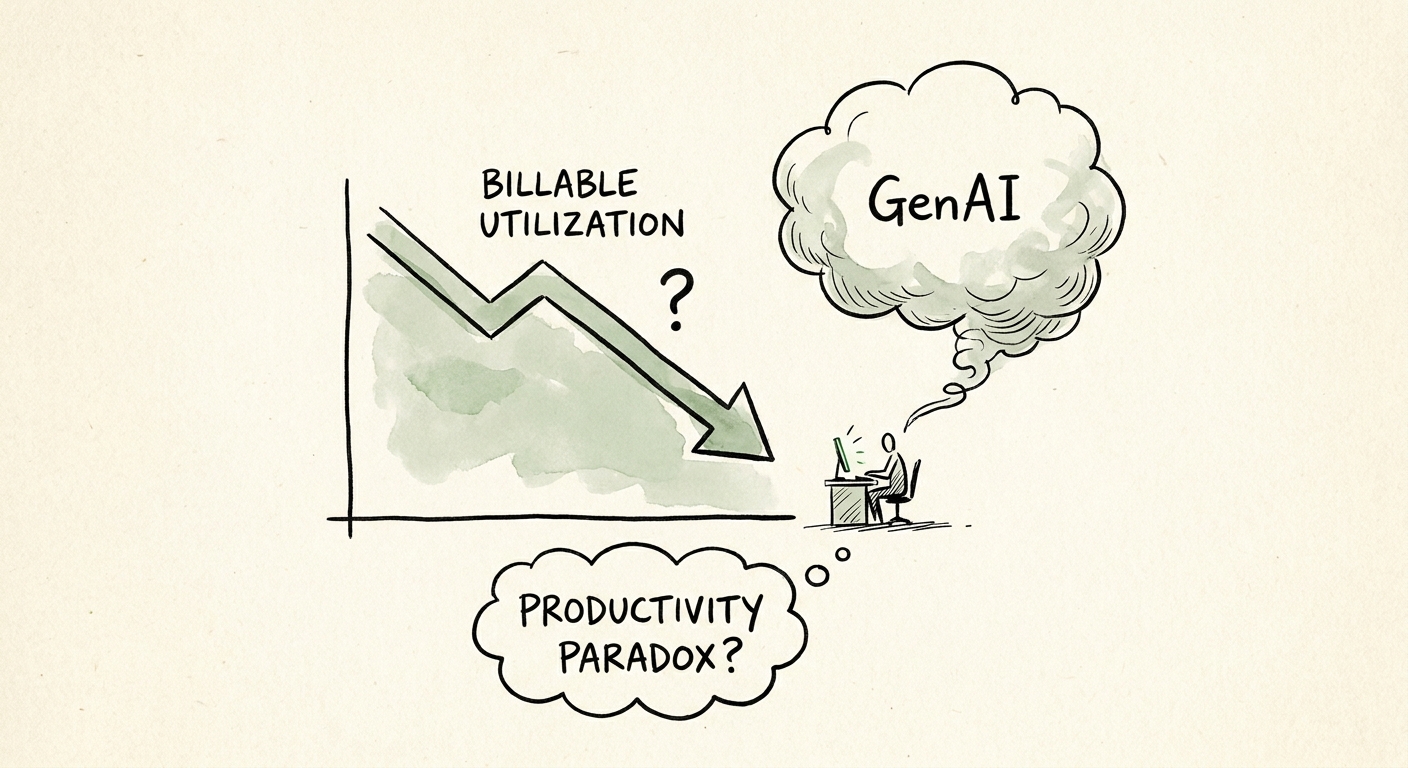
When AI Makes Your Consultants Faster, Who Keeps the Money?
If your firm sells time and AI cuts the hours, the savings go to the client, not your margin. How services leaders fix the realization leak before scaling GenAI.
4 commercial model changes needed after AI productivity gains
BRIEF · PROCESS DOCUMENTATION
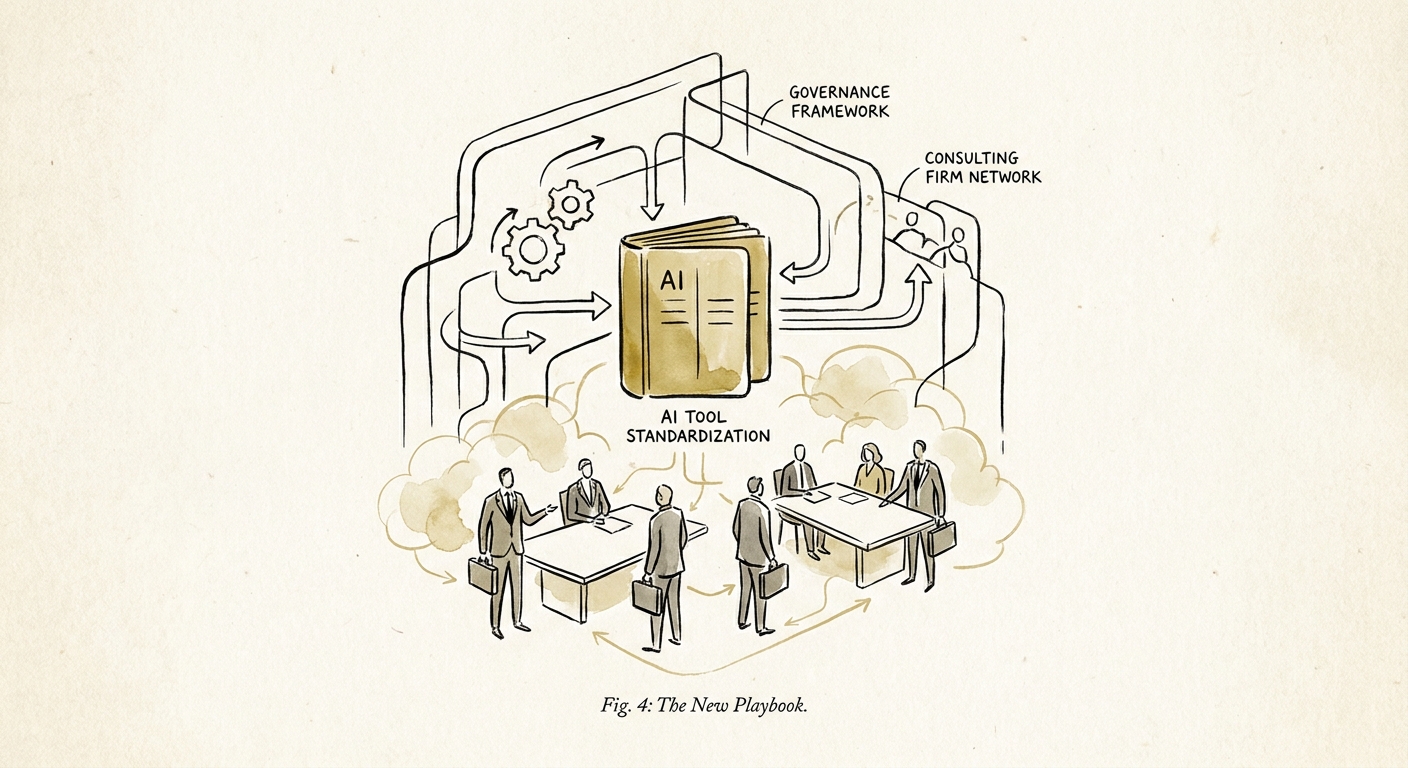
Your Consultants Have 11 AI Tools. Your Buyer Counts Every One.
A diligence team can find every rogue AI subscription in your consulting firm in an afternoon. Here's how tool sprawl becomes a valuation lever — and how to close it.
14% Enterprise Value Bleed from Shadow AI
BRIEF · TEAM & HIRING
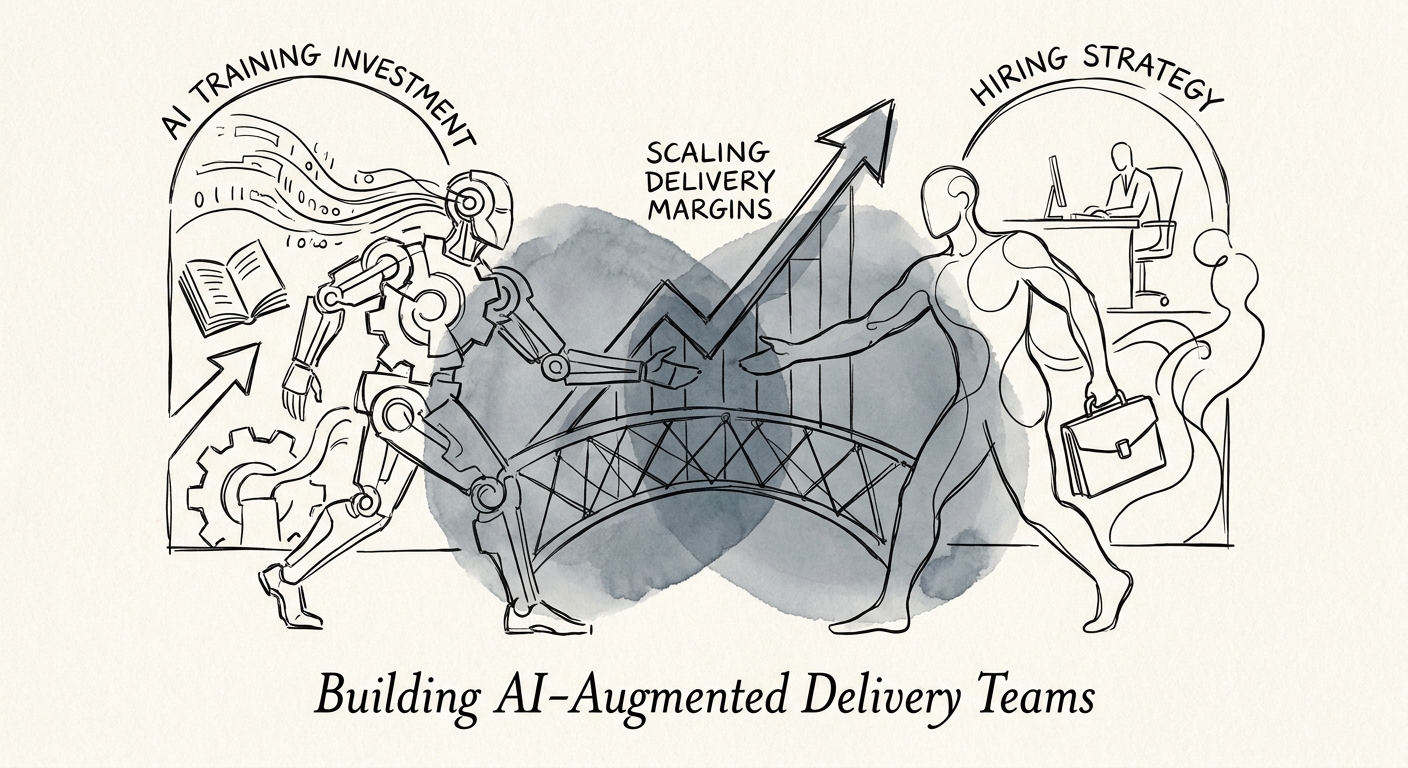
Your Best AI Hire Already Works Here: Why Tech-Services Firms Should Train Delivery Leads Before Recruiting Specialists
A mid-market IT-services firm doesn't have a model-knowledge problem. It has a context problem. Why upskilling delivery leads beats recruiting AI specialists.
10% Suggested AI upskilling capacity allocation
BRIEF · GTM EXECUTION
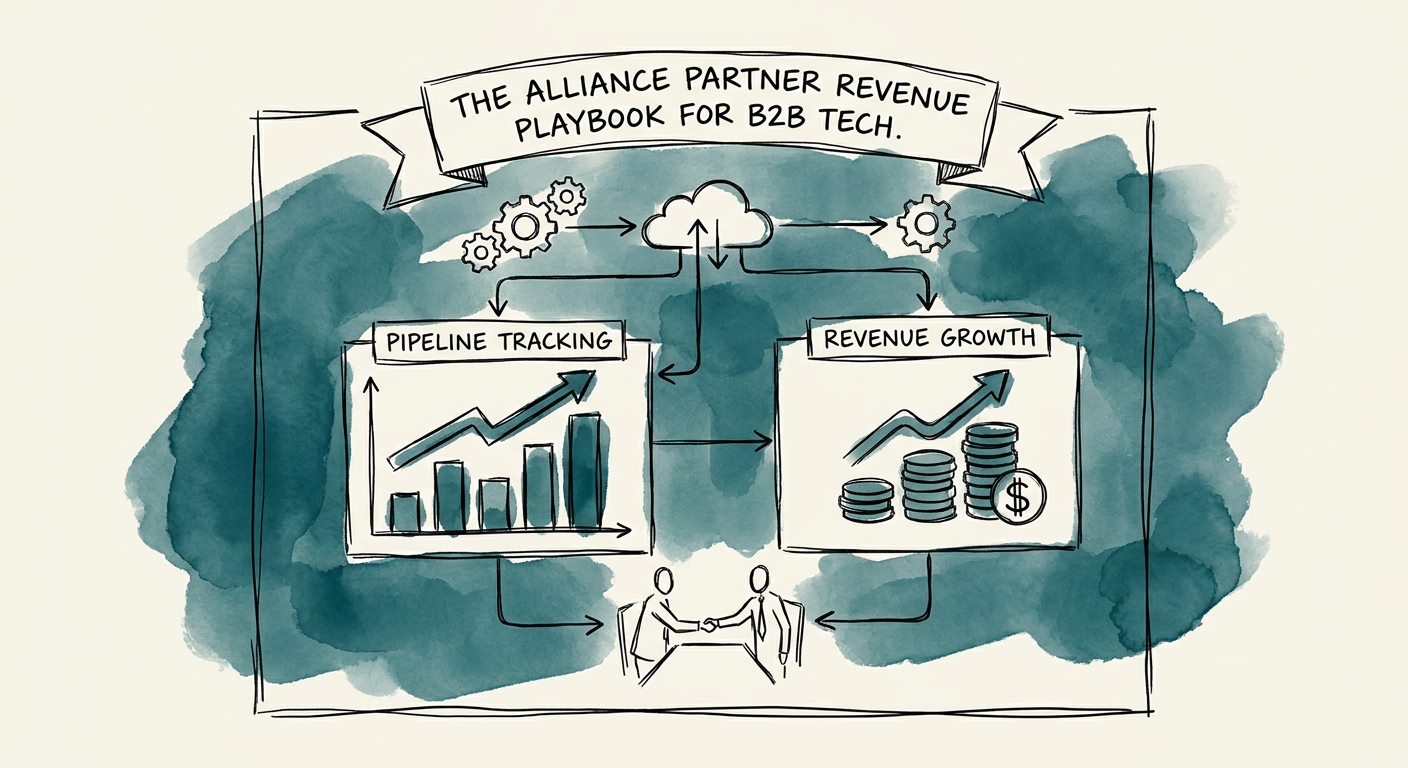
Why Your Partners Don't Sell Your Software (And the One Number That Fixes It)
Most alliance programs at $10-50M ARR are press releases, not pipeline. The fix isn't more partners — it's rebuilding the deal around the partner's margin, not yours.
30% Enterprise Value Destroyed by Direct Sales Reliance