BRIEF · AI FUNCTION USE CASES
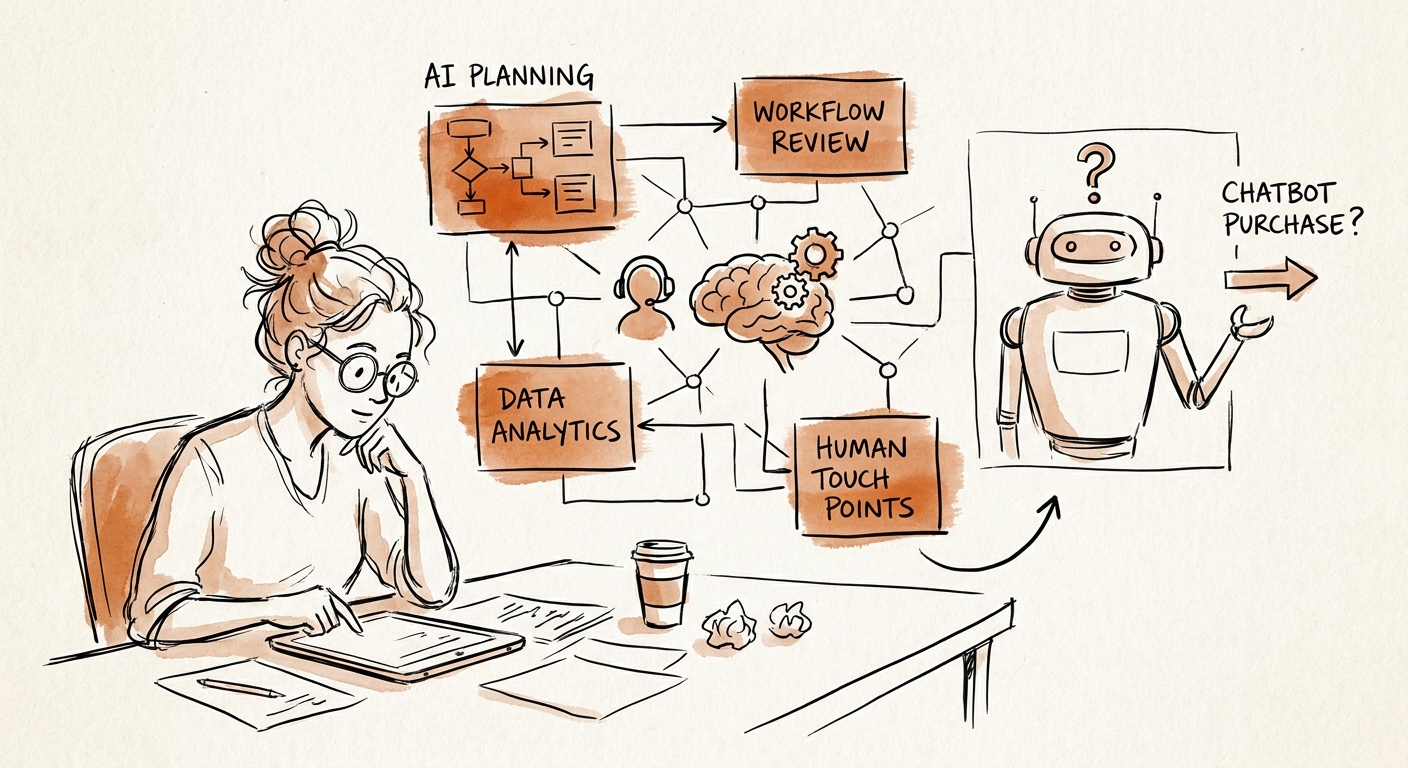
The Chatbot Is the Last Thing You Should Automate in Support
A chatbot is the riskiest place to start with support AI. Here are the six behind-the-scenes workflows that fix response time and quality first.
6 support workflows to fix before a chatbot
BRIEF · AI WORKFLOW AUTOMATION
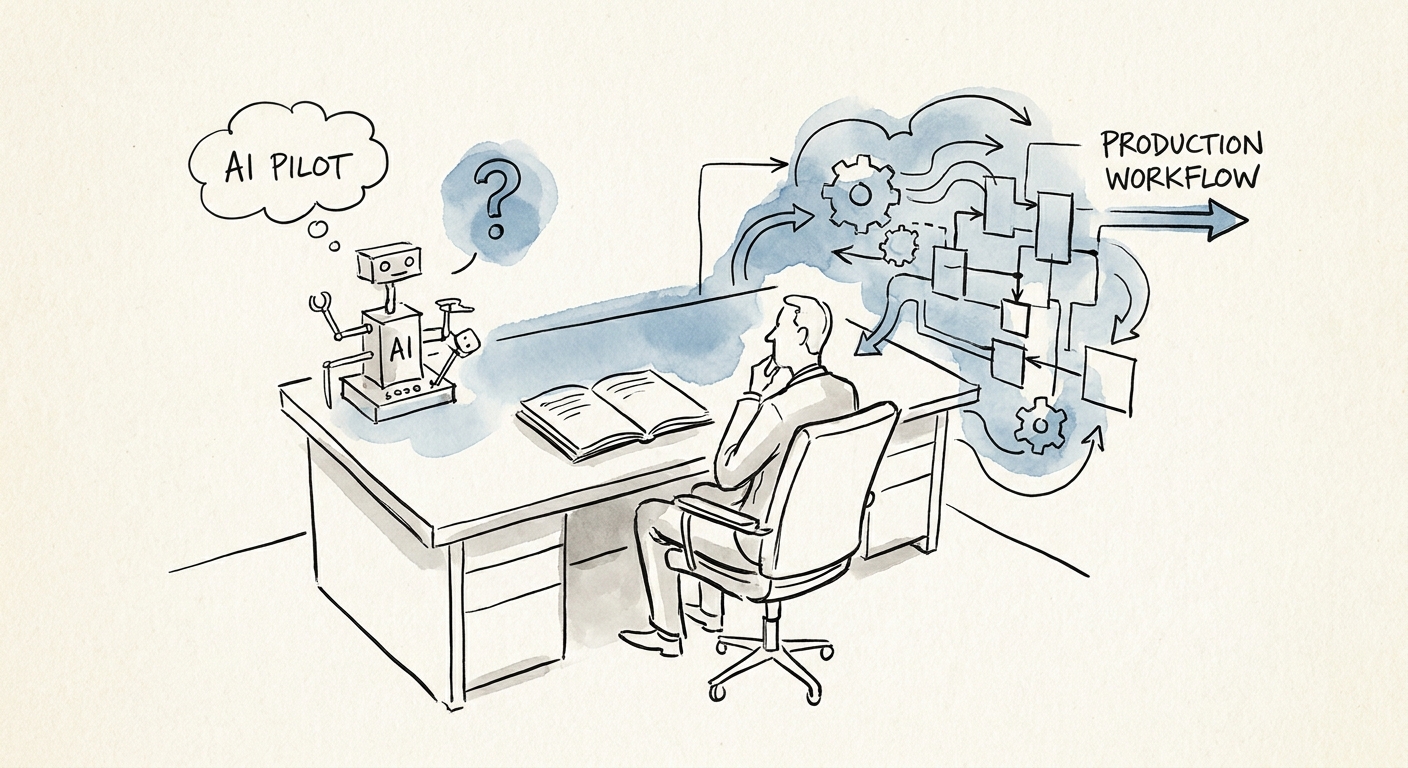
Your AI Pilot Worked. Here's Why It Won't Survive Tuesday.
The pilot worked because one person ran it on clean data. Production has to survive everyone else. The seven things that have to exist before you flip the switch.
7 controls required before an AI pilot becomes production
BRIEF · AI MEASUREMENT AND ROI
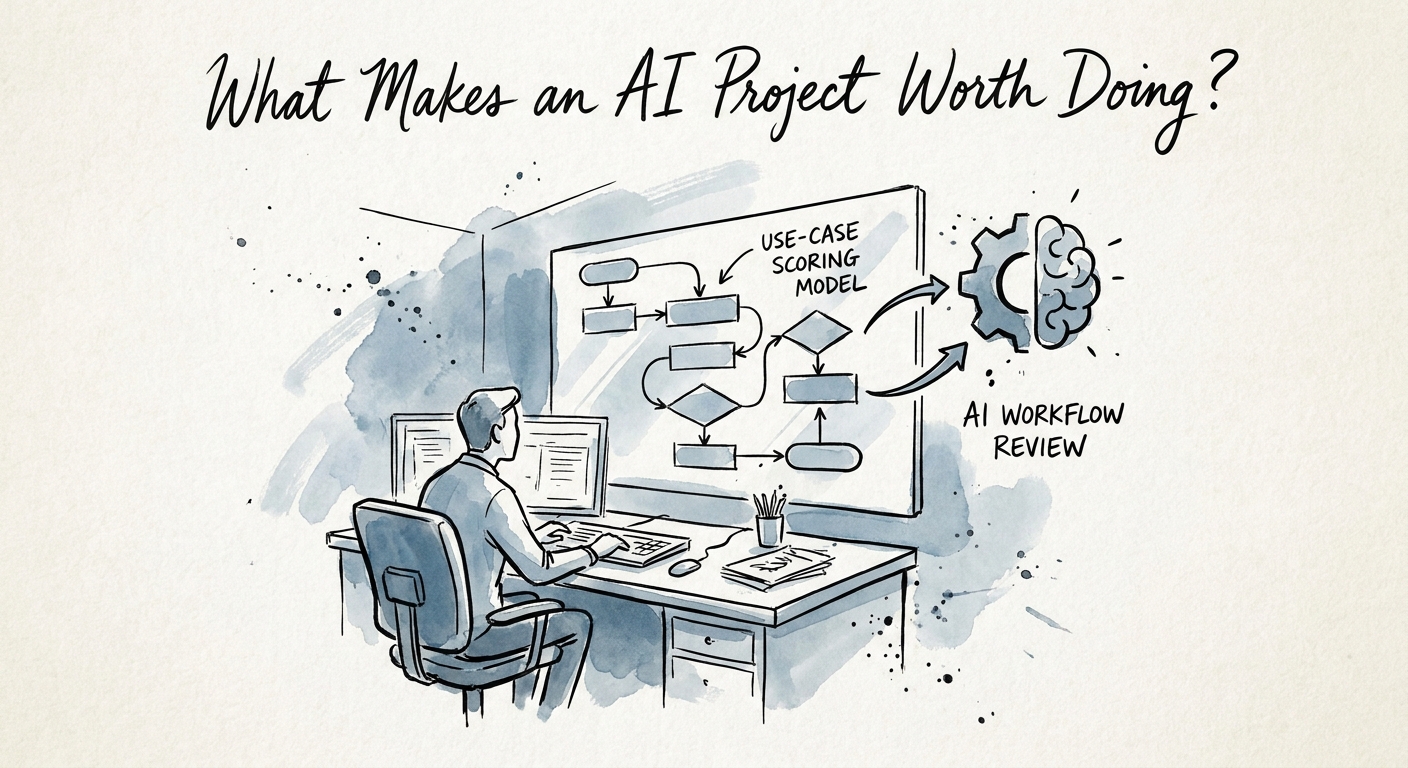
How to Score AI Ideas So You Build the One That Pays
Most SMBs have more AI ideas than they can build. A six-dimension scoring model that sorts the list into do-now, investigate, defer, and reject.
6 scoring dimensions for AI use cases
BRIEF · AI TRANSFORMATION STRATEGY
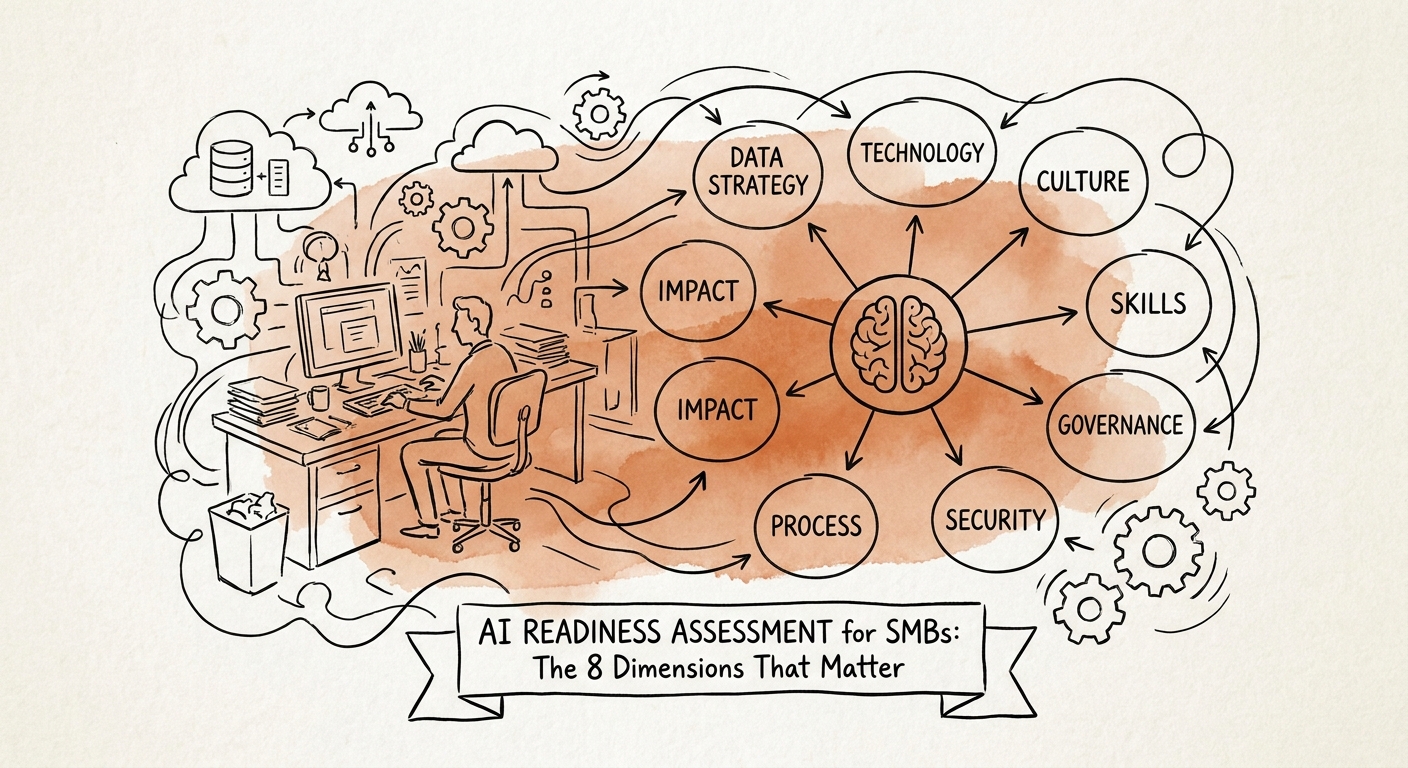
The 8-Dimension AI Readiness Check: Score the Workflow, Not the Company
Most AI readiness scores grade your company. The useful version grades one workflow across 8 dimensions and ends in a verb: build, clean, govern, or defer.
8 readiness dimensions to score before implementation
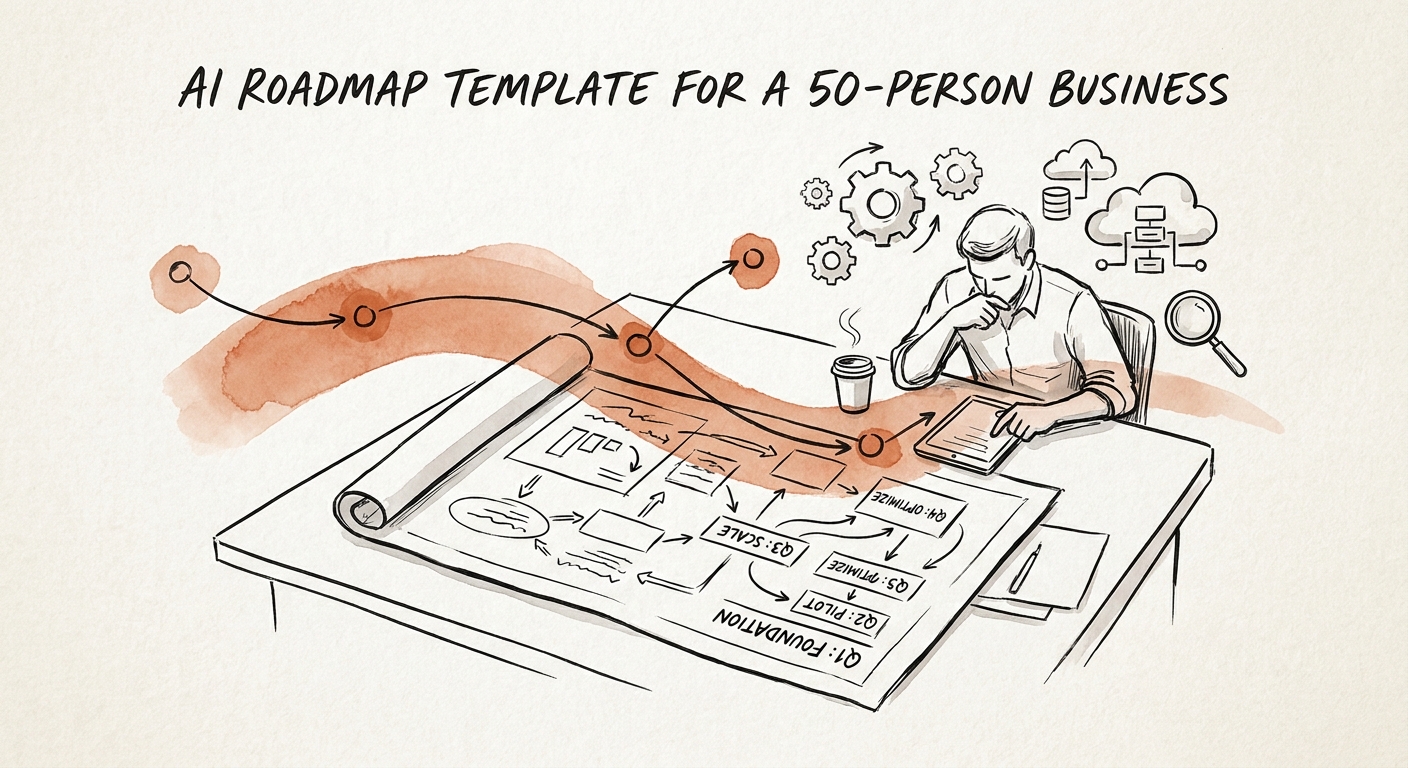
BRIEF · AI TRANSFORMATION STRATEGY
The AI Roadmap a 50-Person Company Can Actually Staff
A 90-day AI roadmap built for a 50-person company: who owns each call, what you deliberately skip, and the monthly review that retires work instead of piling it on.
90 days for the first implementation roadmap
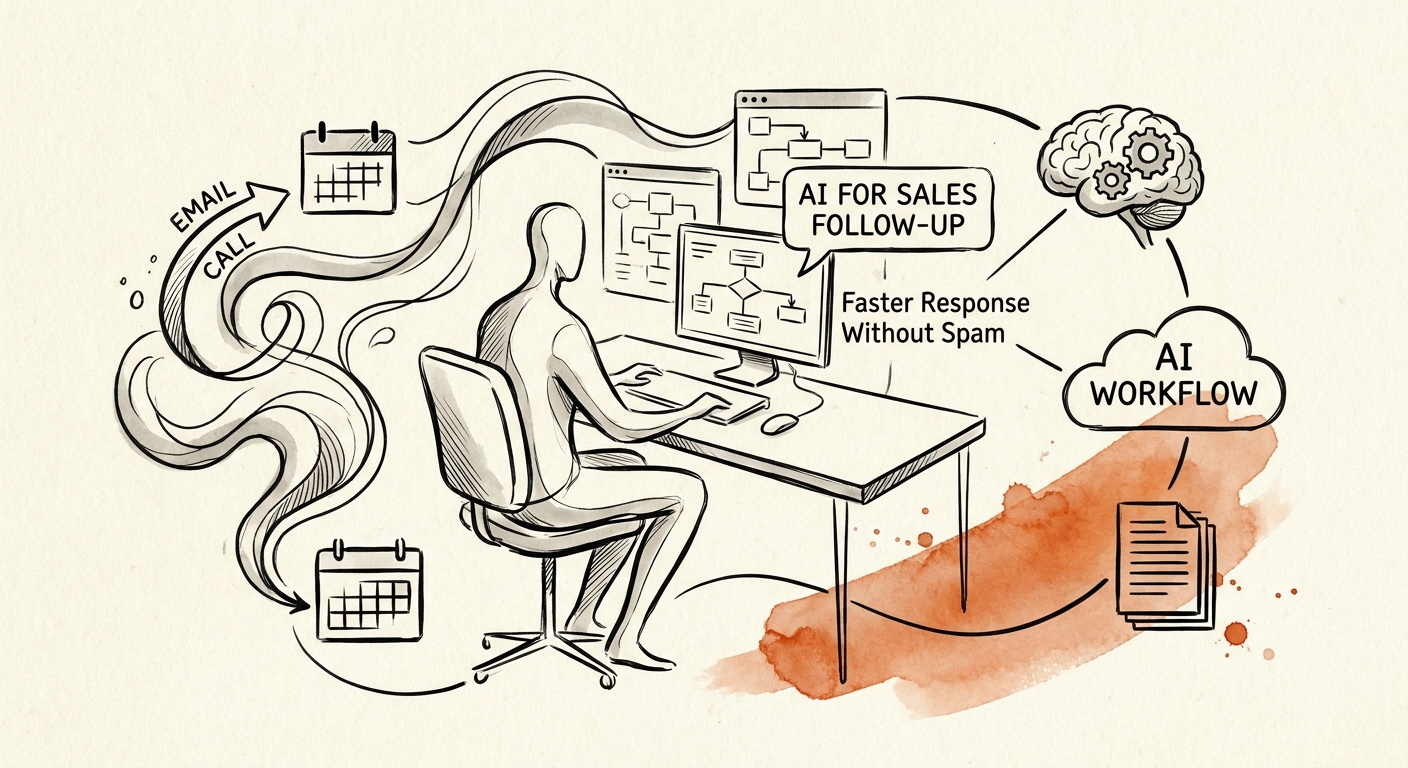
BRIEF · AI FUNCTION USE CASES
AI Sales Follow-Up That Earns the Reply, Not the Unsubscribe
The difference between a follow-up that closes and one that gets you blocked is context, not speed. How to use AI to draft the right next touch fast.
68% win-rate operating system proof point
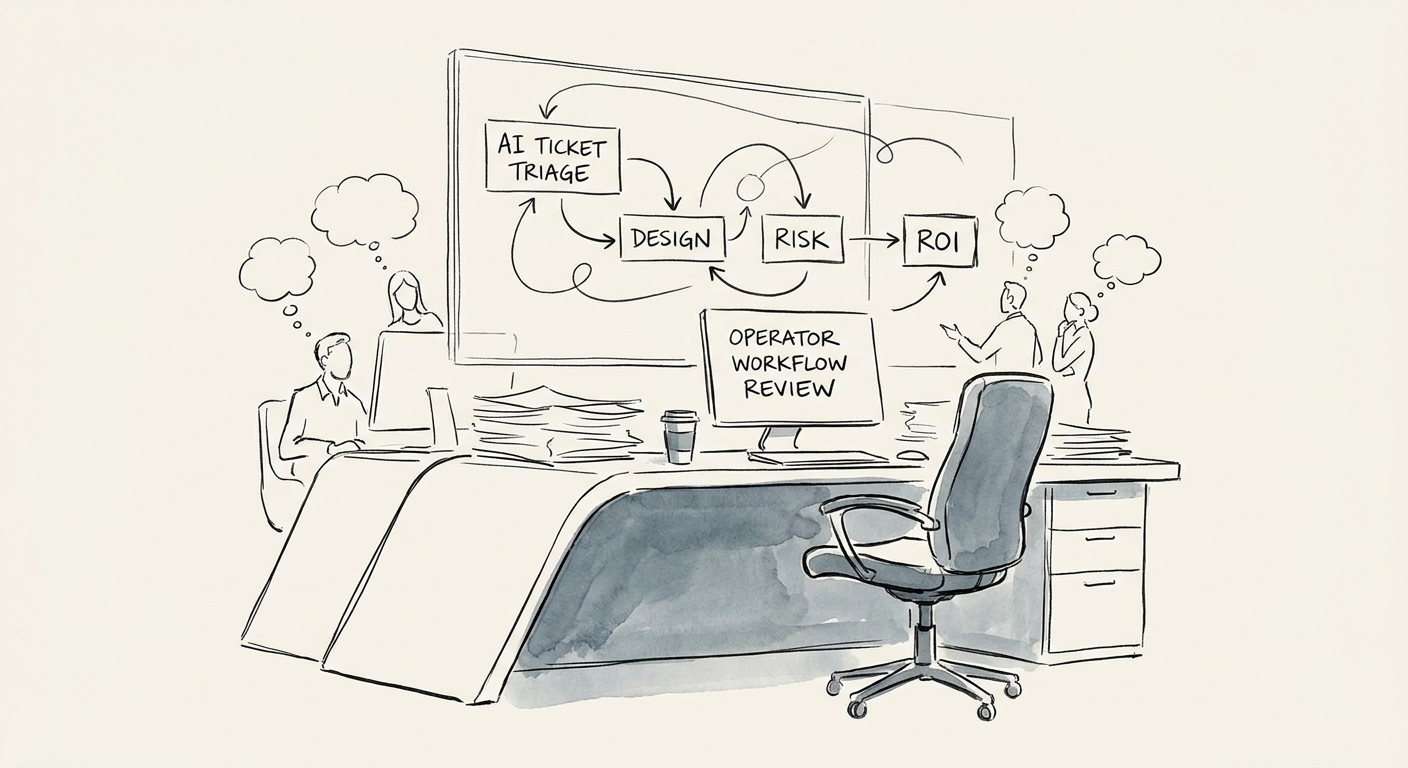
BRIEF · AI FUNCTION USE CASES
AI Ticket Triage That Your Support Agents Will Actually Trust
Why most AI ticket triage fails the agent trust test, how to design a taxonomy and review rules that hold up, and the service metrics that prove it's working.
30 days to validate AI ticket triage safely
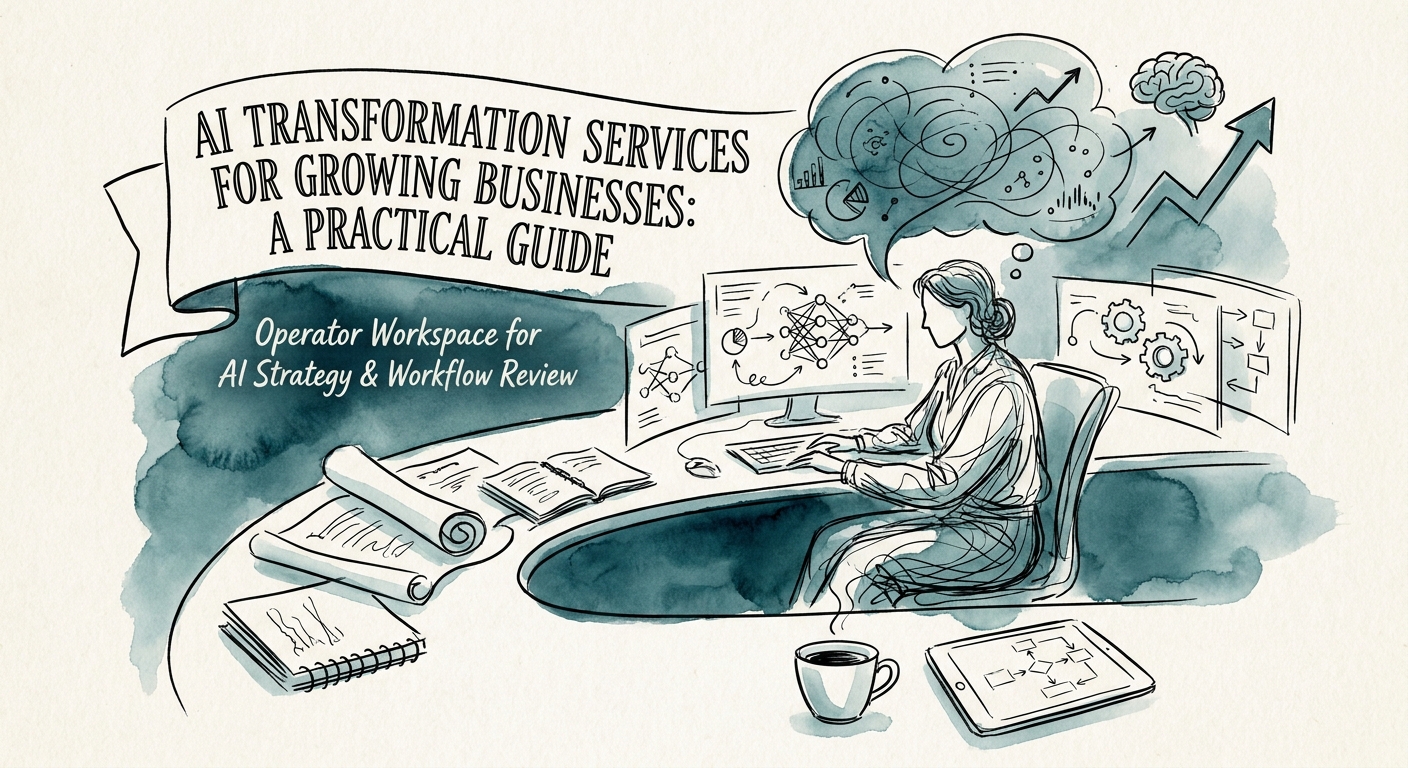
BRIEF · AI TRANSFORMATION STRATEGY
AI Transformation for Growing Businesses: Why the Demos Work and the Rollouts Don't
Most mid-market AI efforts die between the demo and the second Tuesday. Here's the sequencing that gets one workflow into real daily use in 90 days.
6 components of practical AI transformation
BRIEF · AI WORKFLOW AUTOMATION
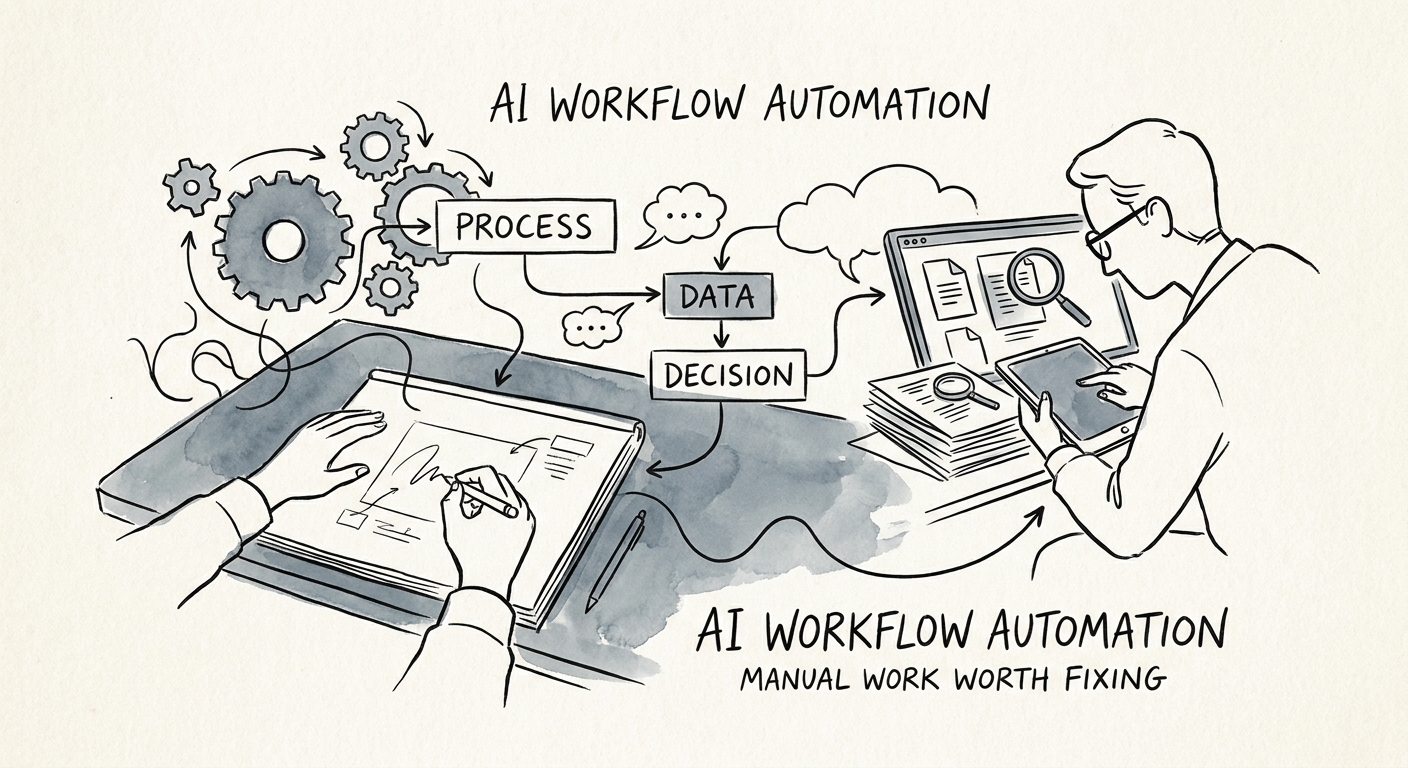
AI Workflow Automation: How to Pick the One Manual Task Worth Automating First
Most teams automate the loudest annoyance, not the costliest one. A five-test screen for sorting manual work into automate-now, fix-the-process-first, and leave-alone.
30 days to validate a focused workflow automation candidate
BRIEF · AI WORKFLOW AUTOMATION
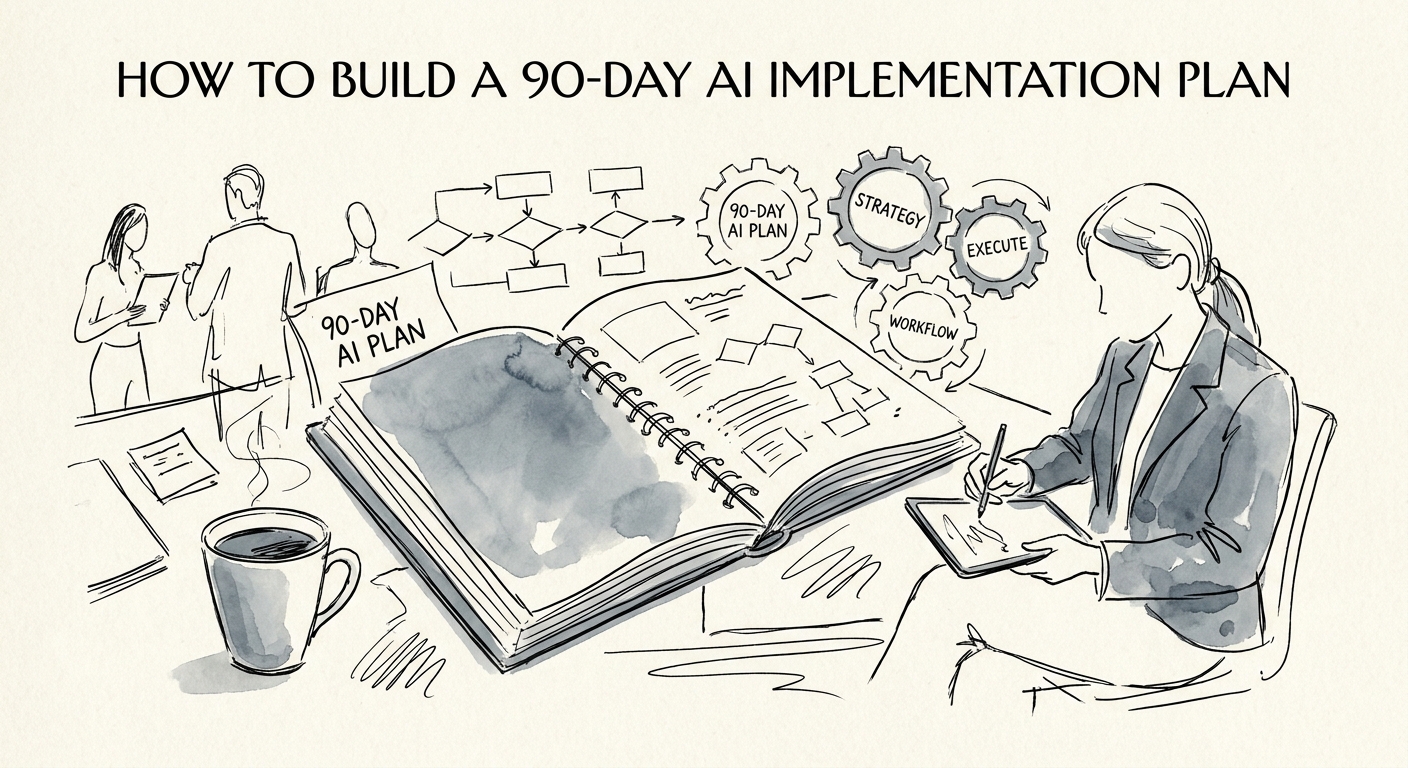
The 90-Day AI Plan That Survives Contact With Your Team
A week-by-week 90-day AI plan for one real workflow: pick it, baseline it, pilot it, then make an honest stop-or-scale call your team will actually trust.
90 days to move one AI workflow from scope to operating cadence
BRIEF · AI KNOWLEDGE SYSTEMS
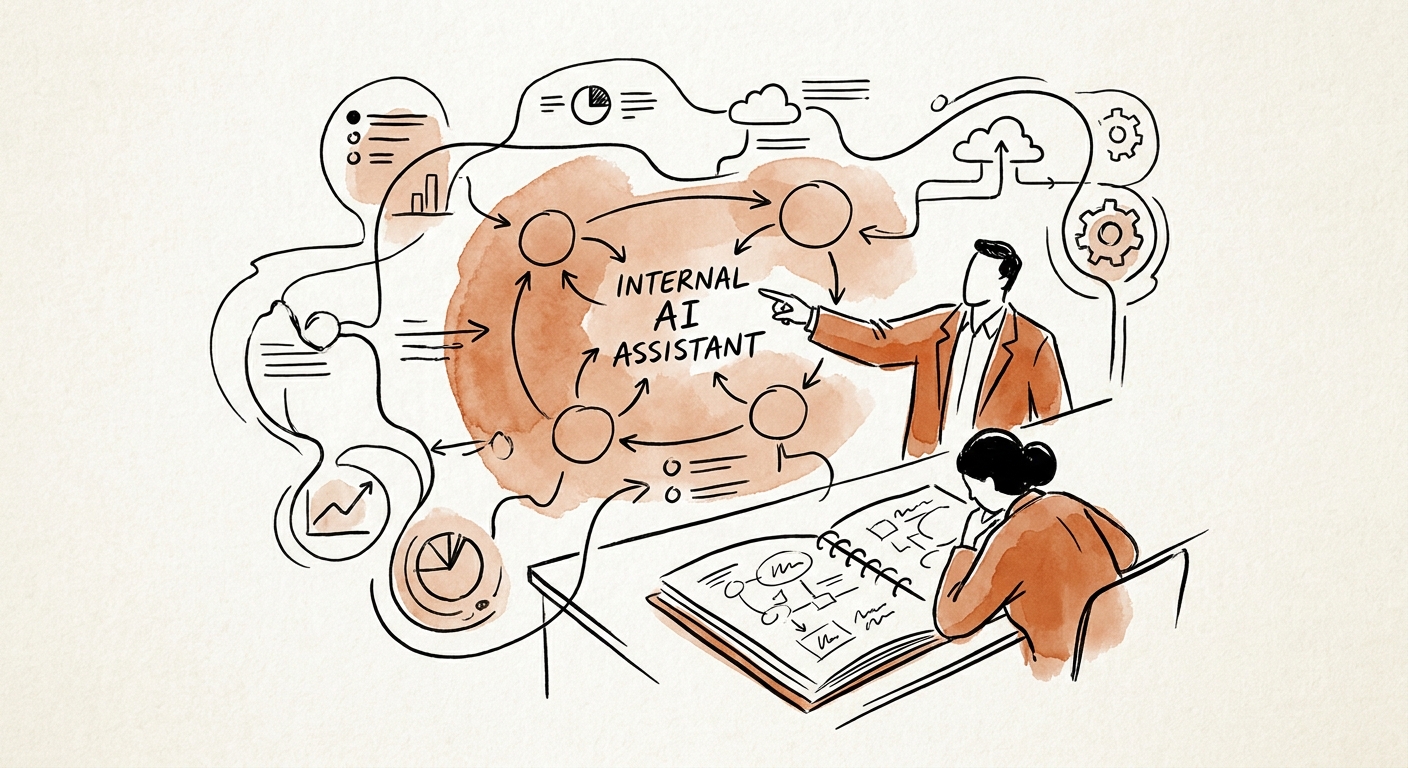
Build an Internal AI Knowledge Assistant That Doesn't Lie to Your Own Team
An internal AI knowledge assistant fails when it cites the wrong SOP. Here's how to scope sources, lock access, and test answers before your team trusts it.
4 controls before an internal knowledge assistant goes live
BRIEF · AI FUNCTION USE CASES
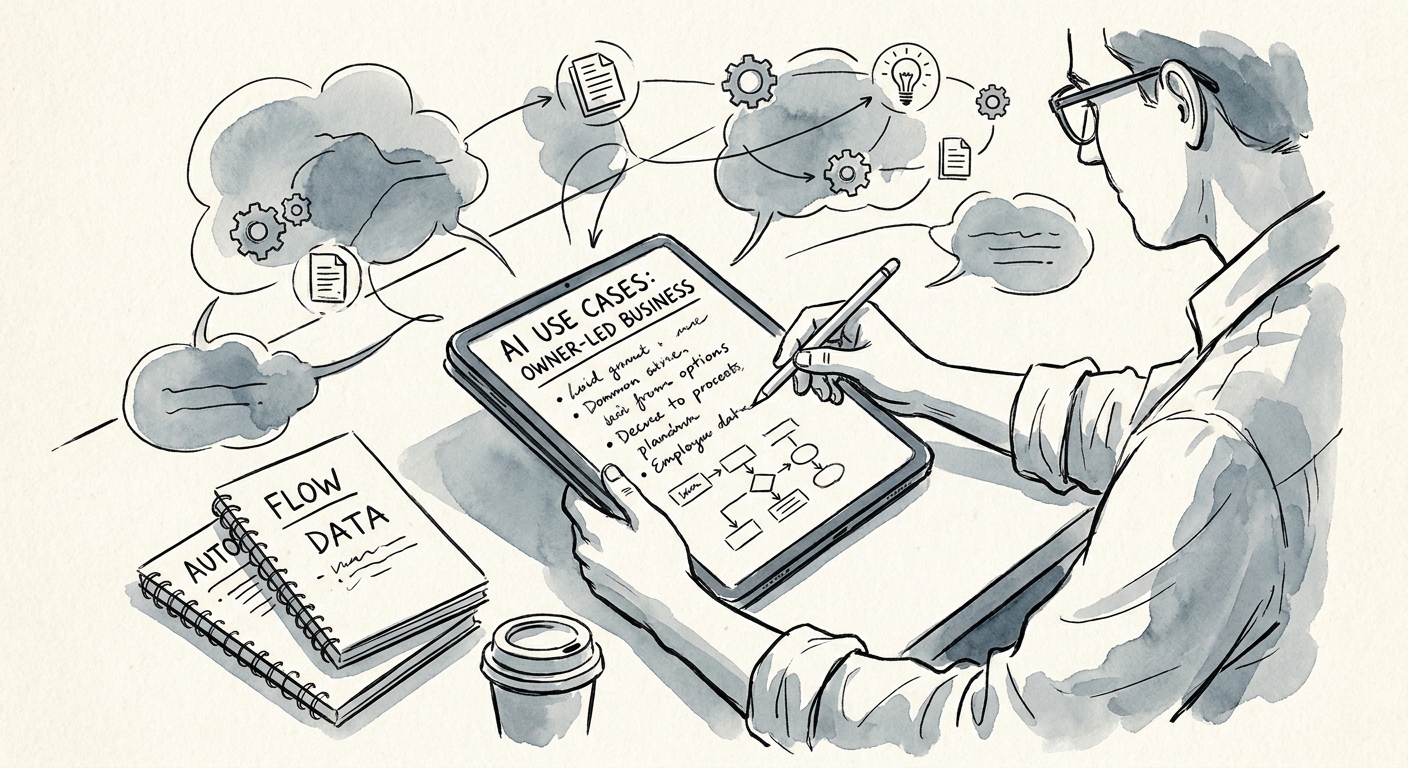
The First 10 AI Use Cases for an Owner-Led Business (Ranked by What Breaks First)
Ten AI use cases an owner-led business can actually run, scored by friction, ownership, and reviewability — plus how to pick the one workflow to pilot first.
10 use cases to evaluate before buying tools
BRIEF · AI VENDOR AND BUILD-VS-BUY
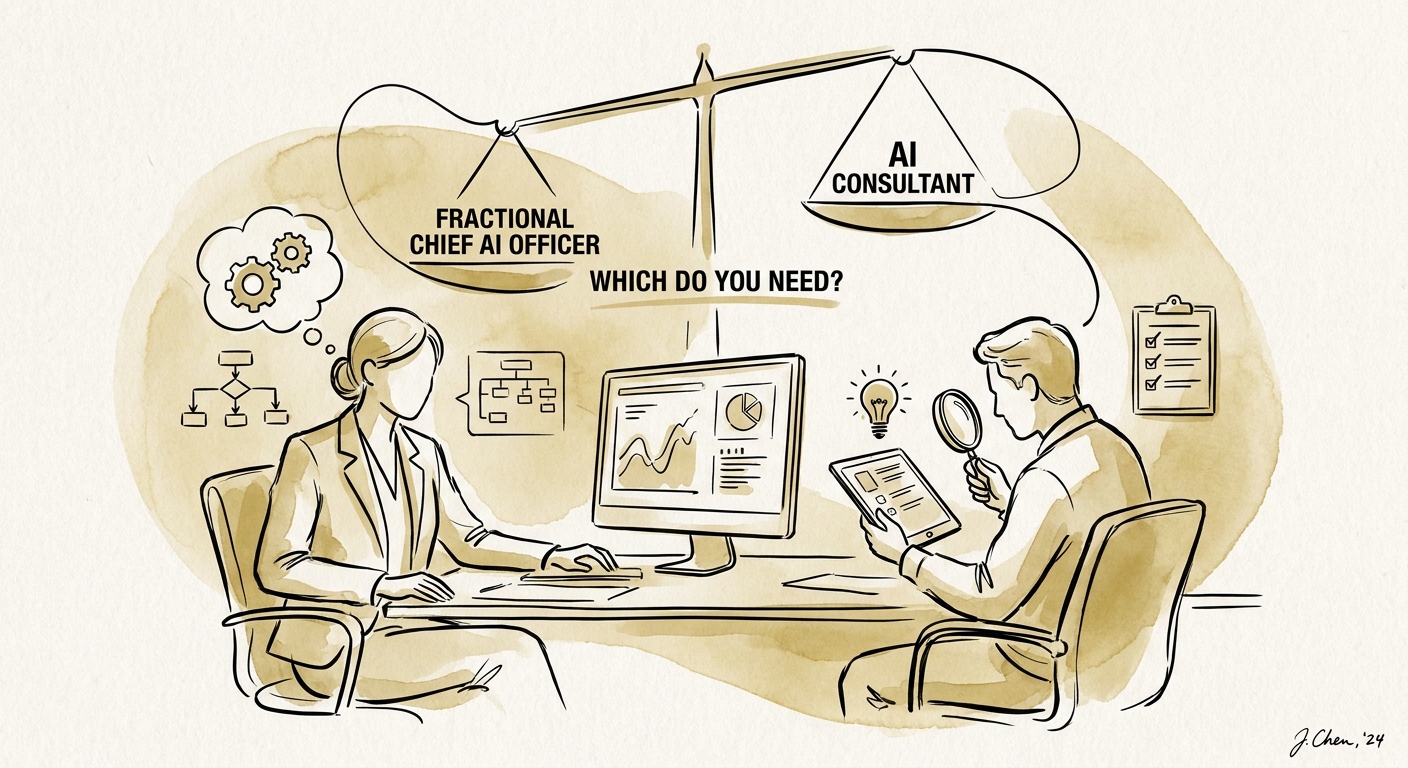
Fractional Chief AI Officer vs. AI Consultant: The Test That Settles It
One question decides whether your business needs a fractional AI leader or a project-based consultant: does the work end when the recommendation lands, or does someone have to run it Monday after Monday?
8-20 monthly hours for fractional AI operating support
BRIEF · AI MEASUREMENT AND ROI
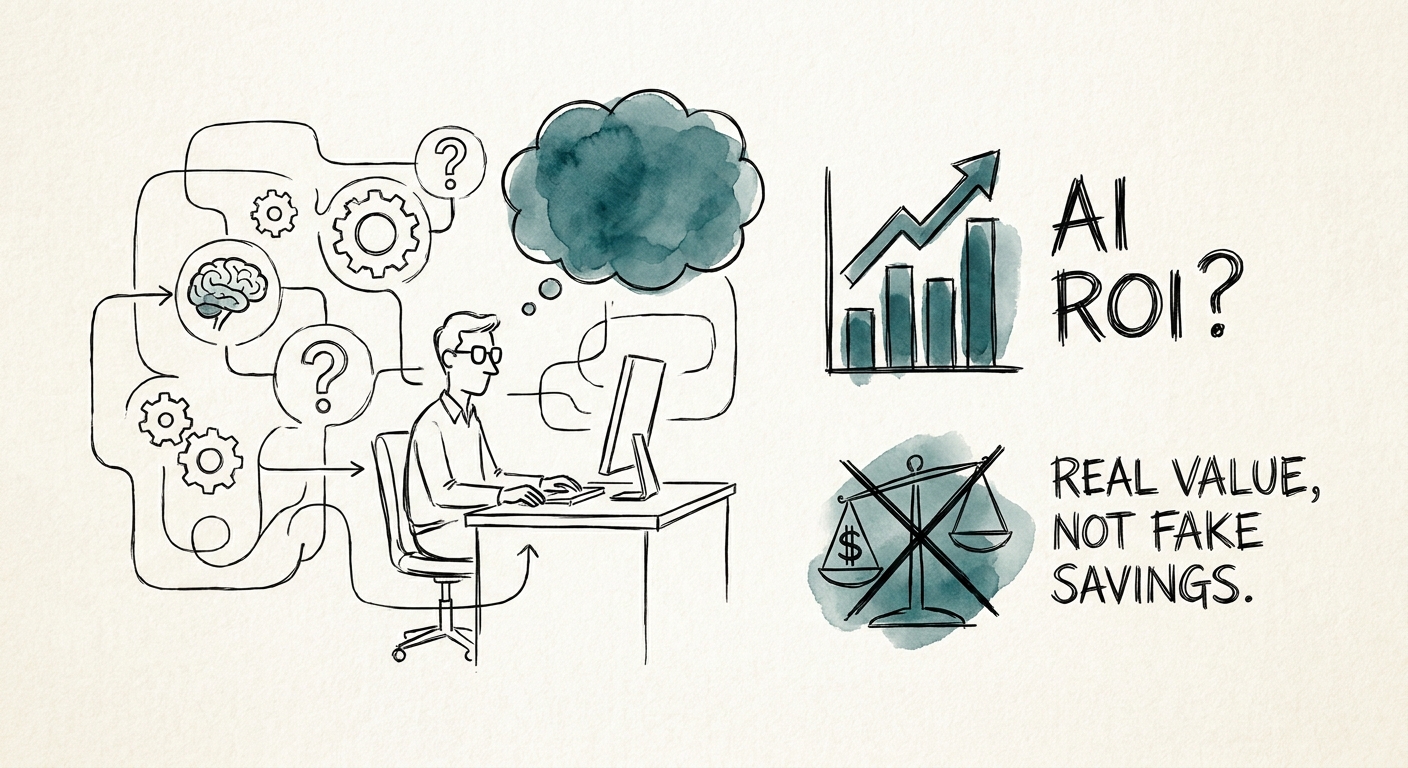
AI ROI Math: Why "Minutes Saved Times Salary" Is a Lie
The "minutes saved times salary" formula invents money that never reaches your P&L. Here are 5 ROI categories that survive a real operating review.
5 ROI categories beyond time saved
BRIEF · AI KNOWLEDGE SYSTEMS
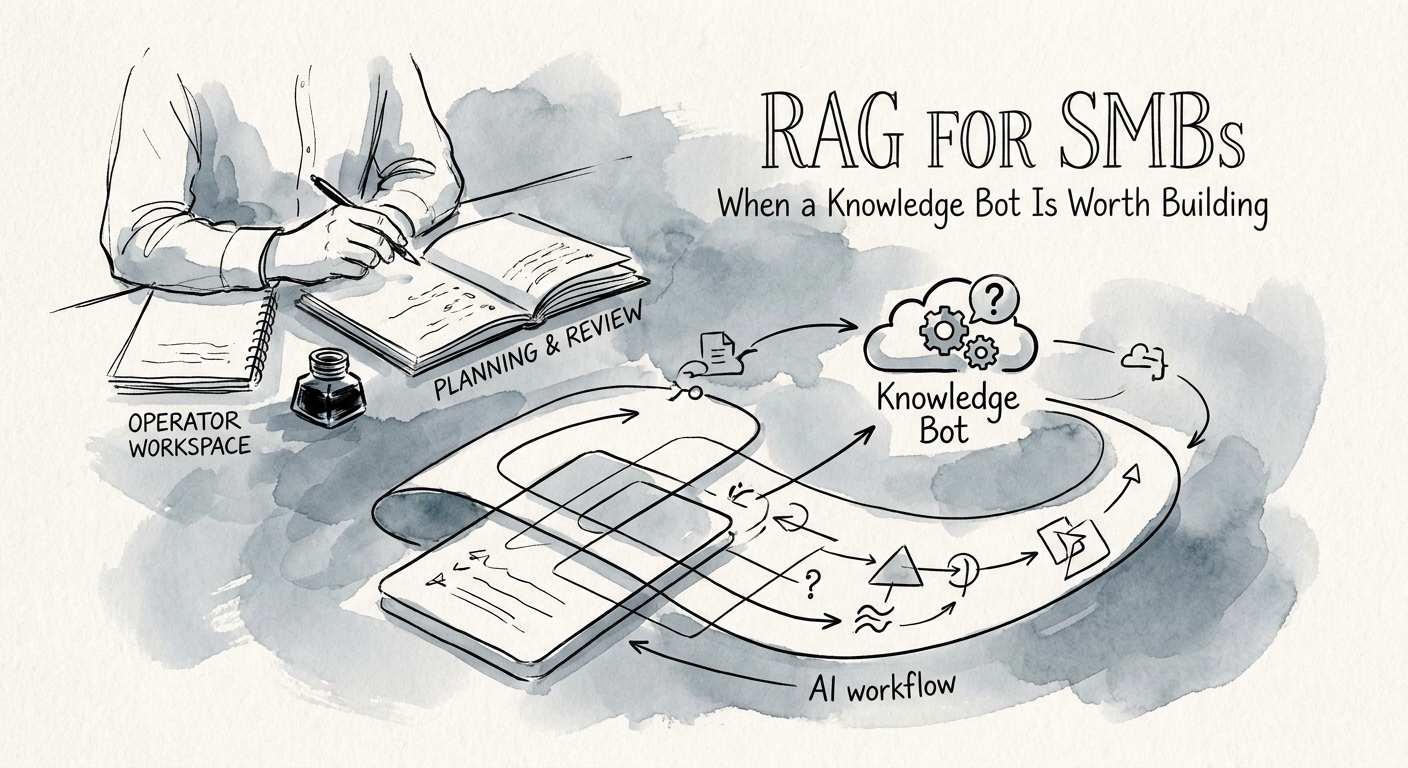
RAG for SMBs: The Knowledge Bot Question Nobody Asks First
Before you build a RAG knowledge bot, run the five-document test. Most SMBs find a paperwork problem, not an AI problem. Here's how to tell which one you have.
5 readiness tests before building RAG
BRIEF · AI TRANSFORMATION STRATEGY
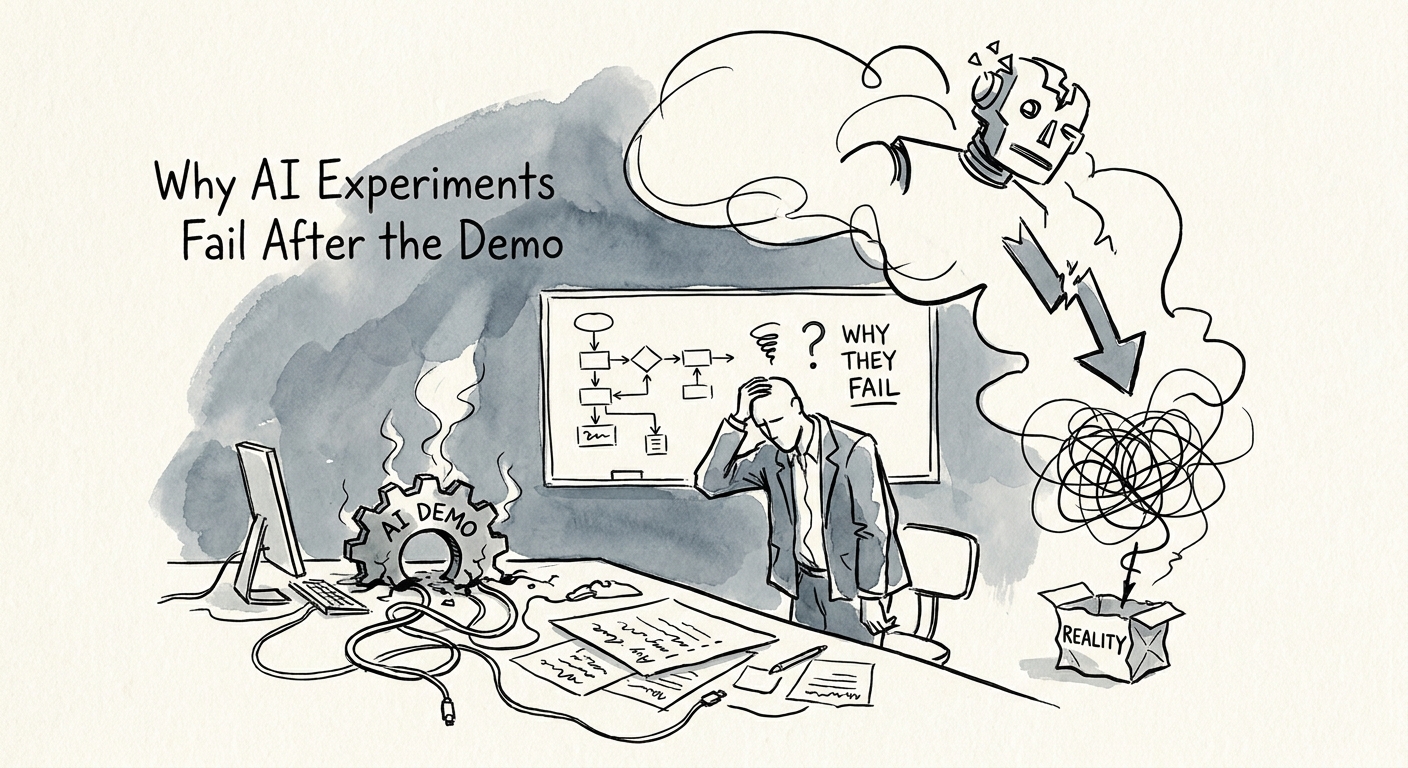
The Demo Worked. Six Weeks Later Nobody Was Using It.
A slick AI demo proves the model responds. It says nothing about whether work changed. Here is the handoff that decides if an SMB pilot survives week six.
37% organizations using AI with little or no process change in Deloitte's report
BRIEF · FINANCIAL INFRASTRUCTURE
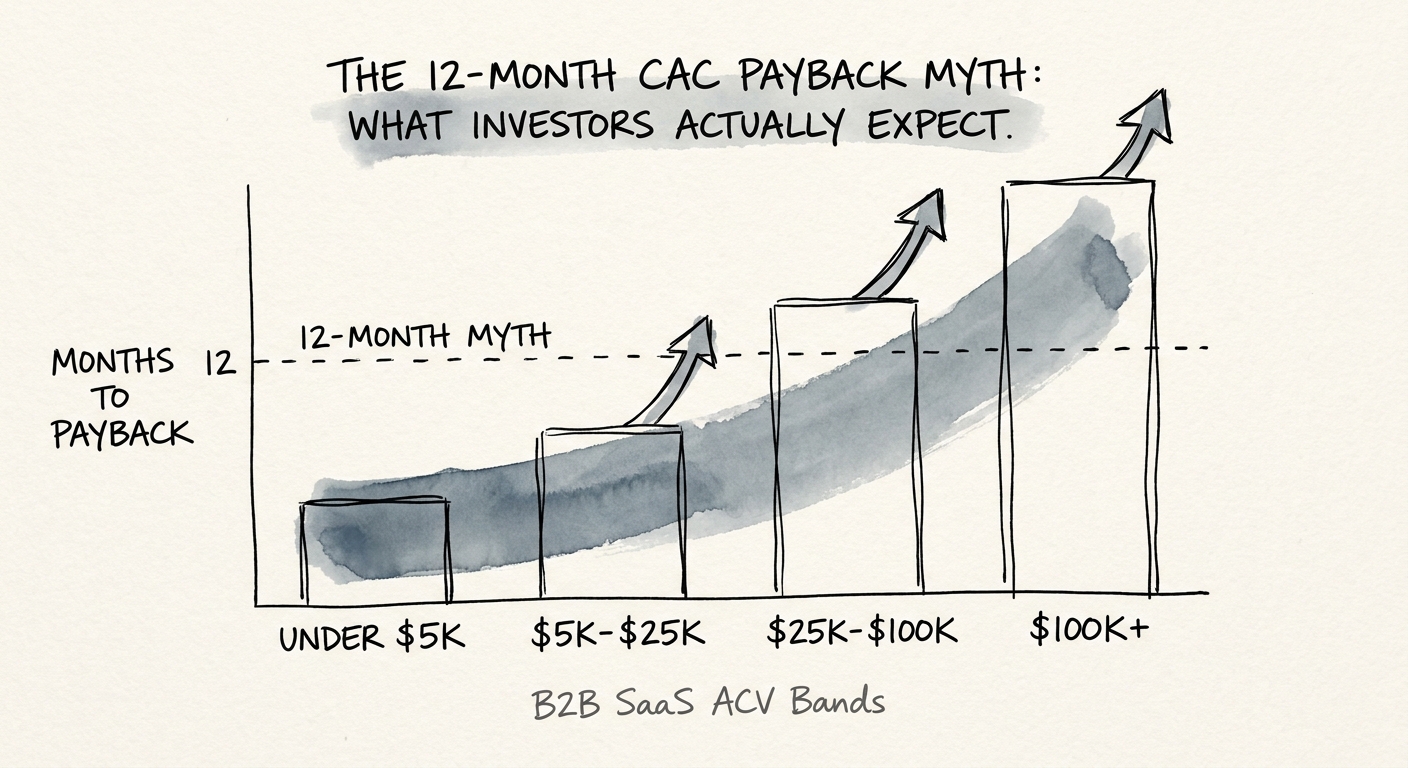
The 12-Month CAC Payback Rule Is Costing You the Enterprise
A "perfect" 12-month blended CAC payback often hides a starved enterprise pipeline. Here's the cohort math buyers actually underwrite — and the 88% NRR it exposes.
18 Months (Median B2B SaaS CAC Payback)
BRIEF · PROJECT RECOVERY
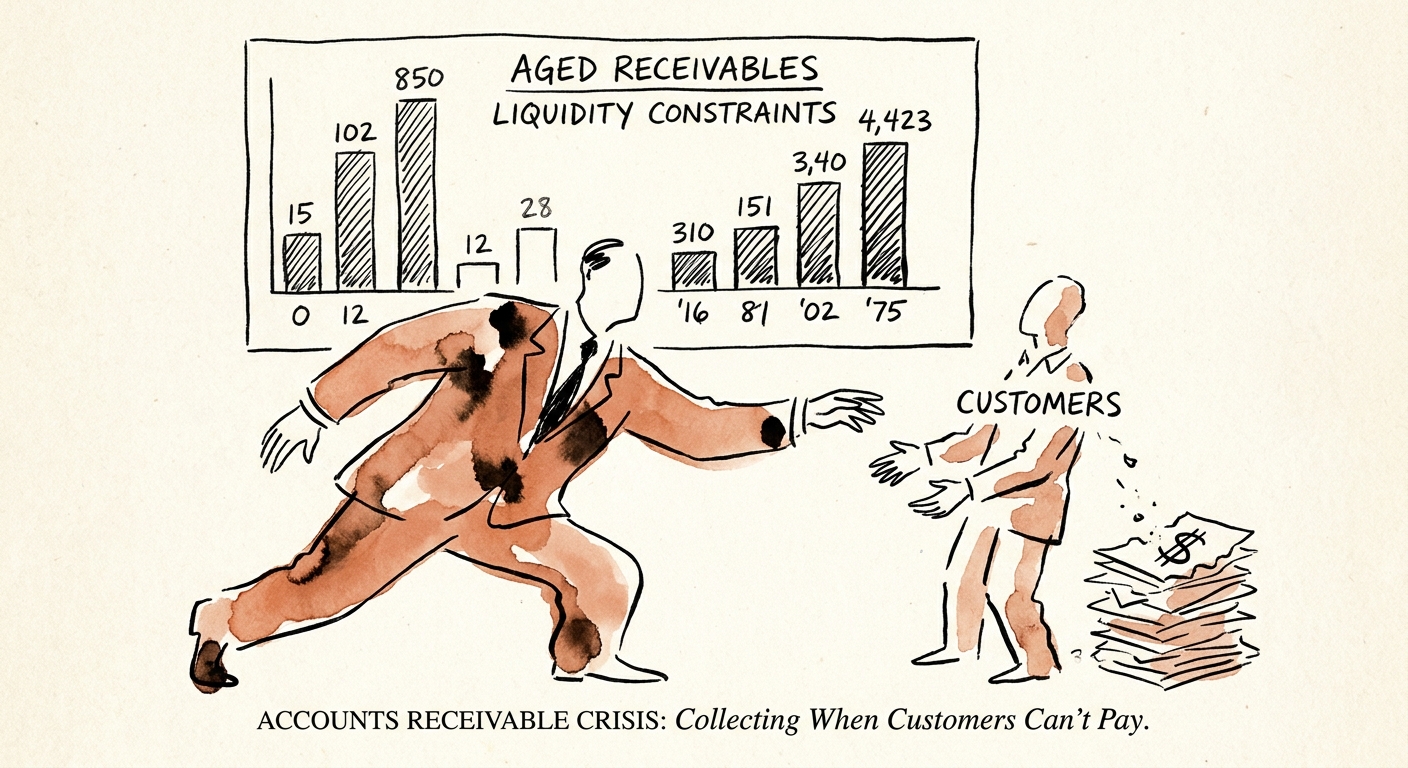
The Accounts Receivable Crisis: Collecting When Customers Can't Pay
Learn how to triage distressed accounts, escalate contract-governed payment issues, and recover cash when customers cannot pay on time.
120 days Executive Recovery Review Trigger
BRIEF · TEAM & HIRING
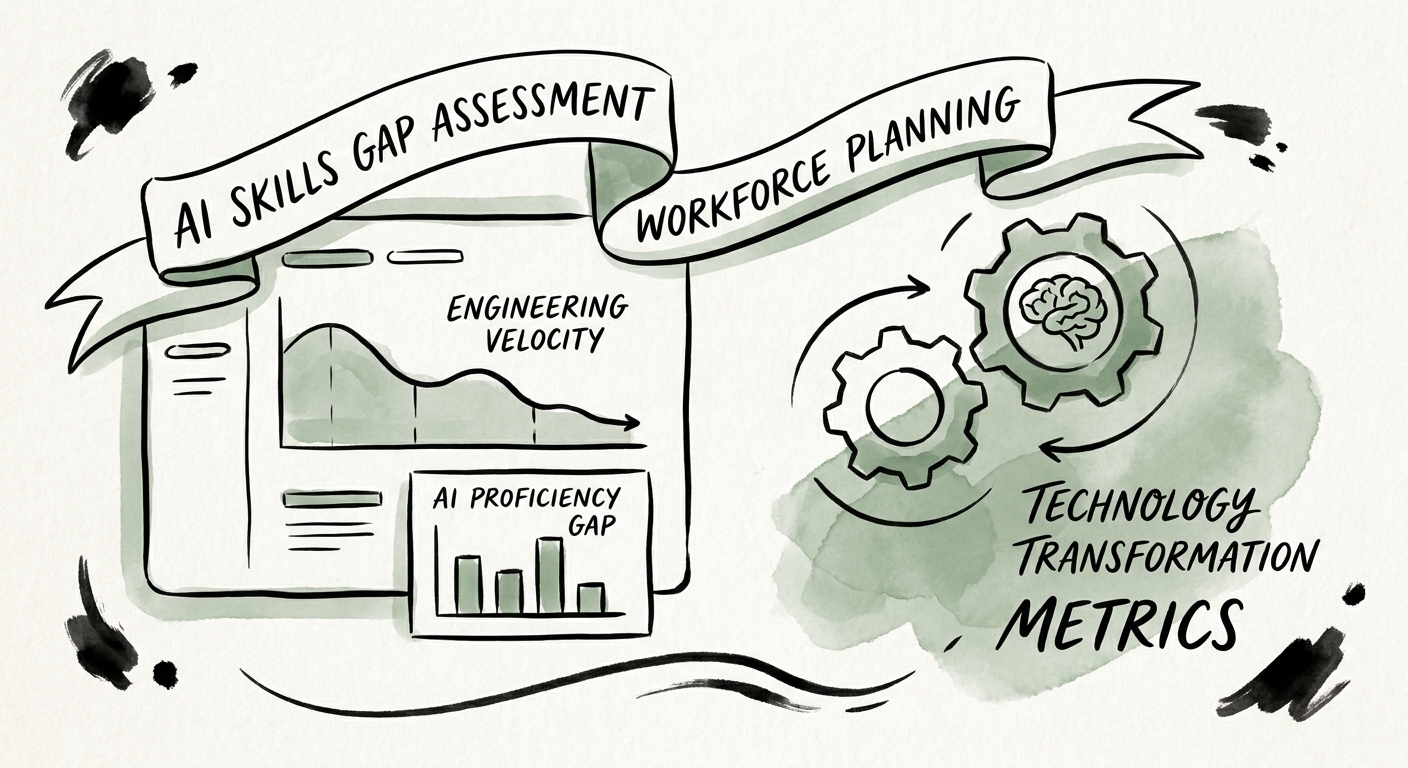
The AI Skills Gap That Quietly Tanks Mid-Market Software Valuations
Mid-market software firms are buying AI licenses without assessing who can actually wield them. Here is how to map the gap before it shows up in diligence.
40% Velocity Loss from Unassessed AI Adoption
BRIEF · COMPLIANCE & SECURITY
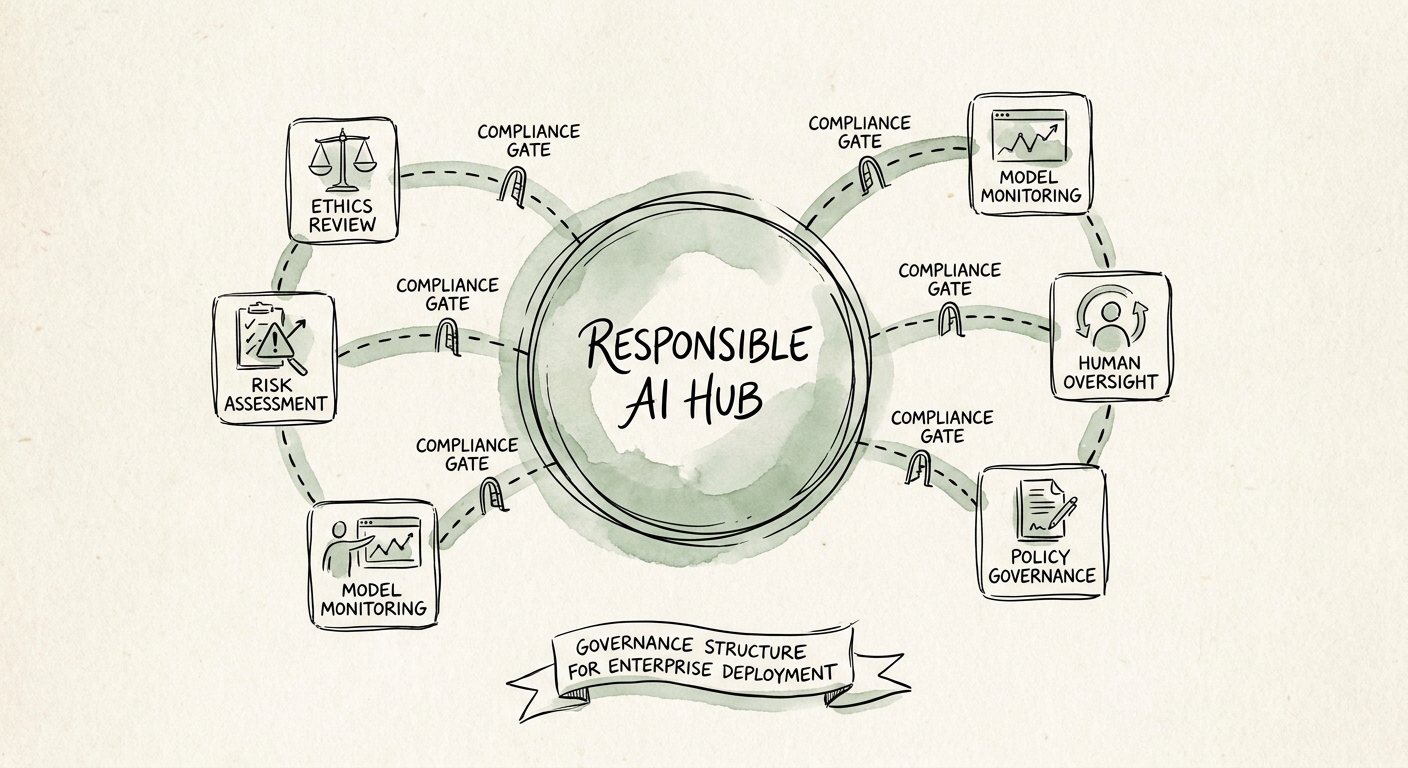
The Enterprise AI Governance Structure That Survives Contact With 2,000 Employees
Most responsible AI frameworks die as PDFs. Here's the use-case register, five governance roles, and risk tiers that actually hold up at enterprise scale.
5 governance roles before enterprise AI scale
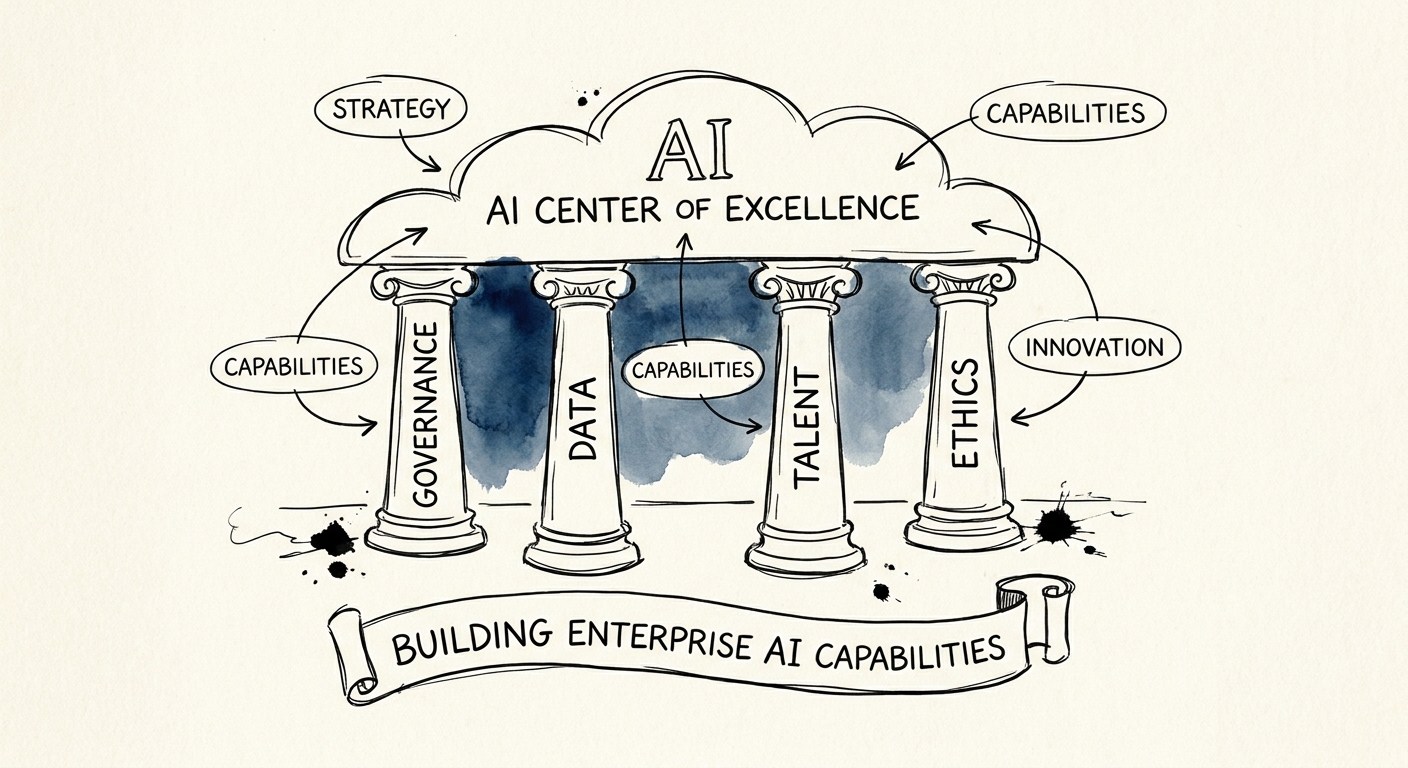
BRIEF · PROCESS DOCUMENTATION
Your AI Center of Excellence Is a Filing Cabinet, Not an Org Chart
Most AI Centers of Excellence are an org chart with no paperwork behind it. Here are the four documents that decide whether your models survive M&A diligence.
70% Budget burned in pilot phase without a CoE
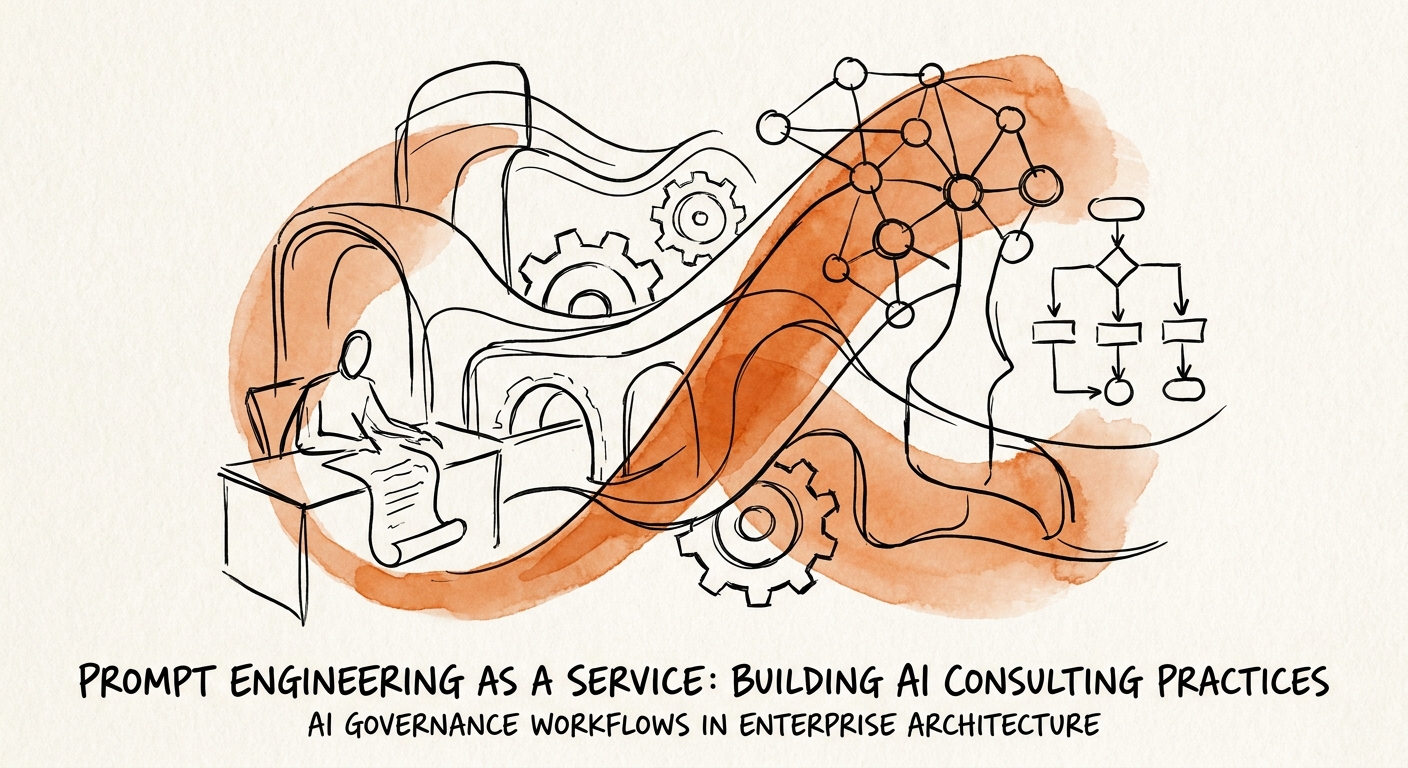
BRIEF · REVENUE ARCHITECTURE
Stop Selling Prompts. Sell the Workflow They Break Inside Of.
A prompt pack is a one-time invoice that decays. Here is how a tech-services firm turns prompt engineering into a recurring, governed, defensible service line.
4 assets needed beyond prompt libraries
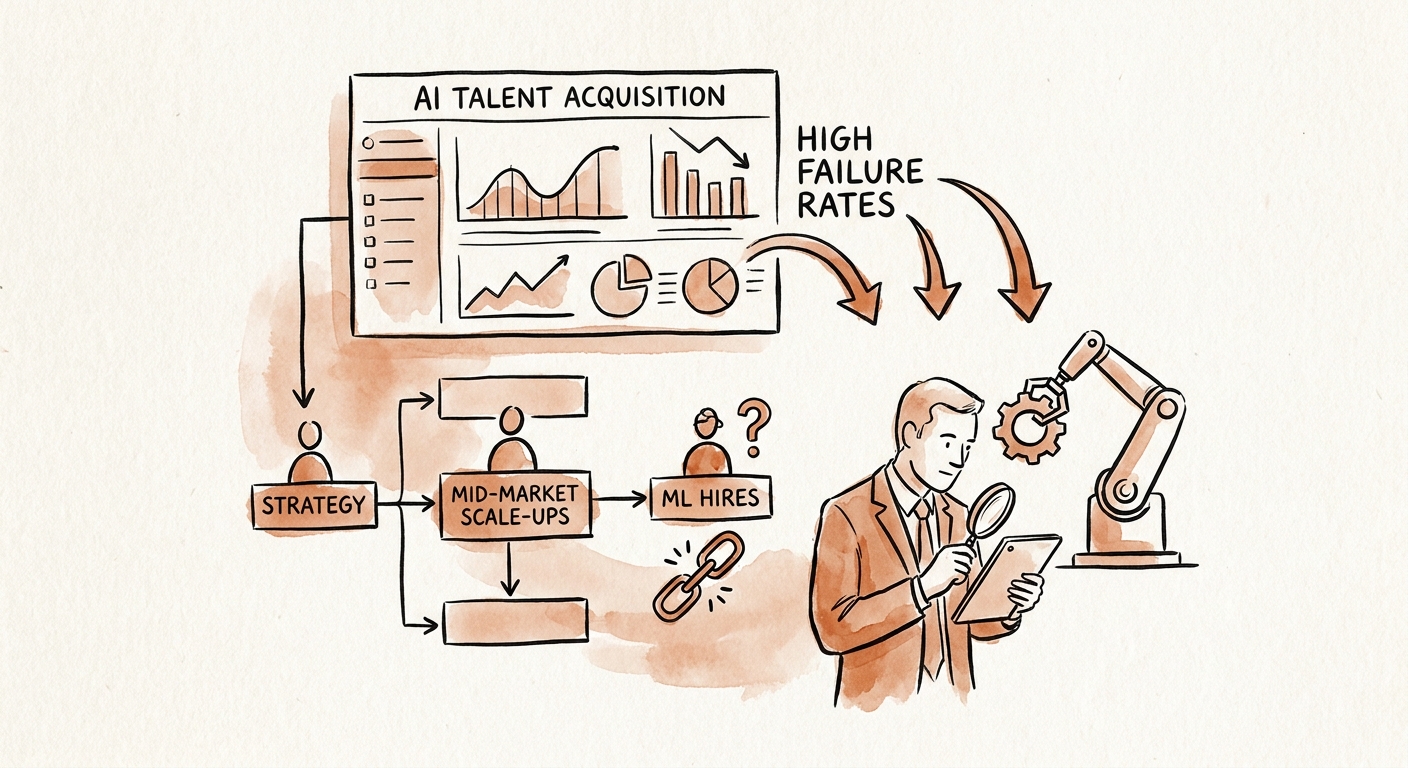
BRIEF · TEAM & HIRING
The Notebook Engineer Trap: Why Your Best-Credentialed ML Hire Can't Ship
Your highest-paid ML hire has a PhD and can't deploy a model past a Jupyter notebook. Here's how to screen B2B SaaS engineering talent for production, not theory.
$285,000 Sunk Cost per Failed ML Hire
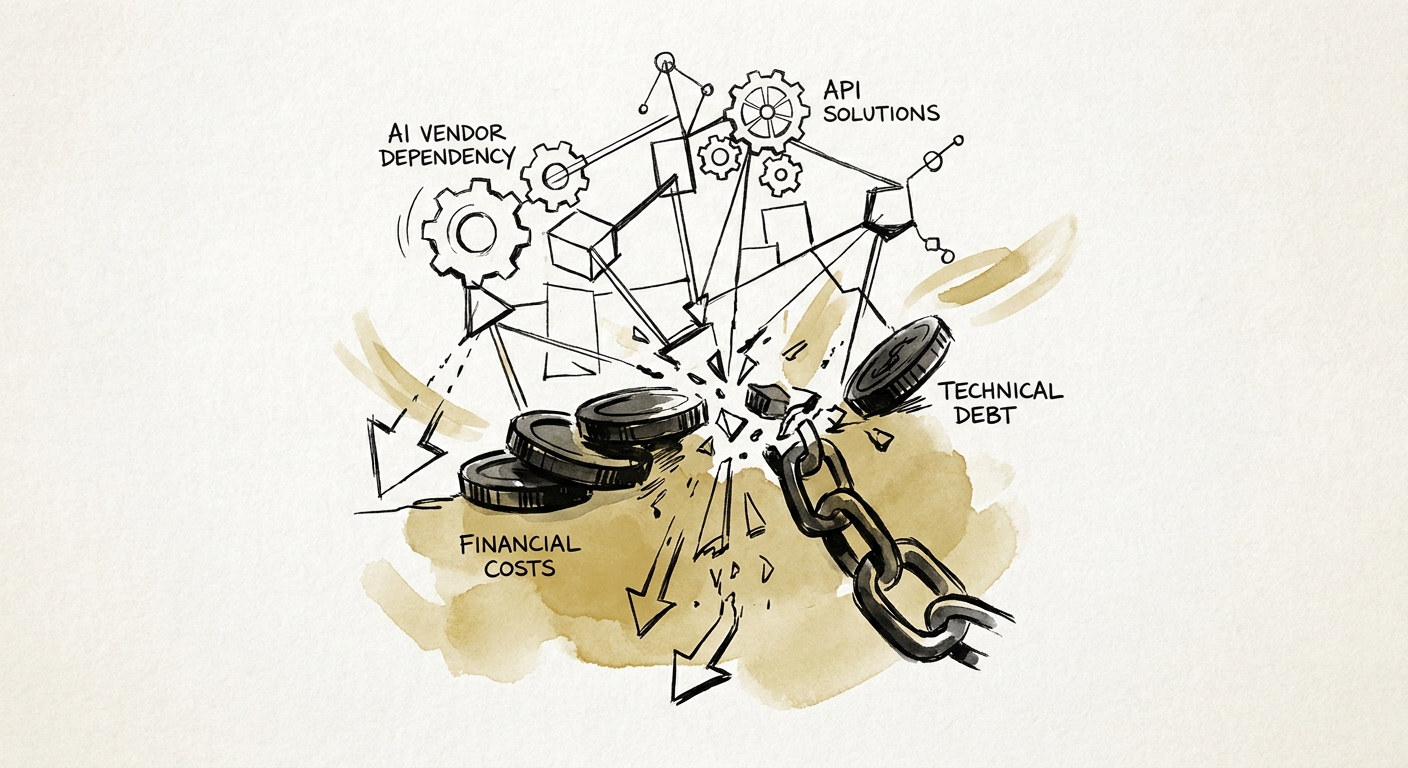
BRIEF · TECHNICAL DEBT
The Margin That Wasn't There: Auditing AI Vendor Dependency Before You Sign
A SaaS target's 82% gross margin can hide a single-vendor API bill that quietly halves it. How to diligence AI dependency, model drift, and COGS before LOI.
349% Increase in AI Infrastructure COGS