BRIEF · AI VENDOR AND BUILD-VS-BUY
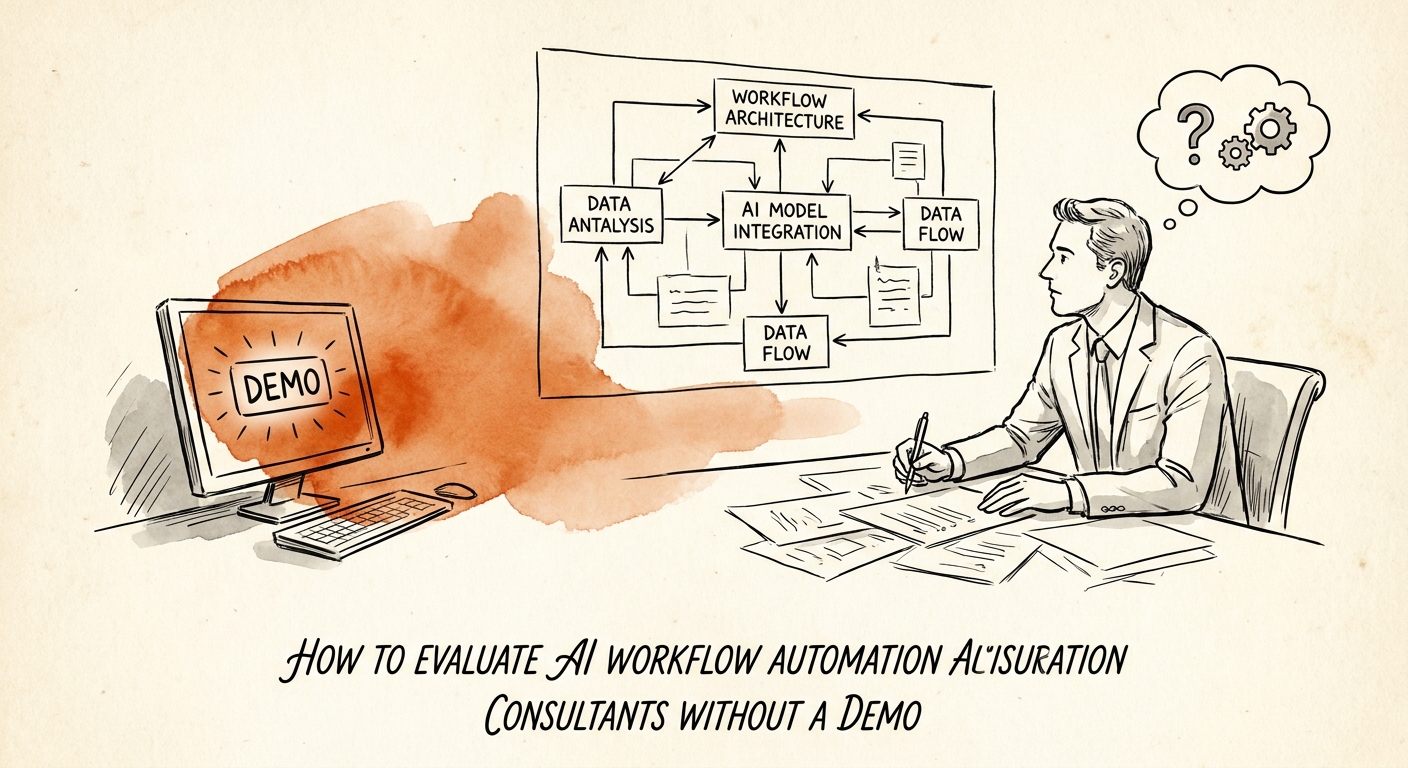
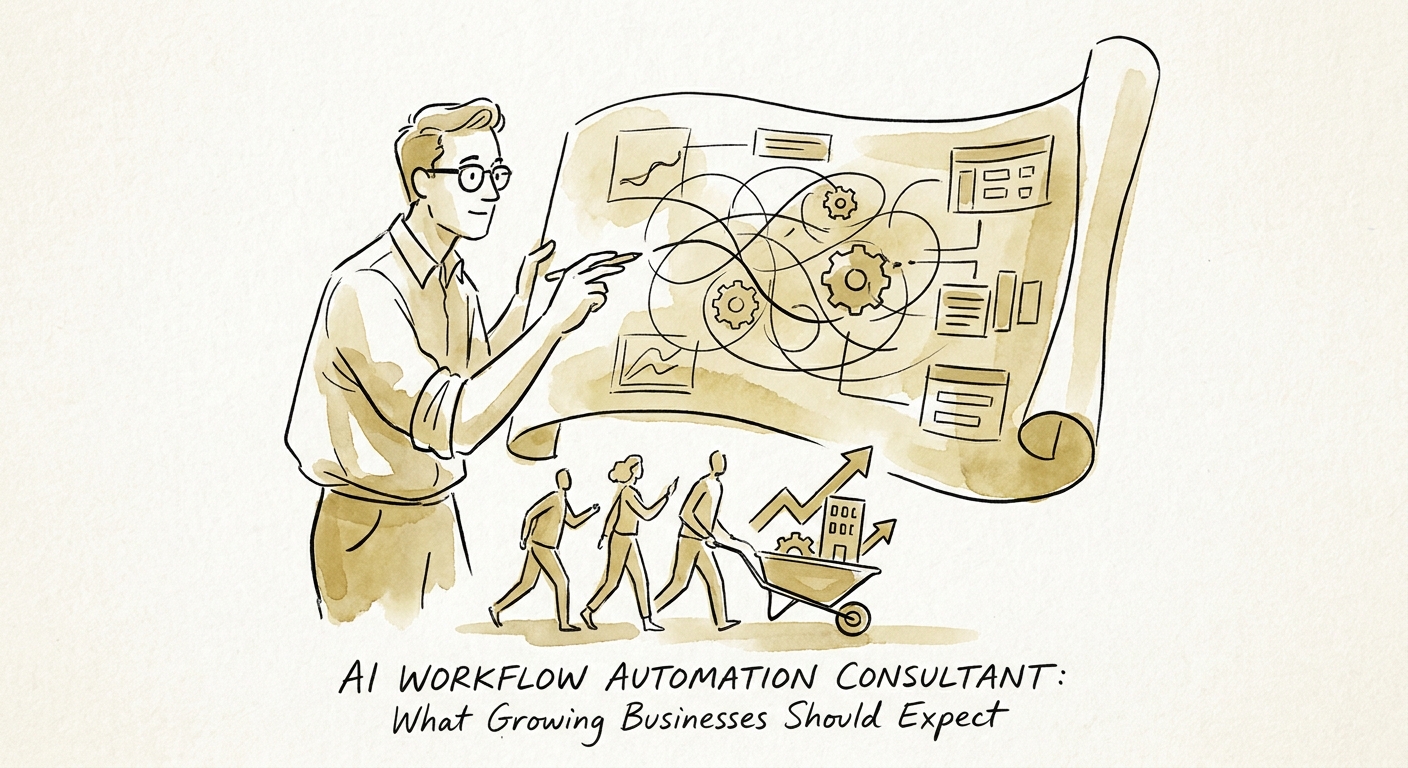
How to Vet an AI Workflow Automation Consultant When You Can't Trust the Demo
Demos hide the messy 20% of any workflow. Here's how to evaluate an AI workflow automation consultant on exceptions, controls, and architecture instead.
7 workflow questions before build
BRIEF · AI TRANSFORMATION STRATEGY
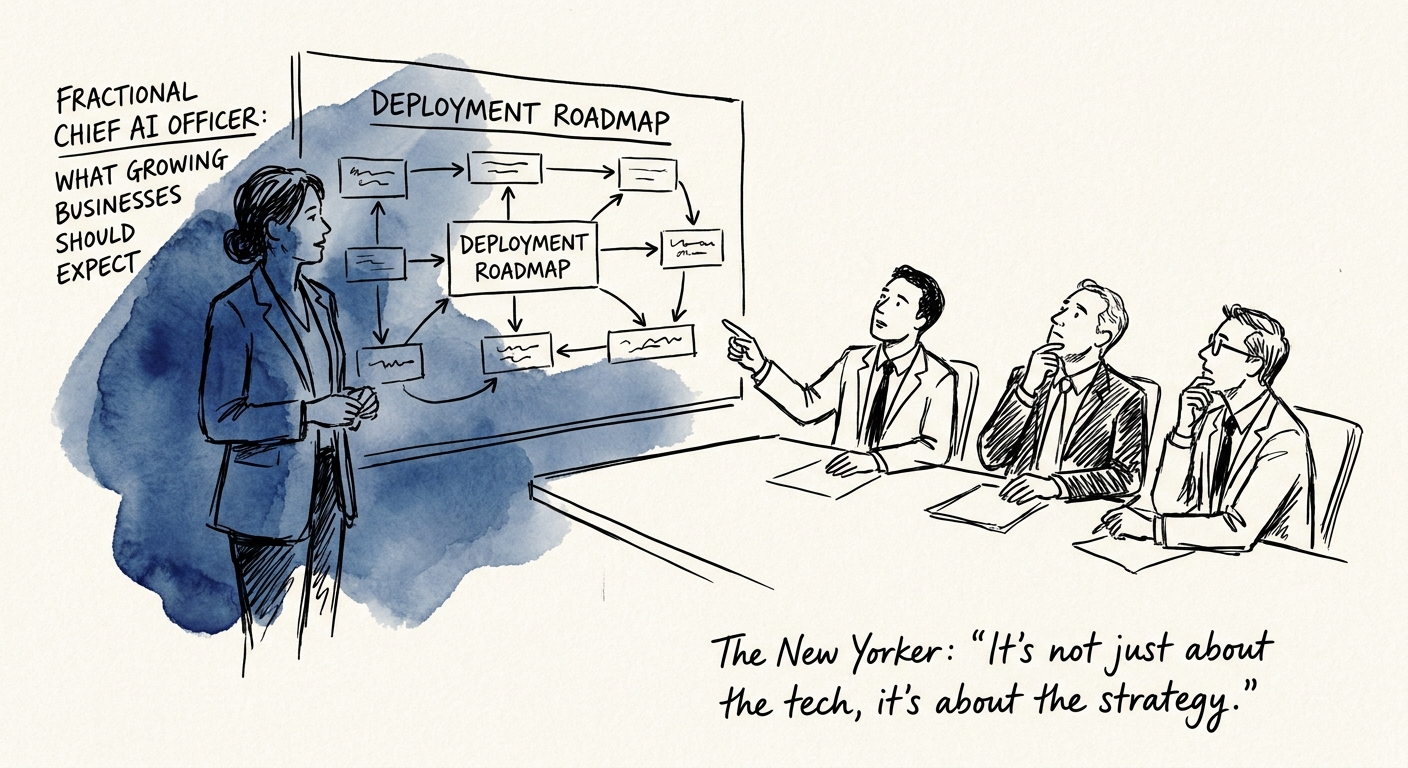
What a Fractional Chief AI Officer Actually Does in the First 90 Days
Inside a tech-services firm with five teams buying AI tools and nobody owning the risk. What a fractional Chief AI Officer fixes in 30, 60, and 90 days.
90 days to prove the AI operating model
BRIEF · AI WORKFLOW AUTOMATION
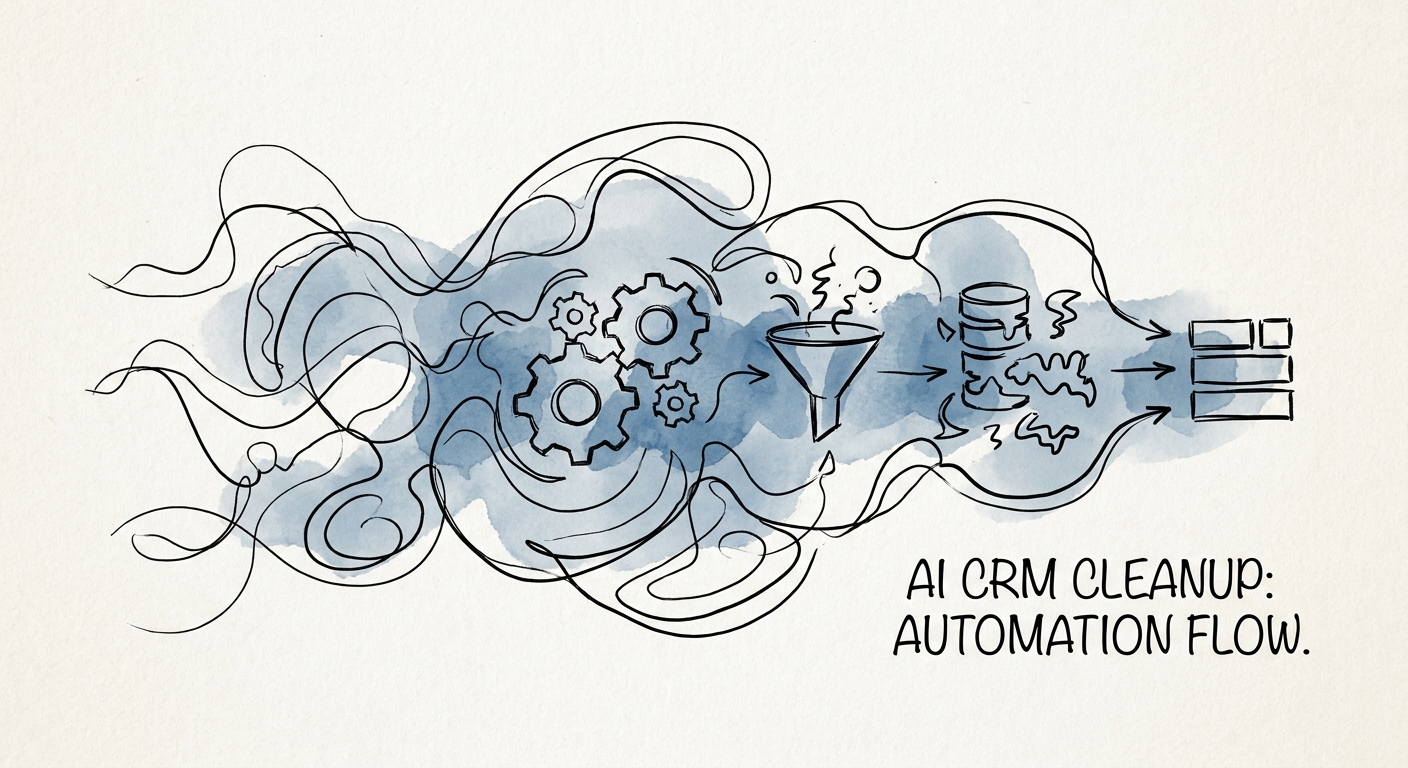
The First AI Workflow That Pays Off: Cleaning Your CRM Without Trusting It Blindly
Pointing AI at a messy CRM as a one-click bulk fix is how you corrupt your pipeline. Build a review queue instead. Here is the workflow that actually sticks.
4 CRM cleanup controls before automation
BRIEF · AI GOVERNANCE AND TRAINING
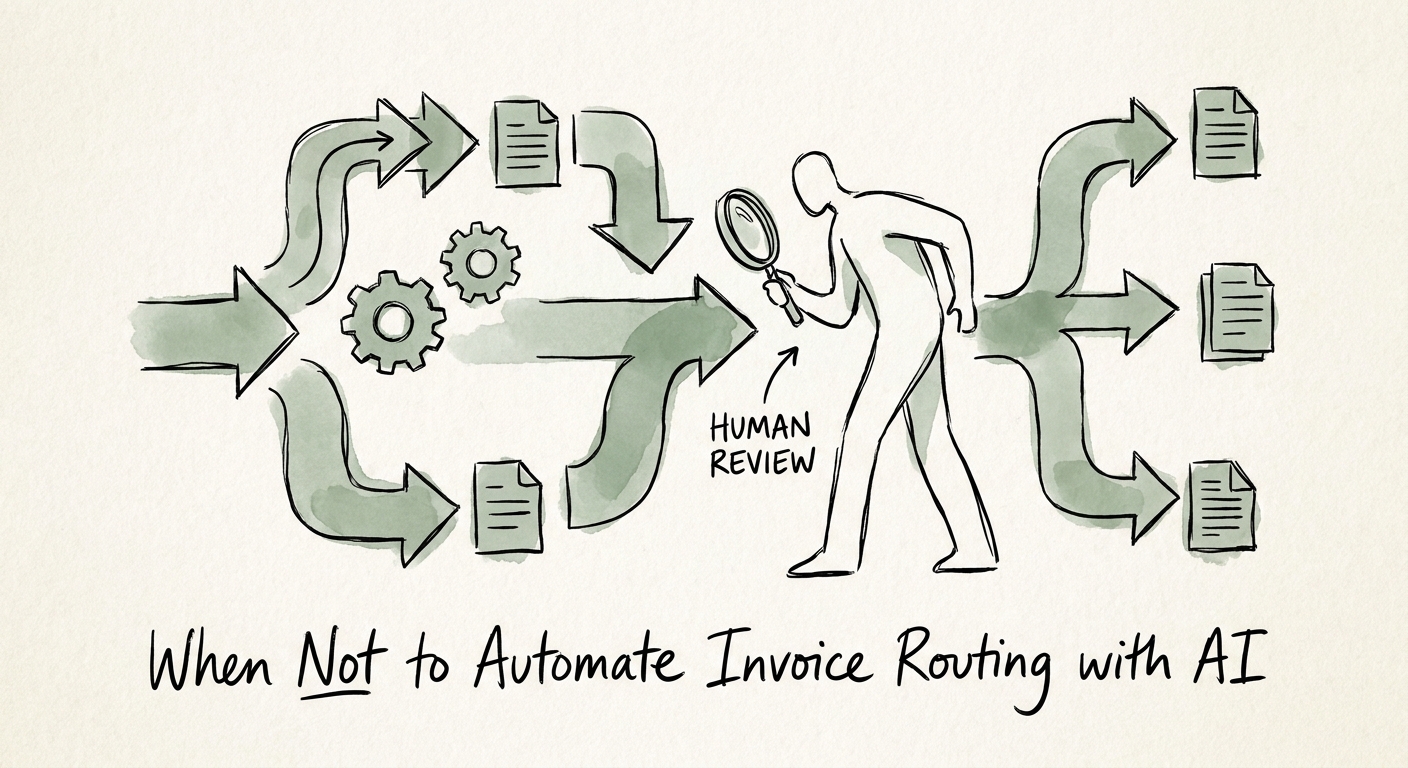
Don't Automate Invoice Routing Until Your Vendor Master Stops Lying
The fastest way to pay a fraudster twice is to bolt AI onto a messy vendor master. Here's the readiness check finance leaders should run before automating invoice routing.
4 finance controls before routing automation
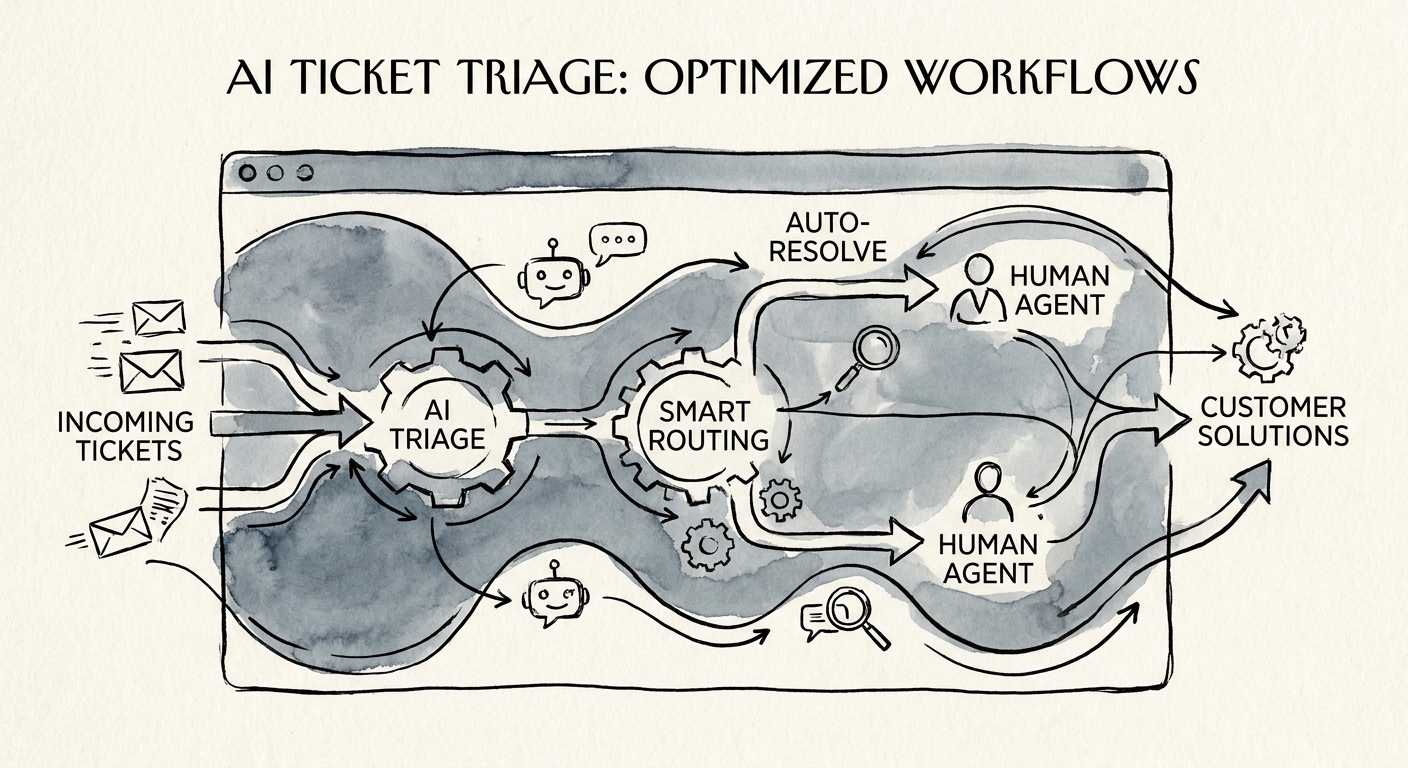
BRIEF · AI WORKFLOW AUTOMATION
AI Ticket Triage: Why You Should Automate the Routing Before the Reply
Most support teams point AI at the reply and skip the triage. Here's why classifying, summarizing, and routing tickets first beats auto-answering customers.
4 triage controls to define first
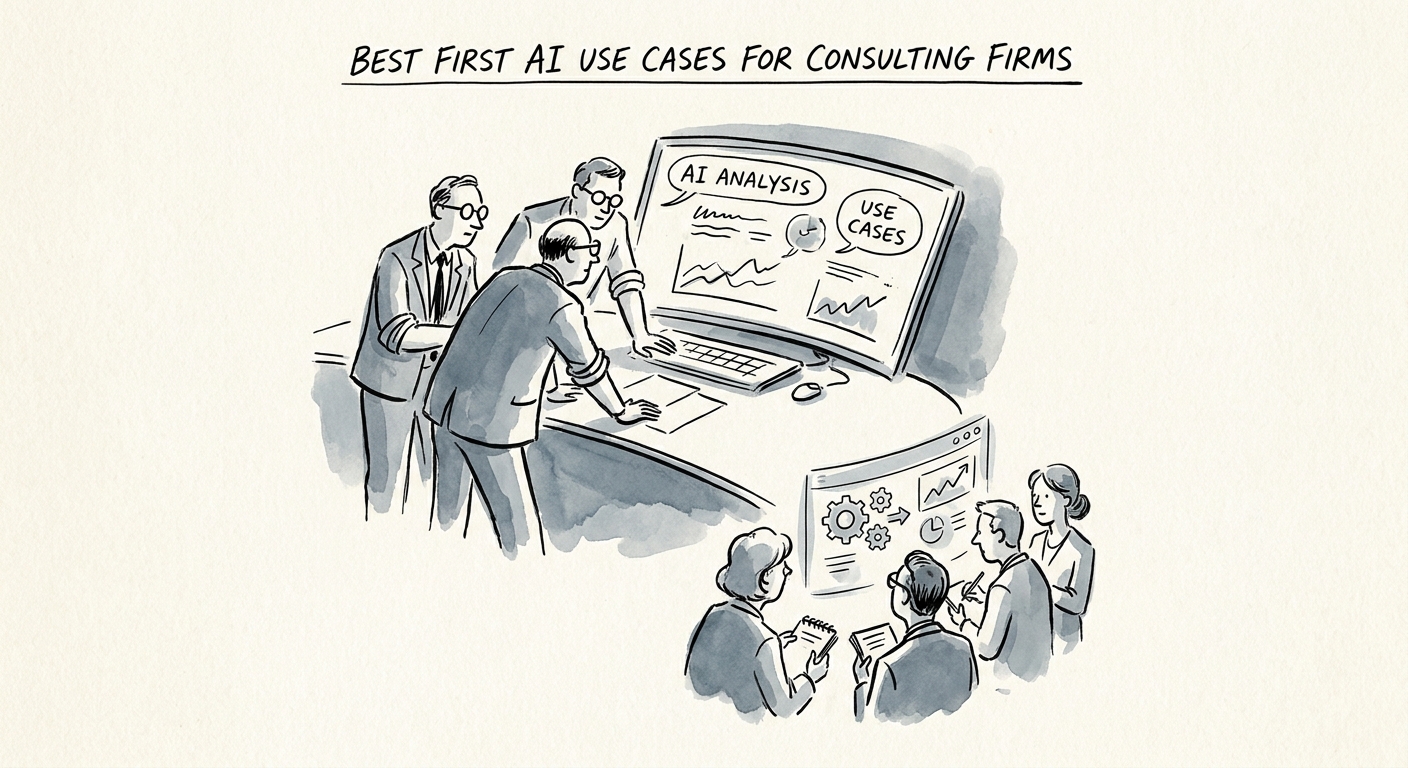
BRIEF · AI INDUSTRY USE CASES
The First AI Use Cases That Pay Off Inside a Consulting Firm
Where a consulting firm should actually start with AI: proposals, document intake, retrieval, follow-up, and reporting — without touching billable judgment.
5 consulting workflows to evaluate first
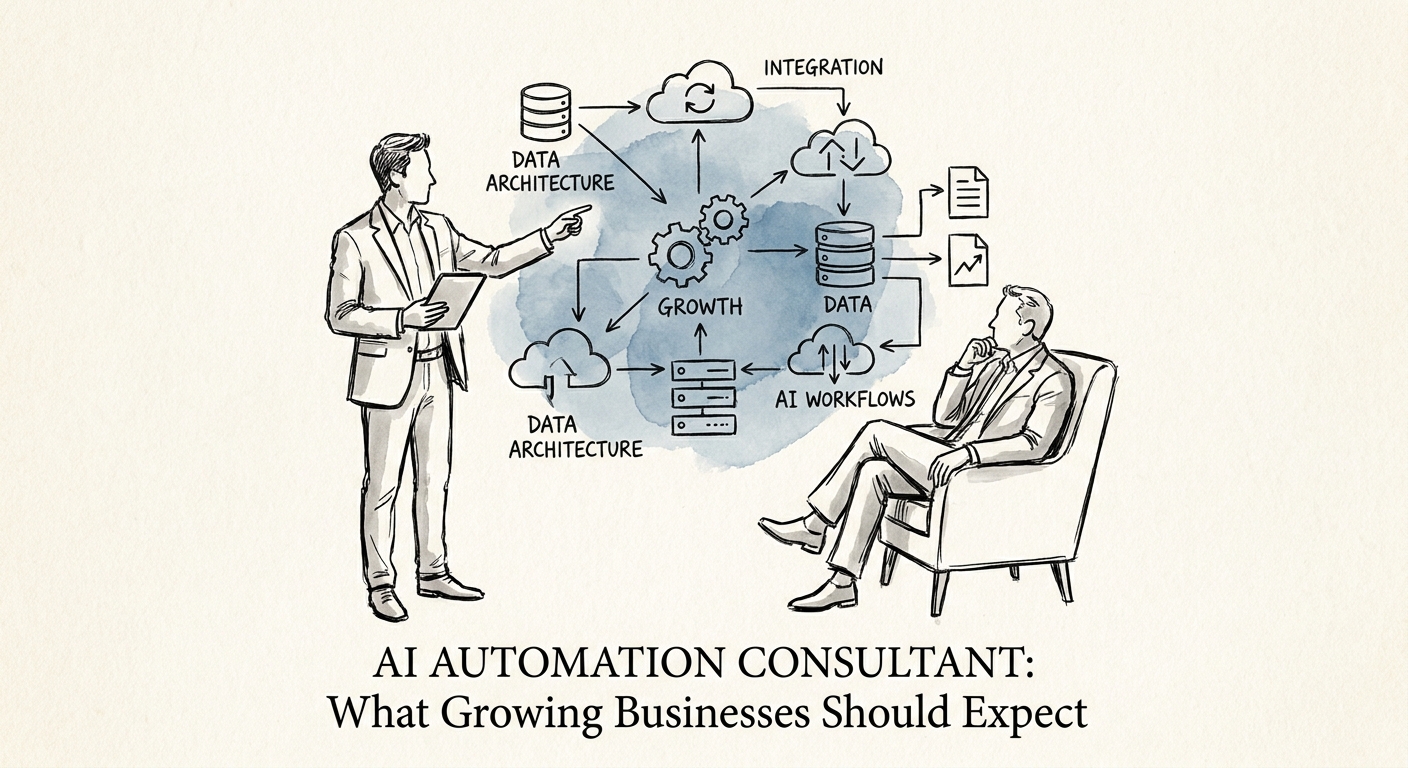
BRIEF · AI TRANSFORMATION STRATEGY
AI Automation Consultant: What You Actually Get for the Money
Hiring an AI automation consultant for a tech-services firm? Here's the difference between a slide deck and one workflow that actually runs on a Tuesday.
5 work products to expect from an AI automation consultant
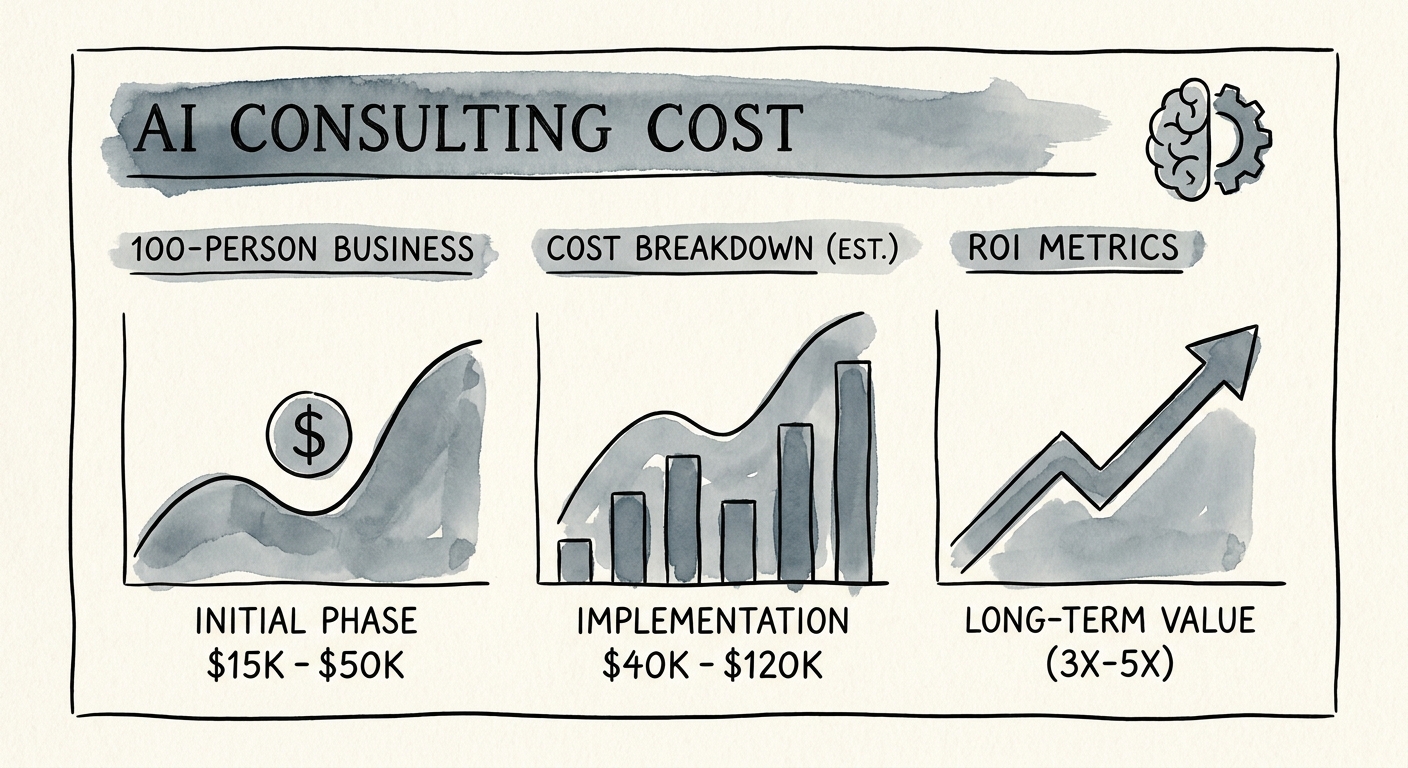
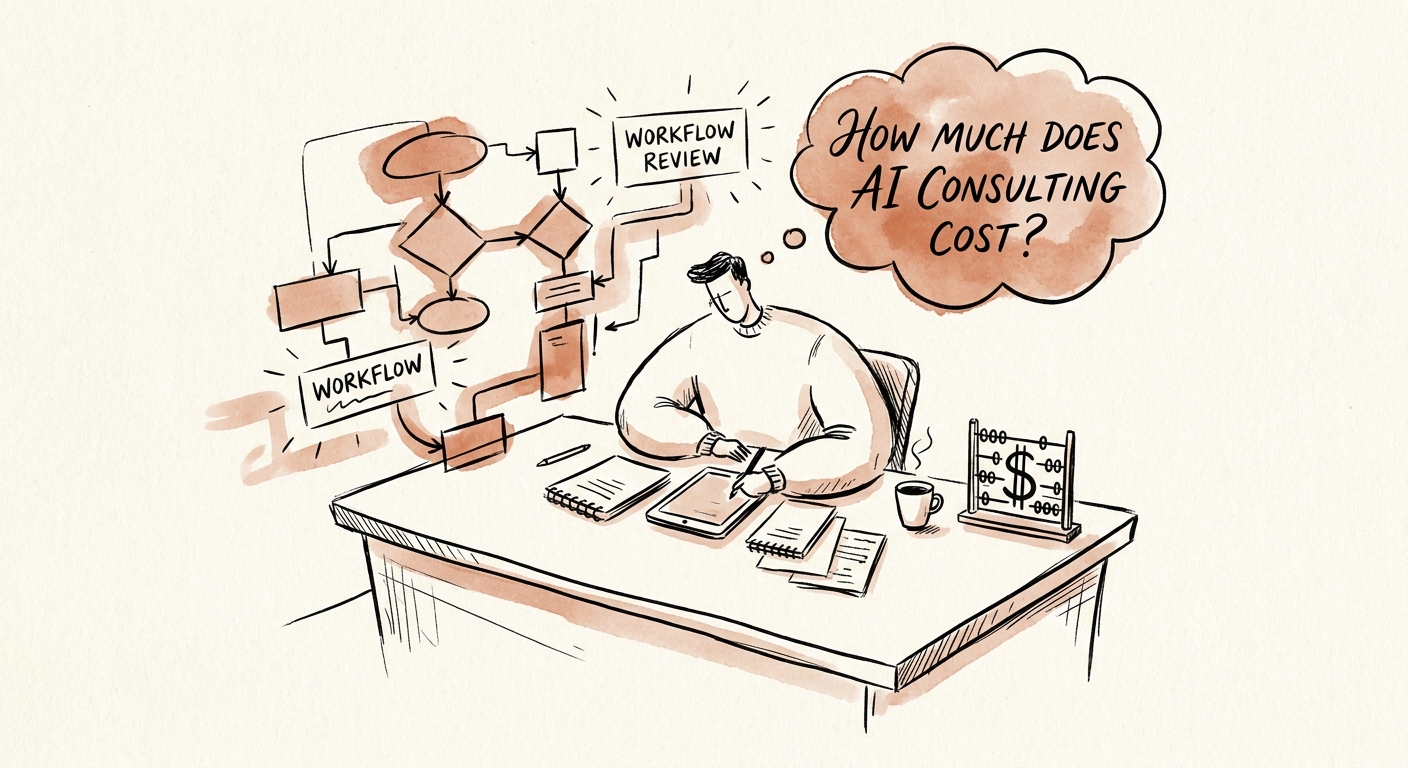
BRIEF · AI MEASUREMENT AND ROI
What AI Consulting Actually Costs a 100-Person Company (and Where the Money Leaks)
At 100 people you have real systems but no AI bench. Here's how to scope AI consulting cost around one governed workflow, data access, and adoption before buying hours.
90 days to prove governed value
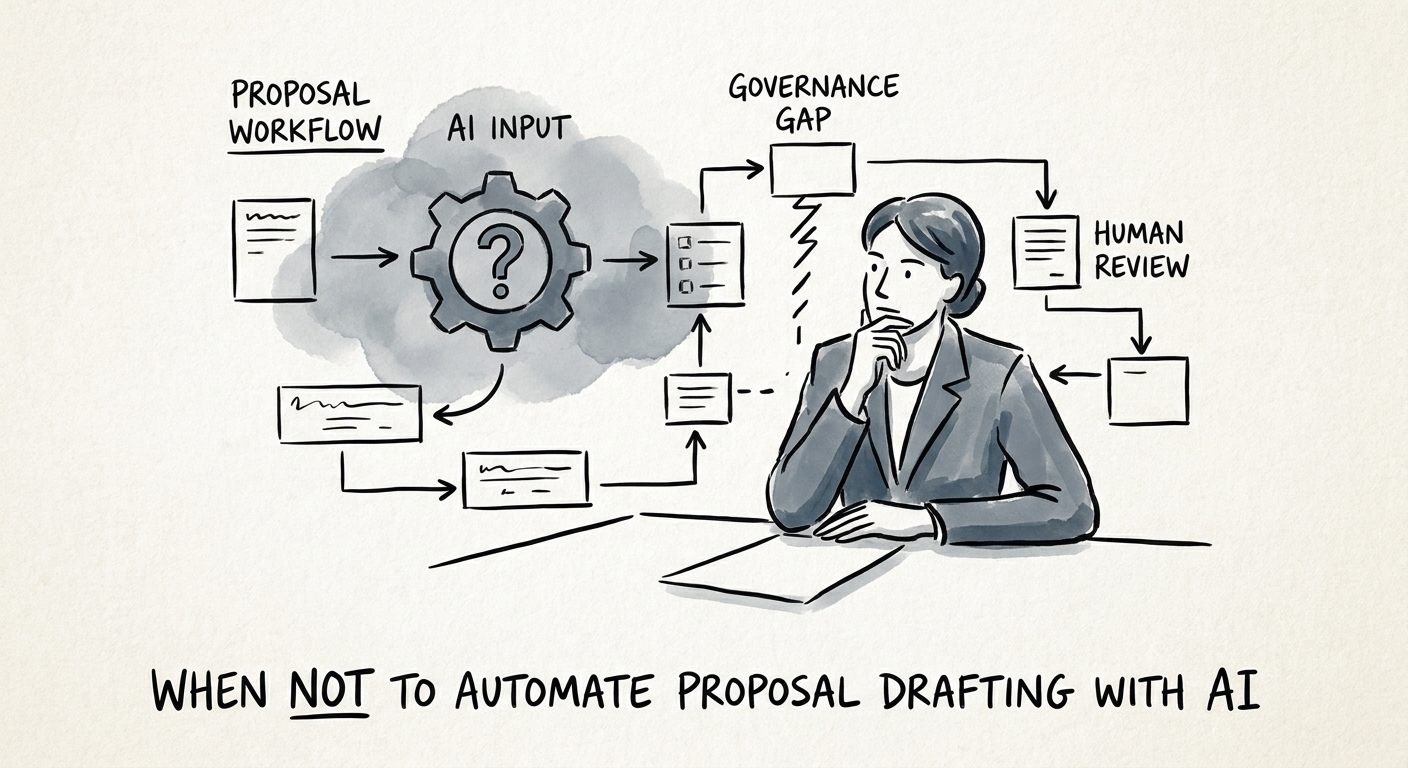
BRIEF · AI GOVERNANCE AND TRAINING
The Proposal AI Should Never Send: Where Drafting Automation Quietly Commits You
A proposal is a priced, scoped commitment — not just content. Here is exactly where to stop AI from drafting, and what to automate around it instead.
4 proposal controls before automation
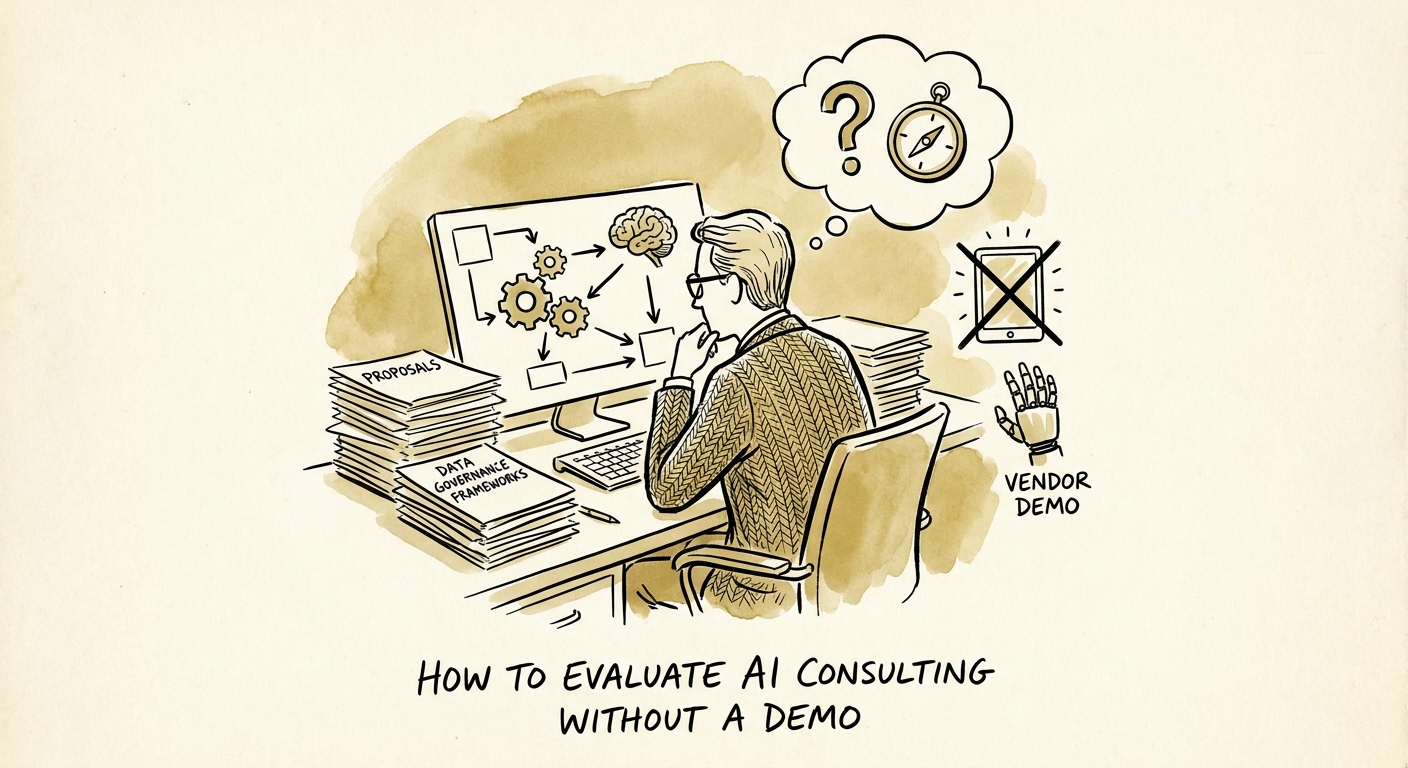
BRIEF · AI VENDOR AND BUILD-VS-BUY
How to Evaluate an AI Consultant for a Small Business When the Demo Looks Perfect
A demo proves a consultant can build something. It does not prove it works in your shop. Five questions a small-business owner should ask before signing.
5 small-business evaluation tests
BRIEF · AI INDUSTRY USE CASES
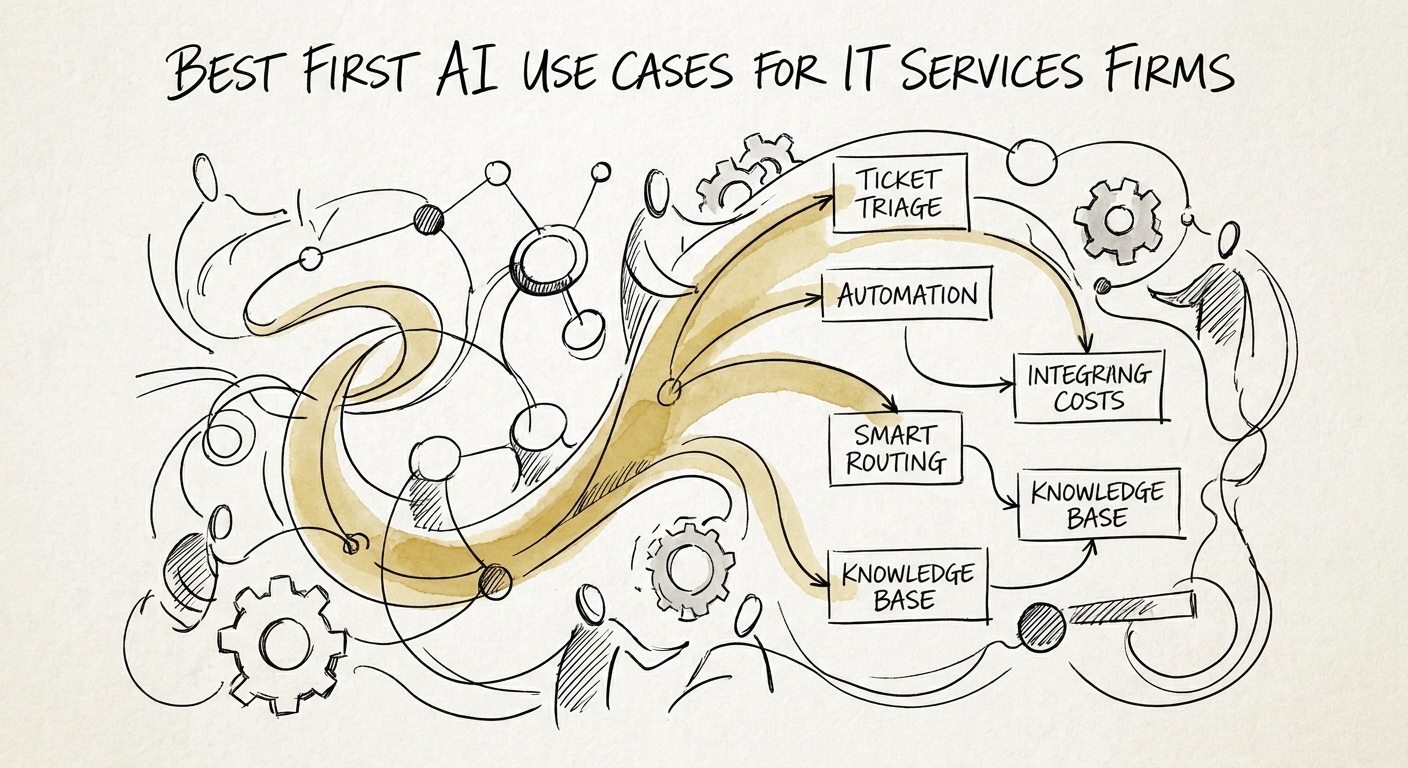
The First AI Use Case for an IT Services Firm Is Not Closing Tickets
You hold the keys to your clients' systems. Here's where an IT services firm should actually start with AI — and the use cases to avoid until you've earned them.
90 days to prove one governed IT services AI workflow
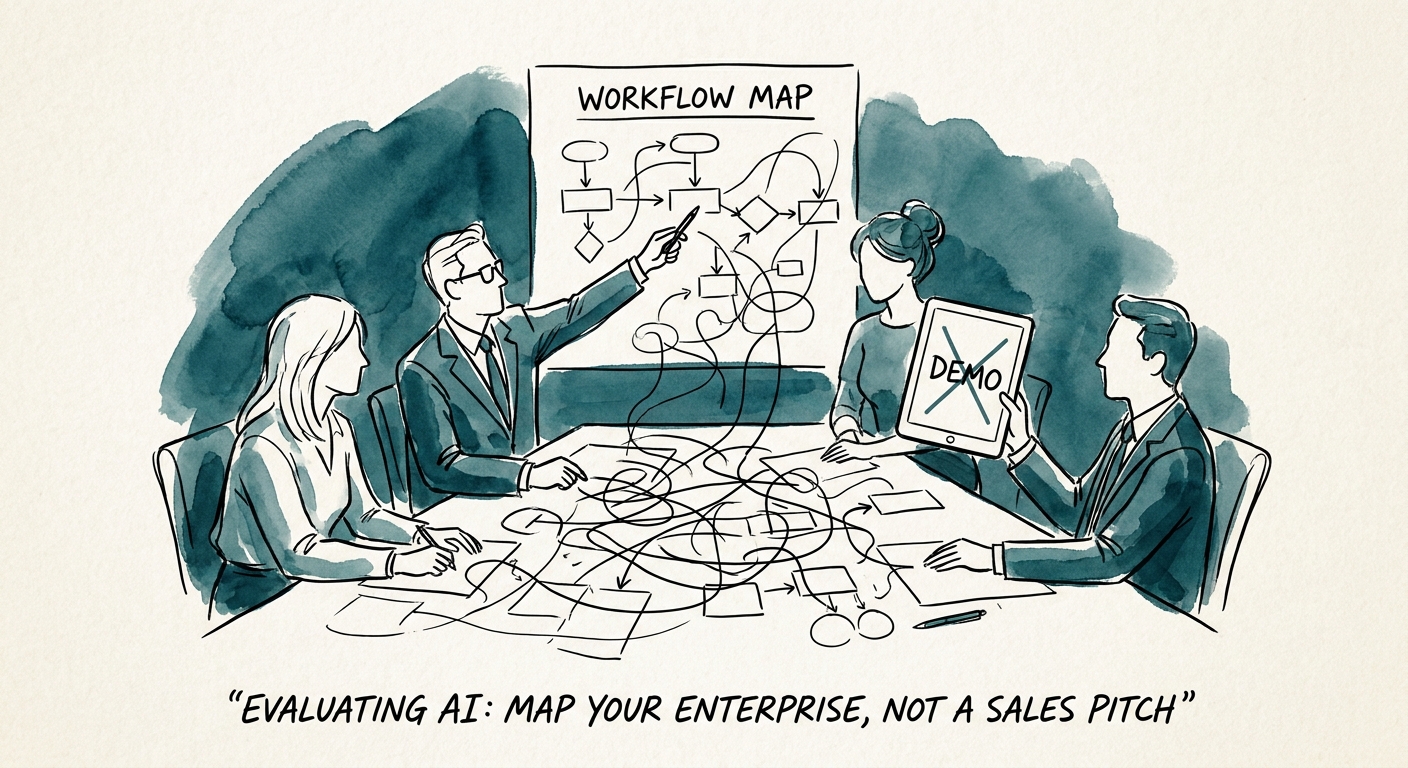
BRIEF · AI VENDOR AND BUILD-VS-BUY
How to Evaluate an AI Transformation Partner When the Demo Always Looks Perfect
A demo runs on clean data and a happy path. Here are the five questions that tell you whether an AI partner can survive your actual operation.
5 evaluation gates before buying
BRIEF · AI MEASUREMENT AND ROI
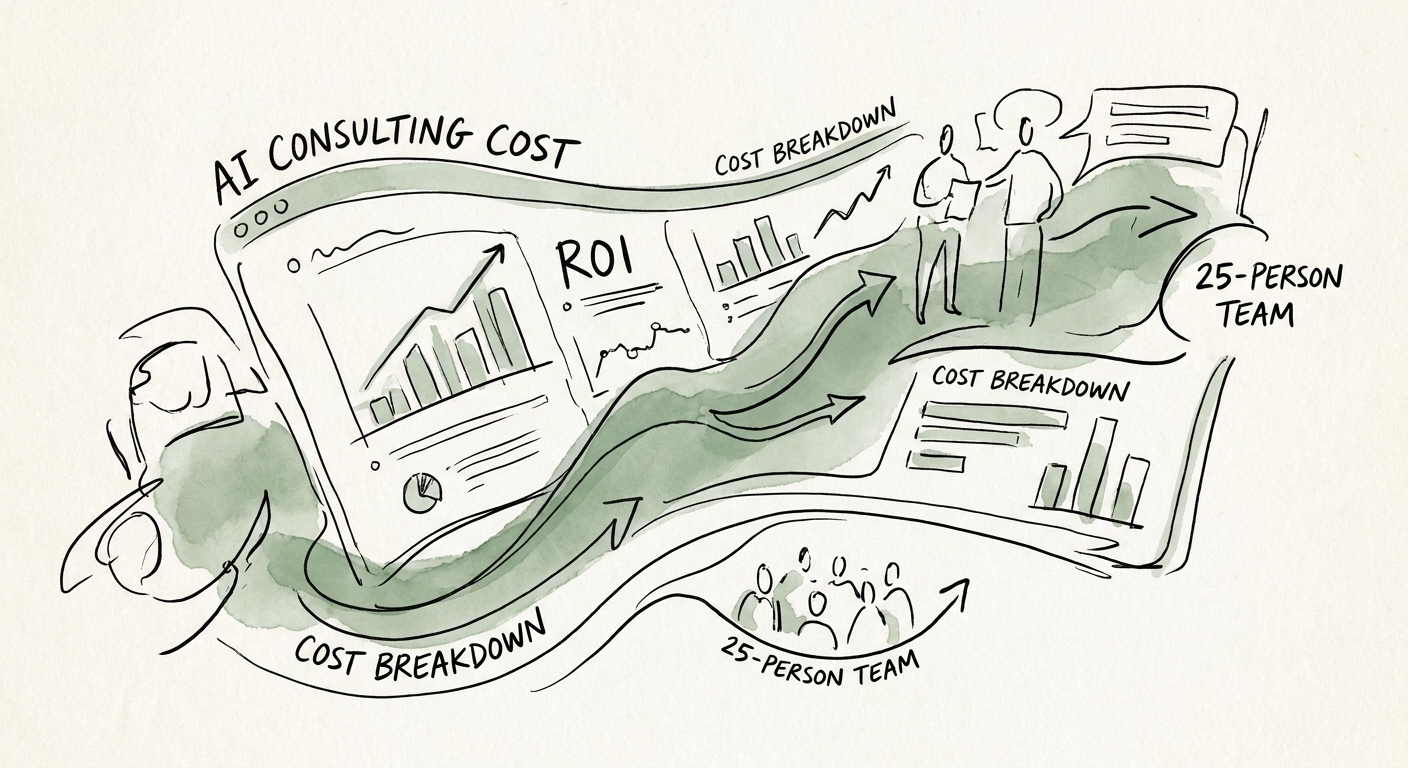
What AI Consulting Actually Costs a 25-Person Business (and the Quote That Should Make You Walk)
At 25 people there's no AI team to absorb a six-figure transformation deck. Here's how to read a consulting quote, what to fund first, and the line that should make you walk.
1 workflow best first budget unit
BRIEF · AI WORKFLOW AUTOMATION
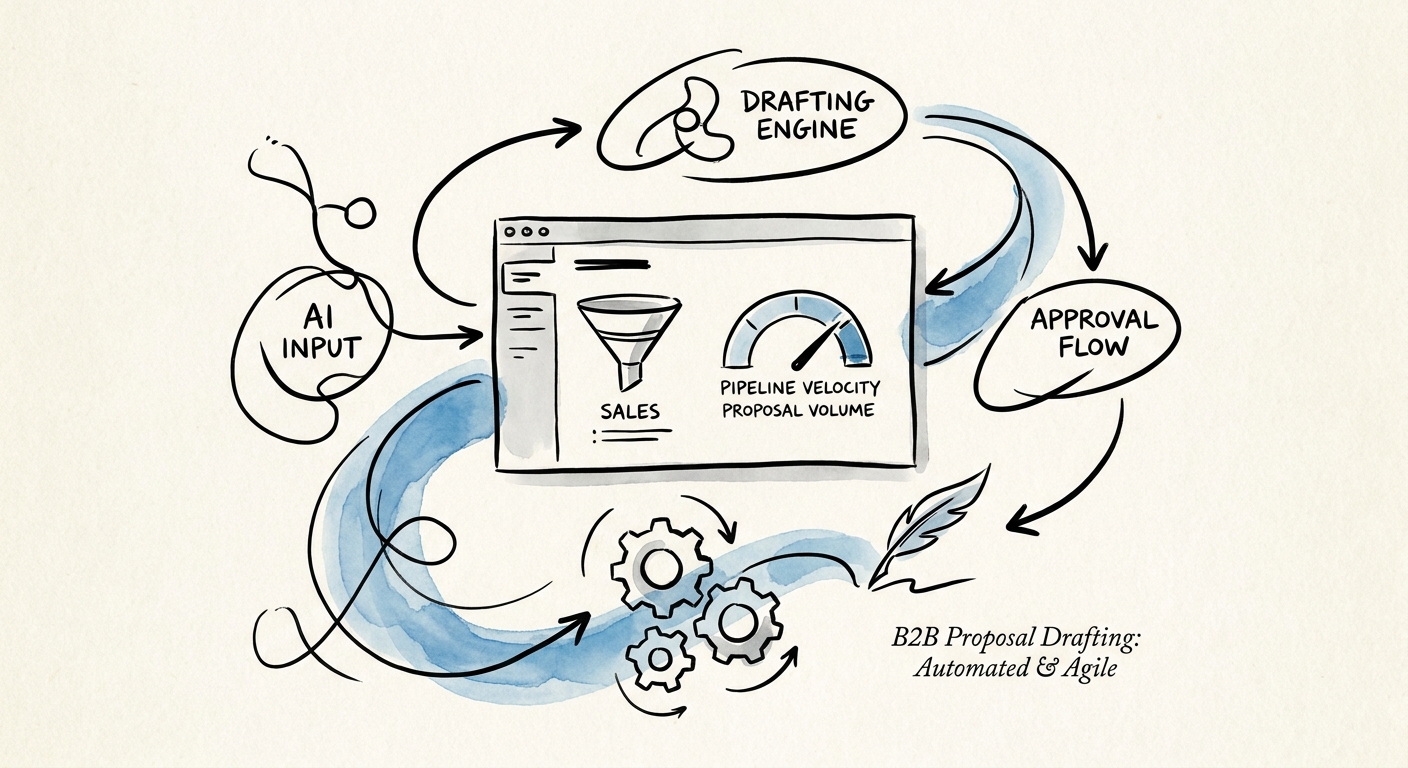
AI Proposal Drafting: Where the ROI Actually Hides (and Where It Leaks)
Faster proposals are not the win. See where AI proposal-drafting ROI in B2B tech and services actually comes from — and the scope, pricing, and margin leaks that erase it.
1 proposal pattern to govern before scaling
BRIEF · AI TRANSFORMATION STRATEGY
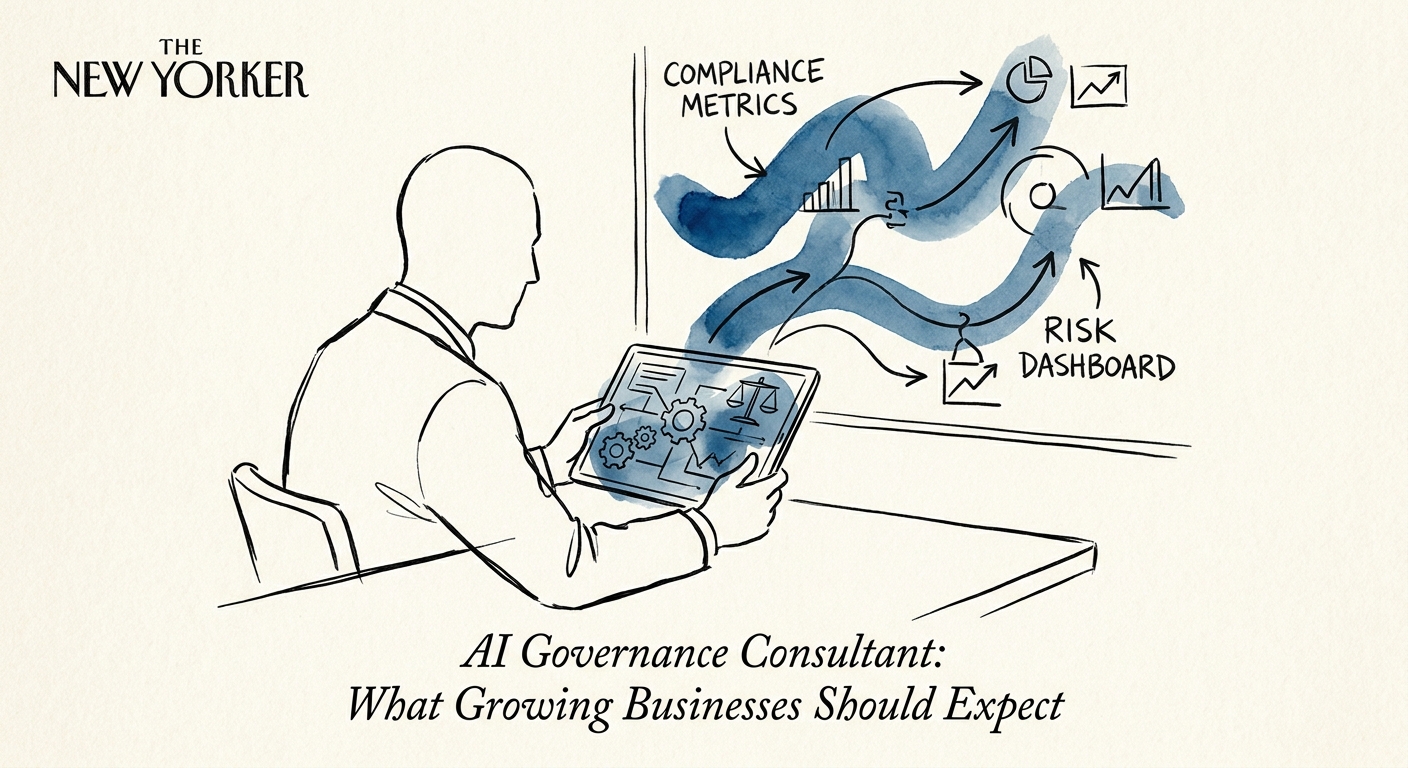
Hiring an AI Governance Consultant? Here's What You Should Get for the Money
A 60-person company doesn't need an AI ethics board. It needs rules people follow by Friday. Here's what a governance consultant should actually leave behind.
4 governance deliverables to expect
BRIEF · AI TRANSFORMATION STRATEGY
How to Tell a Real AI Workflow Consultant From a Demo Salesperson
Sitting across from an AI automation consultant? Here are the five questions that separate someone who'll redesign your workflow from someone selling a chatbot.
5 consultant deliverables to expect
BRIEF · AI GOVERNANCE AND TRAINING
When Not to Let AI Send the Collections Email (B2B SaaS Edition)
In SaaS, your most overdue account is often your renewing account. Here's exactly which collections follow-ups AI should never send without a human reading first.
3 collections situations that should stay human-led
BRIEF · AI INDUSTRY USE CASES
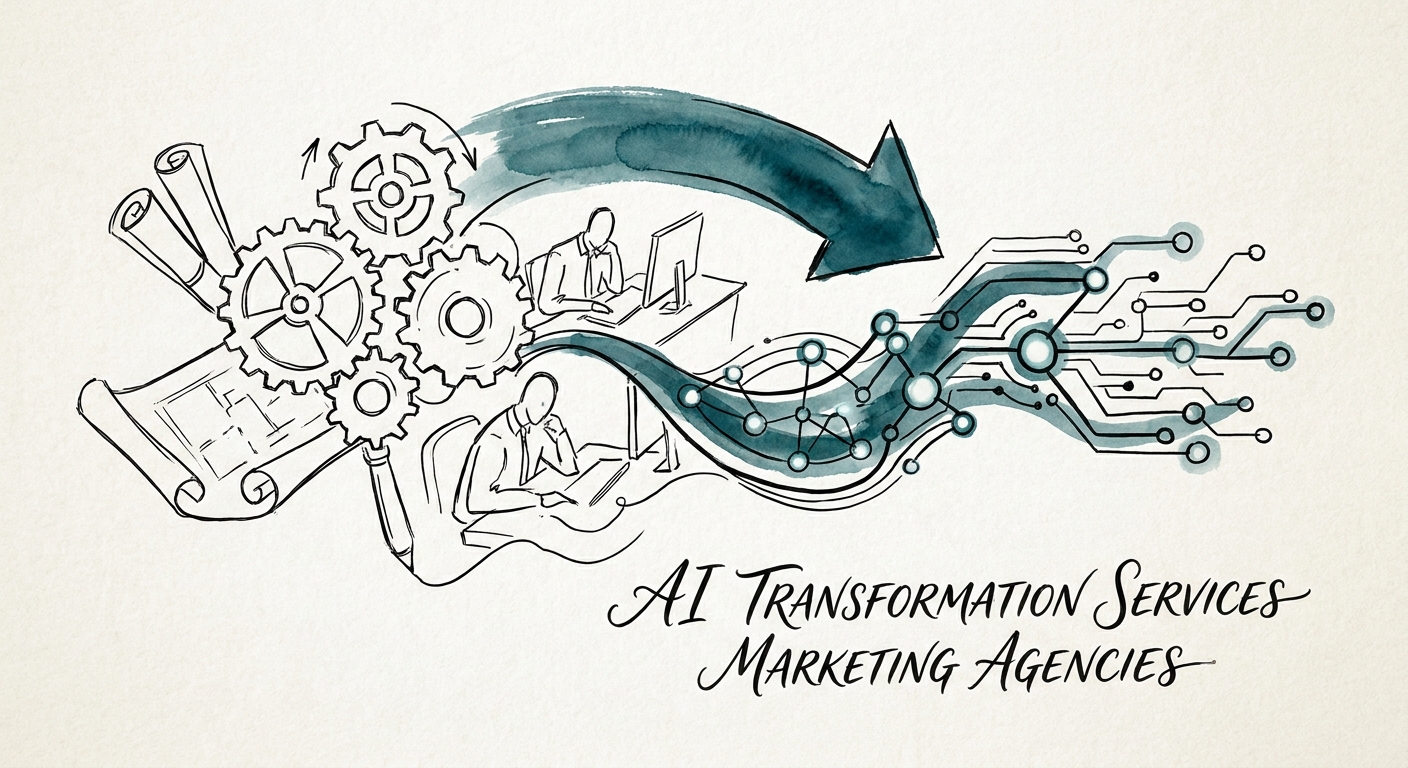
AI for Marketing Agencies: Fix the Account Operating System, Not Just the Content Pipe
Most agencies bolted AI onto content and got faster drafts, not better margins. Where AI actually moves agency economics: briefs, reporting, and the account record.
5 agency workflows to govern first
BRIEF · AI MEASUREMENT AND ROI
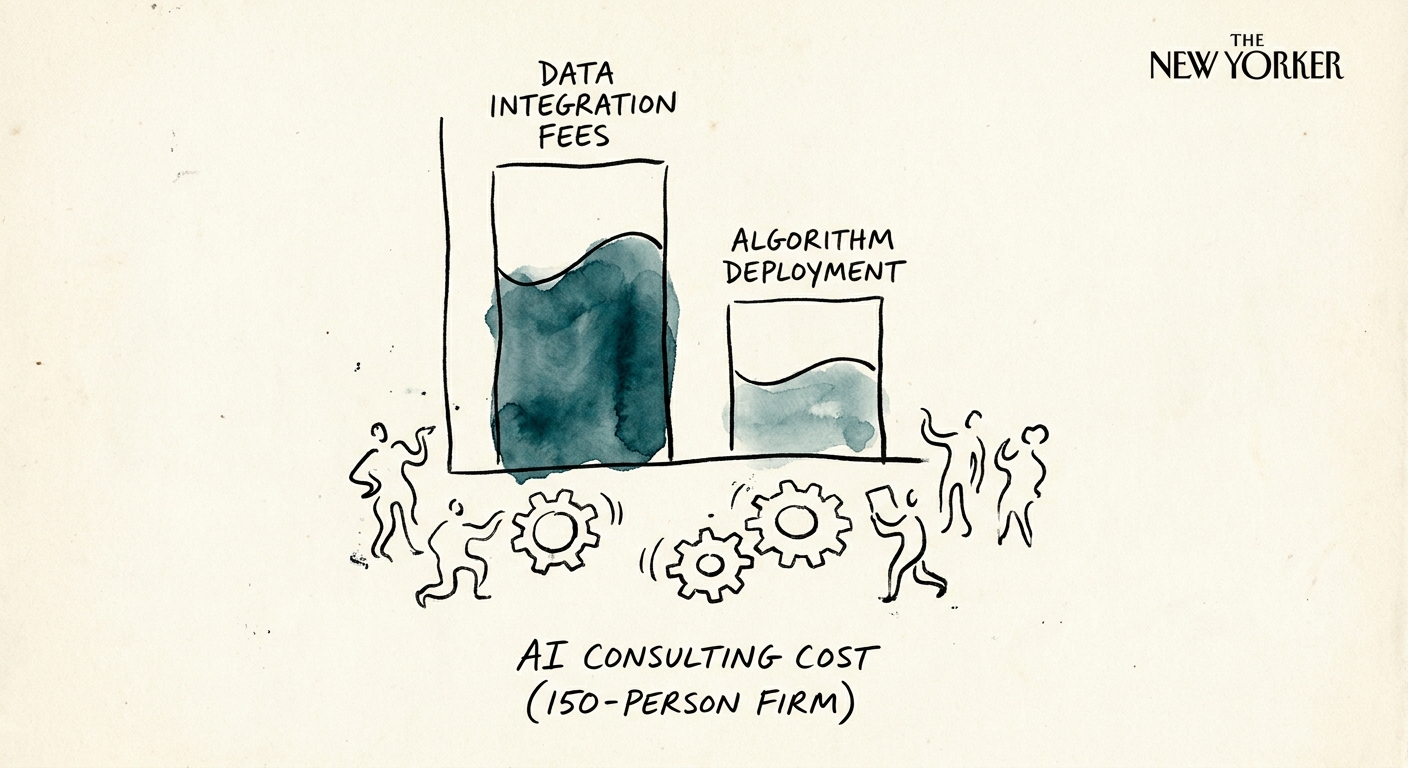
AI Consulting Cost at 150 People: What You're Actually Paying For
At 150 people you have too many systems for a corner pilot and no transformation office. Here is how to read an AI consulting quote and what each line should buy.
2 tracks data readiness and workflow proof
BRIEF · AI VENDOR AND BUILD-VS-BUY
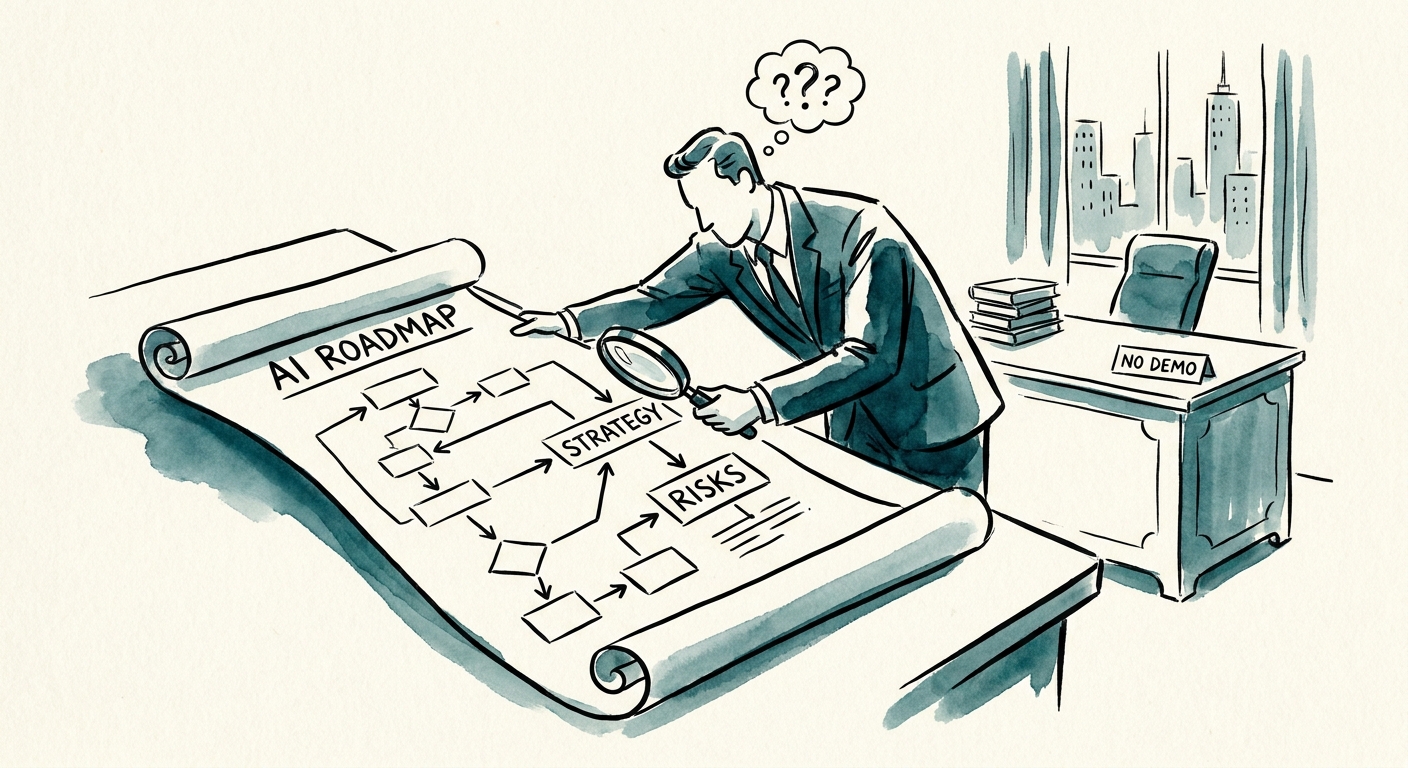
The Demo Is the Easy Part: How to Vet an AI Consultant Before You Sign
Any AI consultant can wow you in a sandbox. Here are the seven artifacts to demand instead of a demo, and the questions that separate operators from screen-sharers.
5 proof points to require before hiring an AI implementation consultant
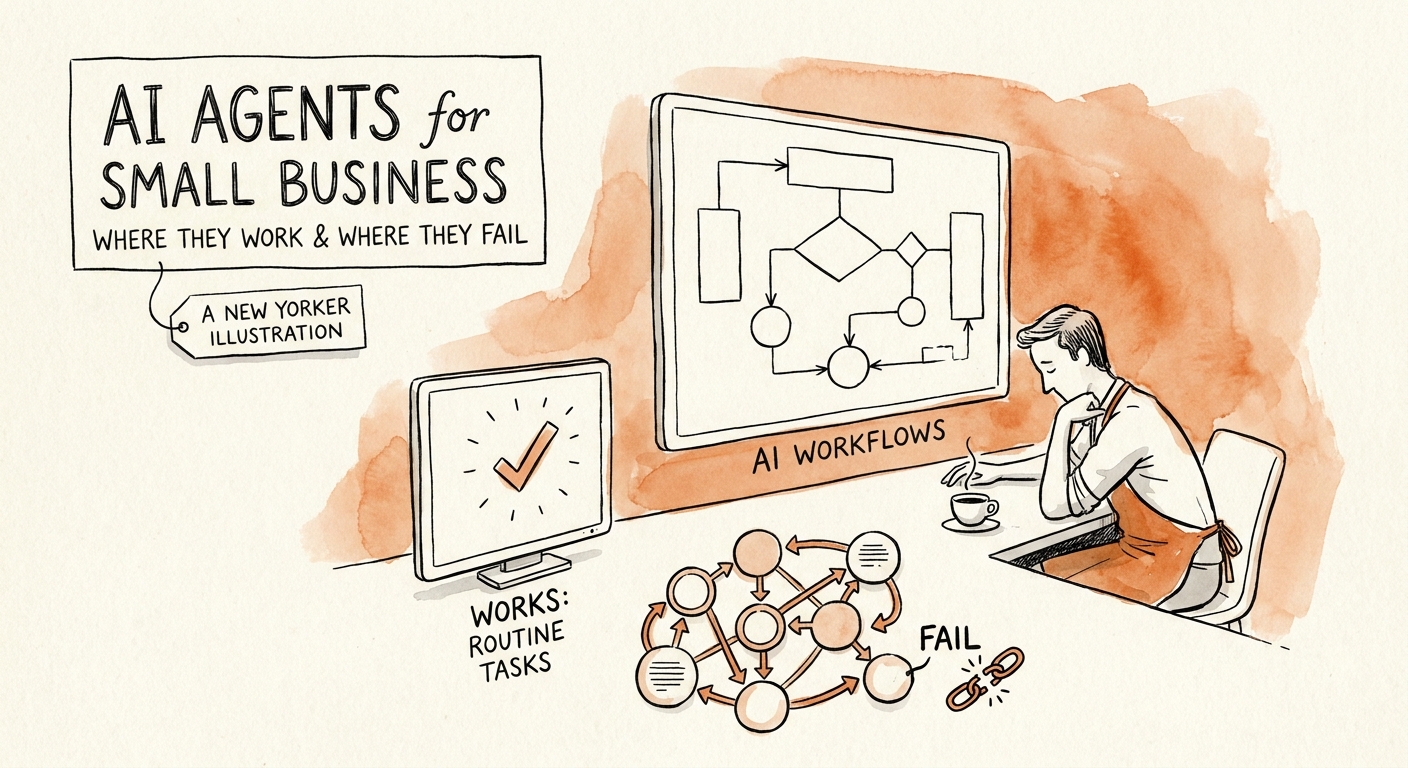
BRIEF · AI AGENTS AND COPILOTS
AI Agents for Small Business: The Demo Works. The Tuesday Queue Breaks It.
Why AI agents that nail the demo fail on a real work queue, the five-question scope test before you spend, and the production checklist that decides it.
40% agentic AI projects Gartner expects may be canceled by end of 2027
BRIEF · AI MEASUREMENT AND ROI
What AI Consulting Actually Costs a Small Business (and What You're Really Paying For)
A small-business owner's guide to AI consulting cost: what a $4.5K audit buys, when a five-figure sprint is worth it, and the five questions that expose padded scope.
$4.5K starting point for a focused AI audit
BRIEF · AI TRANSFORMATION STRATEGY
What a Small Business Should Automate With AI First (and What to Leave for Later)
Most small businesses pick their first AI project backwards. Here's how to find the one workflow worth automating now, scored across sales, support, ops, and finance.
5 questions before the first AI build
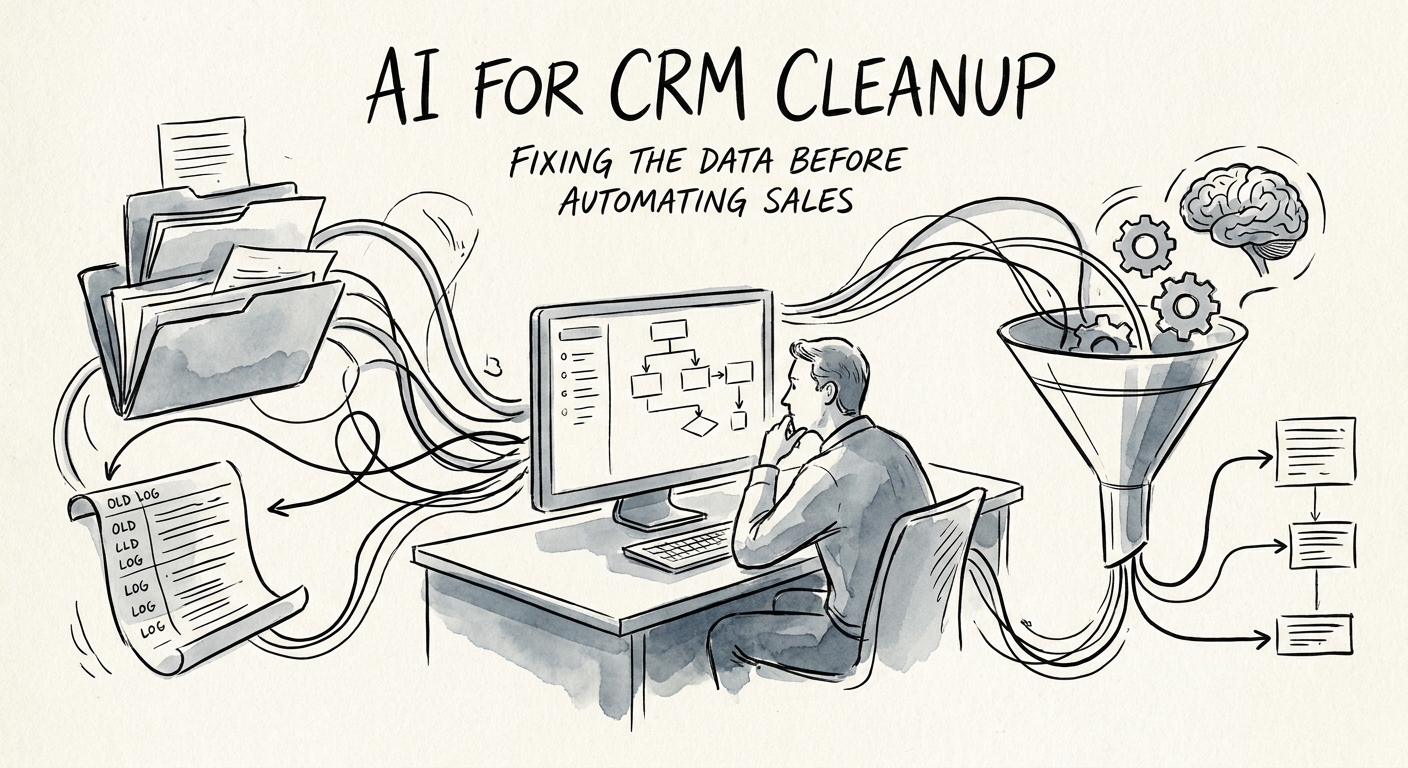
BRIEF · AI FUNCTION USE CASES
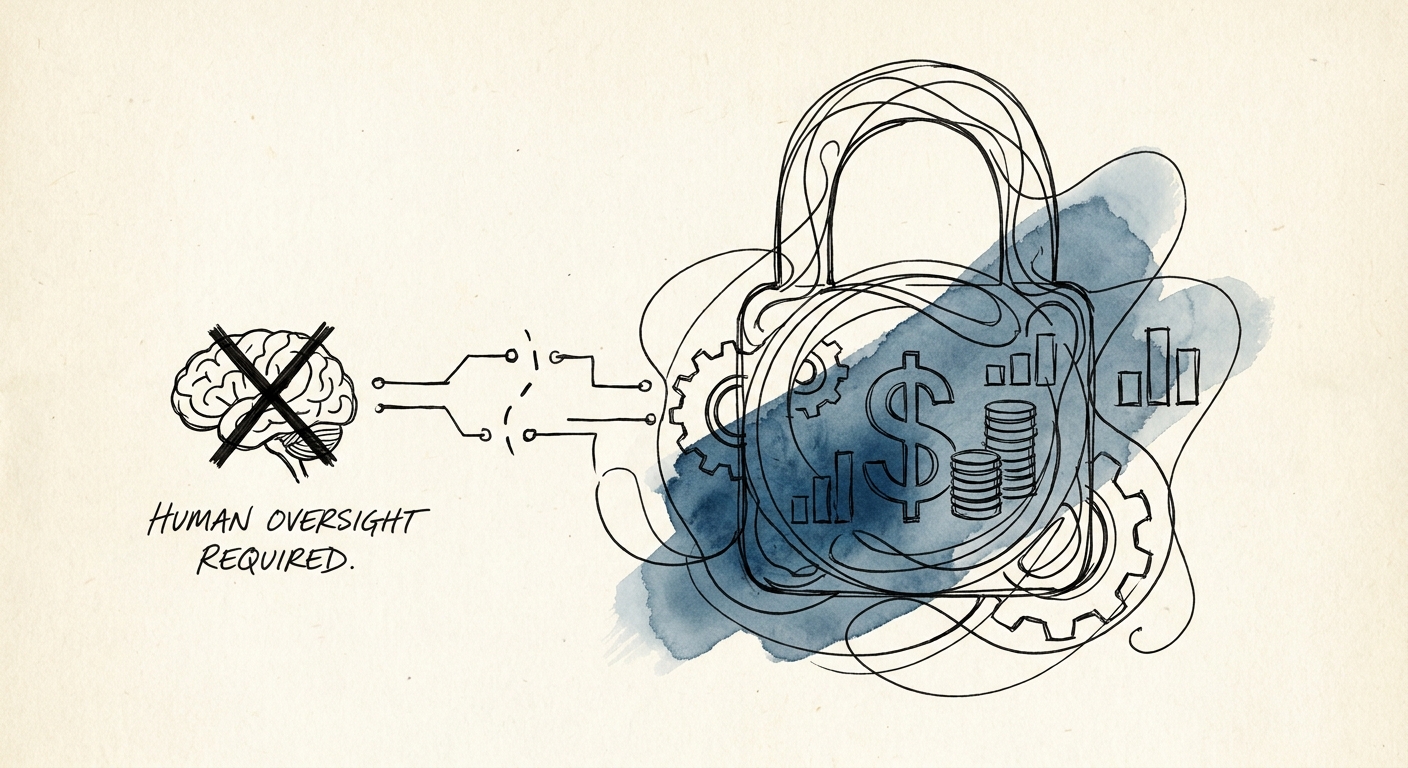
AI Won't Fix Your CRM. It'll Industrialize the Mess.
Point AI at a dirty CRM and you scale the dirt. Here's how to clean duplicates, stale stages, and missing next steps so your forecast becomes trustworthy.
92% forecast accuracy infrastructure proof point