BRIEF · AI MEASUREMENT AND ROI
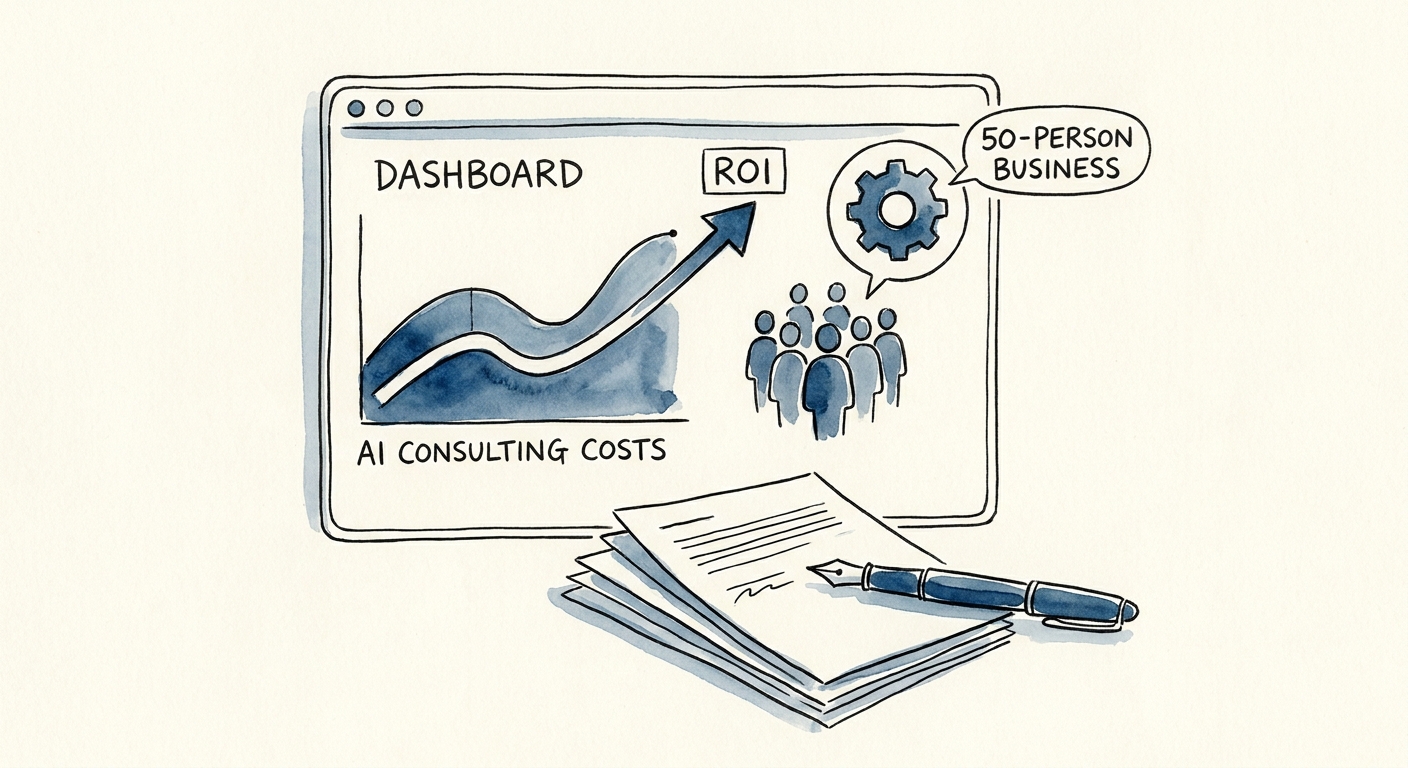
What AI Consulting Actually Costs a 50-Person Company (And What You're Really Buying)
A 50-person company is too big for free-tool pilots, too small for a transformation office. Here's how to scope AI consulting cost so spend ties to measurable work.
3 gates cost scope before build
BRIEF · AI TRANSFORMATION STRATEGY
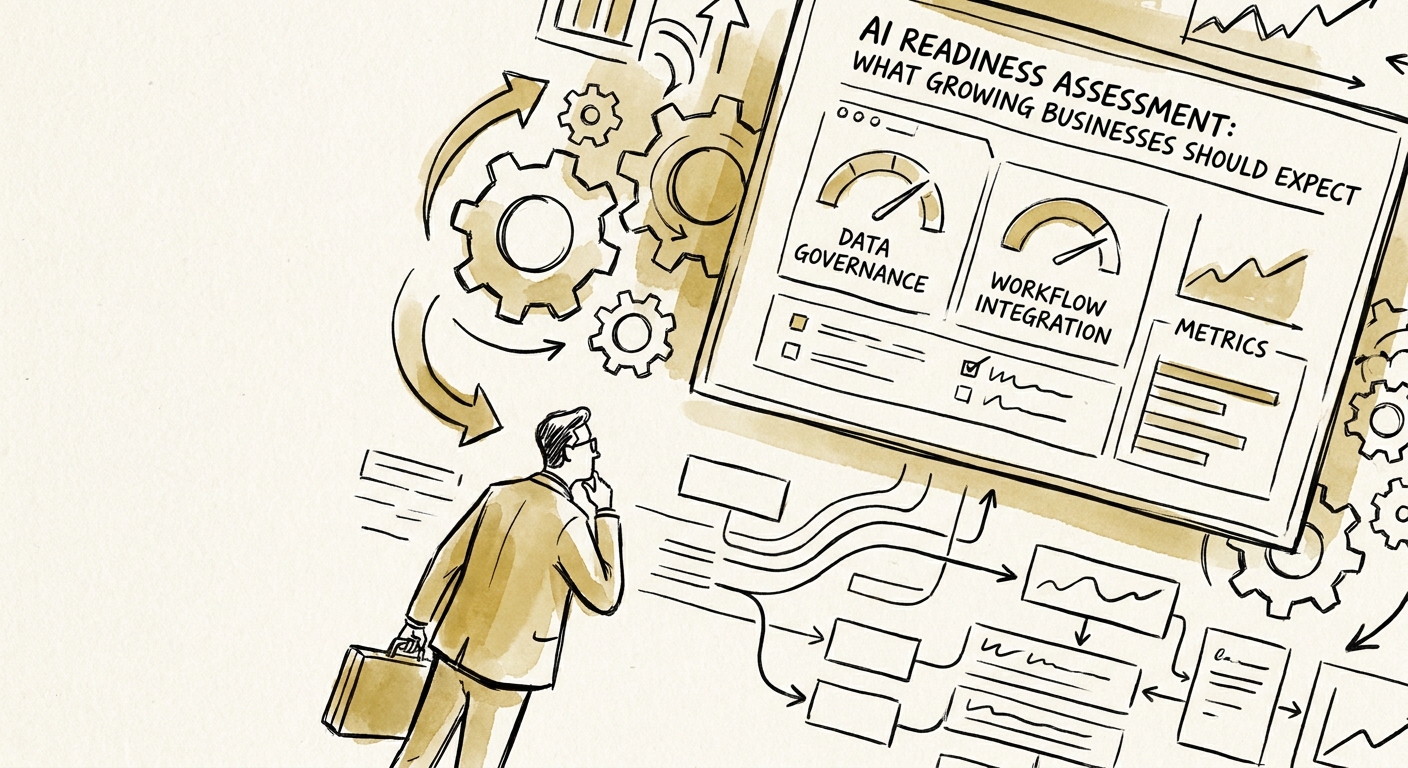
What an AI Readiness Assessment Actually Tells You (Before You Spend a Dime)
A real AI readiness assessment ranks one workflow to automate first, names what to clean, and says what to keep human-reviewed. Here's what to expect.
5 readiness checks before the first AI workflow
BRIEF · AI VENDOR AND BUILD-VS-BUY
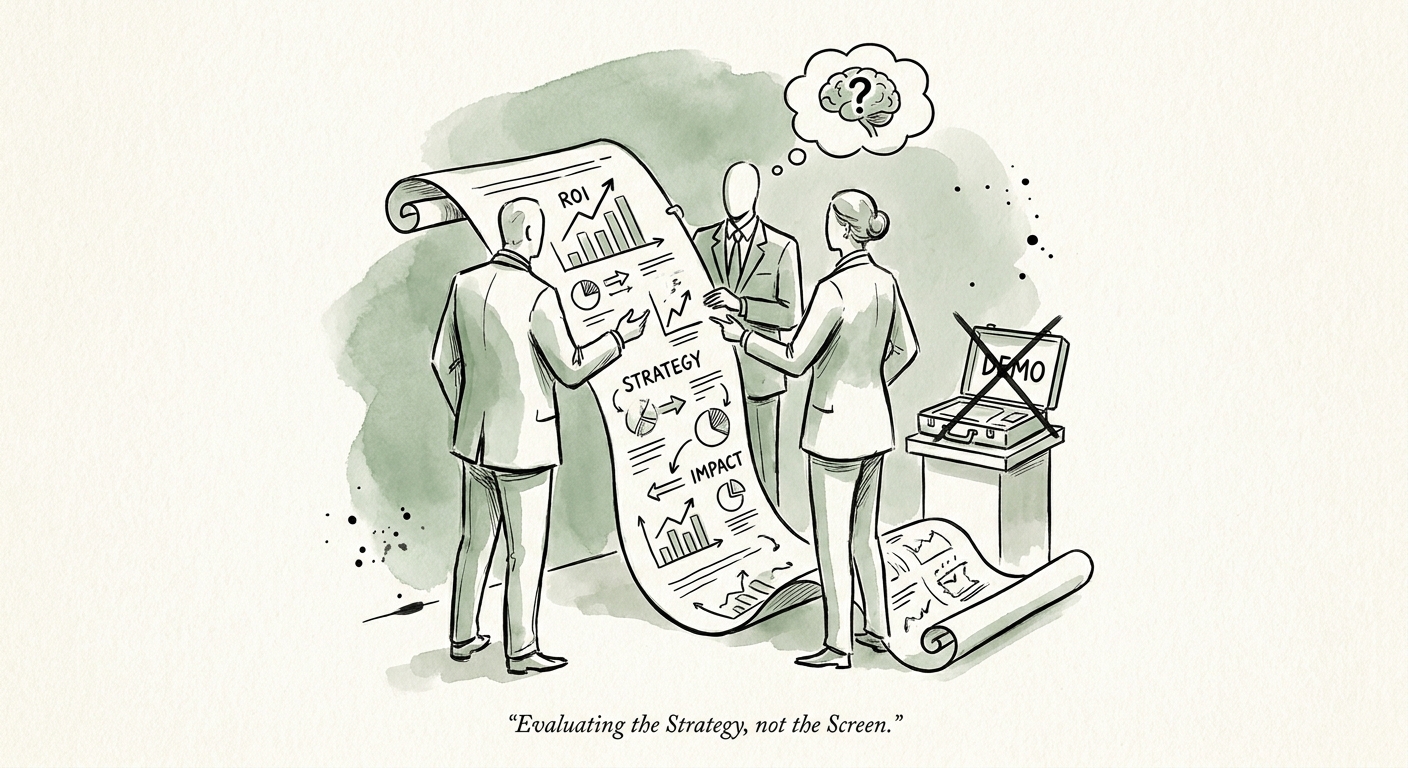
Hiring a Fractional Chief AI Officer? Ignore the Demo, Run These Four Tests
A demo proves a fractional Chief AI Officer can talk. Four authority tests prove they can run your AI portfolio. Here's how to interview for the difference.
4 roles authority checks before hire
BRIEF · AI GOVERNANCE AND TRAINING
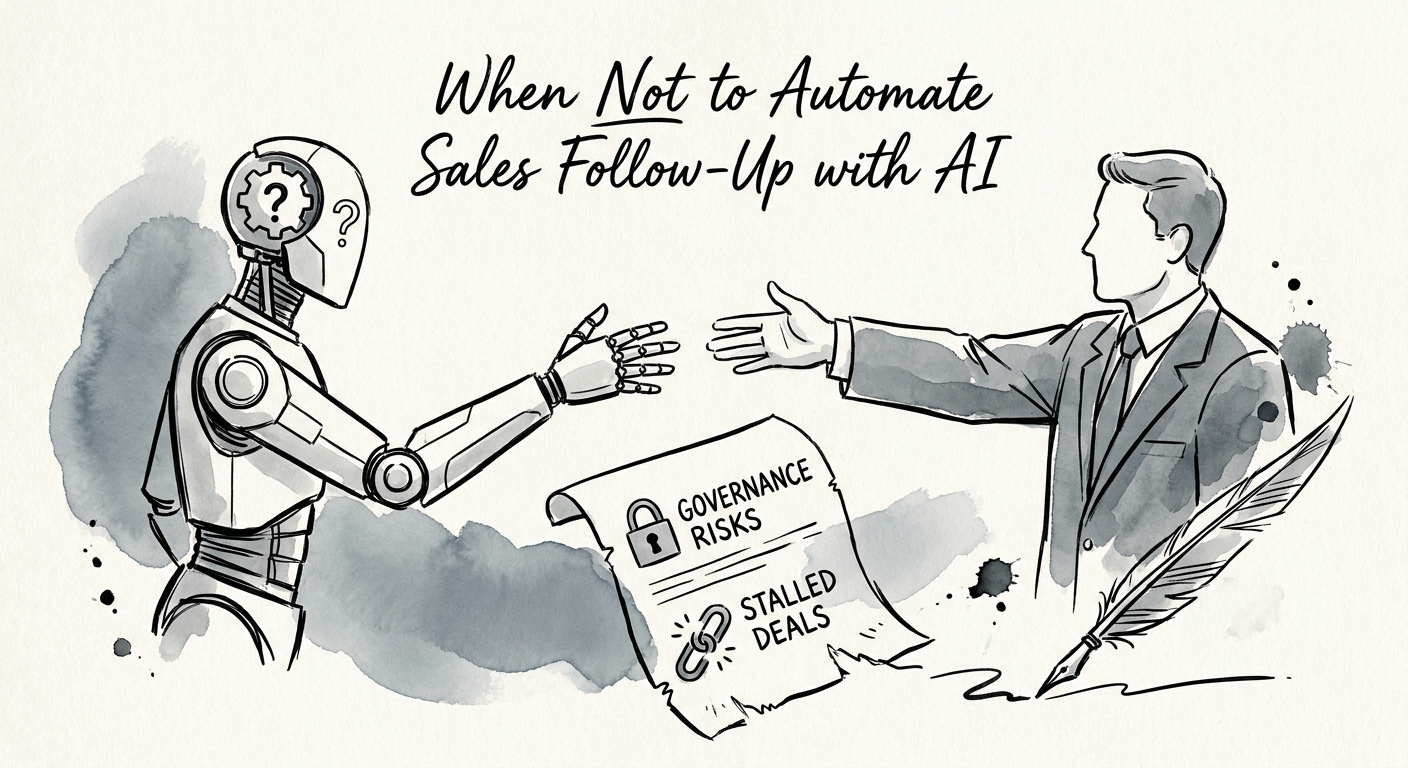
When Not to Automate Sales Follow-Up With AI (3 Moments to Keep Human)
An AI sequence answered a buyer's security question wrong and lost a deal. The 3 B2B follow-up moments you should never automate, and the governance gate that stops it.
3 sales follow-up moments that need human approval
BRIEF · AI WORKFLOW AUTOMATION
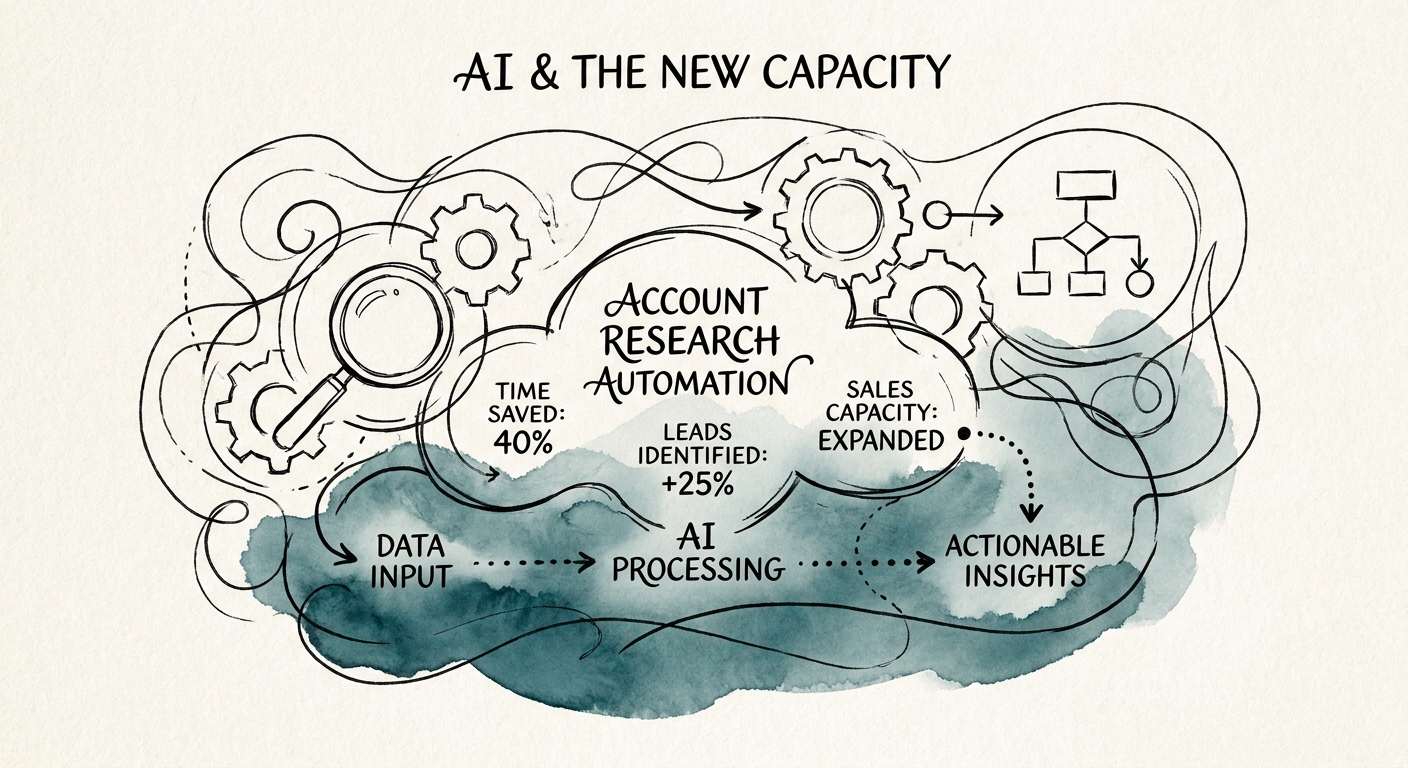
AI Account Research: Turn 40 Minutes of Pre-Call Scrambling Into a 3-Minute Review
A rep opens nine tabs before a call and still walks in cold. Here's how to build a governed AI account-research briefing that lives in your CRM and earns rep trust.
4 signals to measure in AI account-research workflows
BRIEF · AI VENDOR AND BUILD-VS-BUY
A Demo Proves Nothing: How to Vet an AI Automation Consultant by What They Refuse to Build
Anyone can rig a slick AI demo in an afternoon. Here are the five artifacts and the one question that tell you whether a consultant can ship a workflow that survives Tuesday.
1 workflow to define before buying a demo
BRIEF · AI INDUSTRY USE CASES
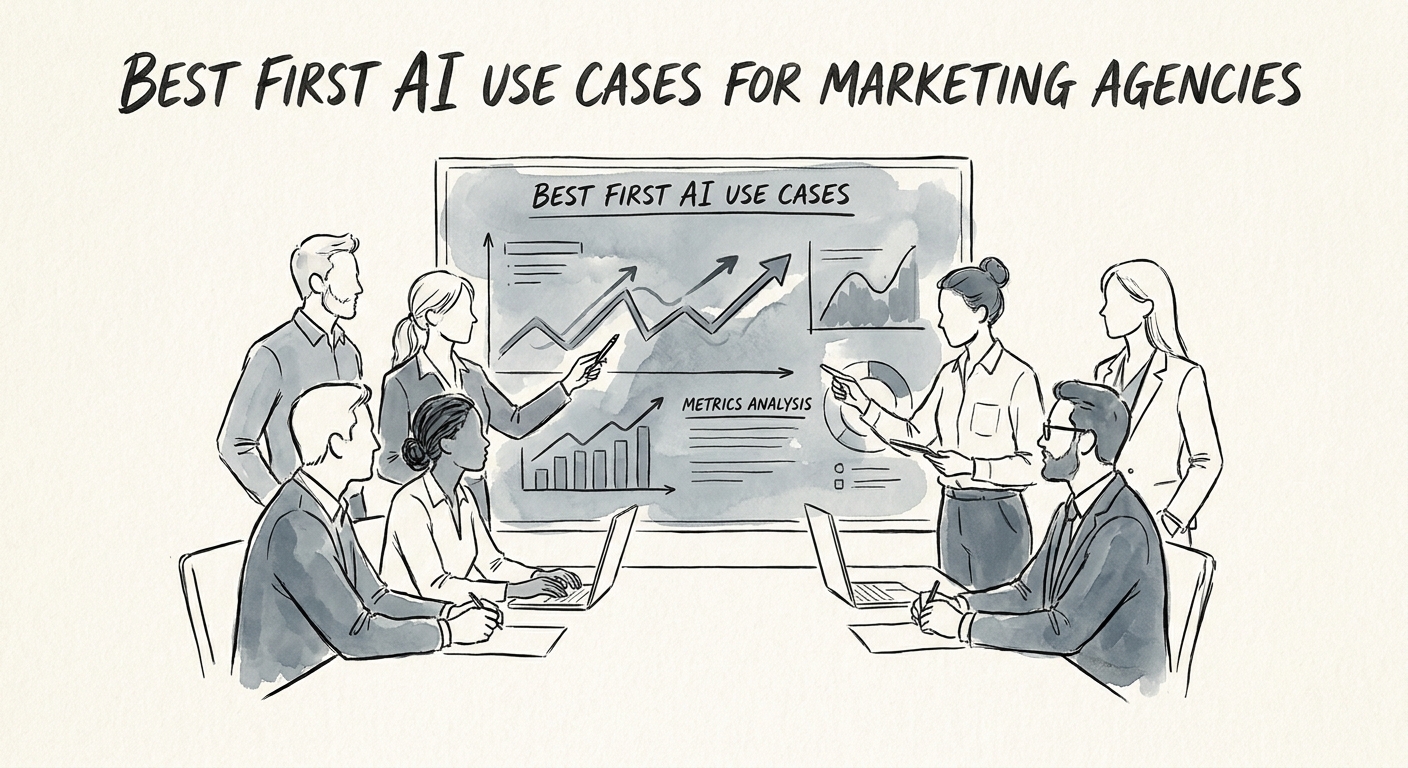
The First AI Use Cases That Actually Work in a Marketing Agency
Where agencies should aim AI first: brief intake, reporting, account research, creative QA, and follow-up. Why client-facing copy is the wrong starting point.
5 agency workflows to evaluate first
BRIEF · AI MEASUREMENT AND ROI
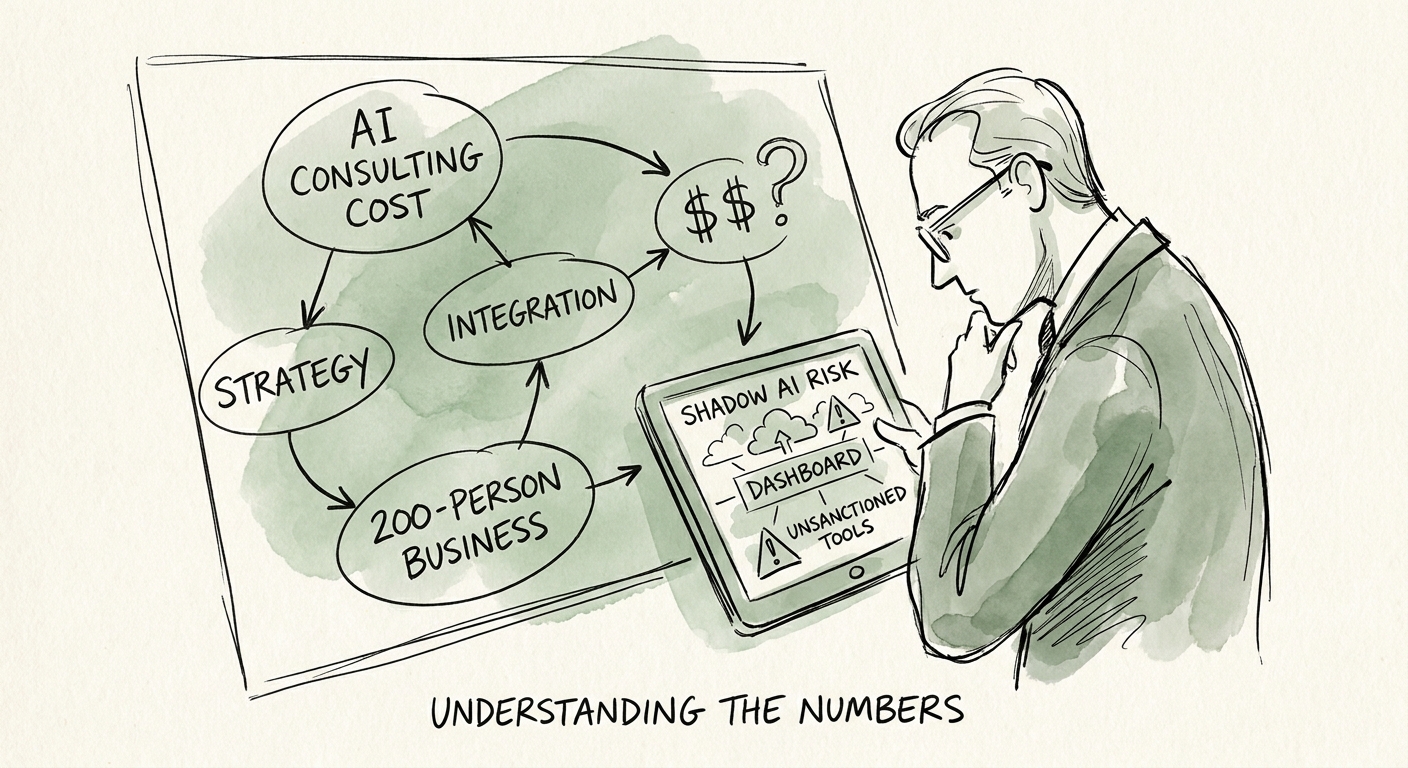
What AI Consulting Actually Costs a 200-Person Business (and Where the Bill Hides)
At 200 people, AI consulting cost isn't driven by the build — it's driven by permission sprawl and adoption. Here's how to scope it so finance can inspect every dollar.
4 owners business, data, risk, and adoption
BRIEF · AI TRANSFORMATION STRATEGY
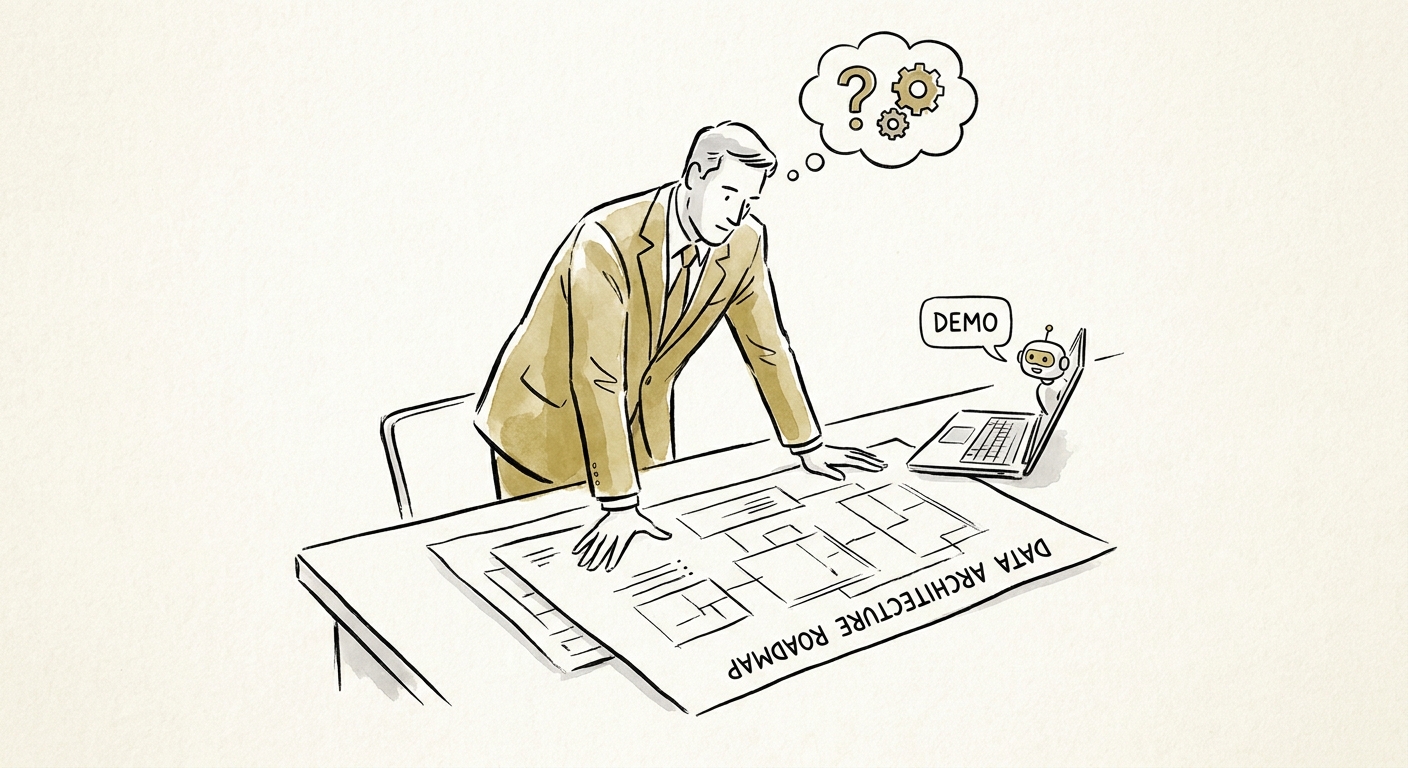
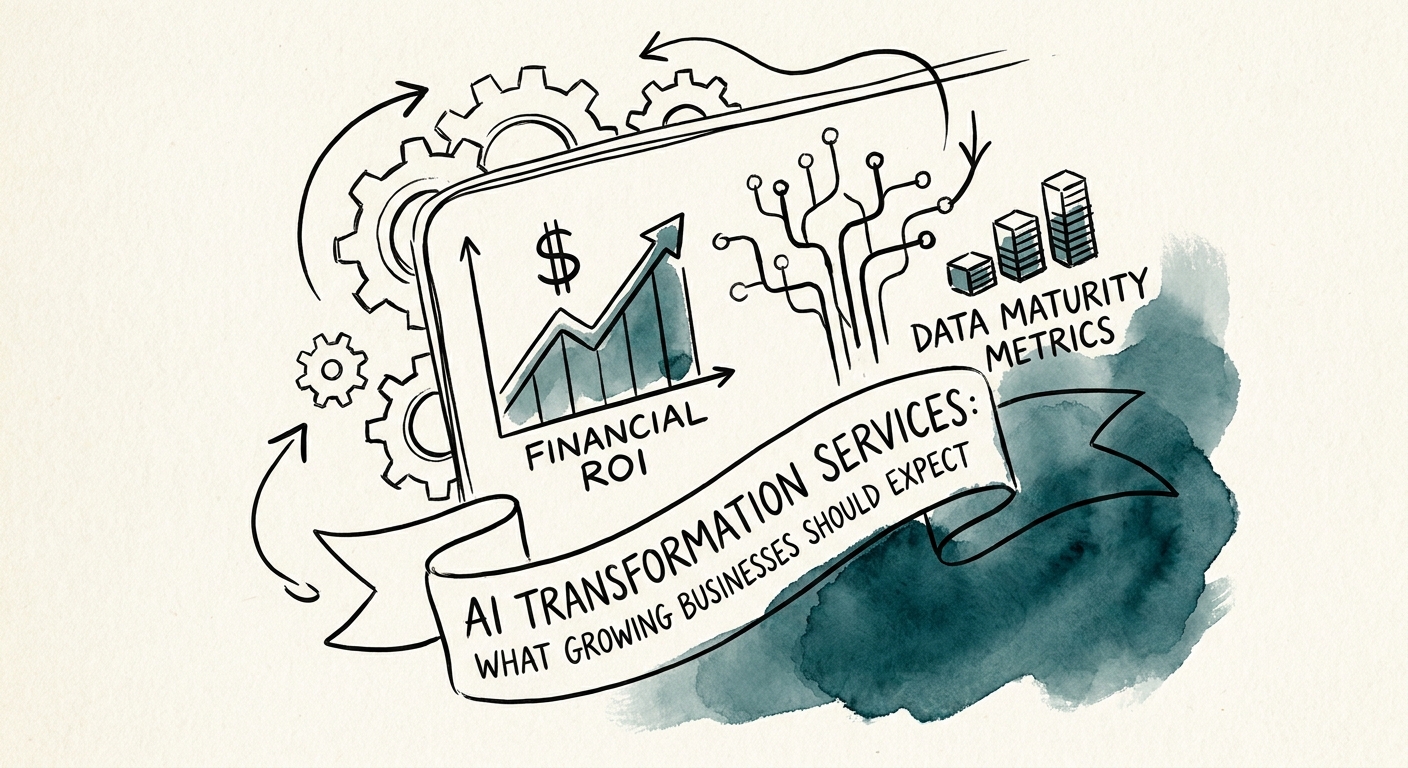
How to Read an AI Transformation Proposal Before You Sign It
A growing business owner's checklist for judging an AI transformation proposal: what a real scope names, what a demo hides, and how to price the work.
1 governed workflow to prove before scaling
BRIEF · AI WORKFLOW AUTOMATION
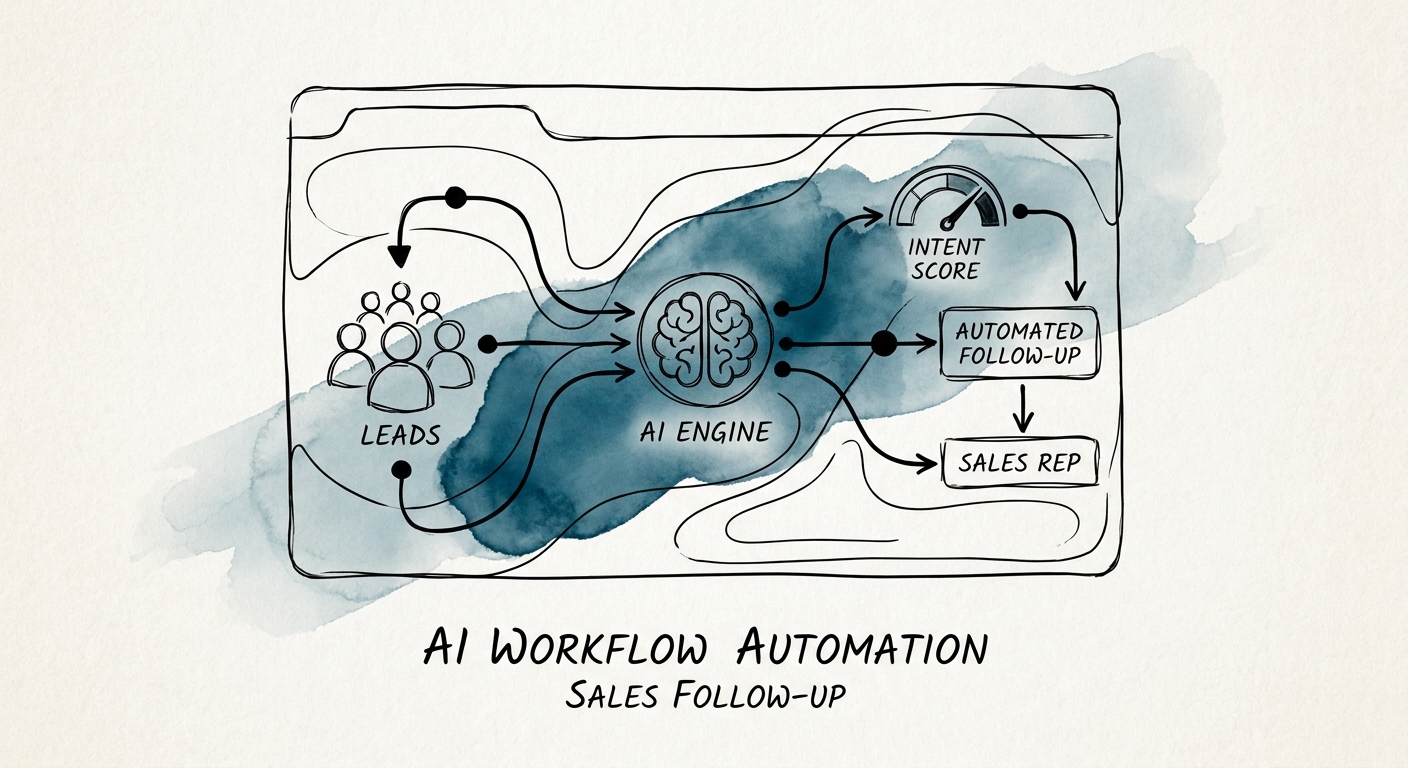
AI Sales Follow-Up: Win the First Five Minutes Without Spamming the Buyer
A demo request goes cold in minutes. Here is how to automate B2B sales follow-up so it routes, drafts, and replies fast without sounding like a bot.
5 workflow controls before scale
BRIEF · AI WORKFLOW AUTOMATION
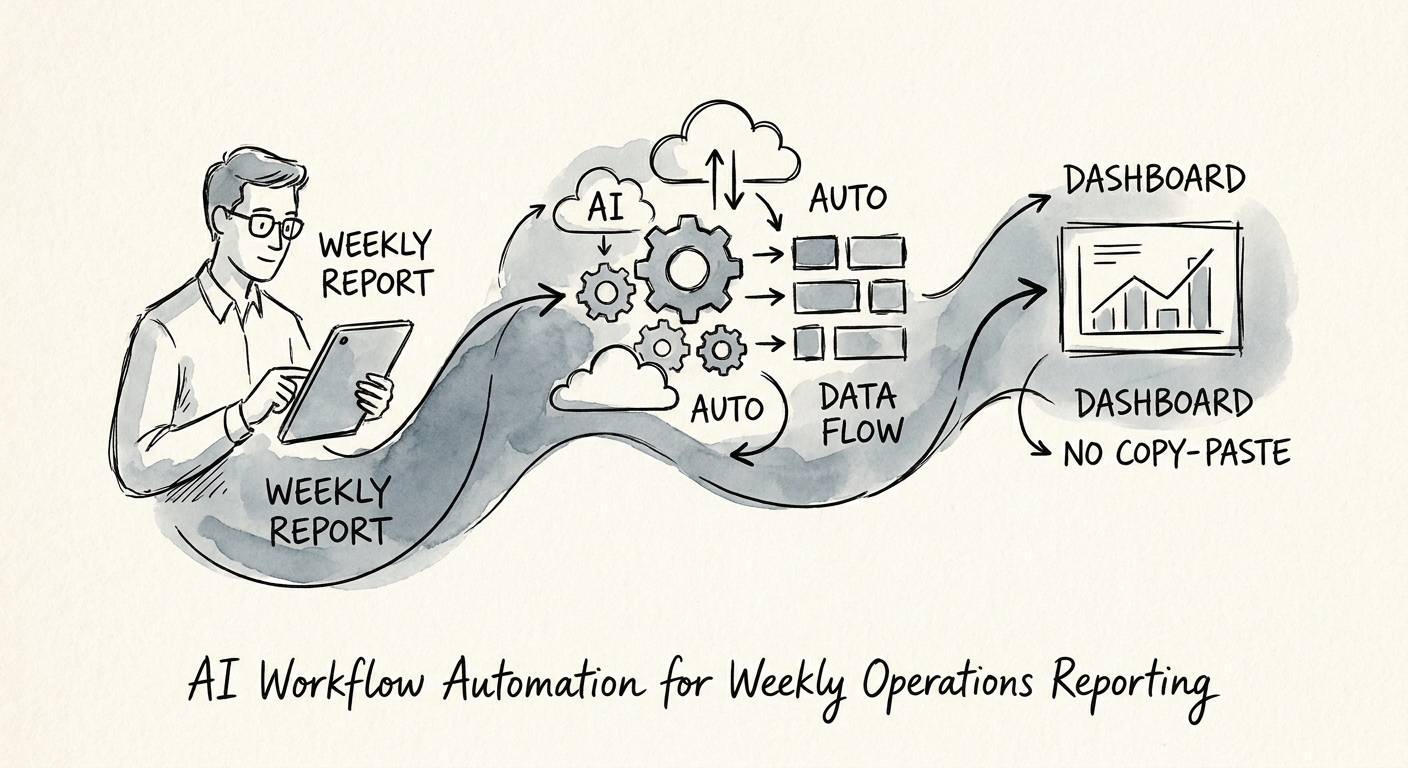
The Monday Reporting Scramble: Automating the Weekly Ops Packet Without Faking the Numbers
The weekly ops packet eats Thursday and Friday. Here's how to automate the data pulls and narrative draft while keeping metric definitions and owner sign-off intact.
1 recurring reporting cadence to automate first
BRIEF · AI INDUSTRY USE CASES
AI for Consulting Firms: Protect Realization, Don't Just Chase Speed
Where AI actually moves the numbers in a consulting firm: realization, proposal turnaround, write-offs, and the client-data boundary you set before any build.
90 days for the first governed AI workflow to reach operating cadence
BRIEF · AI VENDOR AND BUILD-VS-BUY
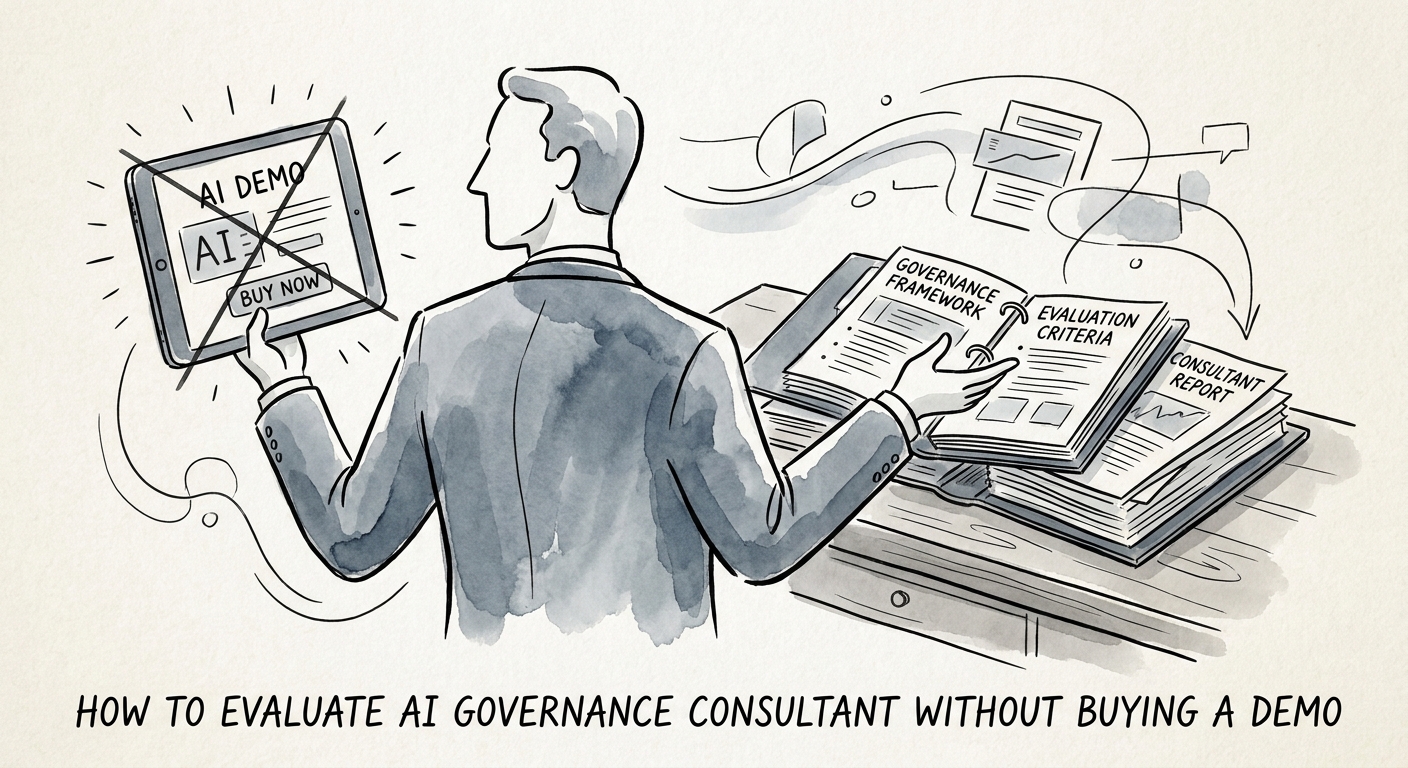
You Can't Demo Governance: How to Vet an AI Governance Consultant on Decisions, Not Slides
Governance has no demo screen. Vet an AI governance consultant on the risk tiers, data-access rules, and review routines they'll leave behind for your team.
4 evaluation areas for governance consultants
BRIEF · AI GOVERNANCE AND TRAINING
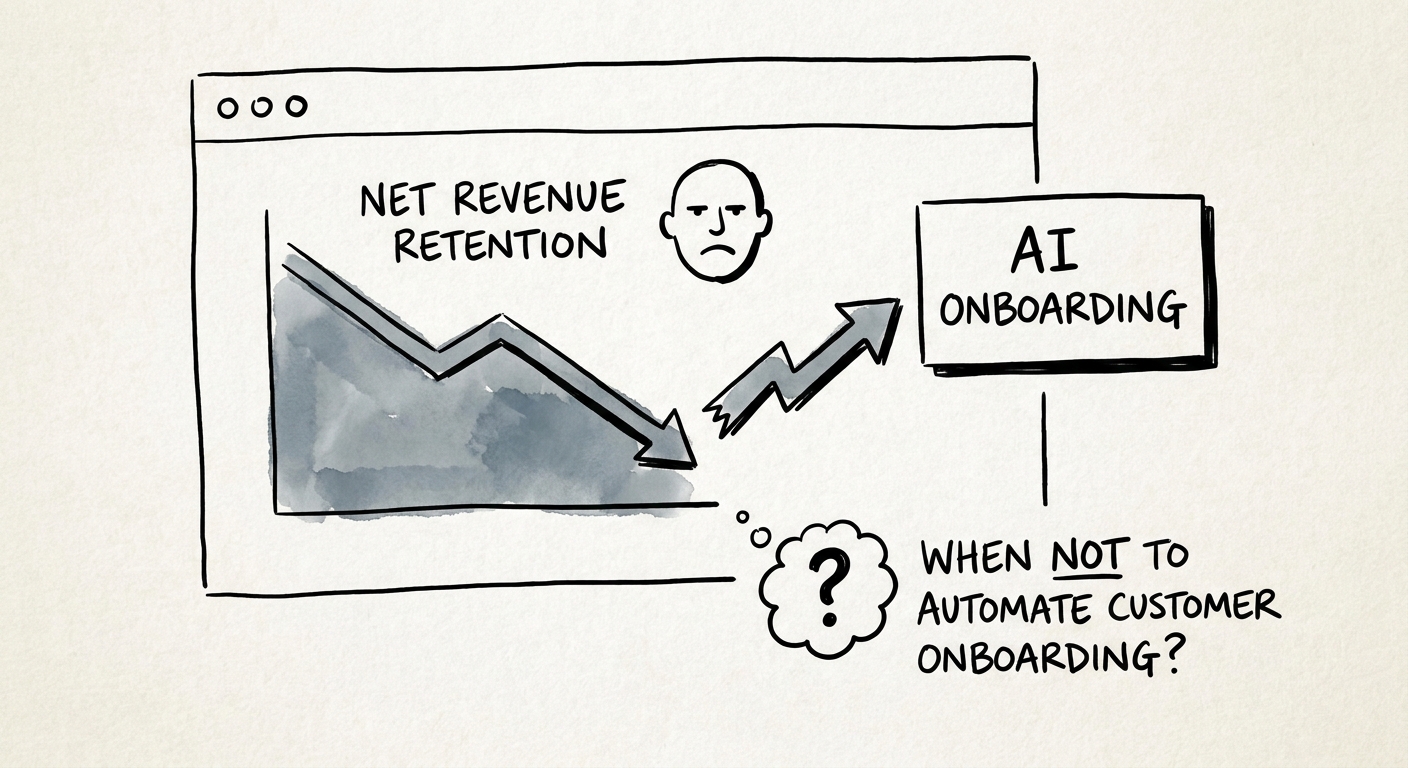
Where AI Belongs in Customer Onboarding — and Where It Quietly Loses You the Renewal
The onboarding tasks AI should run, and the three moments where automating them costs you adoption and renewal in B2B SaaS implementations.
3 onboarding moments that need human ownership
BRIEF · AI MEASUREMENT AND ROI
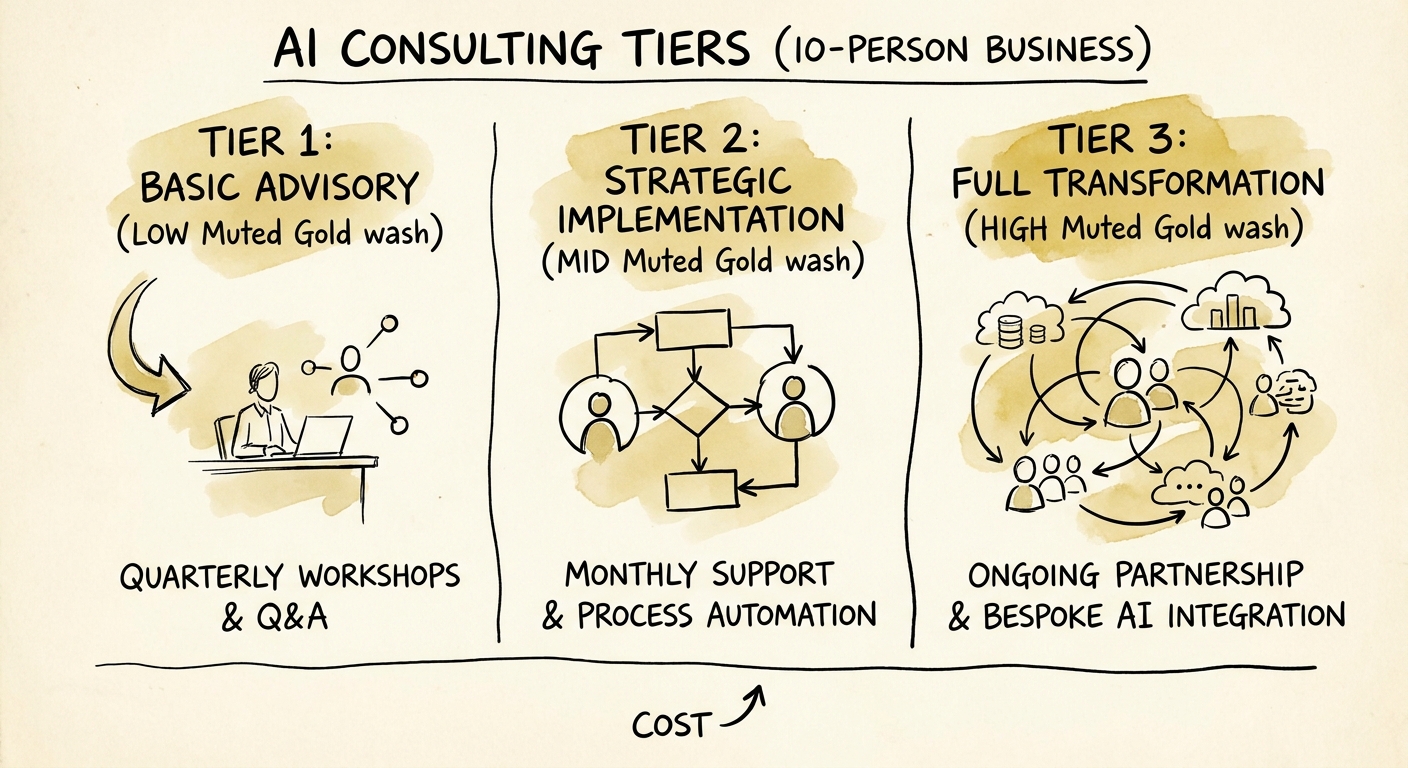
What AI Consulting Actually Costs a 10-Person Business (and What You're Really Buying)
A 10-person shop can't absorb a failed AI rollout. Here's what AI consulting costs at three scopes, and how to buy the narrowest one that proves a workflow works.
3 budget levels to evaluate before buying AI consulting
BRIEF · AI TRANSFORMATION STRATEGY
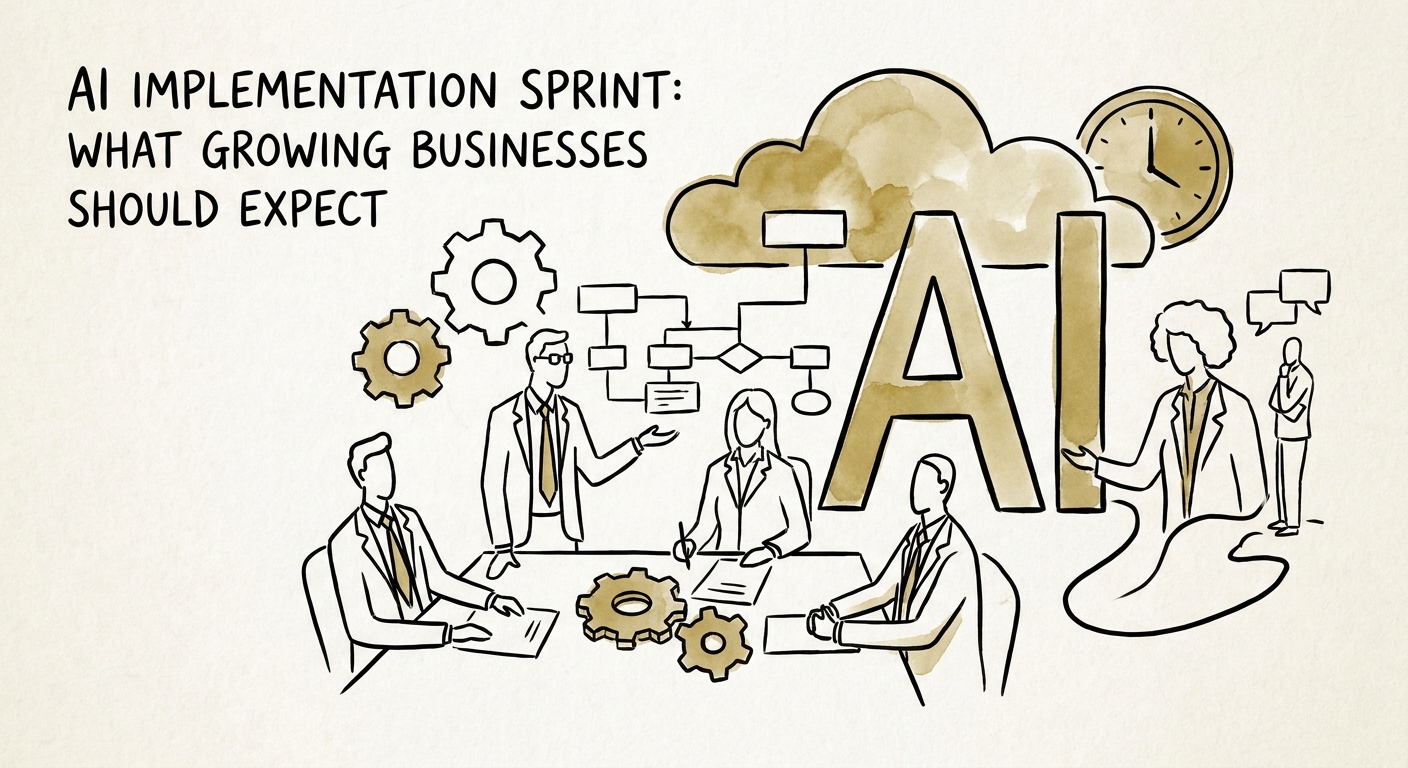
The 30-Day AI Sprint: What Growth-Stage Companies Actually Get on Day 31
A 30-day AI sprint should hand you one governed workflow real users run, an adoption number, and a scale/fix/stop call — not a slide deck of use cases.
30 days to validate one governed workflow
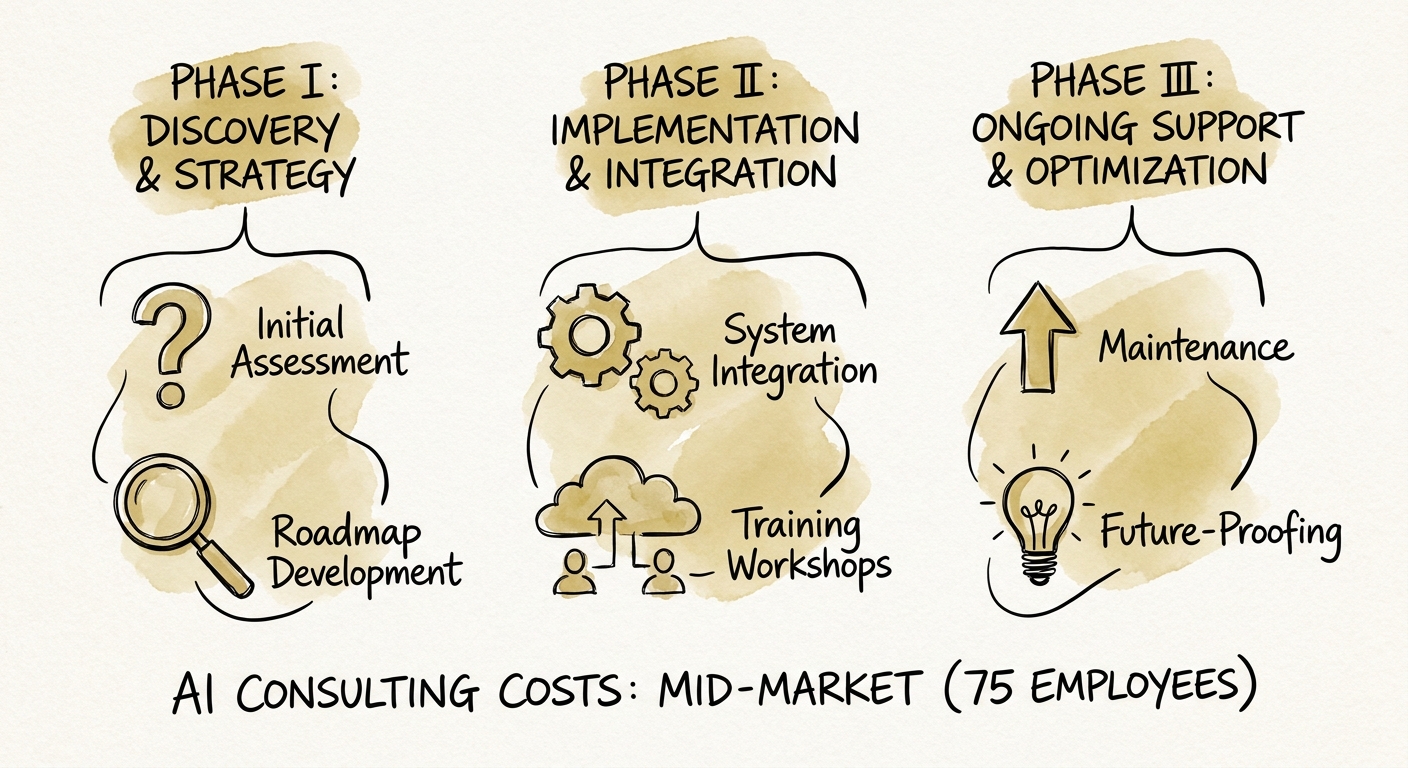
BRIEF · AI MEASUREMENT AND ROI
What AI Consulting Actually Costs a 75-Person Company (and Where the Money Leaks)
At 75 people, AI consulting cost is hidden in data cleanup, access controls, and adoption — not the day rate. Here's how to scope it so you can measure it.
1 owner needed for each workflow
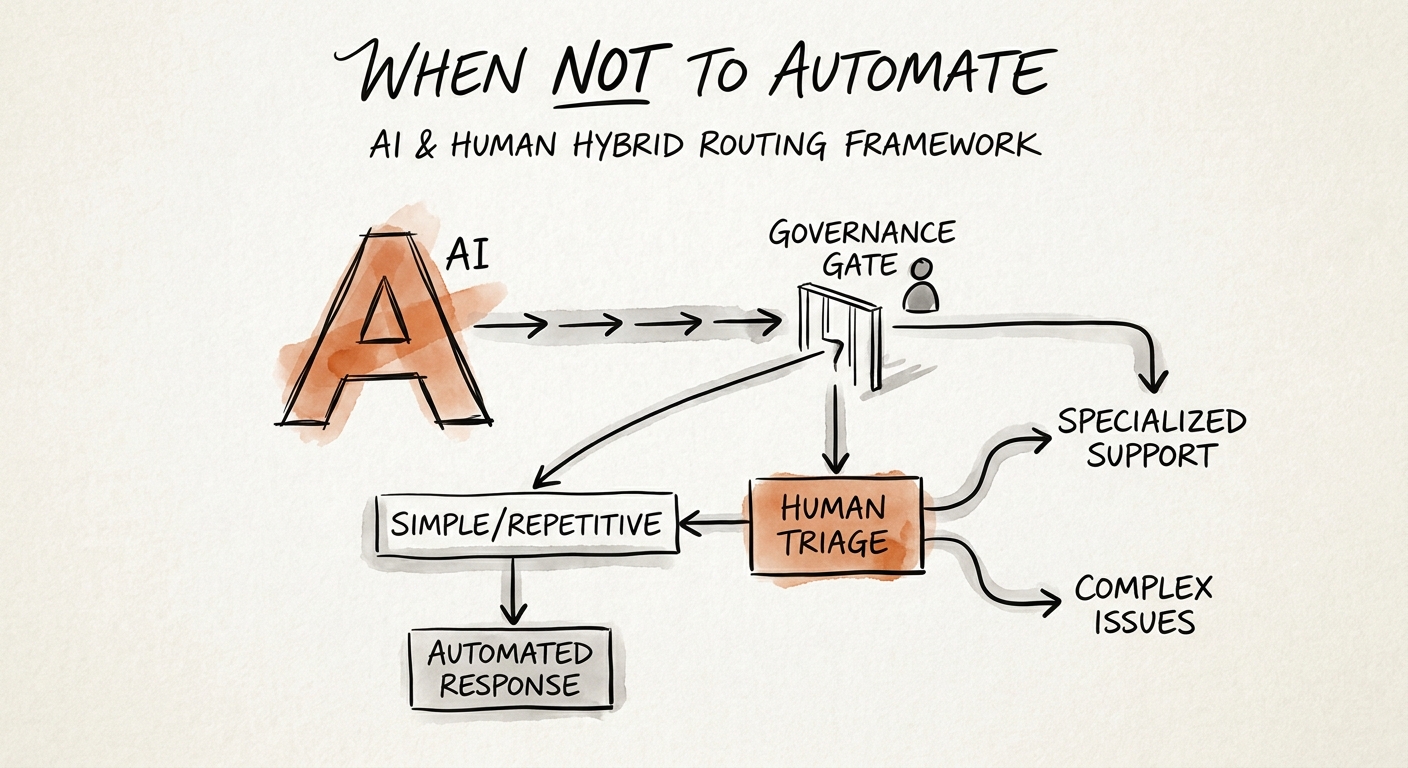
BRIEF · AI GOVERNANCE AND TRAINING
When Not to Auto-Triage a SaaS Support Ticket With AI
The four ticket types your AI triage layer will silently misroute in a B2B SaaS queue — and the routing rules that keep churn and breach reports out of the deflection funnel.
3 ticket categories that need human review
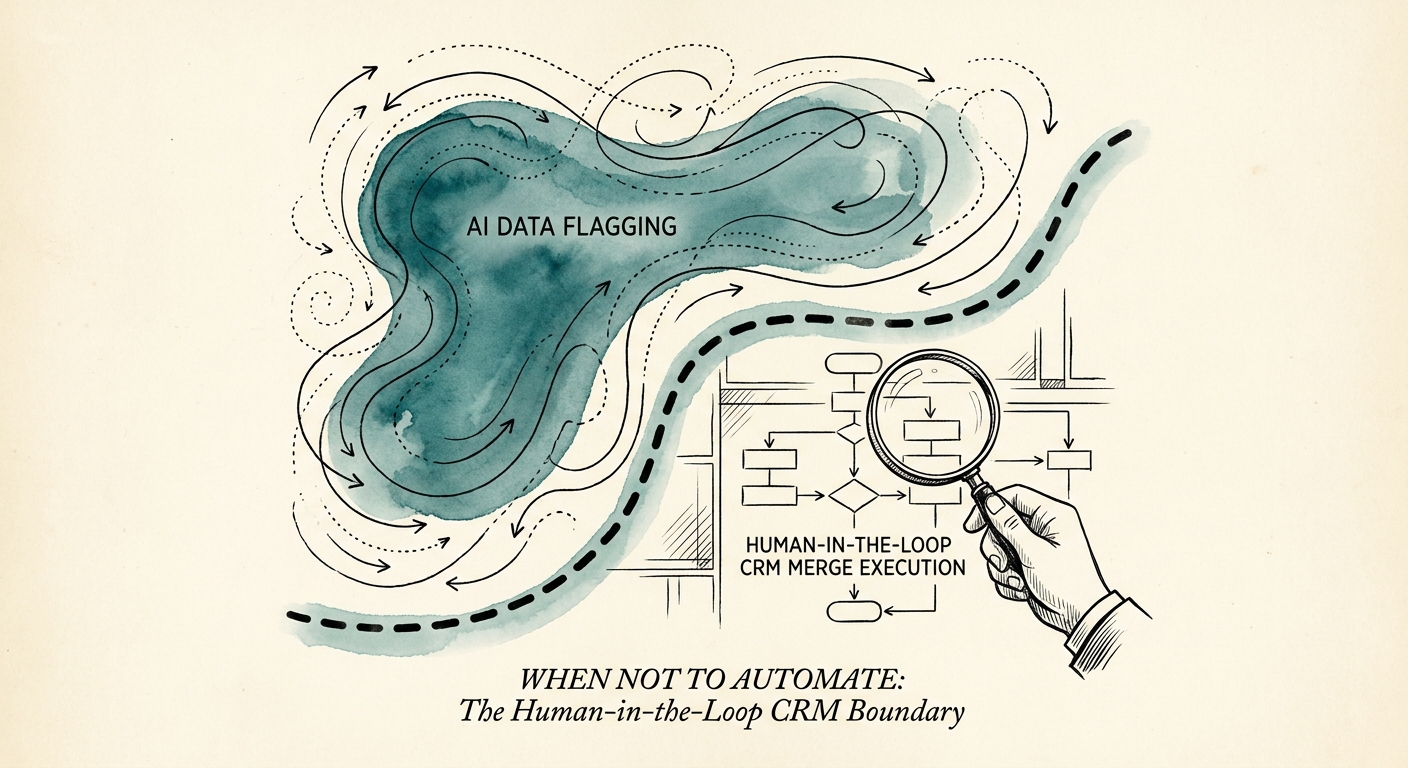
BRIEF · AI GOVERNANCE AND TRAINING
AI Can Clean Your CRM. Don't Let It Hit Save.
An AI that merges duplicates and overwrites stale fields can also erase a buying signal or reassign a deal. Where to draw the write-access line in your CRM.
4 CRM controls before automation
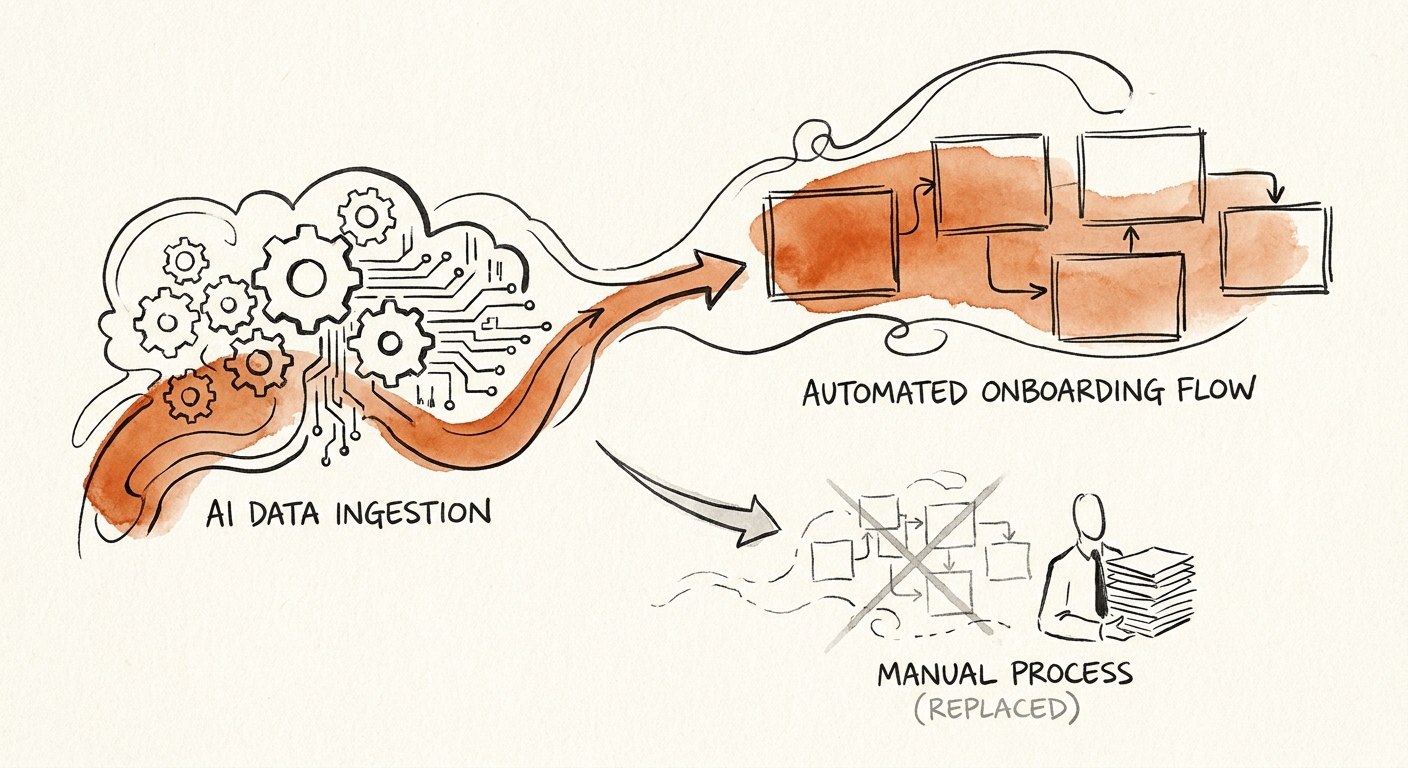
BRIEF · AI WORKFLOW AUTOMATION
Onboarding Is Where Churn Is Decided: Where AI Actually Helps
The first 30 days predict whether a B2B customer stays. Here's where AI shortens onboarding and where it quietly makes churn worse.
90 days to prove an onboarding workflow
BRIEF · AI INDUSTRY USE CASES
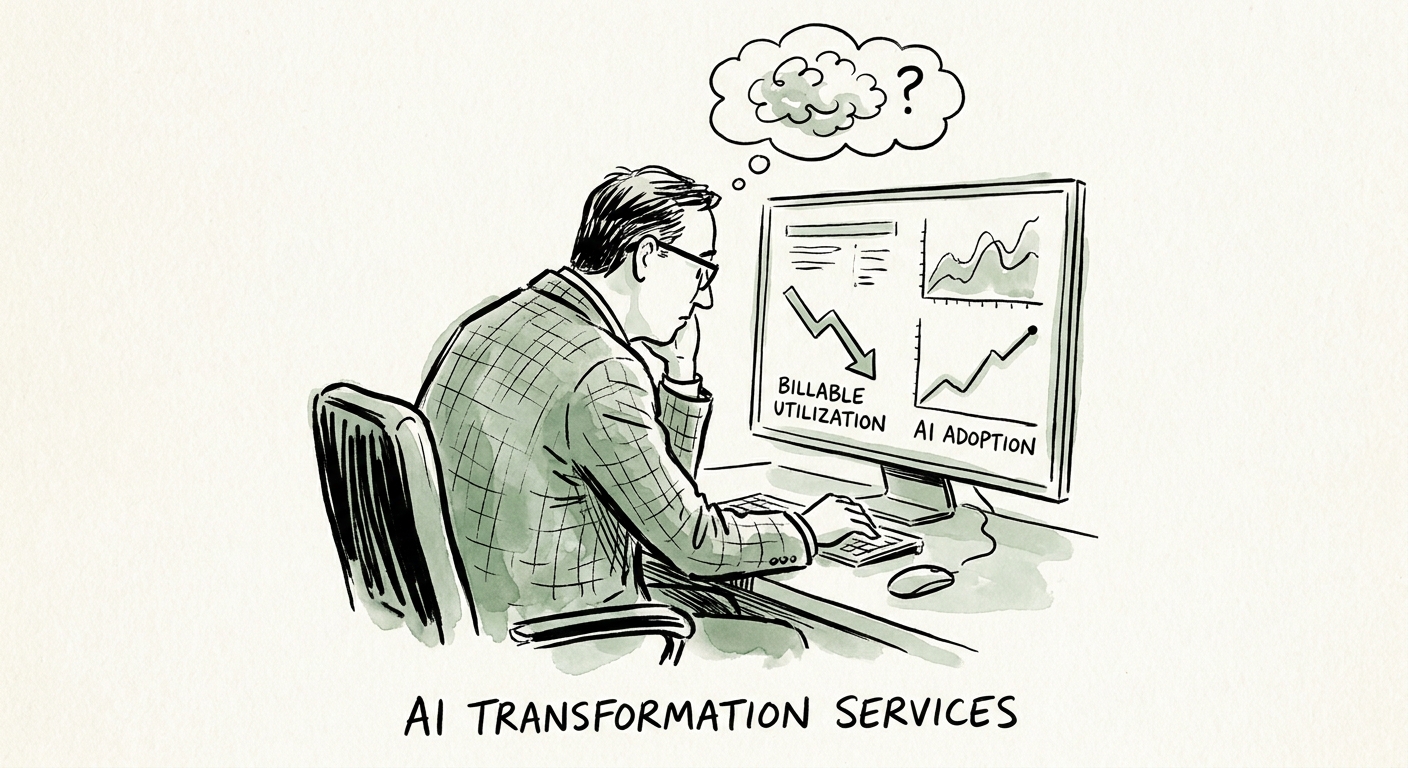
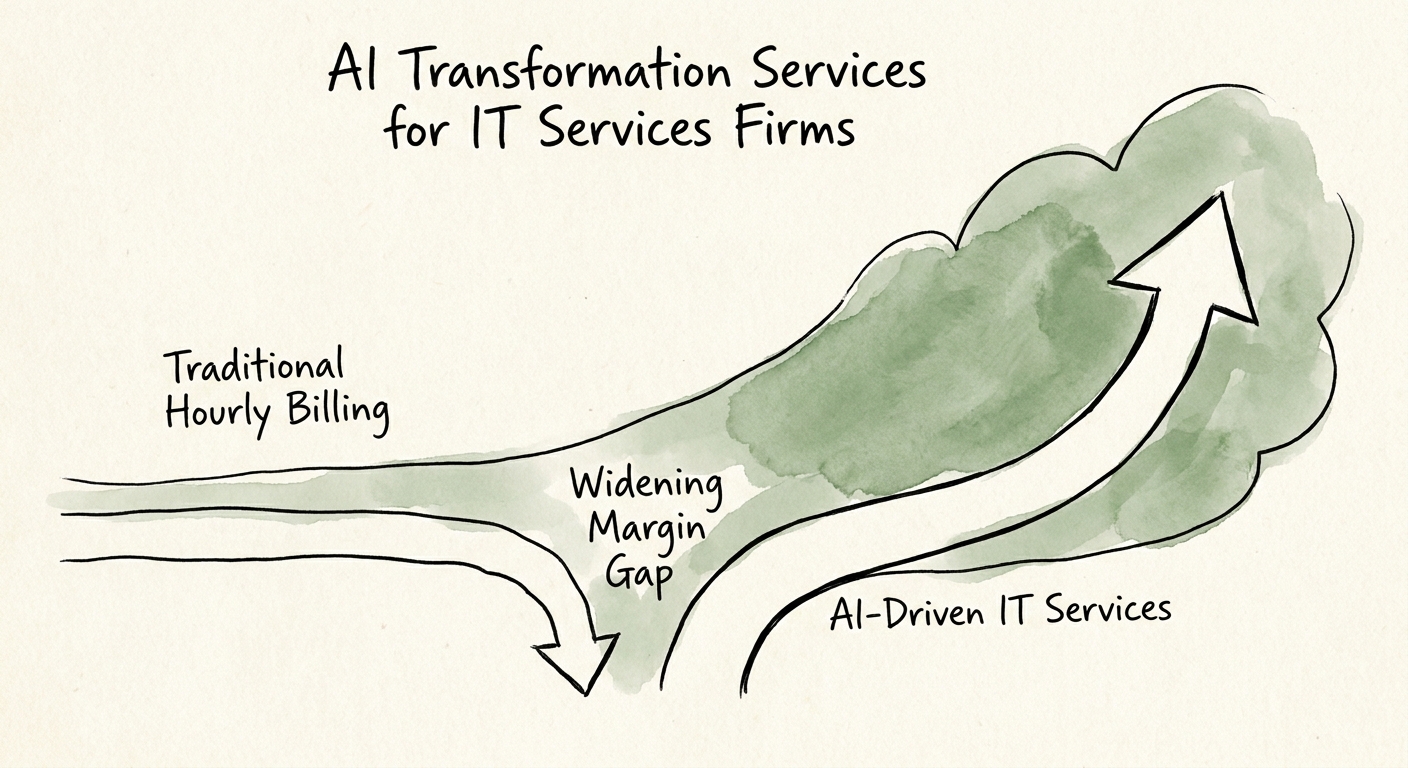
For IT Services Firms, AI Eats Your Own Margin First
IT services firms sell AI transformation while billing by the hour. That contradiction hits your own P&L before it helps a client. Here's the order to fix it.
1 internal delivery workflow to prove first
BRIEF · AI MEASUREMENT AND ROI
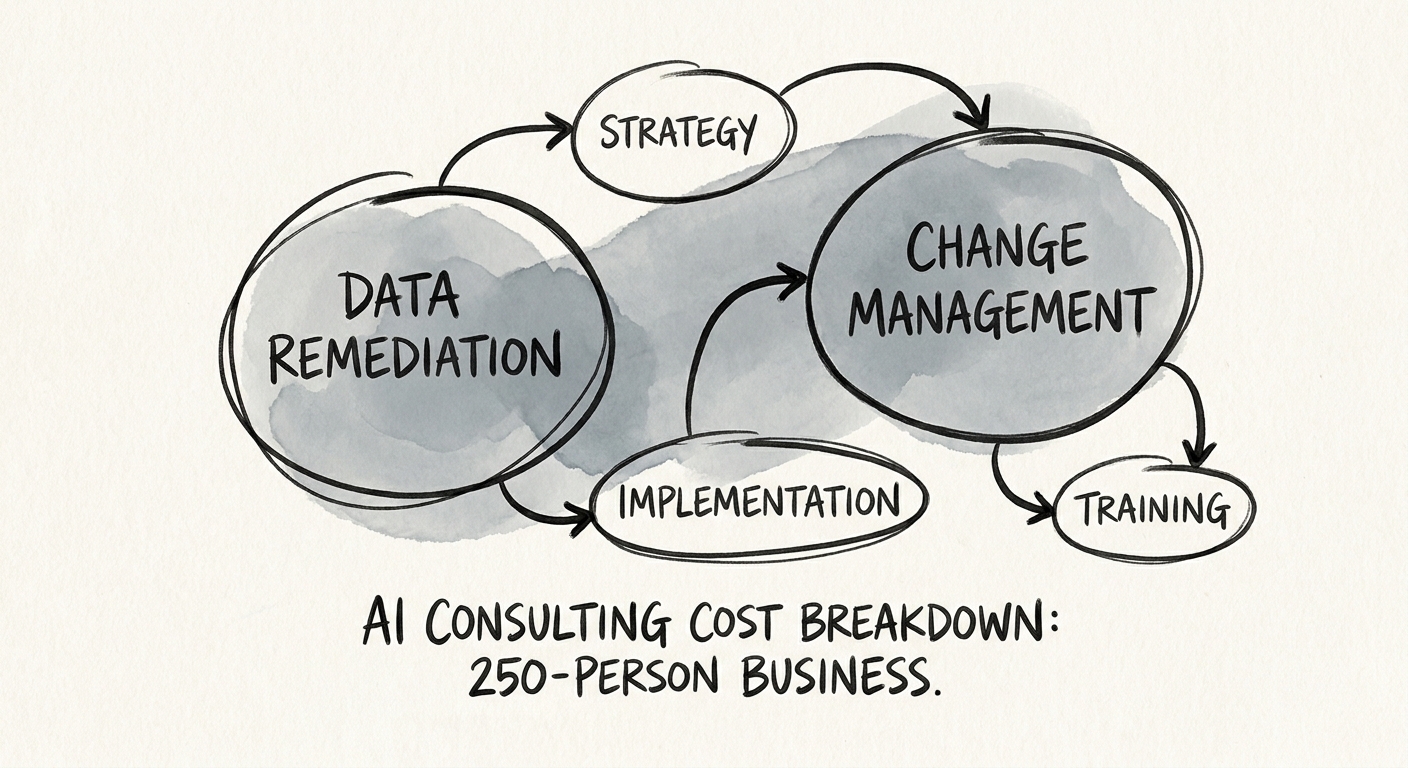
What AI Consulting Actually Costs at 250 People (And Where the Money Quietly Leaks)
At 250 people the AI consulting bill isn't the build — it's the data cleanup, access review, and adoption work hiding under one line item. Here's how to scope it.
1 portfolio ranked by value and risk

BRIEF · AI TRANSFORMATION STRATEGY
AI Consulting for a Professional Services Firm: What to Actually Expect
A 35-person services firm doesn't need an AI strategy deck. Here's what a real engagement produces, why most stall, and the 90-day plan that ships one workflow.
5 artifacts a serious AI consulting engagement should produce
BRIEF · AI TRANSFORMATION STRATEGY
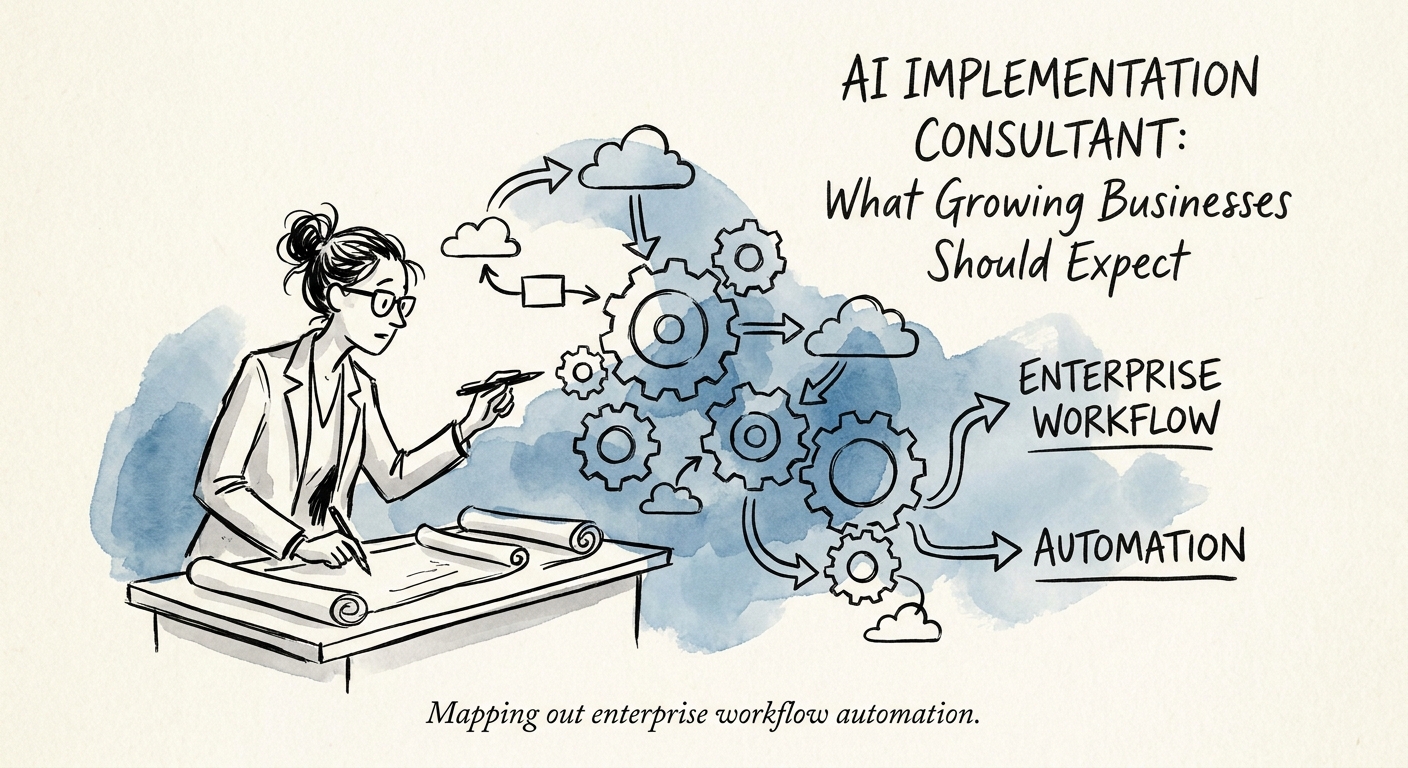
Hiring an AI Implementation Consultant: The 8 Things Their Plan Must Name Before Anyone Touches a Tool
A good AI implementation consultant hands you a plan that names the workflow, the data, the approver, and the metric. Here are the 8 elements to demand first.
8 implementation plan elements