BRIEF · AI MEASUREMENT AND ROI
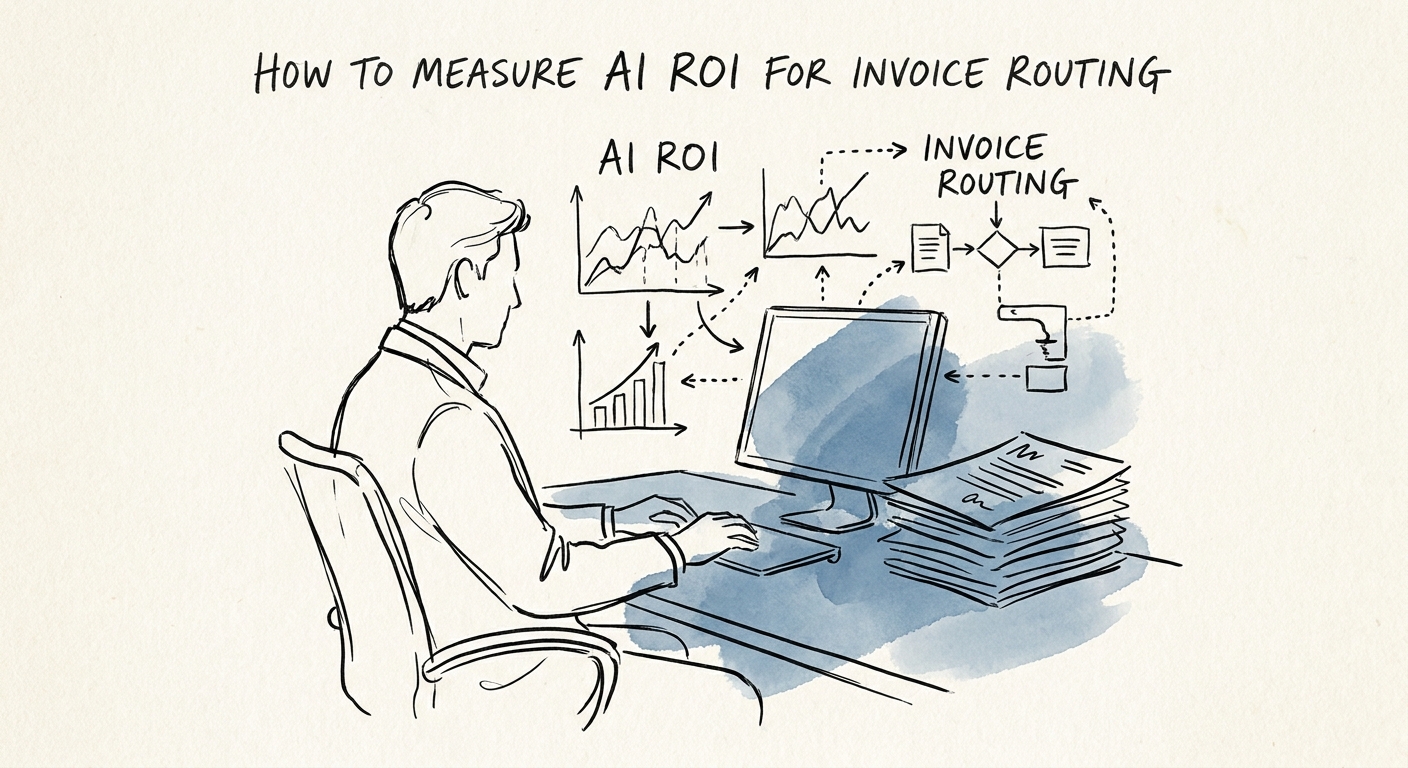
AI for Invoice Routing: The Four Numbers That Tell You If It Worked
An invoice that lands on the wrong approver is worse than one nobody touched. Here are the four AP numbers that prove AI routing earned its keep.
4 measures Measure cycle time, exceptions, adoption, and rework
BRIEF · AI TRANSFORMATION STRATEGY
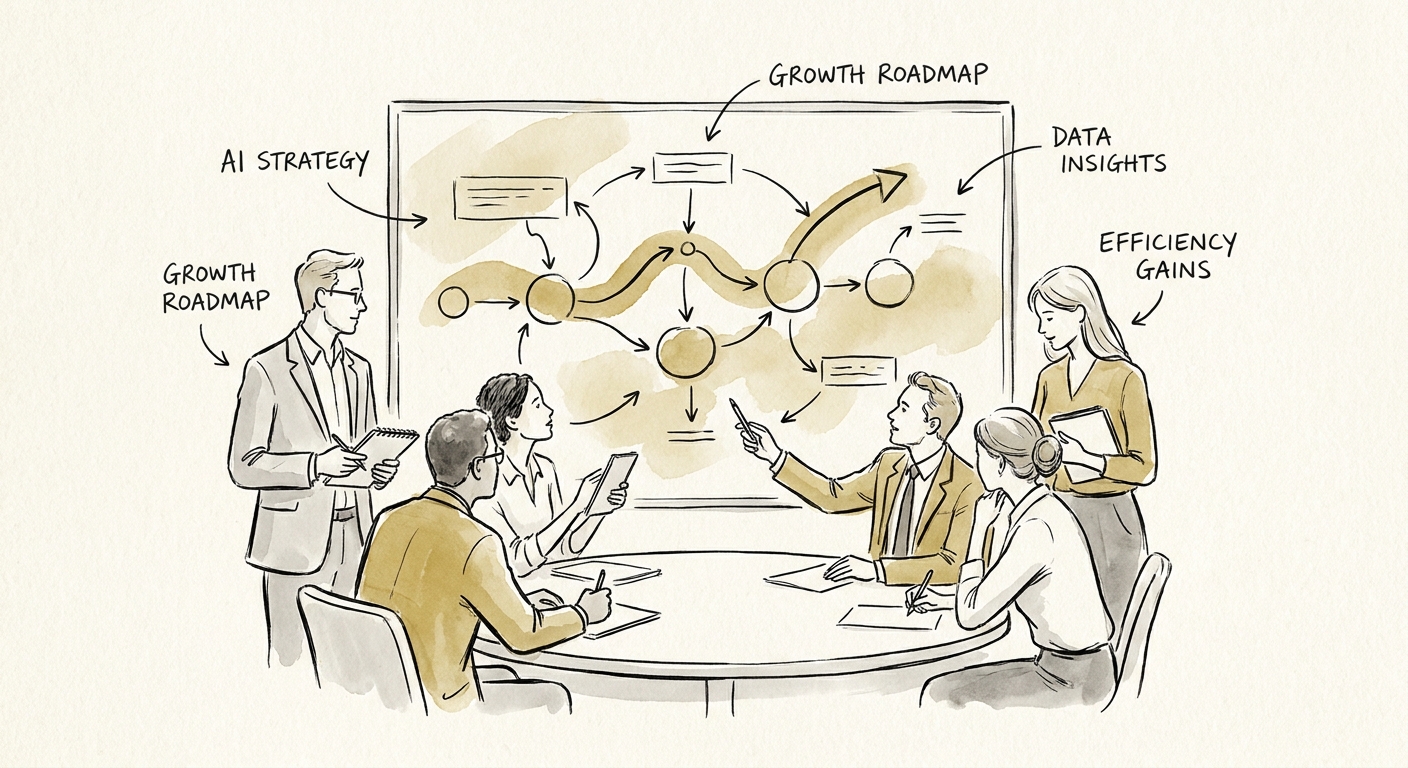
Hiring an AI Use-Case Consultant? They Should Kill More Ideas Than They Greenlight
A good AI use-case consultant hands you a ranked shortlist and a kill list. Here's what the evaluation should score, and the deliverable to demand.
6 use-case evaluation dimensions
BRIEF · AI GOVERNANCE AND TRAINING
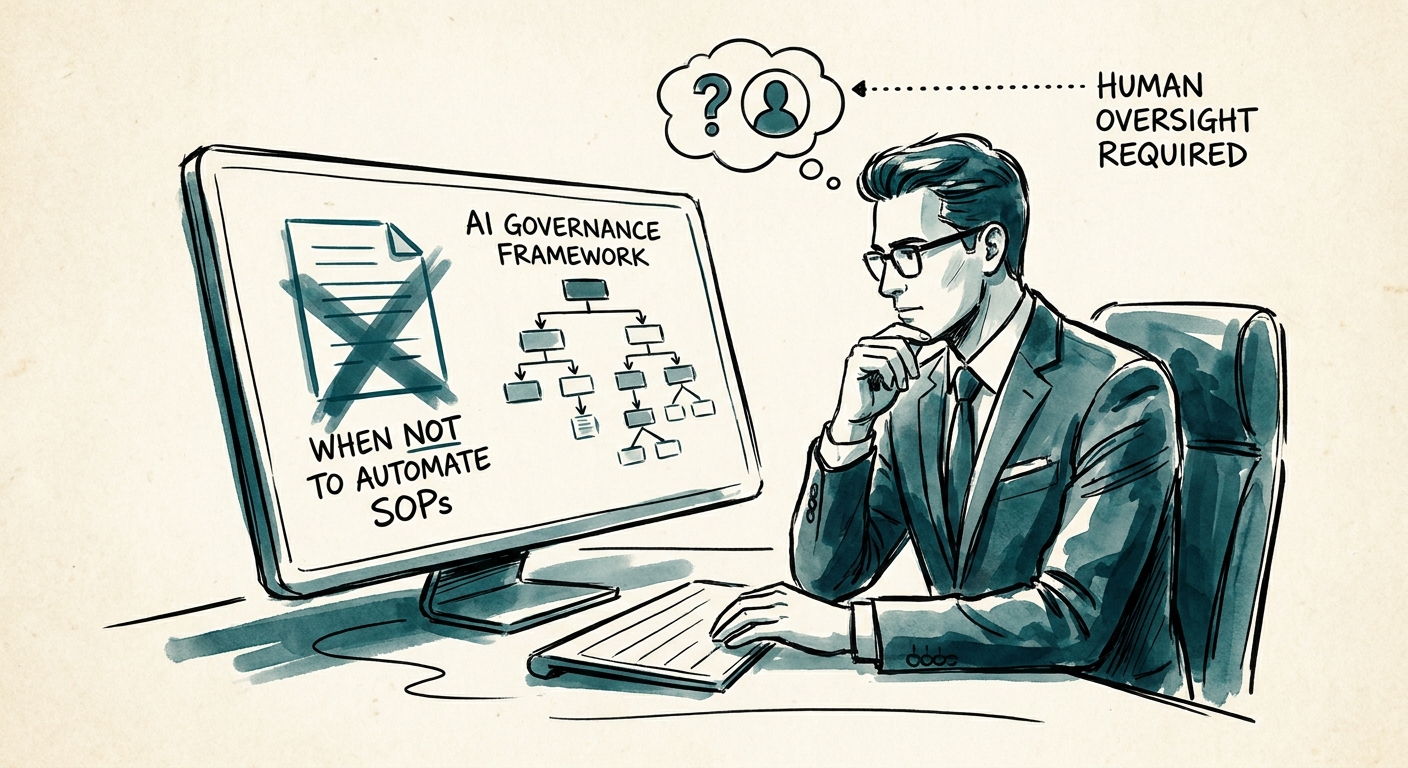
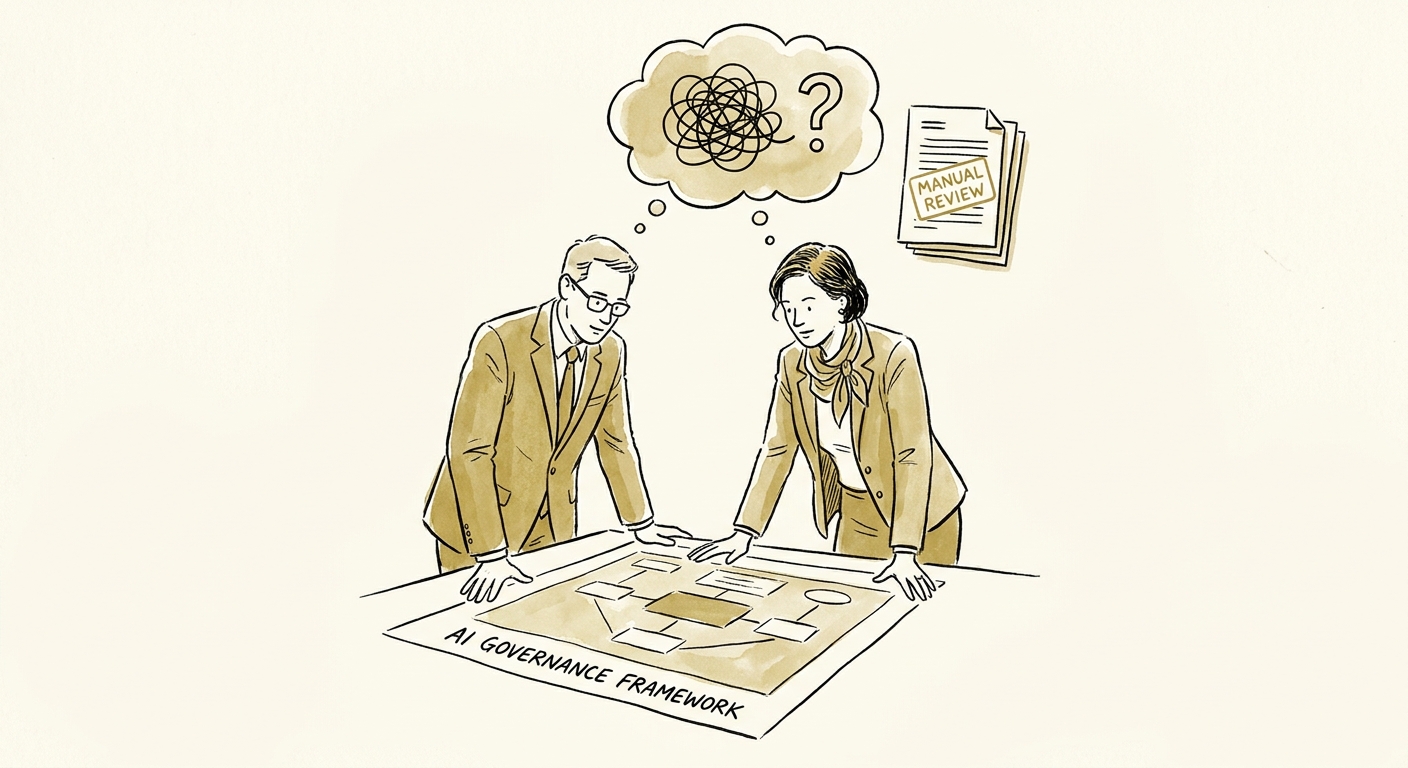
The SOP Trap: When AI Documents a Process Nobody Actually Follows
AI writes a beautiful SOP from your tickets and chat logs — for a process your team abandoned 18 months ago. Here's how to know when to hold off.
4 SOP controls before automation
BRIEF · AI GOVERNANCE AND TRAINING
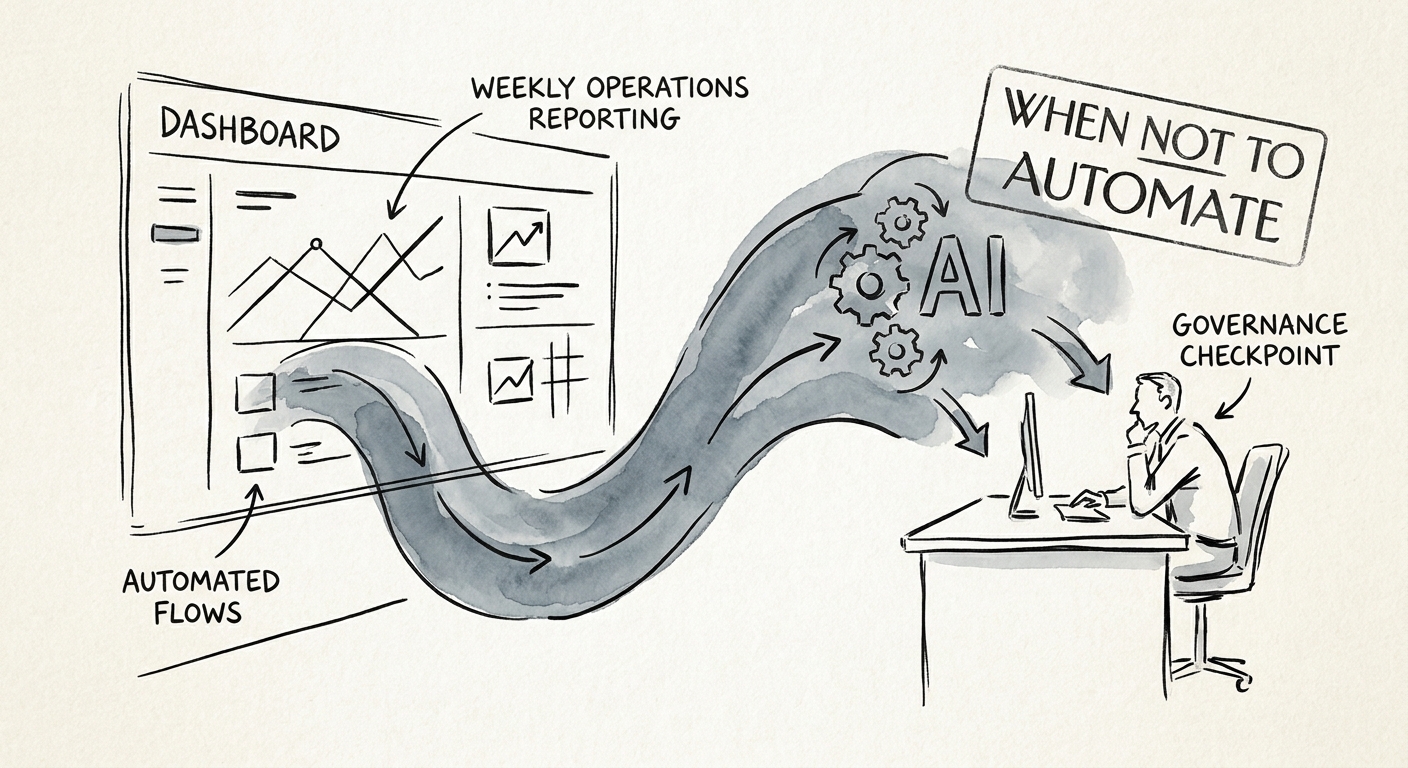
Don't Automate the Weekly Ops Report Until Two Systems Agree on "Open Tickets"
An AI ops report is only as honest as your metric definitions. Why a B2B tech firm should fix source-of-truth conflicts before letting AI write the weekly narrative.
4 reporting controls before automation
BRIEF · AI GOVERNANCE AND TRAINING
AI Should Prep Your Contract Review, Not Sign Off On the Indemnity Clause
AI is great at extracting clauses and flagging missing terms. It is dangerous the moment it decides a liability cap is acceptable. Here is the line.
4 contract controls before automation
BRIEF · AI INDUSTRY USE CASES
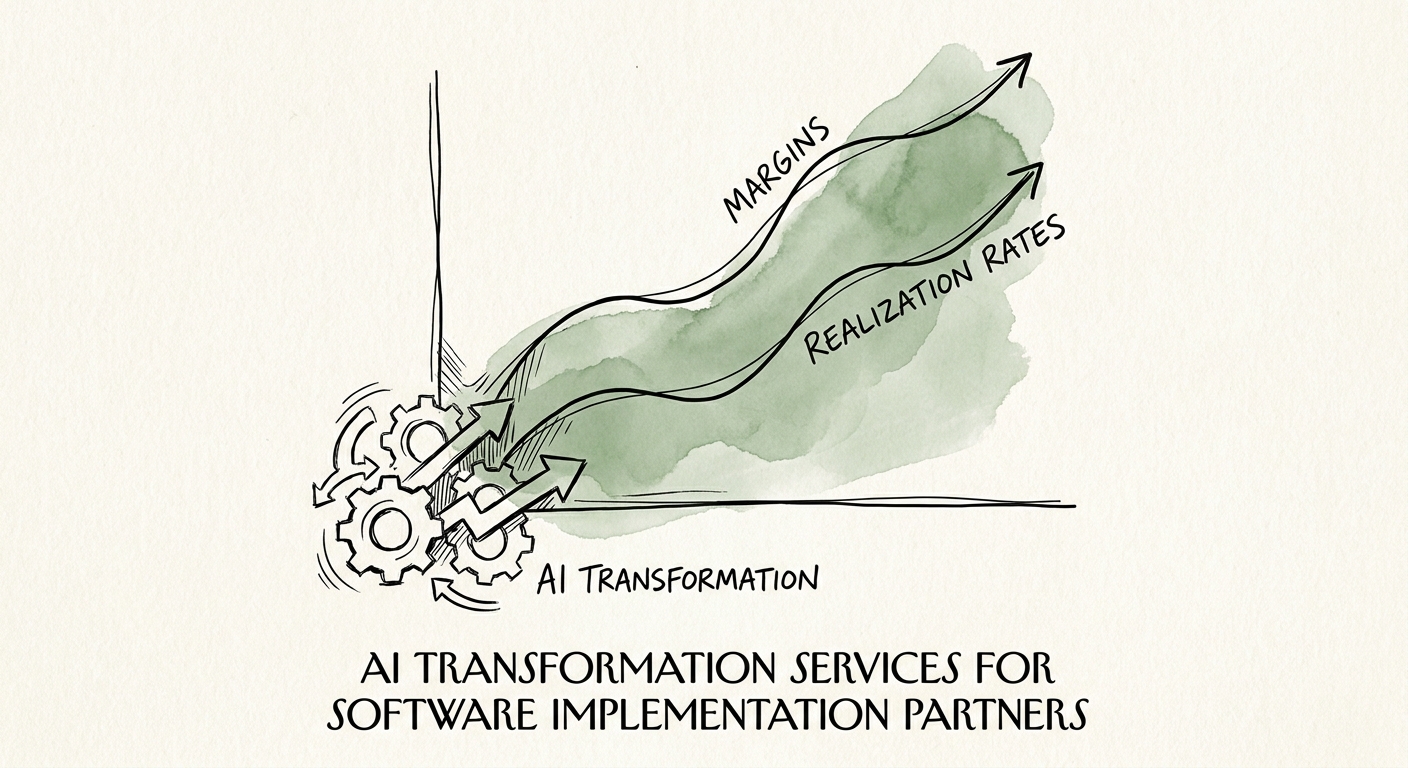
AI for Software Implementation Partners: Fix the Rework Tax First
Implementation firms bleed margin on rework and missed acceptance criteria. Where AI actually helps delivery teams — and the one workflow to prove first.
90 days to prove one delivery workflow before scaling
BRIEF · AI GOVERNANCE AND TRAINING
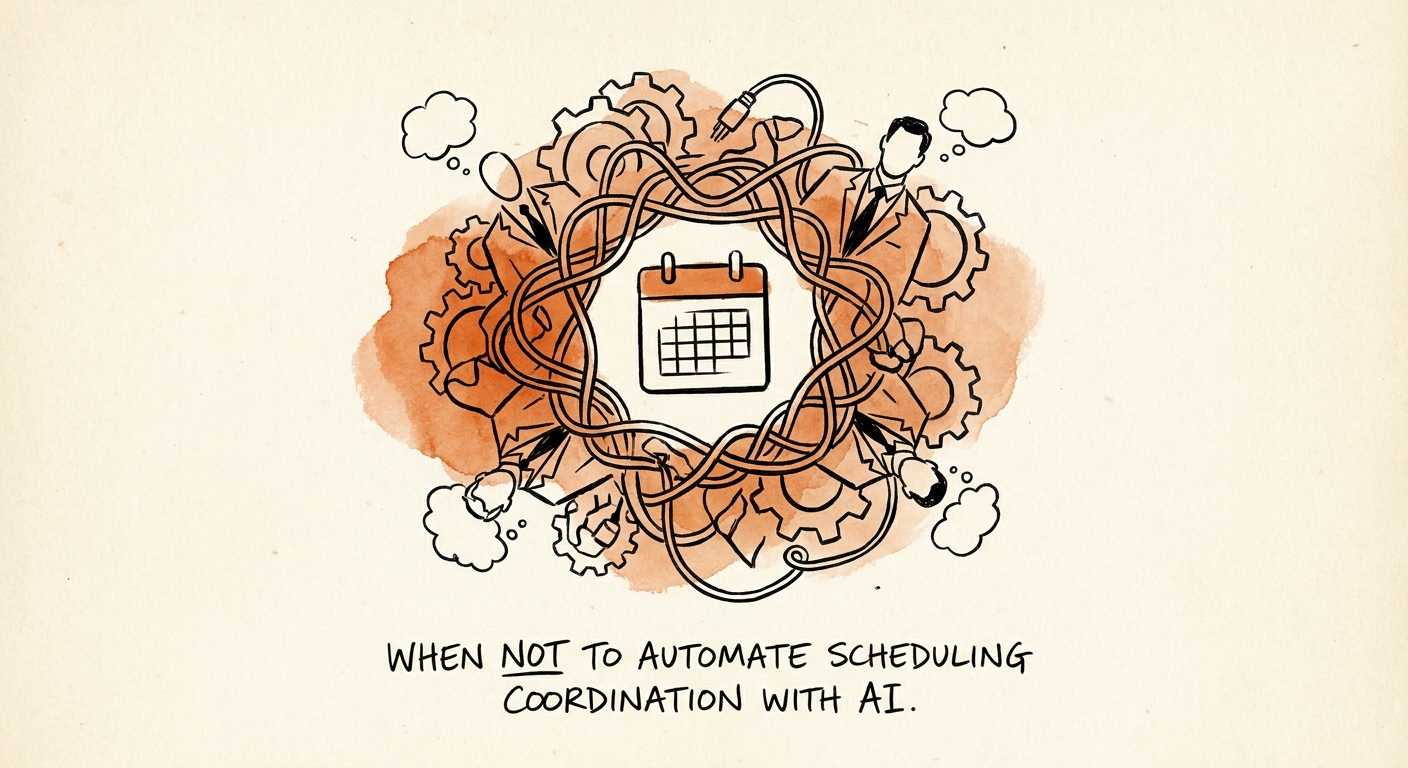
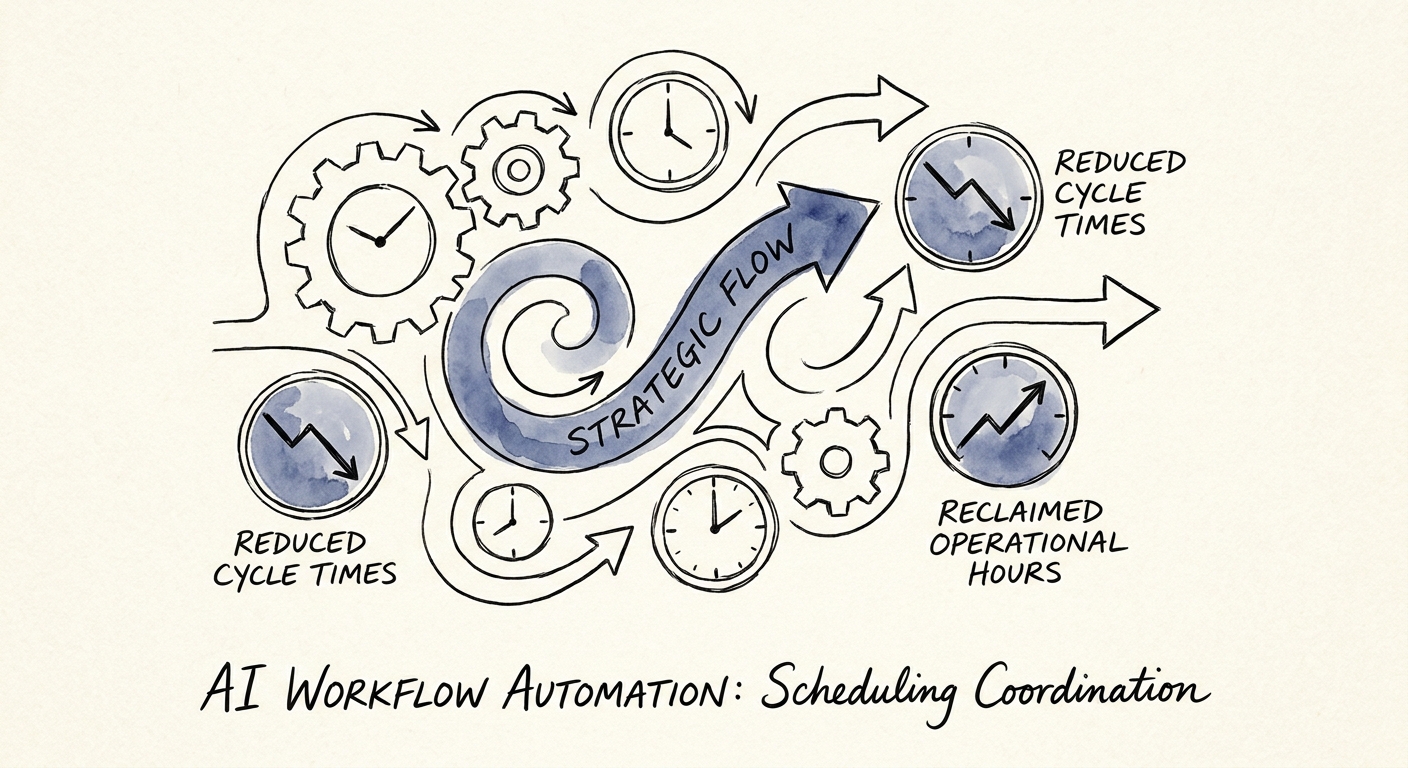
Scheduling Coordination with AI: The Three Bookings You Should Never Let It Confirm
A professional services guide to AI scheduling coordination: which bookings AI can draft, which it must never confirm, and how to draw the line.
21% leaders with mature agent governance
BRIEF · AI MEASUREMENT AND ROI
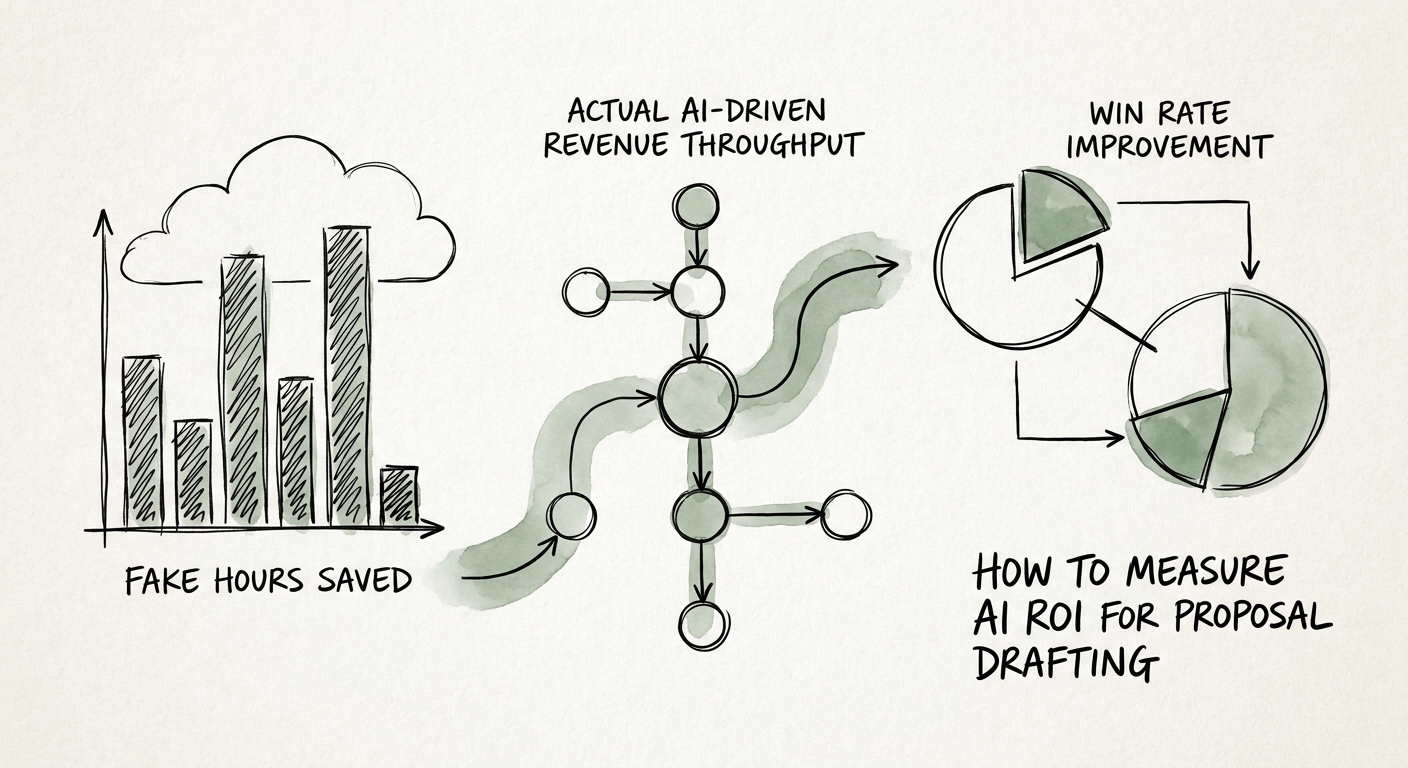
AI Wrote the Proposal in 20 Minutes. Did It Actually Make You Money?
Your sales engineers are the bottleneck in RFP responses, not the writers. Here's how to measure AI proposal ROI on win rate and SME hours, not draft speed.
4 proposal ROI metrics to track
BRIEF · AI INDUSTRY USE CASES
AI for MSPs: Start at the Ticket Queue, Not the Marketing Deck
Where MSPs should actually deploy AI first: triage, escalation prep, and known-fix retrieval — with tenant separation that survives a client audit.
5 managed service provider workflows to prioritize
BRIEF · AI WORKFLOW AUTOMATION
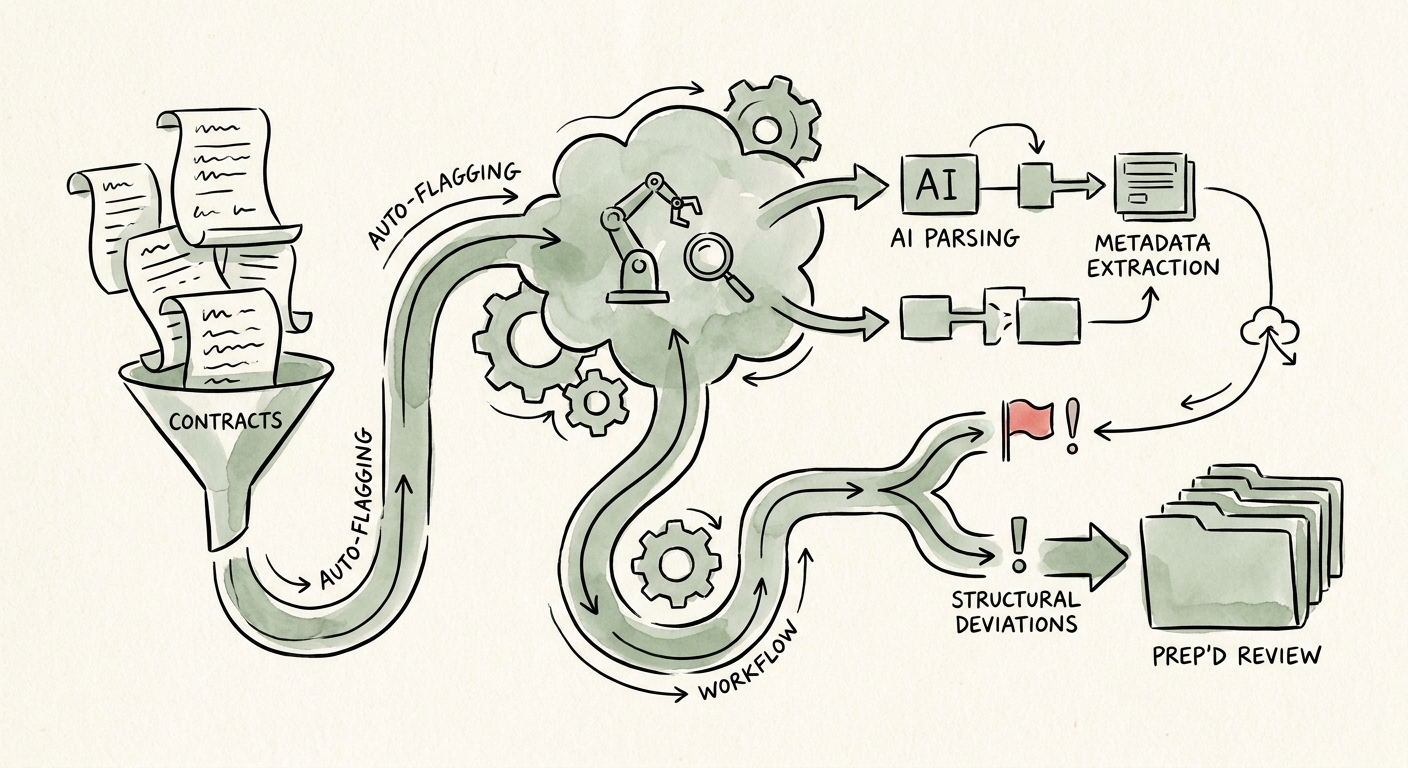
AI for Contract Review: Build the Packet, Not the Verdict
AI can read an incoming vendor contract, flag the auto-renewal and liability cap, and route it in minutes — without ever signing it. Here is how to build that workflow.
4 review packet elements to verify before approval
BRIEF · AI WORKFLOW AUTOMATION
Why Scheduling AI Fails the Tuesday Test (and How to Fix It Before You Buy)
Scheduling AI breaks when priority rules live in a dispatcher's head. Write down the 4 constraints first, govern the exceptions, then automate coordination.
4 constraints needed before scheduling automation
BRIEF · AI TRANSFORMATION STRATEGY
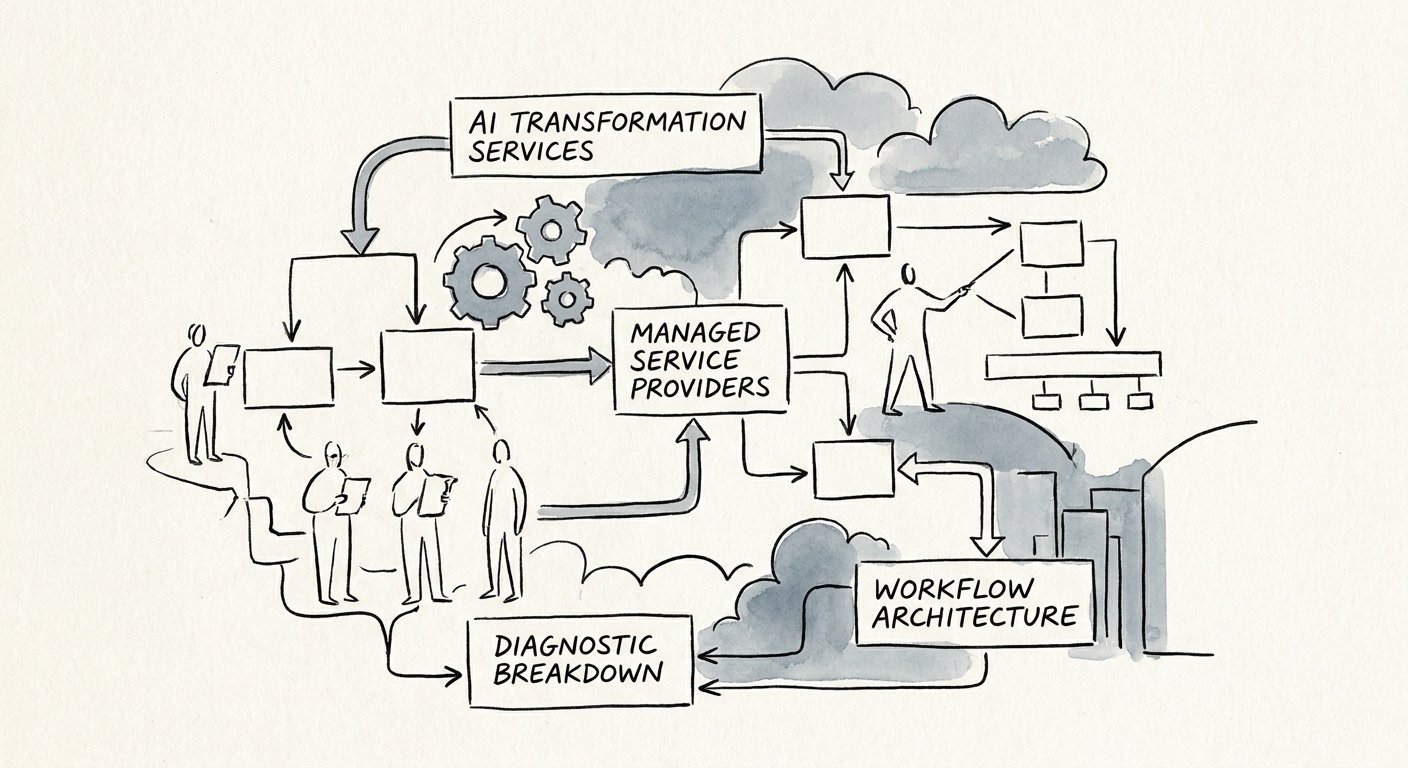
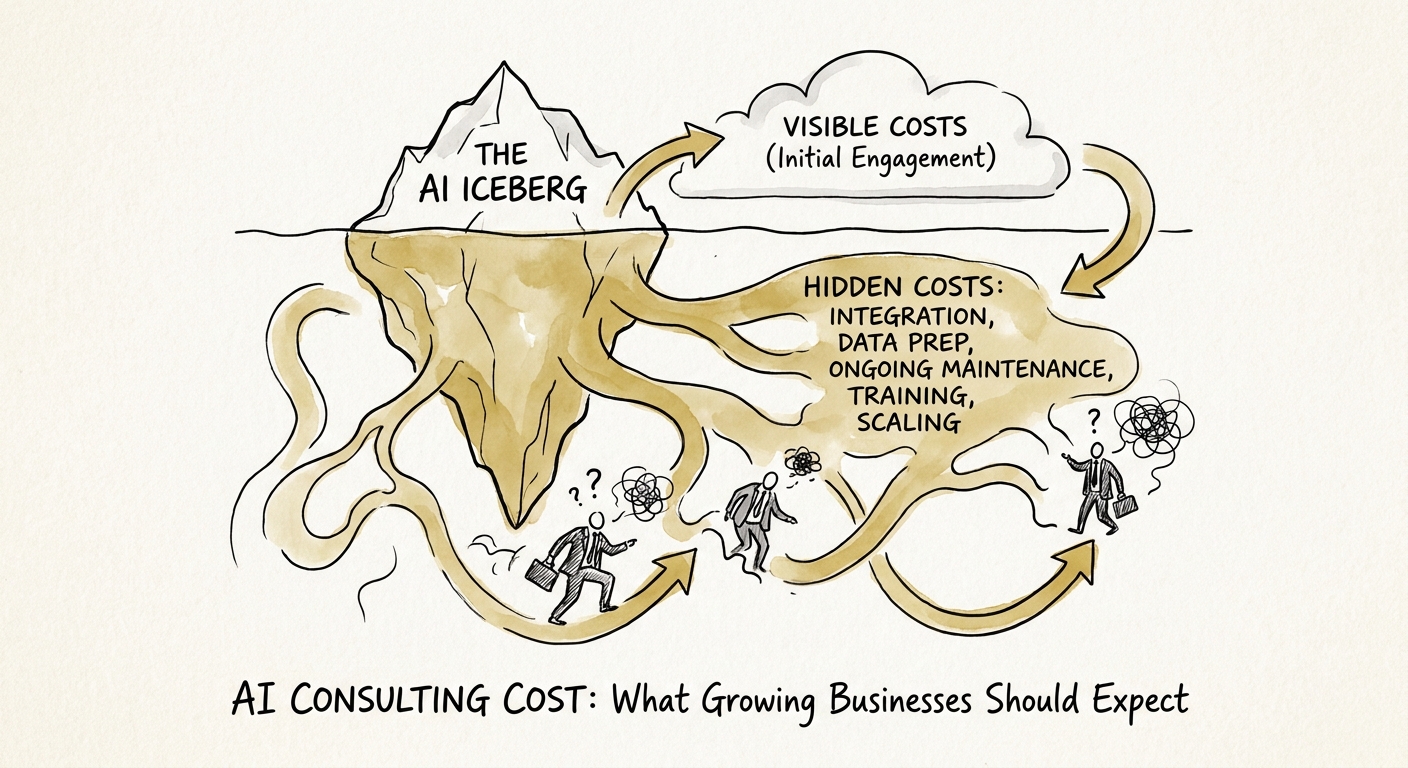
What AI Consulting Actually Costs (and What You're Really Paying For)
Two AI consulting quotes can be 5x apart and both be "right." Here's how a growing business reads the scope behind the number — and pays for proof, not a tool tour.
3 layers diagnostic, build, and adoption
BRIEF · AI INDUSTRY USE CASES
AI for Law Firm Operations: Start in the Back Office, Not the Brief
Where law firms should actually deploy AI first: intake, matter status, billing narratives, knowledge search — without touching legal judgment or client confidentiality.
90 days to validate one governed law-firm AI workflow
BRIEF · AI TRANSFORMATION STRATEGY
Hiring an AI Agent Consultant? Ask What the Agent Is Allowed to Write
A copilot suggests; an agent acts. Here's how to vet an AI agent consultant by what your agent can read, write, and approve — before it touches a live system.
5 agent controls to define
BRIEF · AI WORKFLOW AUTOMATION
Internal Knowledge Search With AI: Govern the Sources Before You Automate the Answer
An AI knowledge assistant inherits the mess in your file shares. Here's how to scope permissions, pick authoritative sources, and measure answer quality before rollout.
4 knowledge search controls before rollout
BRIEF · AI INDUSTRY USE CASES
Where Implementation Partners Should Point AI First (Hint: Start at the Kickoff Workshop)
For software implementation partners, the highest-return first AI use cases live in workshop notes, config decisions, UAT evidence, and status reports. Here's the order.
5 implementation workflows to evaluate first
BRIEF · AI GOVERNANCE AND TRAINING
Why AI Should Never Make the Reroute Call in Dispatch Exceptions
An AI can sort a late-truck alert in seconds. The reroute behind it touches driver hours, detention, and a customer promise. Here's where the line goes.
3 dispatch controls before autonomy
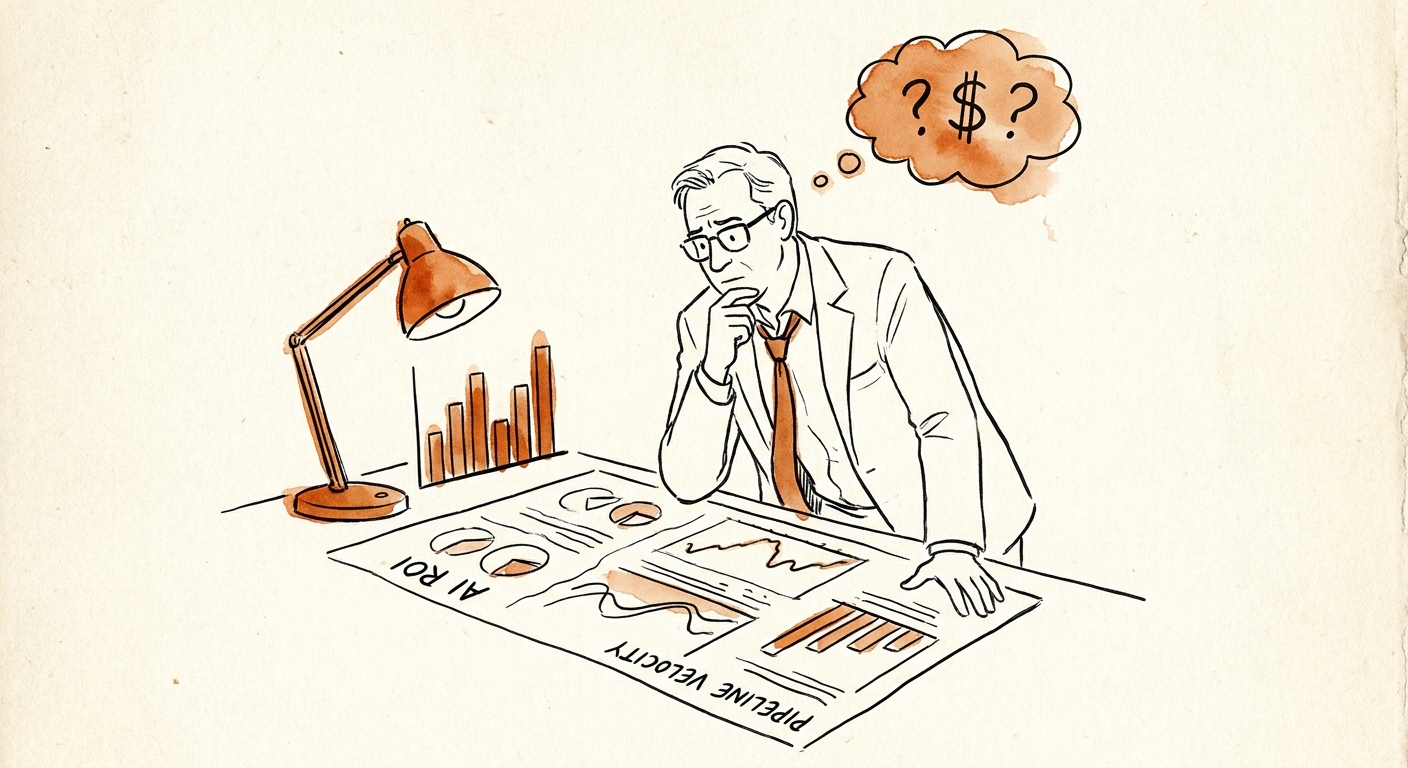
BRIEF · AI MEASUREMENT AND ROI
The Real ROI of AI in Collections Is Hiding in Your DSO Curve
AI in collections pays off in days, not reminders. How to tie AI ROI to DSO, promise-to-pay kept rates, and dispute routing without torching customer relationships.
5 ROI measures for collections AI
BRIEF · AI TRANSFORMATION STRATEGY
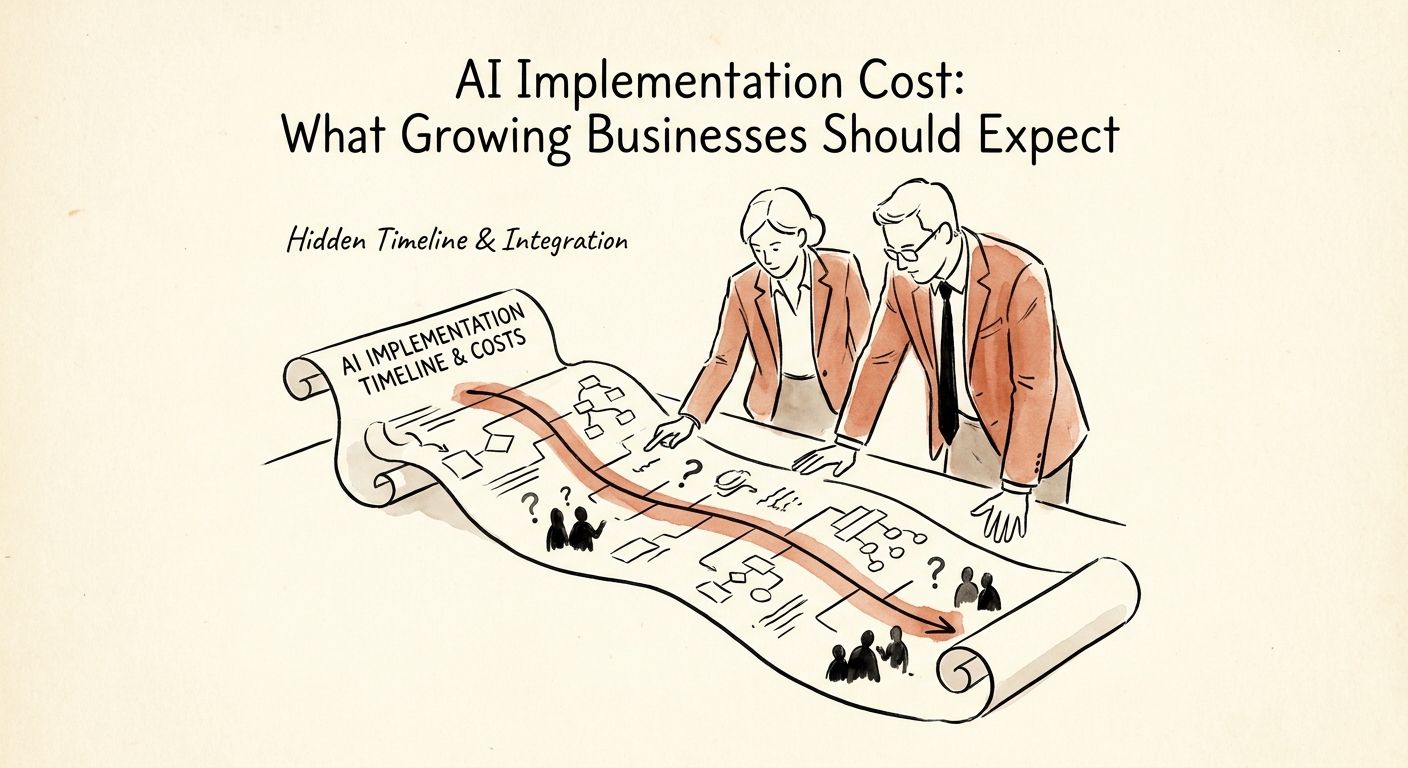
What an AI Project Actually Costs a Growing Business (Not the License)
The AI tool costs $30 a seat. The implementation costs five figures. Here is where the real money goes and how to budget for it before you sign anything.
90 days to scope, pilot, and review one governed AI workflow
BRIEF · AI WORKFLOW AUTOMATION
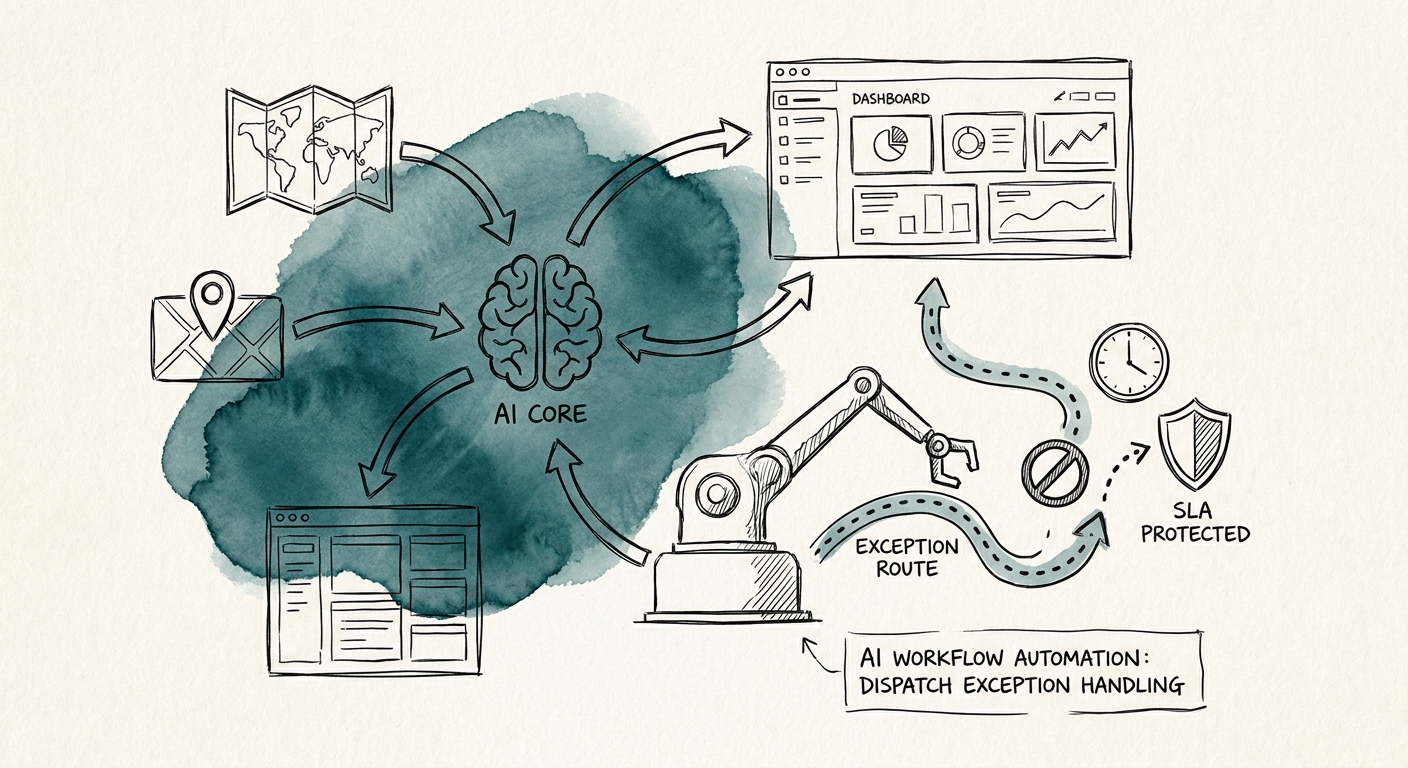
Dispatch Exceptions: Where AI Belongs in Field Service Routing (and Where It Doesn't)
A field service dispatcher absorbs 30+ exceptions a day. Here's where AI cuts the noise, where it must not auto-act, and the 4 signals it needs first.
4 signals needed before dispatch automation
BRIEF · AI MEASUREMENT AND ROI
AI Account Research: How to Prove It Moved Pipeline, Not Just Saved Time
Time saved on account research is not ROI. Here is how B2B revenue leaders tie AI research to brief acceptance, meeting creation, and stage conversion.
1 revenue workflow to measure before scaling
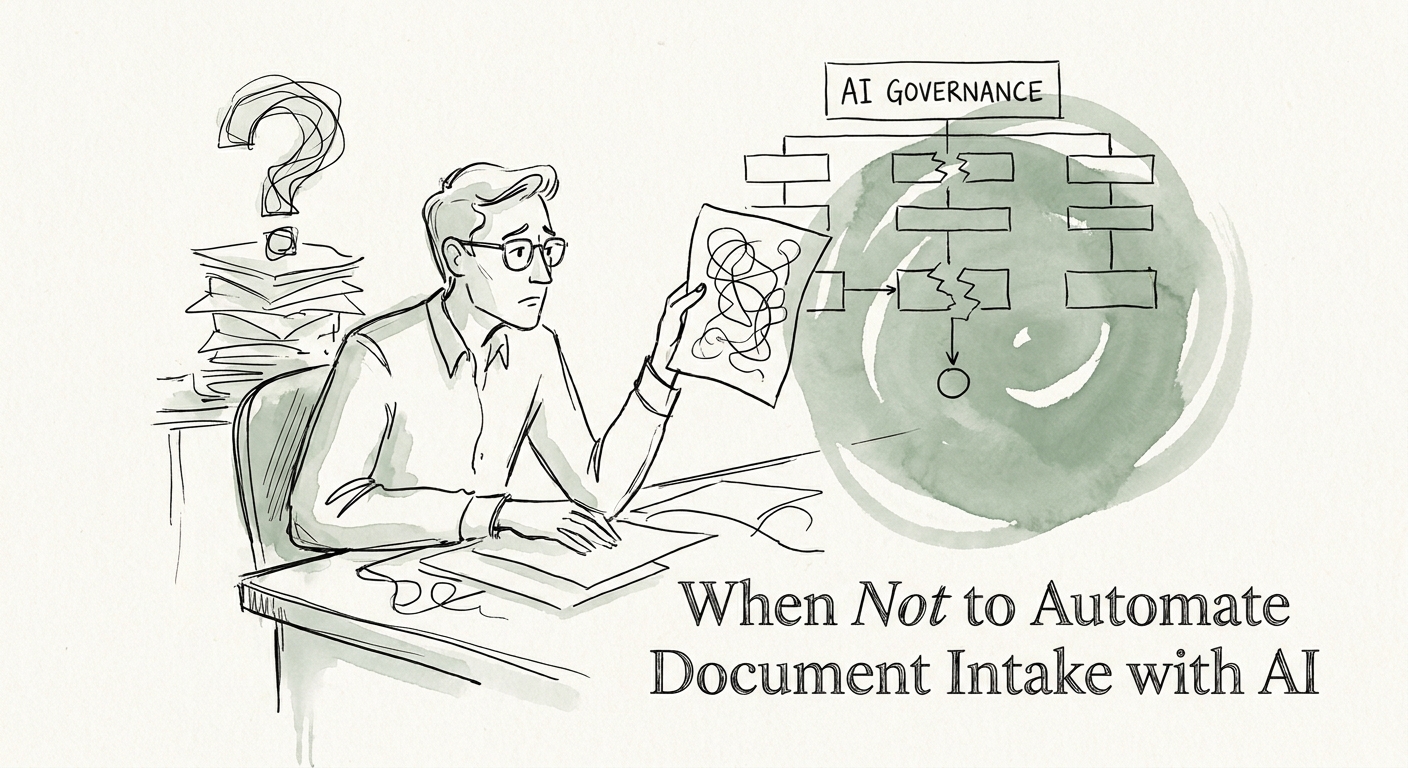
BRIEF · AI GOVERNANCE AND TRAINING
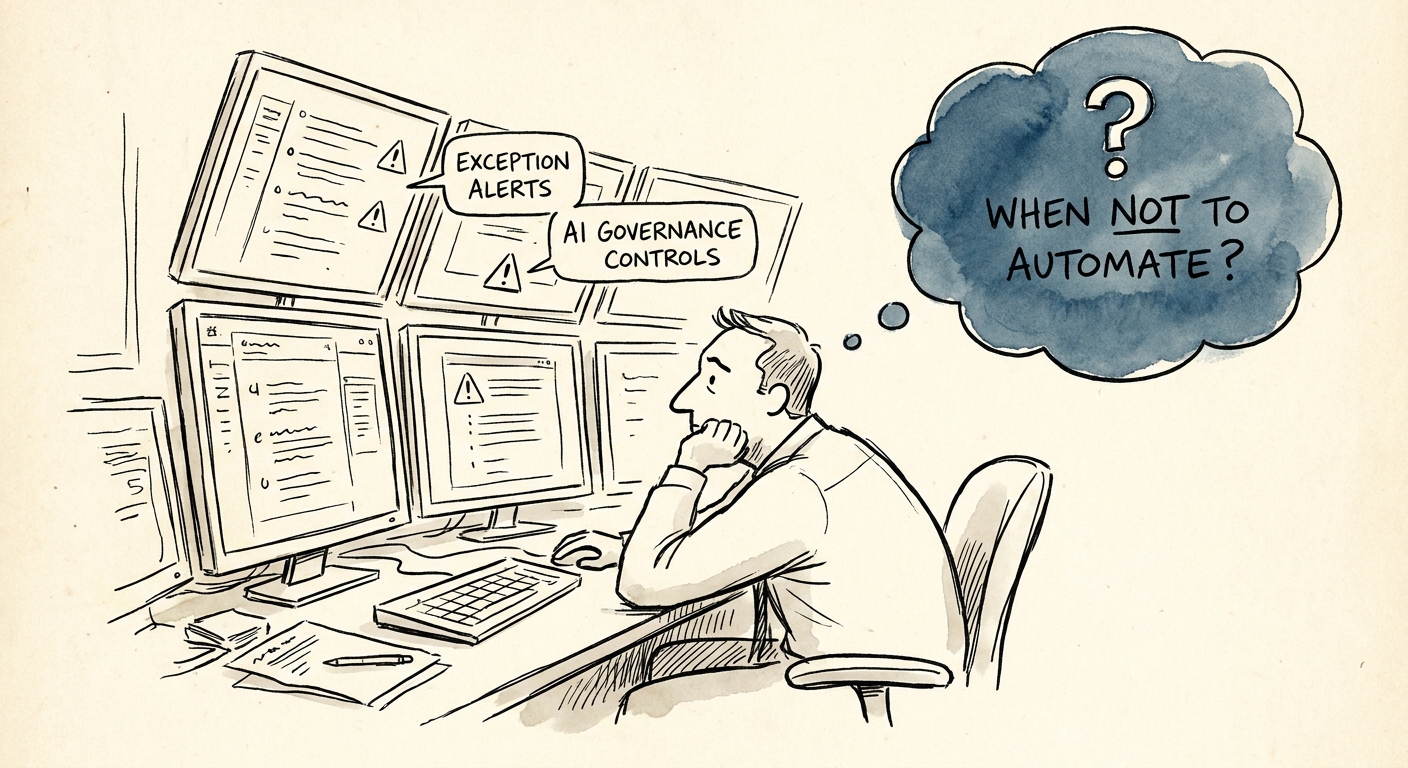
When Not to Automate Document Intake: The Documents That Break AI Pipelines
A new vendor contract, a faxed amendment, a scanned SOW with handwriting in the margin. Here's which documents should never hit a fully automated intake pipeline.
4 intake controls before automation
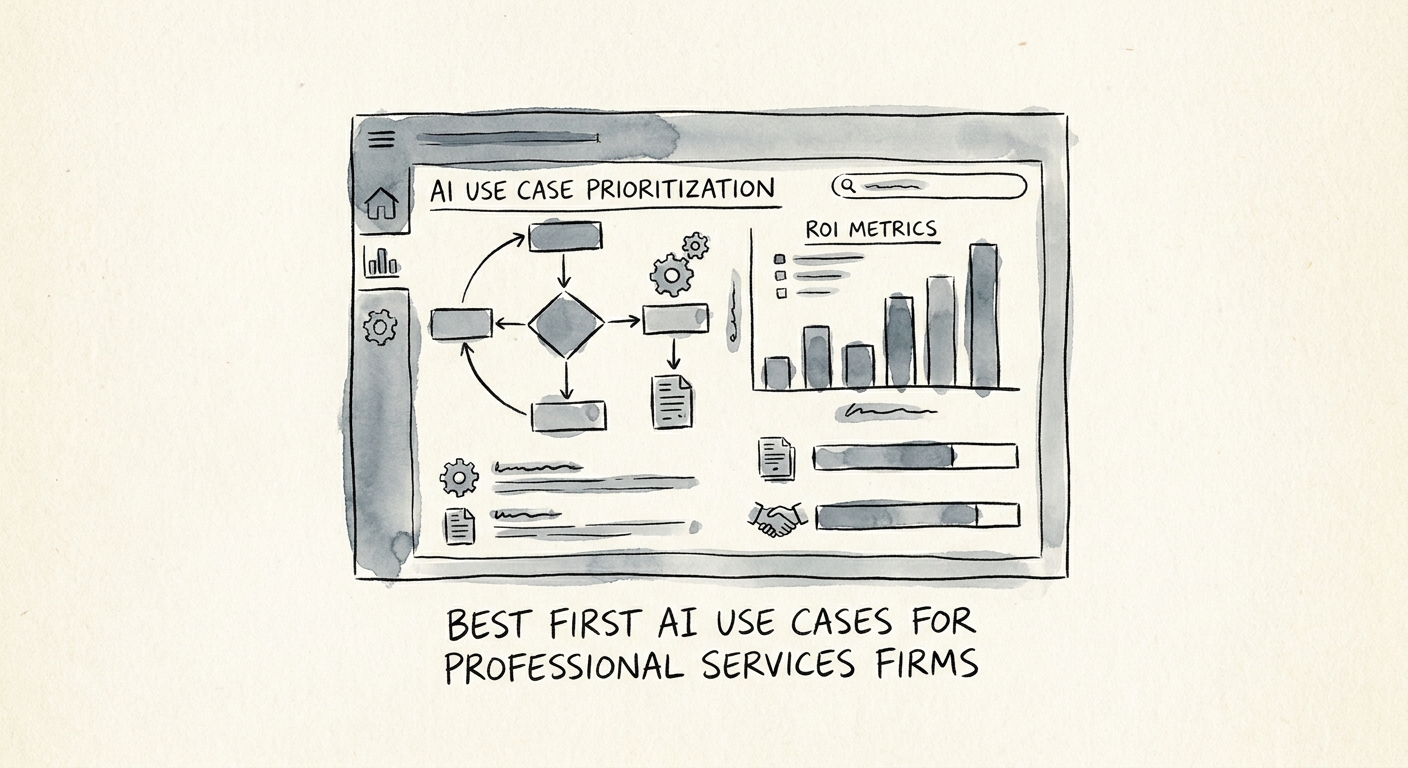
BRIEF · AI INDUSTRY USE CASES
The First AI Use Case That Pays for Itself in a Professional Services Firm
The first AI win in a services firm isn't client-facing. It's the proposal you rebuild every week and the intake that stalls billing. Here's where to start.
3 first AI use-case families for professional services
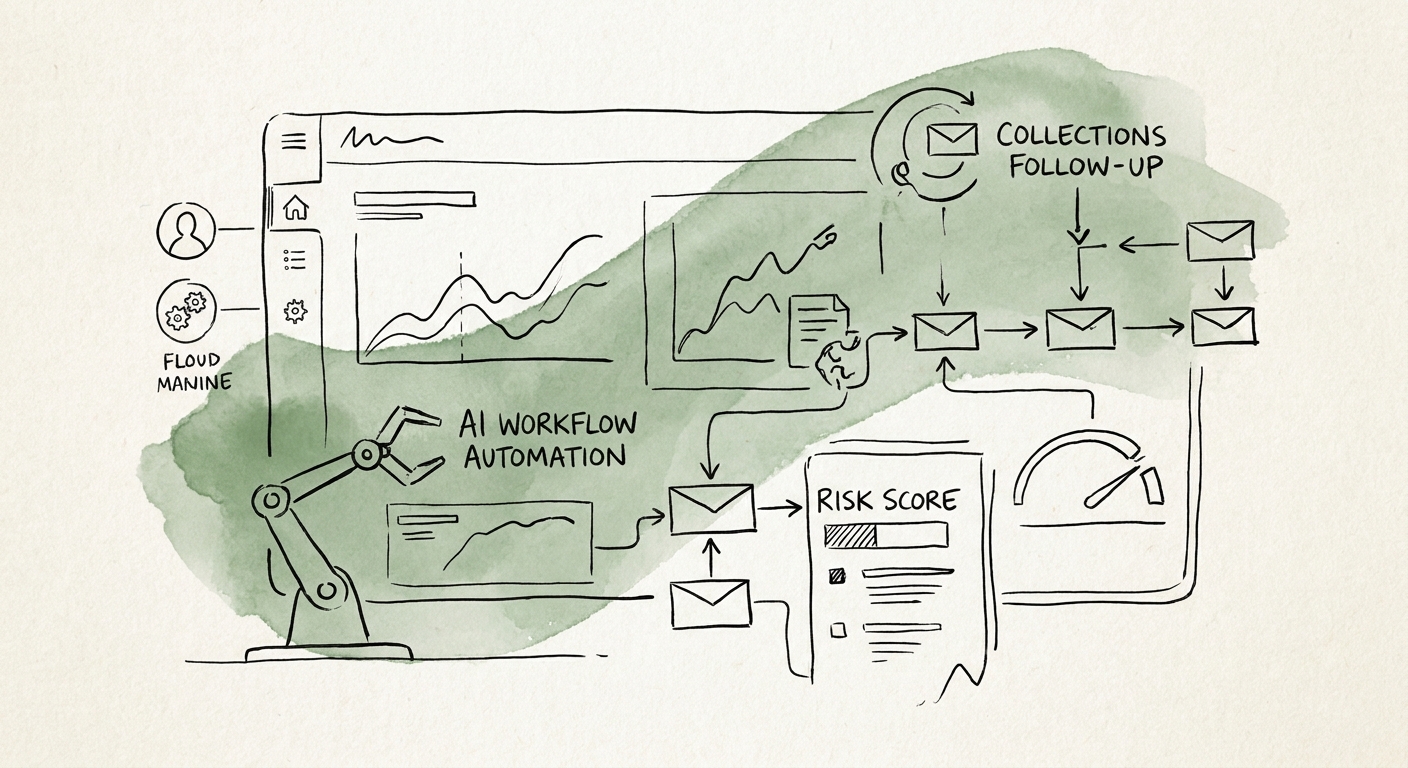
BRIEF · AI WORKFLOW AUTOMATION
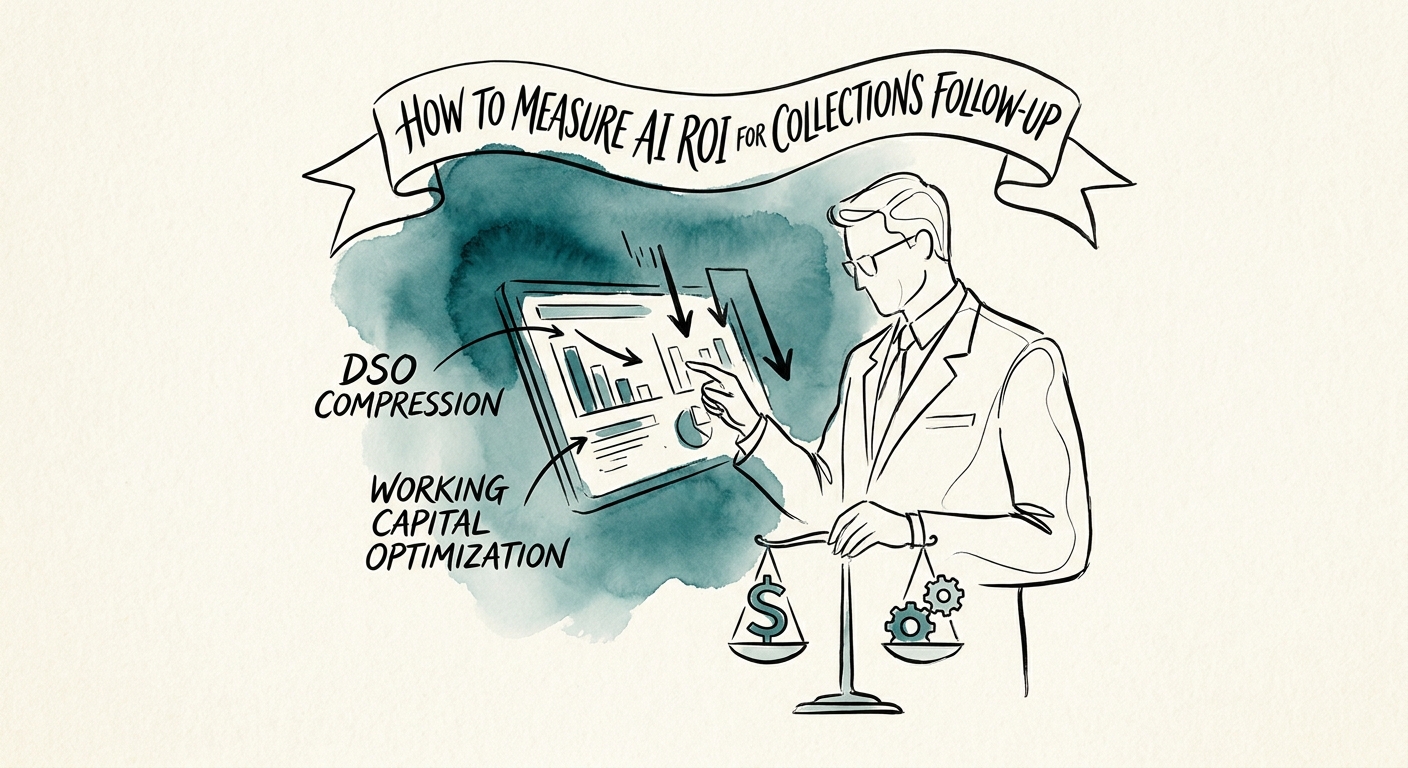
AI for Collections Follow-Up: Cut DSO Without Torching Customer Relationships
How B2B tech firms use AI to prepare collections follow-up, route disputes, and shave days off DSO — without letting a model chase customers on its own.
90 days to prove a collections workflow