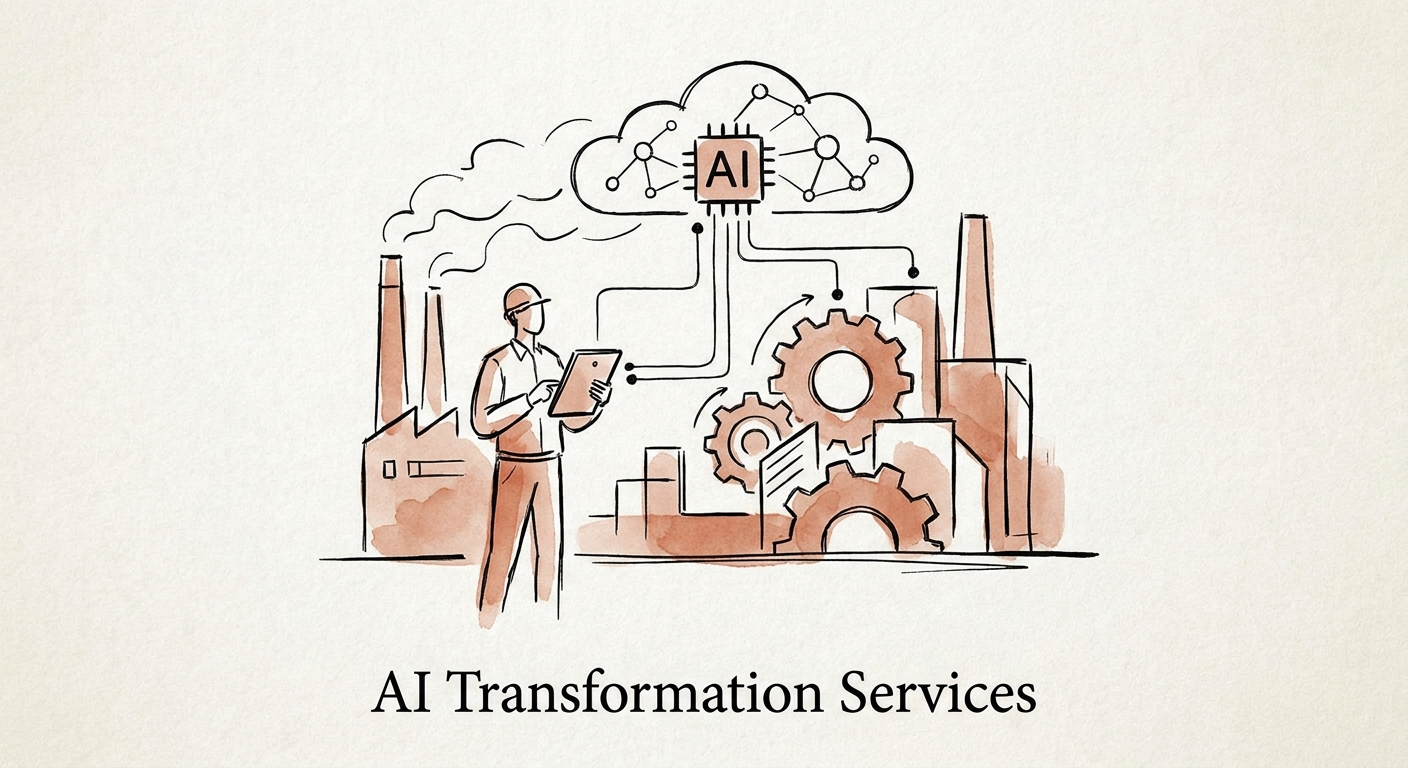
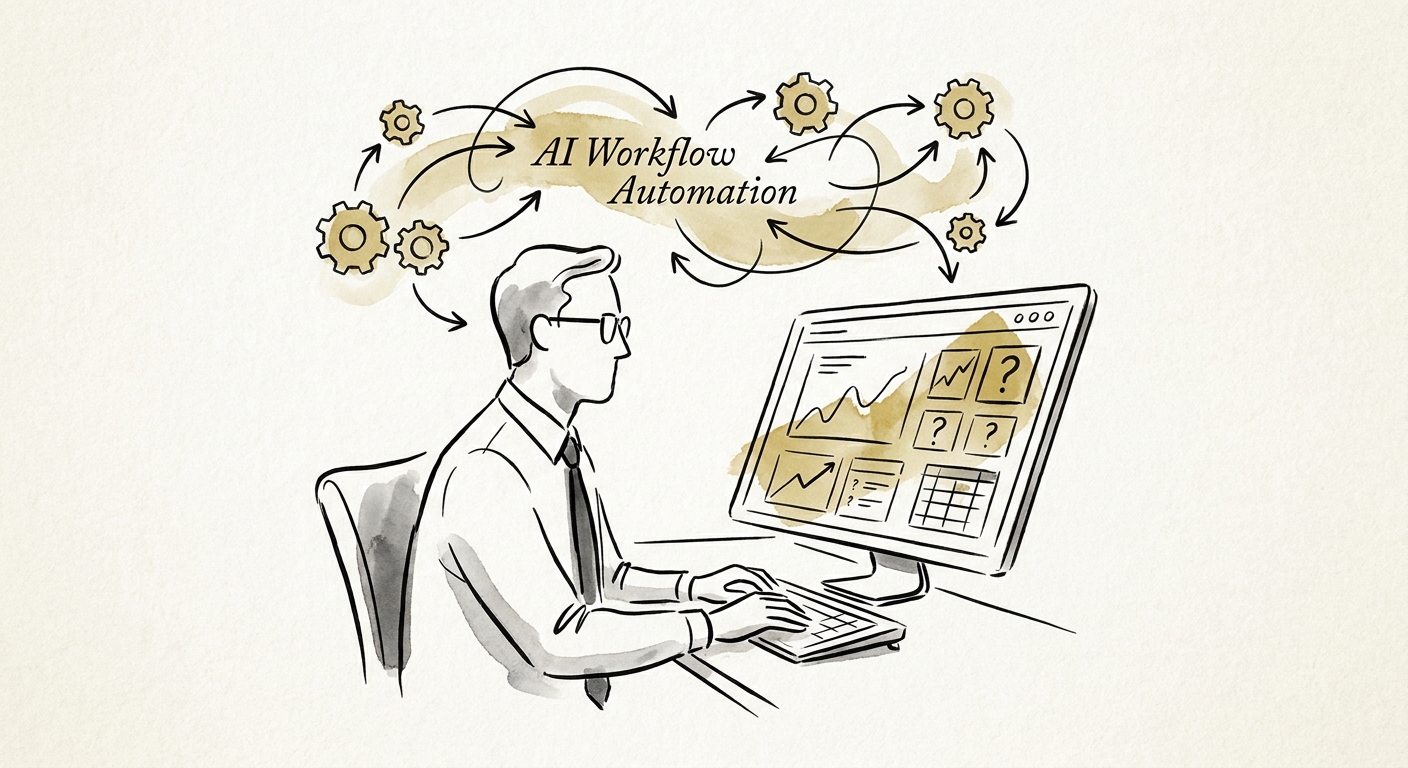
BRIEF · AI WORKFLOW AUTOMATION
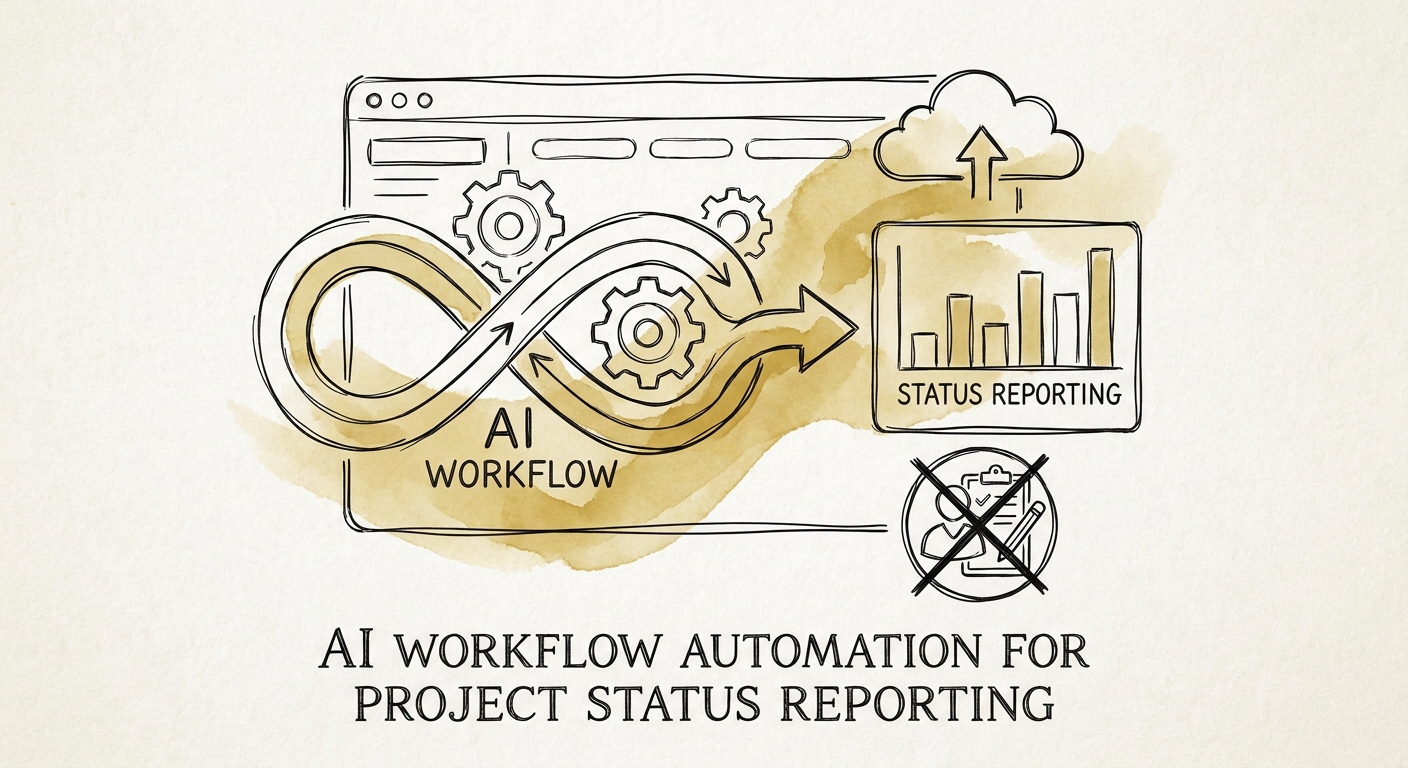
Stop Hand-Building Status Decks: AI Workflow Automation for Project Reporting
The Thursday-night status-deck scramble is a data plumbing problem, not a writing problem. How to automate project reporting without faking confidence.
3 reporting layers to govern
BRIEF · AI INDUSTRY USE CASES
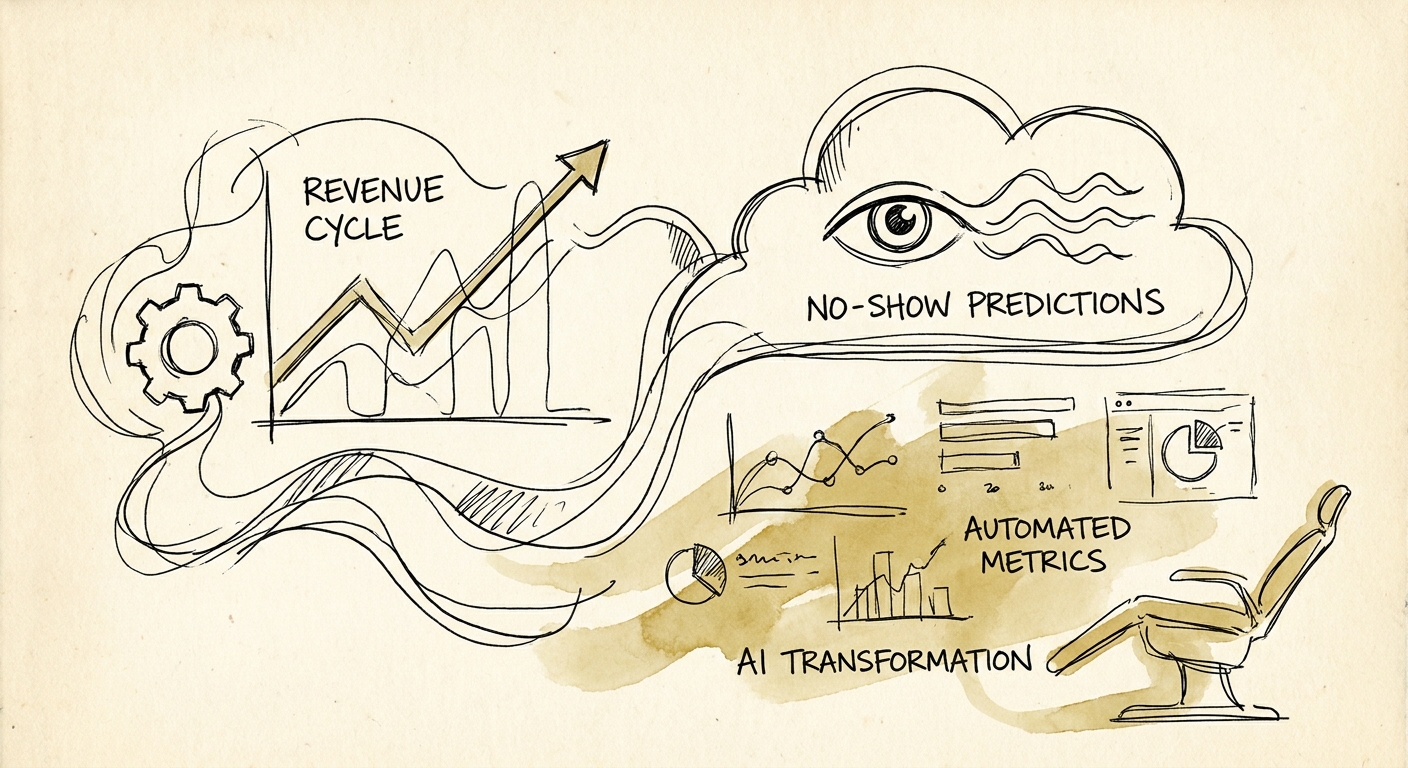
AI for Dental Groups: Fix the Front Desk Before You Touch the Chair
Where multi-location dental groups should actually use AI: insurance verification, recall, scheduling, and chart prep — with clinical judgment kept human.
5 practice workflows to govern before scale
BRIEF · AI MEASUREMENT AND ROI
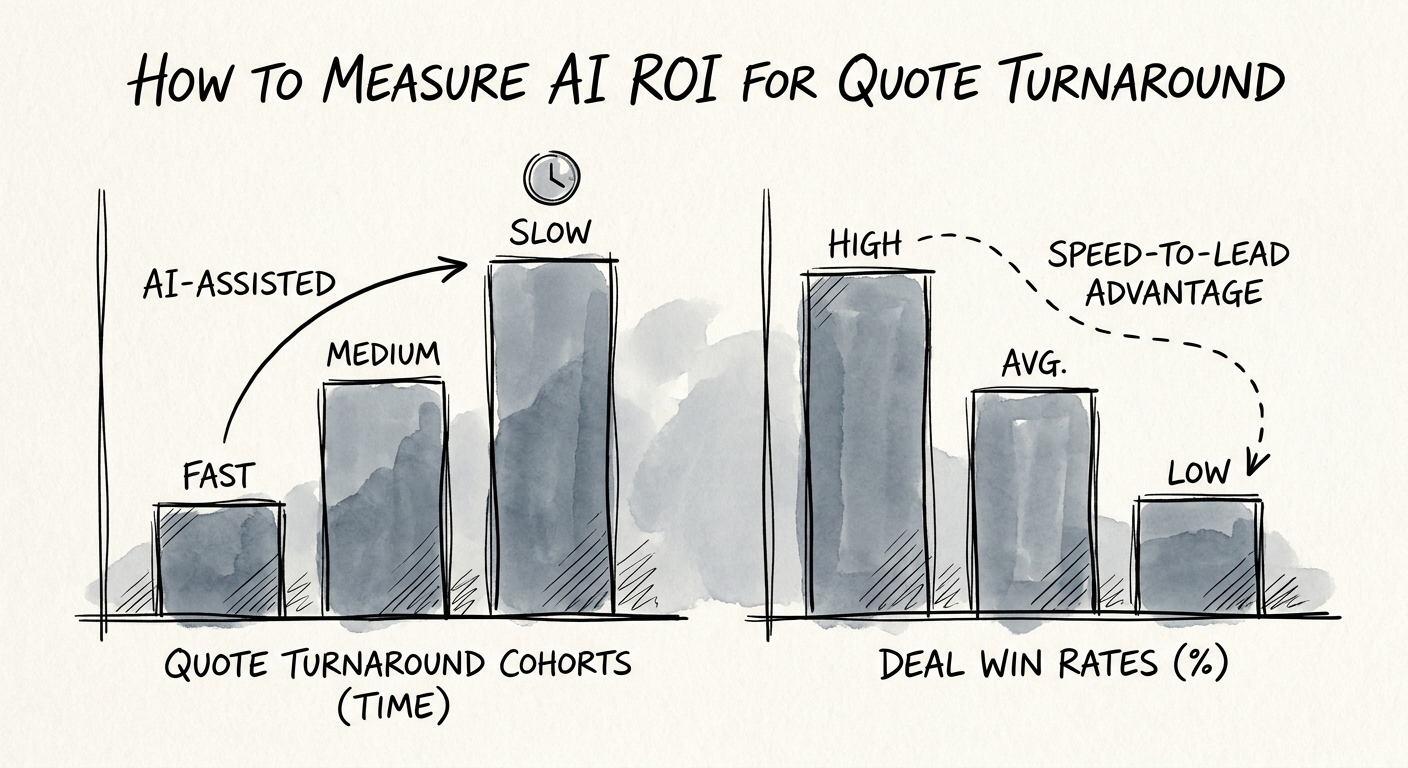
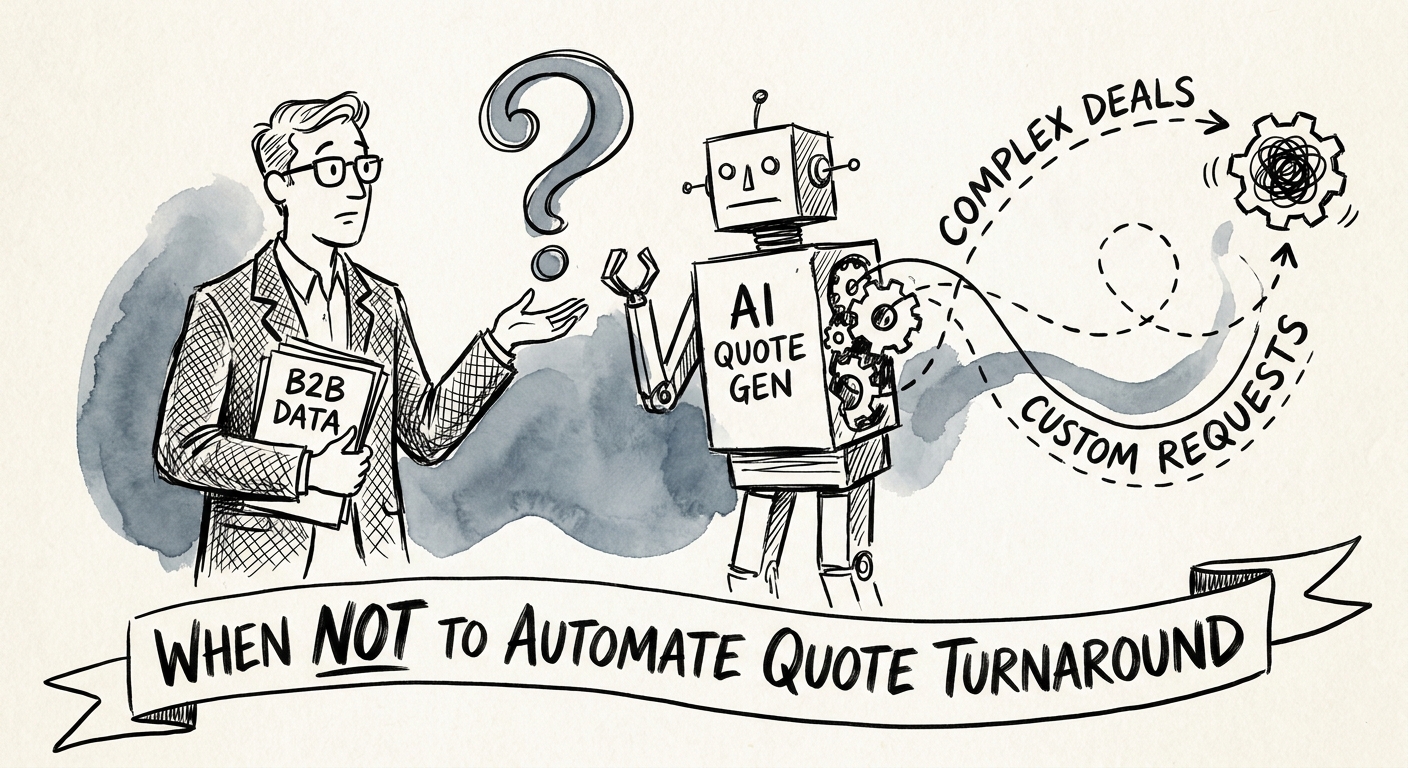
Measuring AI ROI on Quote Turnaround (When Speed Can Quietly Cost You Margin)
A distributor's guide to measuring AI ROI on quotes: not just faster turnaround, but rework, margin discipline, and who still owns the price exception.
30 days to baseline and pilot quote-turnaround AI
BRIEF · AI GOVERNANCE AND TRAINING
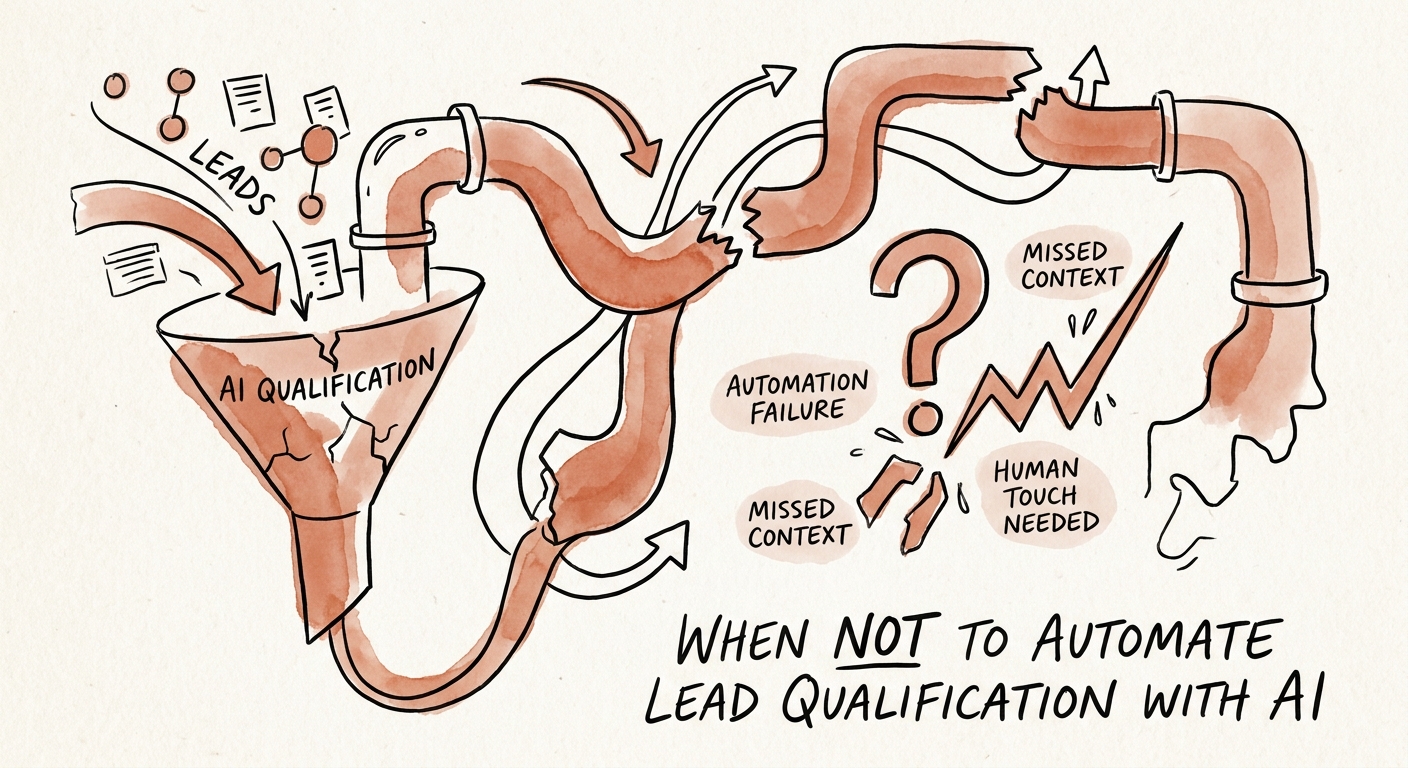
Don't Let AI Disqualify Your Best Lead Because of a Blank Field
The most expensive AI qualification mistake isn't a bad score — it's silently routing a six-figure account into nurture. Here's the line to draw.
4 qualification controls before automation
BRIEF · AI INDUSTRY USE CASES
AI for Manufacturers: Start Where the Line Stops, Not Where the Hype Starts
Where manufacturers should actually point AI first: the exception queue, quality packets, maintenance logs, and planning variances that already cost you throughput.
4 manufacturing workflows to govern first
BRIEF · AI TRANSFORMATION STRATEGY
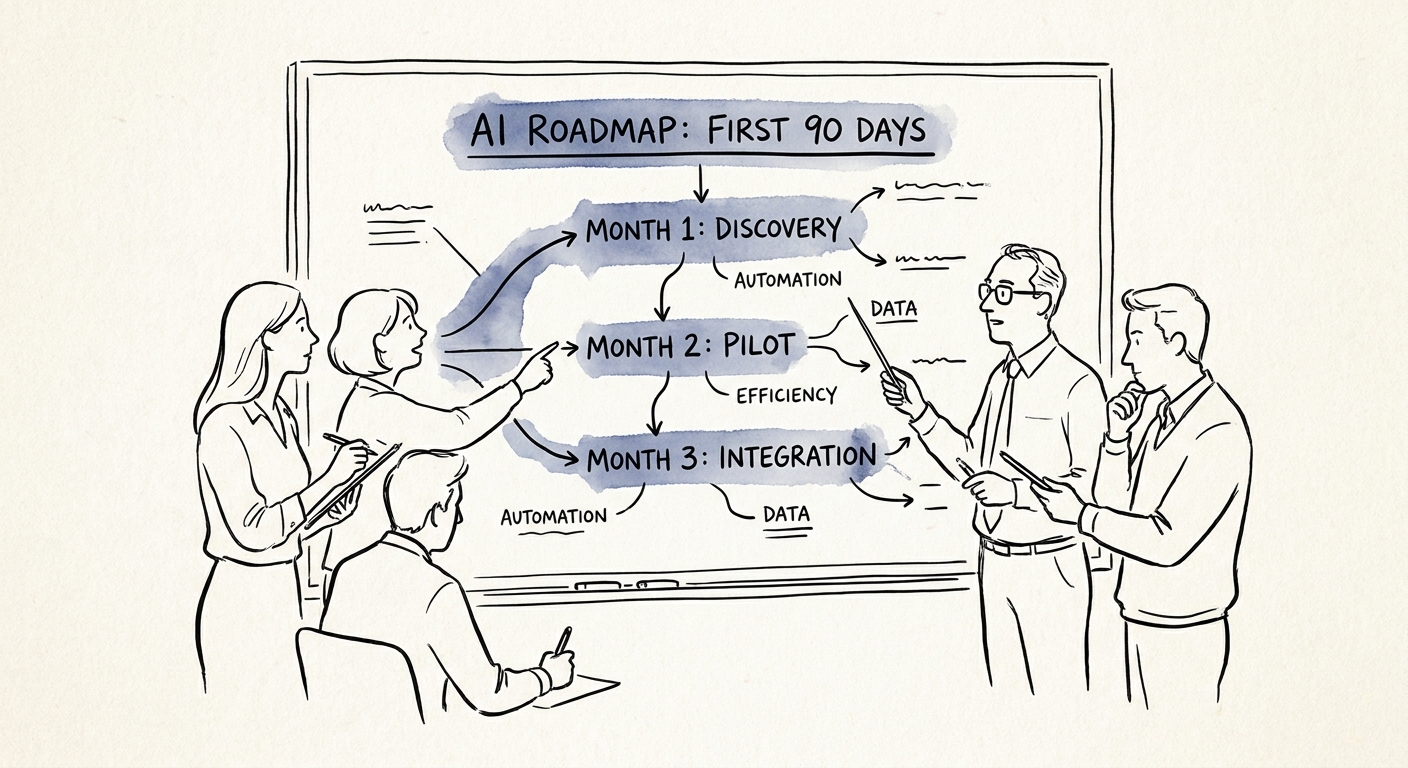
The First 90 Days of AI at a 100-Person Company: One Workflow, Not Ten Pilots
At 100 people, AI fails by spreading too thin. A 90-day plan: map what's already happening, ship one governed workflow, kill it if it doesn't move a number.
90 days from AI governance to one measured workflow
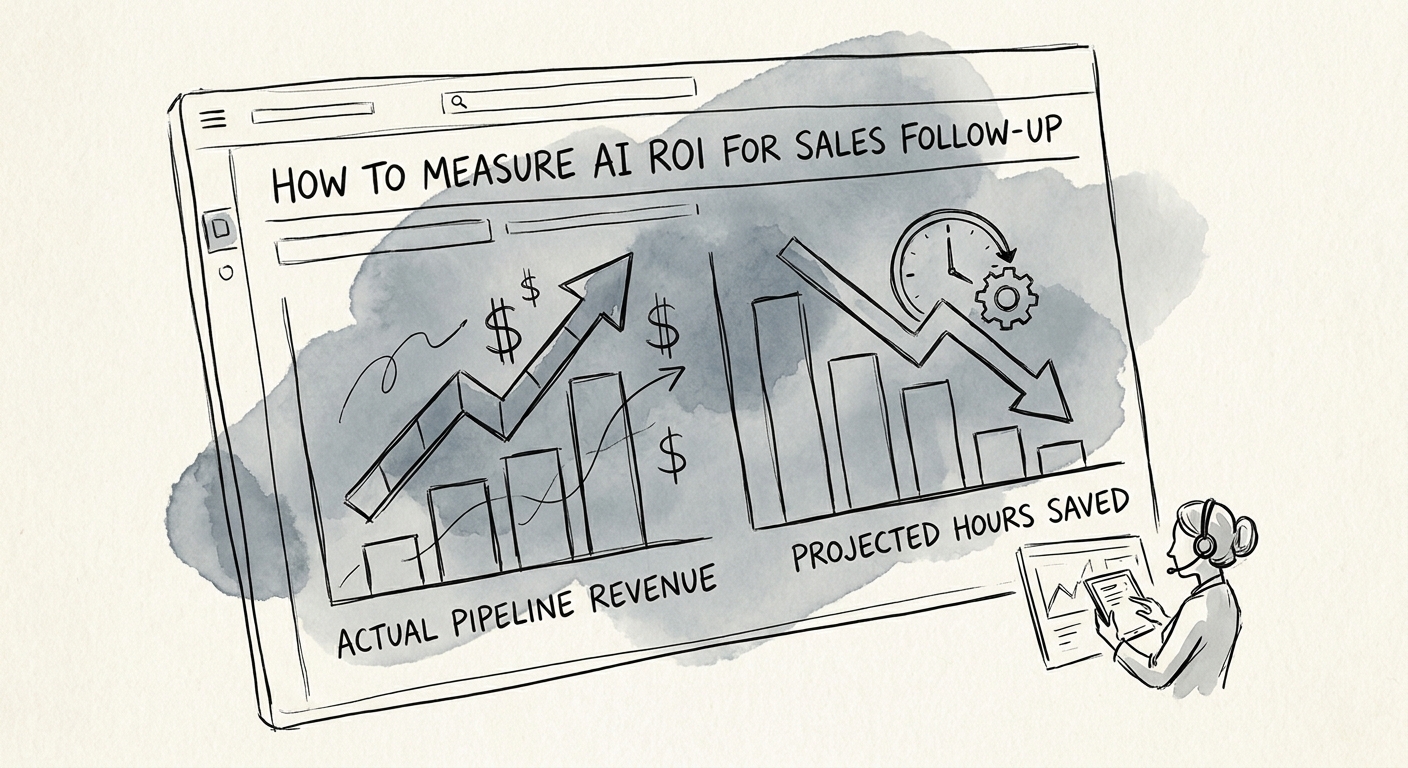
BRIEF · AI MEASUREMENT AND ROI
AI Sent 3x More Sales Follow-Ups. Did Pipeline Move?
Your reps send 3x more AI follow-ups. Here's how to tell if that became qualified pipeline and closed-won margin, or just inbox noise a control group exposes.
4 sales follow-up ROI metrics to track
BRIEF · AI INDUSTRY USE CASES
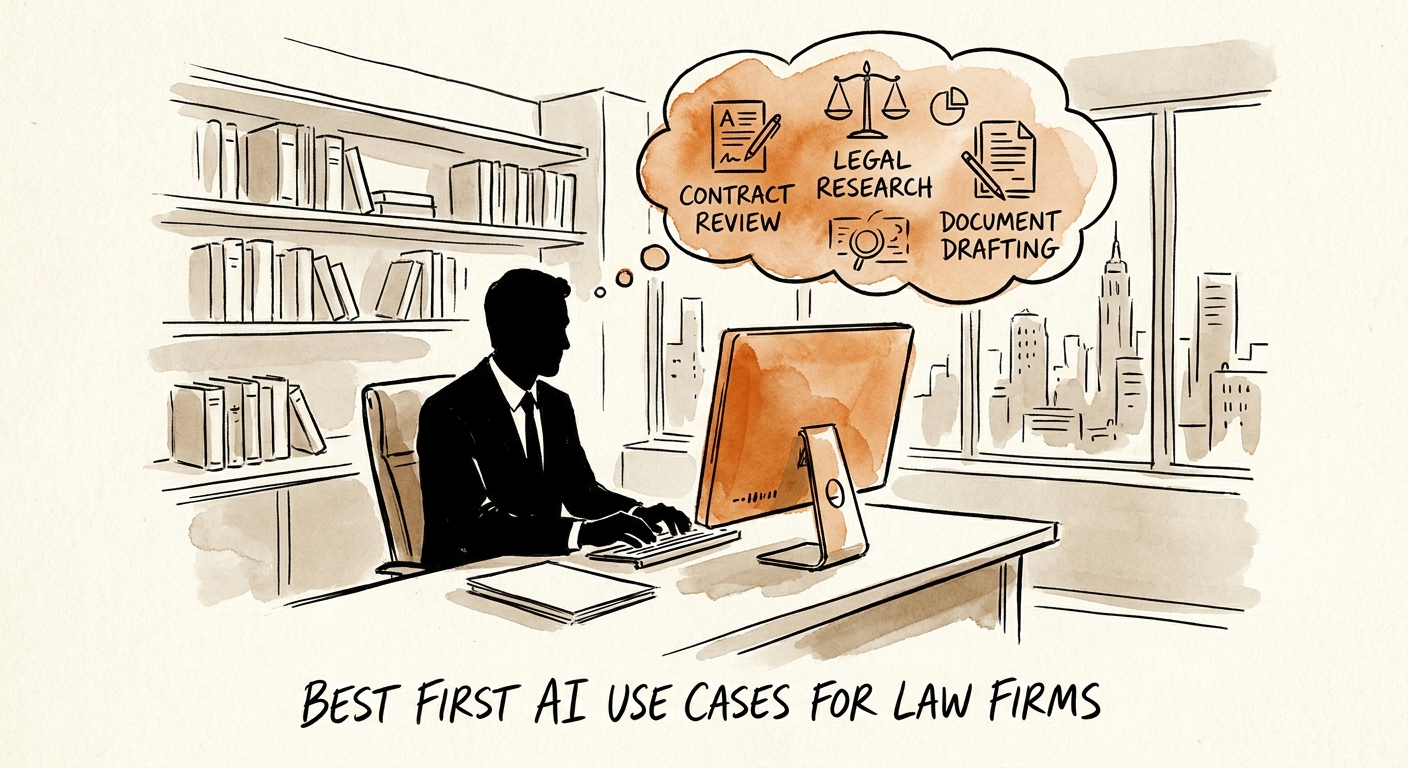
The First AI Use Cases for Law Firms That Don't Touch Legal Judgment
Where law firms should actually start with AI: matter intake, billing narratives, and conflicts prep. The privilege traps to avoid, and how to measure it.
2 safe lanes Two safer AI lanes before drafting automation
BRIEF · AI VENDOR AND BUILD-VS-BUY
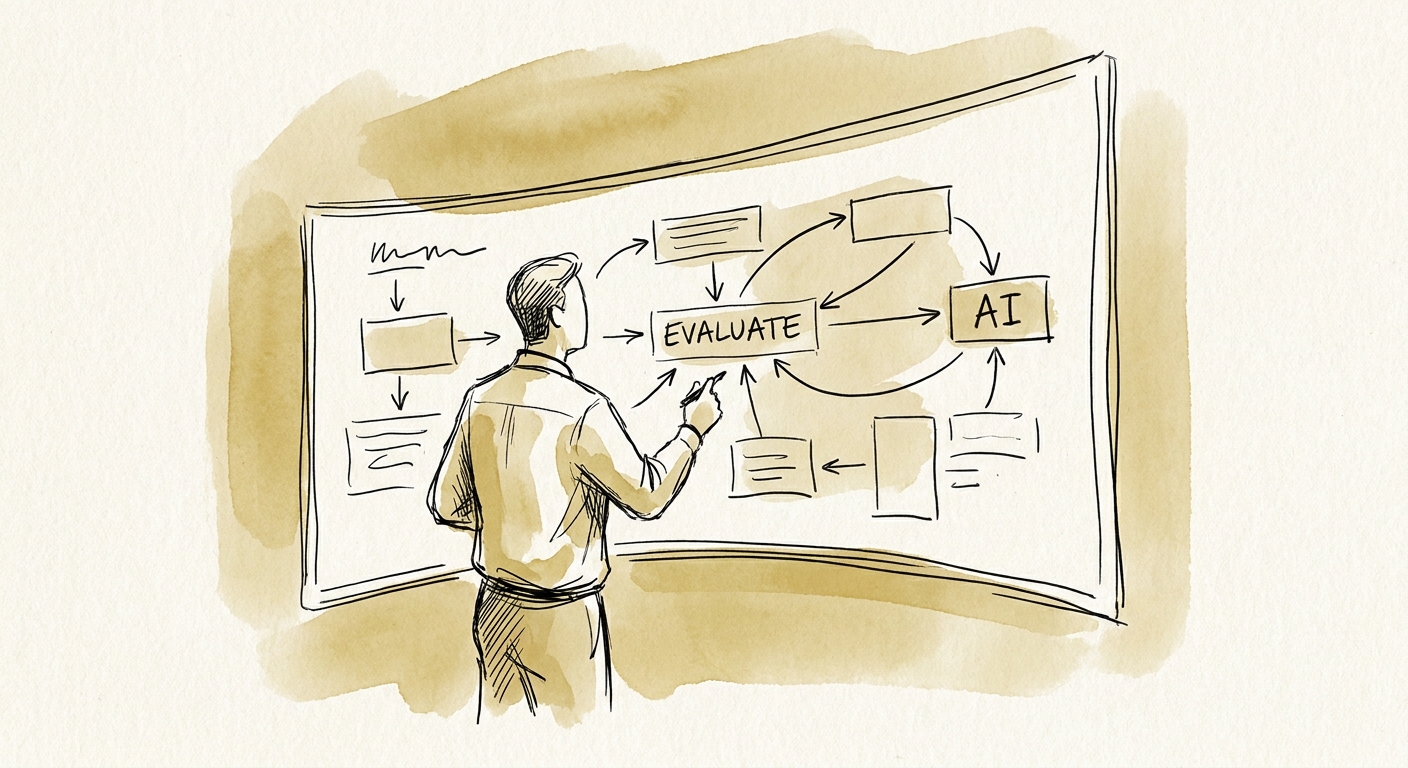
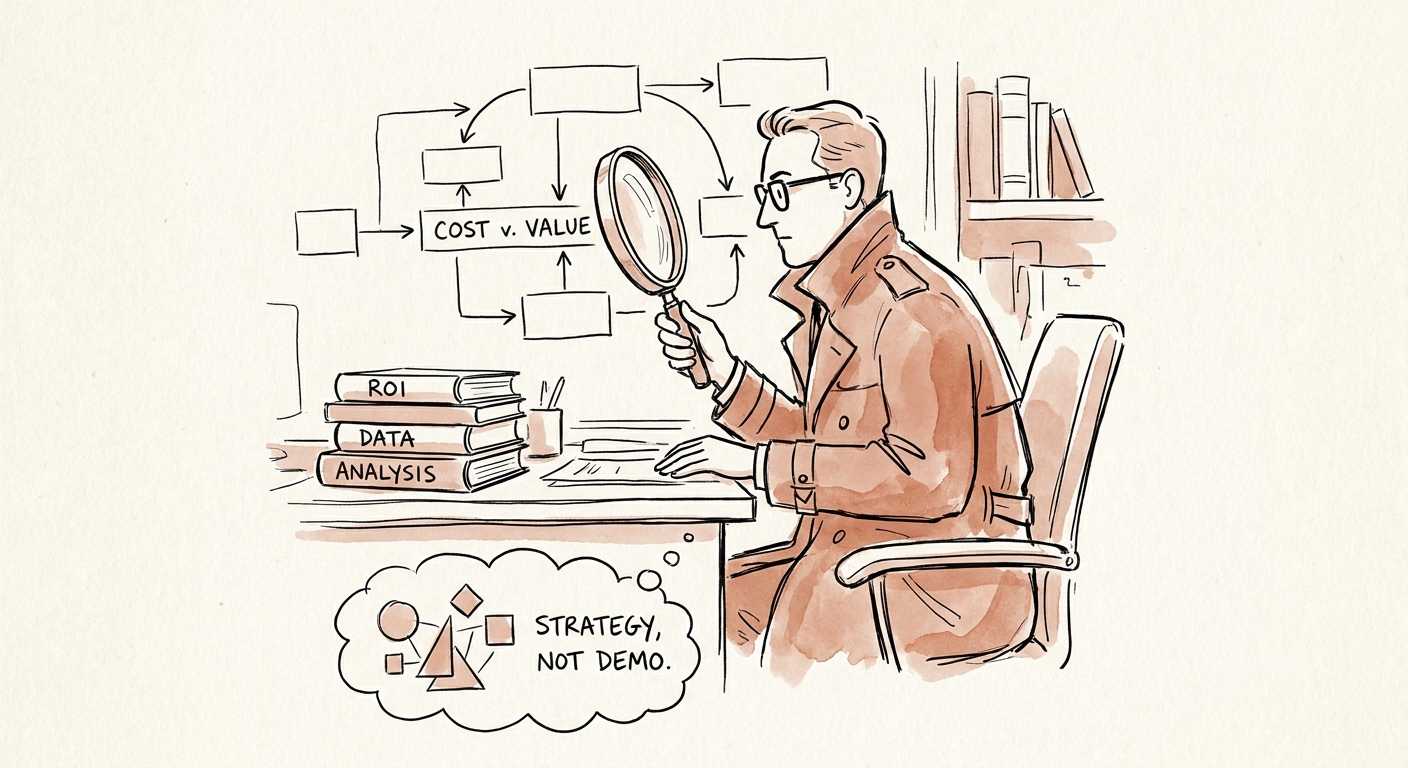
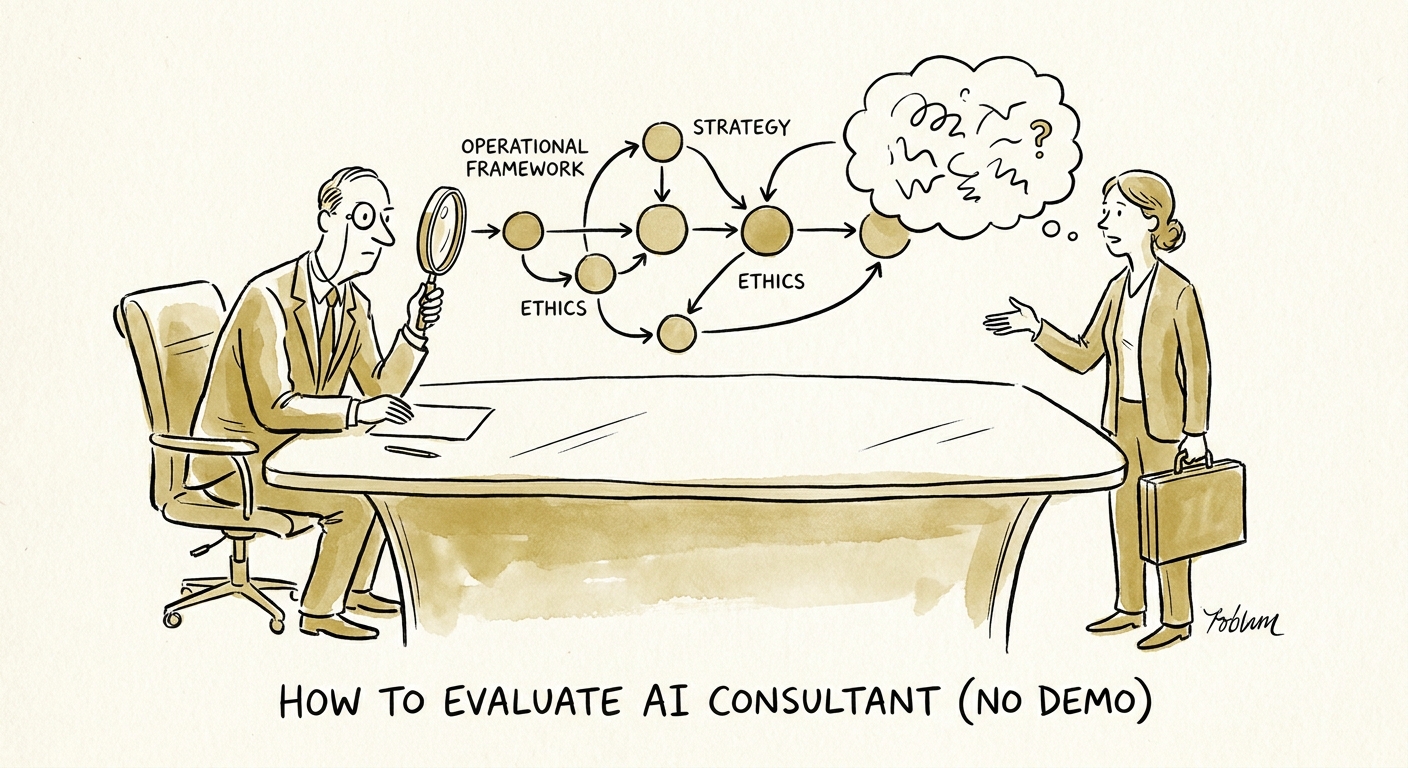
The AI Demo Is a Magic Trick: How to Evaluate the Consultant Behind It
A polished AI demo tells you nothing about delivery. Four questions that reveal whether a consultant can run your workflow in production, before you sign.
4 tests consultant screens before a demo
BRIEF · AI TRANSFORMATION STRATEGY
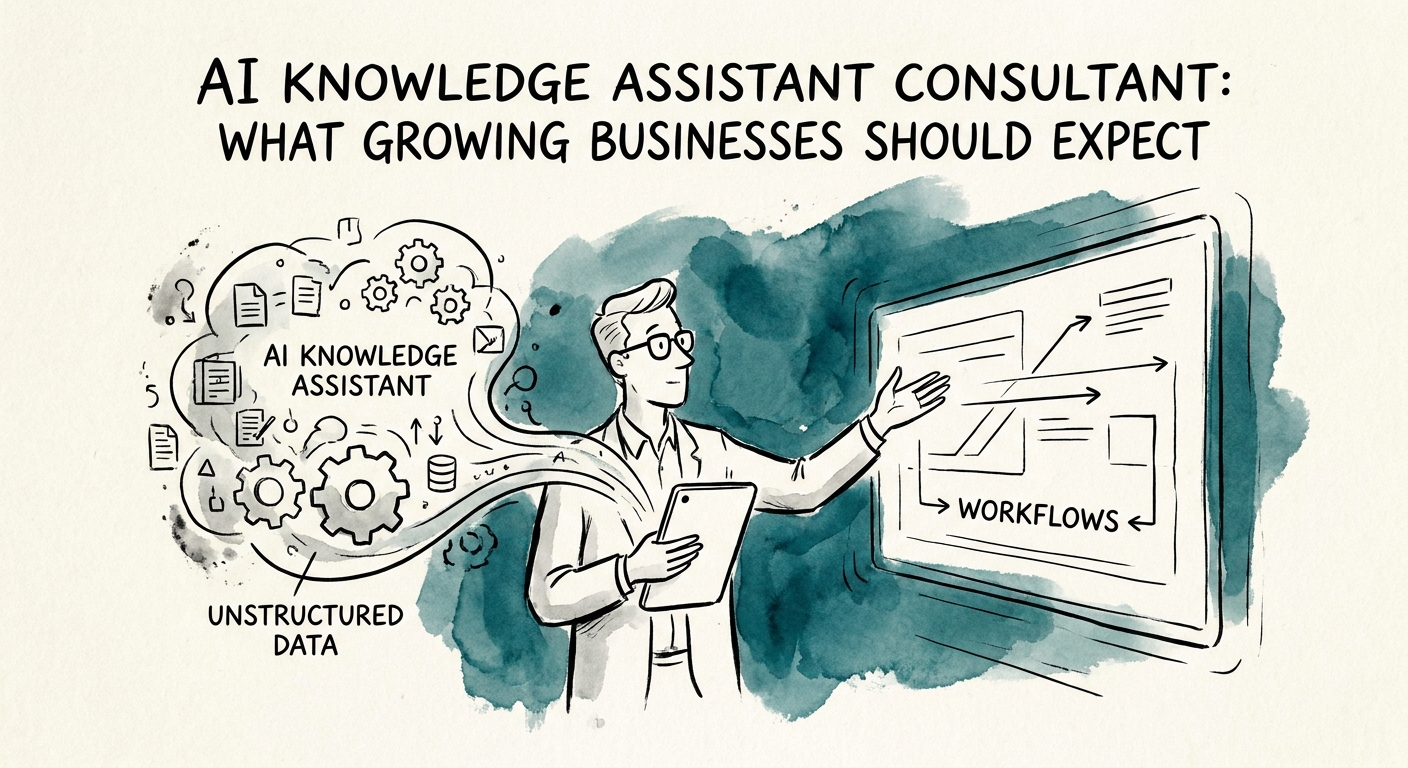
Hiring an AI Knowledge Assistant Consultant: The Questions That Separate Builders From Demo Artists
Most internal AI assistants fail on stale, mis-permissioned documents — not models. Here's what to demand from a knowledge-assistant consultant before you sign.
4 work products a serious knowledge-assistant engagement should produce
BRIEF · AI WORKFLOW AUTOMATION
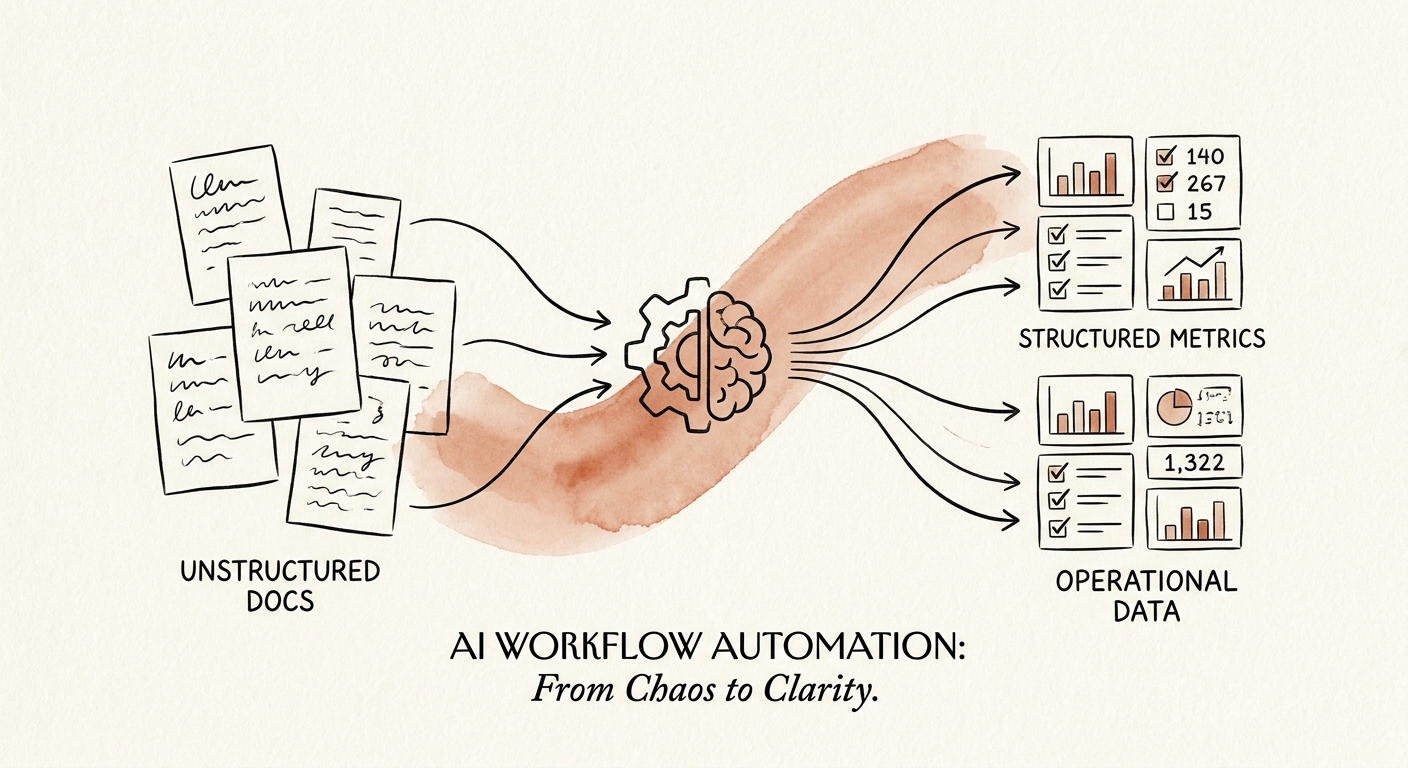
Document Intake Automation ROI: Why the 9% of Files Decide the Math
Most document intake ROI models price the easy files and ignore the messy ones. Here's how to model exception cost, review load, and downstream corrections honestly.
1 document family to automate before scaling
BRIEF · AI GOVERNANCE AND TRAINING
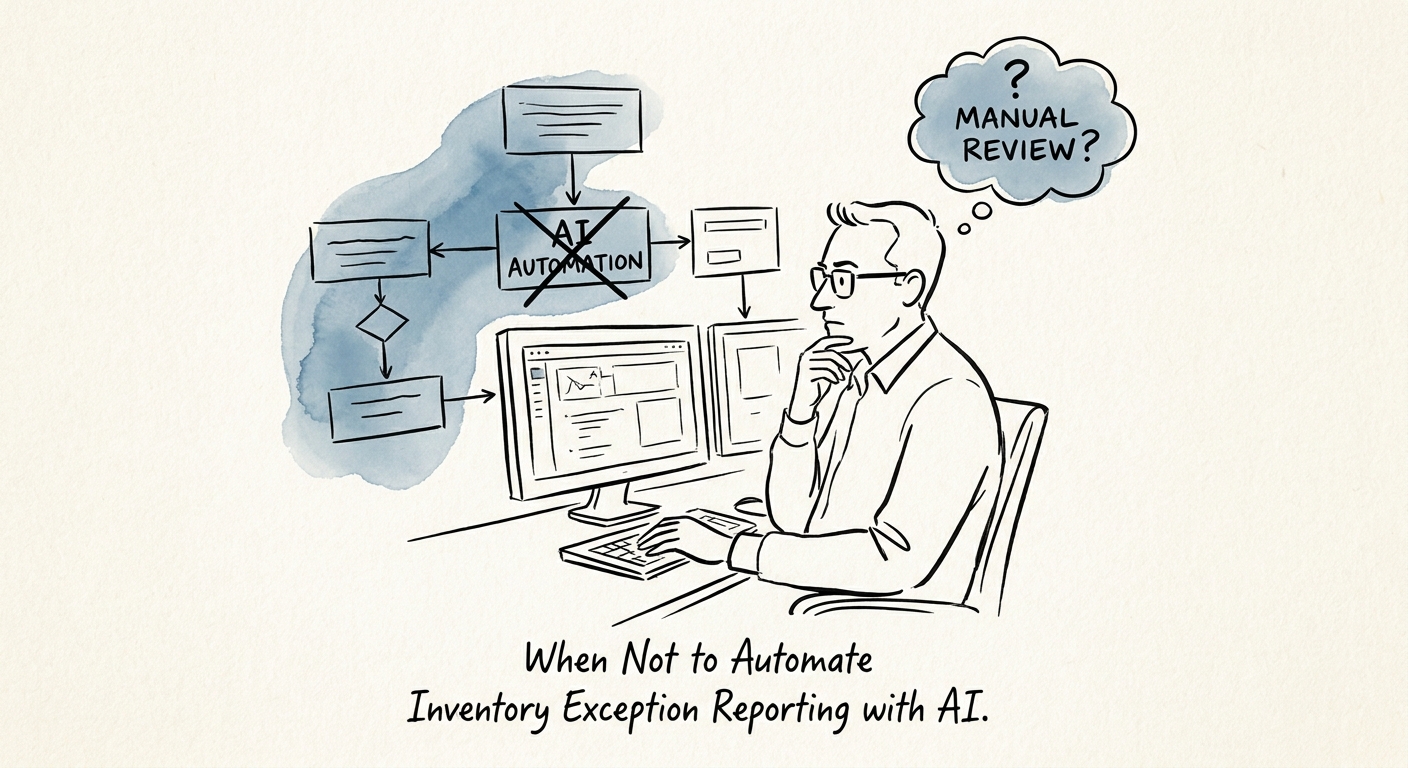
When AI Inventory Exception Reports Just Hide the Counting Problem
If bin counts and lot data drift, AI exception reporting just narrates the drift faster. Where to stop automation in a warehouse, and the metrics that prove it.
4 inventory controls before automation
BRIEF · AI VENDOR AND BUILD-VS-BUY
The AI Demo Was Flawless. The Quote Was One Number. Here's What to Ask Next.
A polished AI demo tells you nothing about cost. Here is how a CFO reads an AI consulting proposal by scope, data readiness, governance, adoption, and measurement.
6 cost drivers to compare
BRIEF · AI TRANSFORMATION STRATEGY
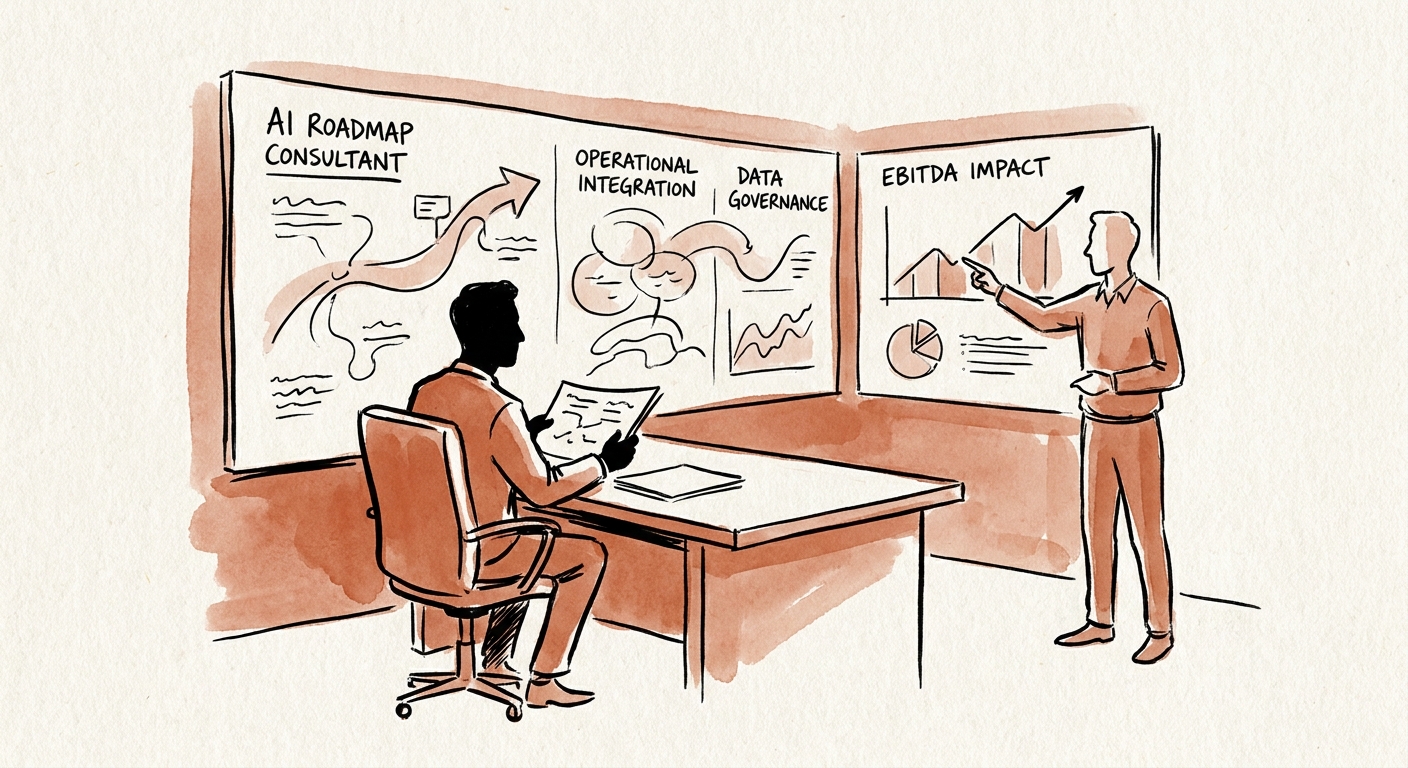
How to Tell an AI Roadmap From an Expensive Slide Deck
A real AI roadmap names the first workflow, the owner, the risk boundary, and the metric. Five tests to run on any consultant before you sign.
5 roadmap tests before implementation
BRIEF · AI INDUSTRY USE CASES
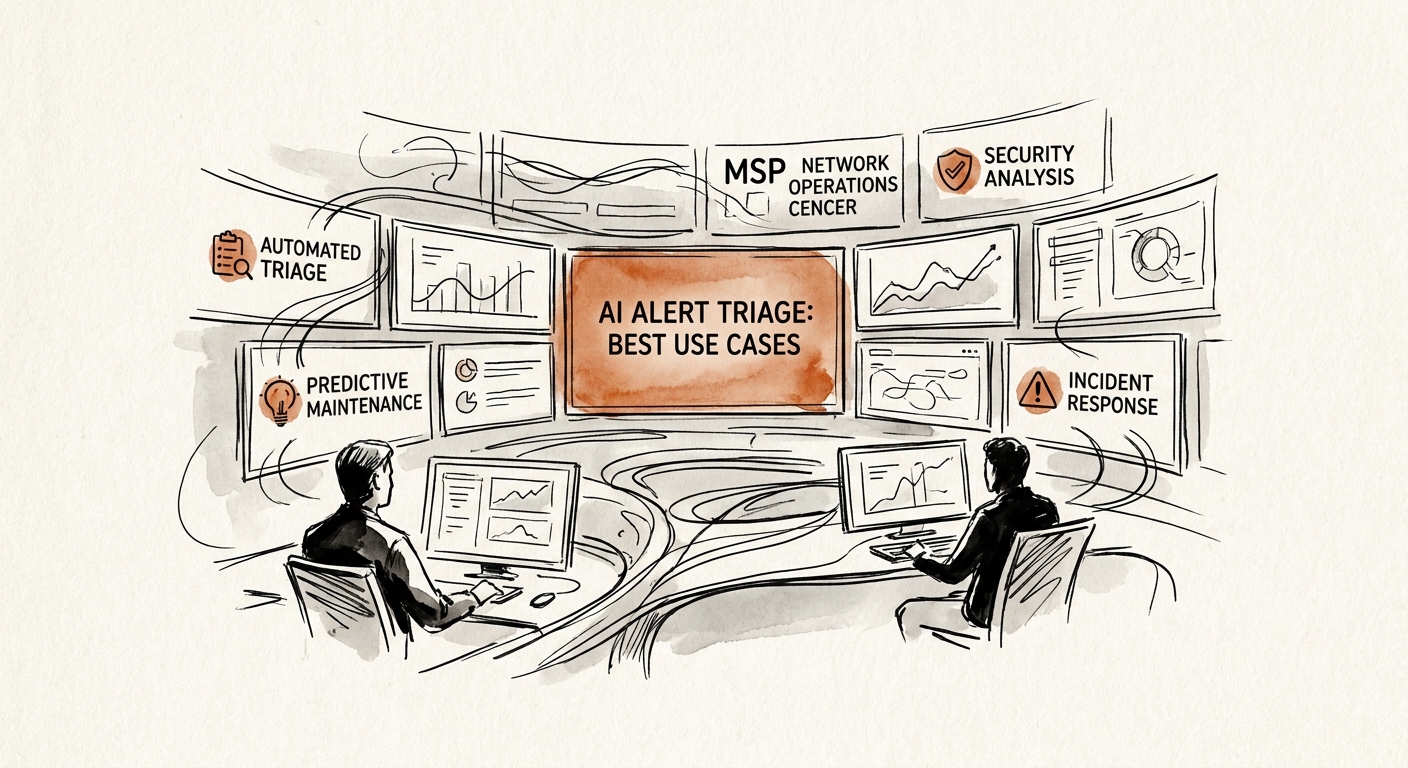
The First AI Use Cases an MSP Should Actually Ship (Start at the Escalation Handoff)
The MSP handoff between L1 and L2 leaks context every time. Here are the five AI use cases to ship first — triage, summaries, retrieval, reporting, escalation prep.
5 MSP workflows to evaluate first
BRIEF · AI MEASUREMENT AND ROI
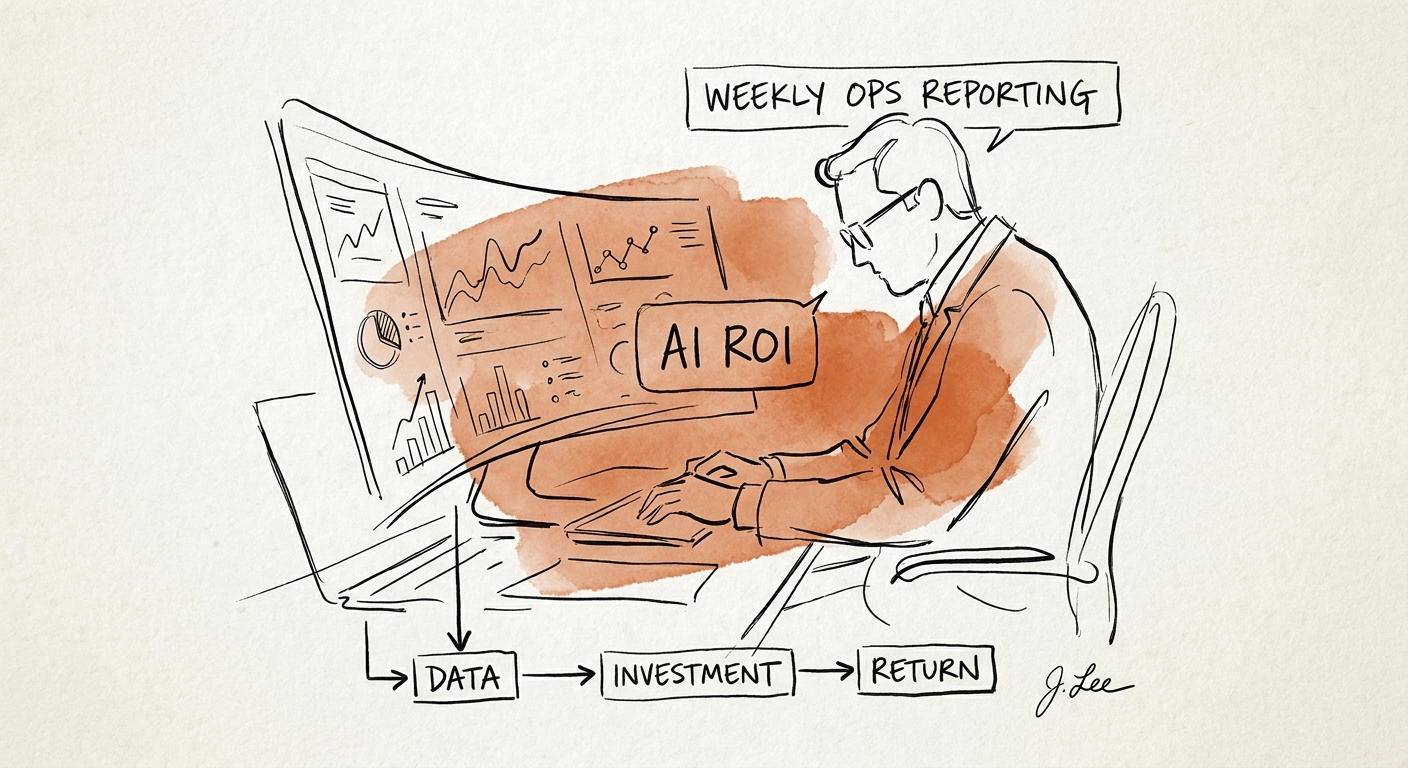
Measuring AI ROI on the Weekly Ops Report: Watch the Meeting, Not the Deck
The weekly ops report's ROI lives in the Monday meeting, not the slide build. Five measures that prove AI tightened the cadence instead of speeding up busywork.
5 measures needed for weekly operations reporting ROI
BRIEF · AI WORKFLOW AUTOMATION
The Planner Has 200 Inventory Alerts and Time to Act on Six: AI Workflow Automation for Exception Reporting
A planner can't act on 200 inventory alerts a day. Here's how to use AI to rank exceptions by what they cost you, with the source evidence attached and a human approving every order.
1 exception queue to govern first
BRIEF · AI GOVERNANCE AND TRAINING
The Quote Bot That Gave Away Your Margin: Where to Stop Automating
AI can cut quote turnaround from days to minutes. The line you cross at your peril: letting it set price, scope, or delivery dates. Where to draw it.
4 quote controls before automation
BRIEF · AI VENDOR AND BUILD-VS-BUY
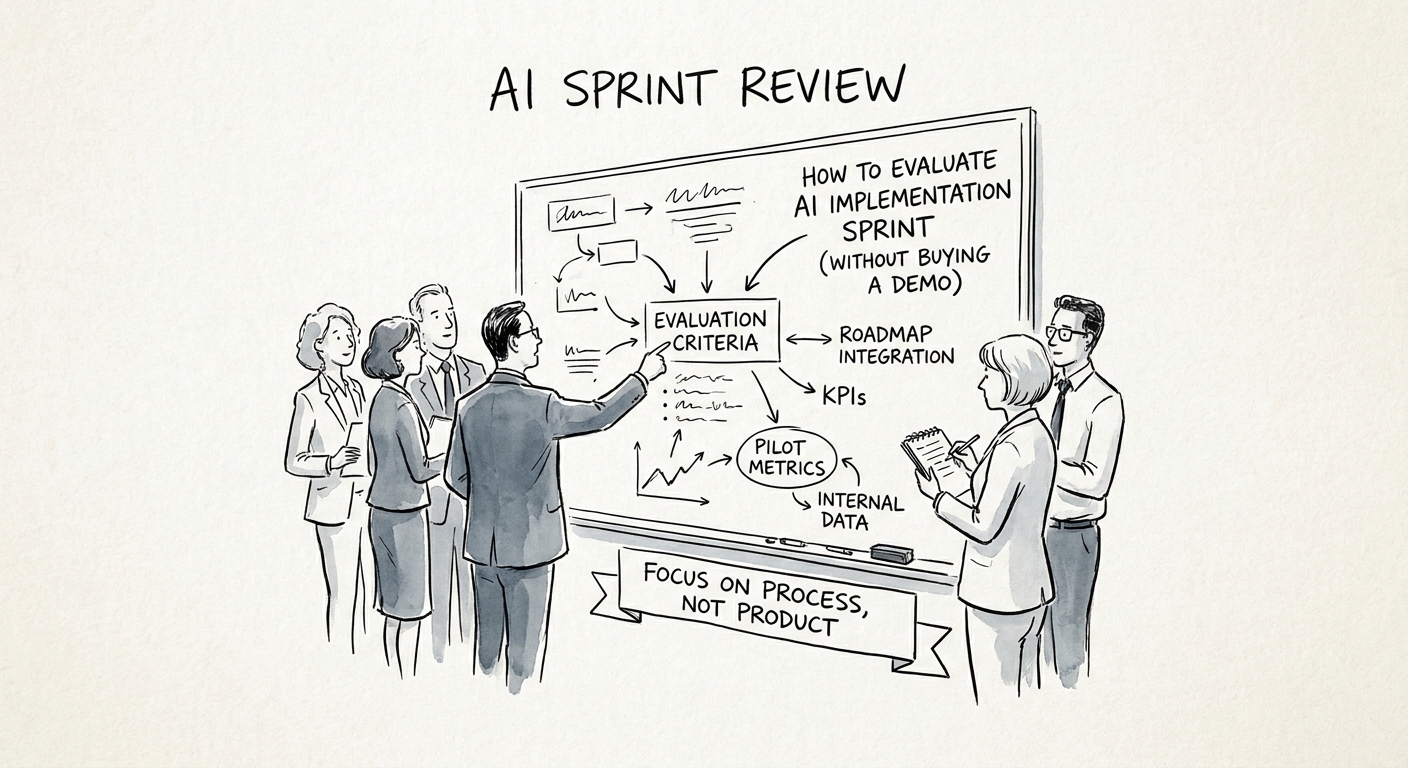
The Demo Was Flawless. The Sprint Will Tell You If It Was Real.
A vendor demo runs on clean data and a happy path. Here's how to evaluate a paid AI implementation sprint by what it exposes, not what it performs.
5 sprint gates to review
BRIEF · AI TRANSFORMATION STRATEGY
The 10-Person AI Roadmap: One Workflow, 90 Days, No IT Department
A 10-person team has no IT department to absorb a bad AI rollout. Here's the 90-day roadmap that fixes one workflow without creating new risk.
1 workflow to prove first
BRIEF · AI VENDOR AND BUILD-VS-BUY
How to Evaluate an AI Agent Consultant When the Demo Tells You Nothing
A demo proves the agent works in a sandbox. Here are the six controls to inspect that prove it will work against your real data, permissions, and edge cases.
6 agent controls to inspect
BRIEF · AI WORKFLOW AUTOMATION
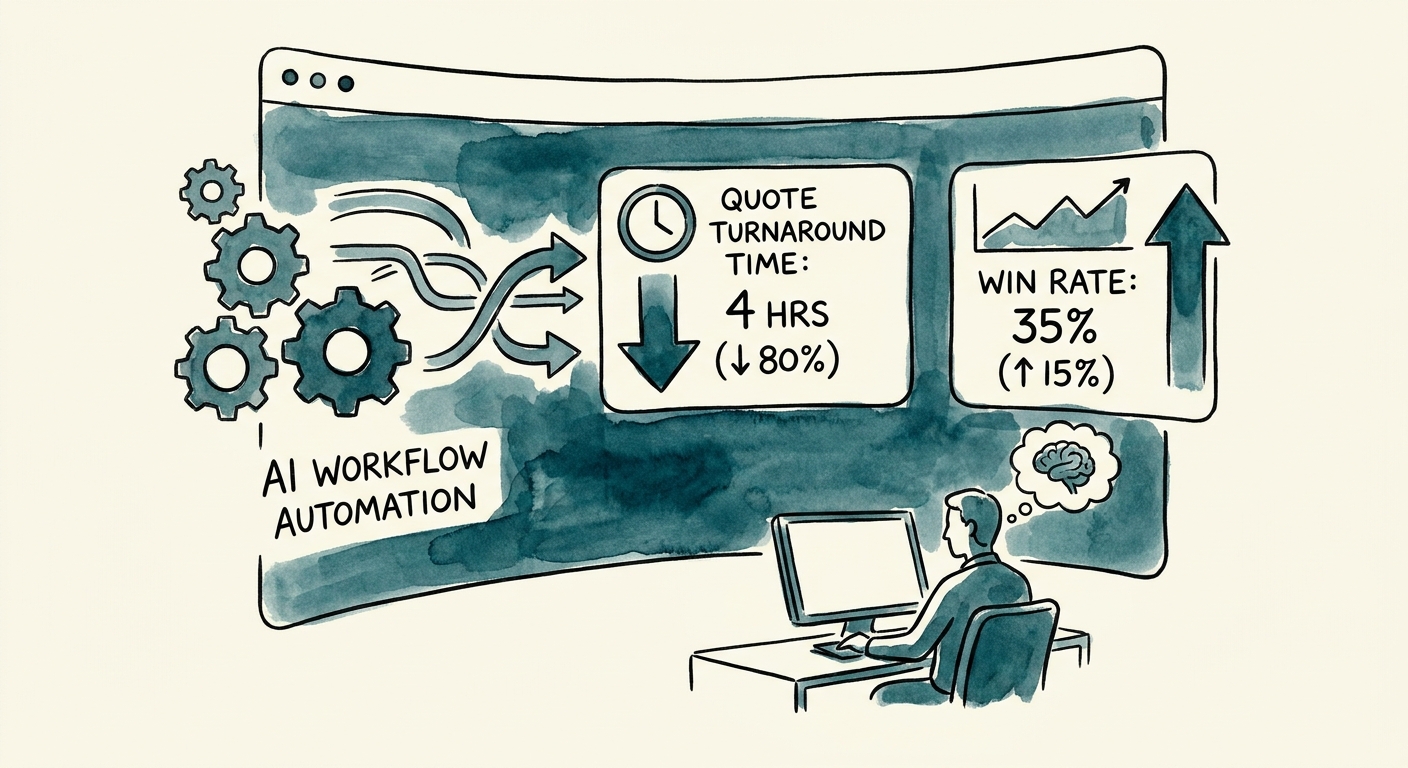
Cut Quote Turnaround From Nine Days to One Without Quietly Eroding Your Margin
Most B2B quote delays aren't pricing problems — they're coordination problems. How to use AI to compress quote turnaround while keeping margin discipline.
4 quote workflow inputs to govern
BRIEF · AI MEASUREMENT AND ROI
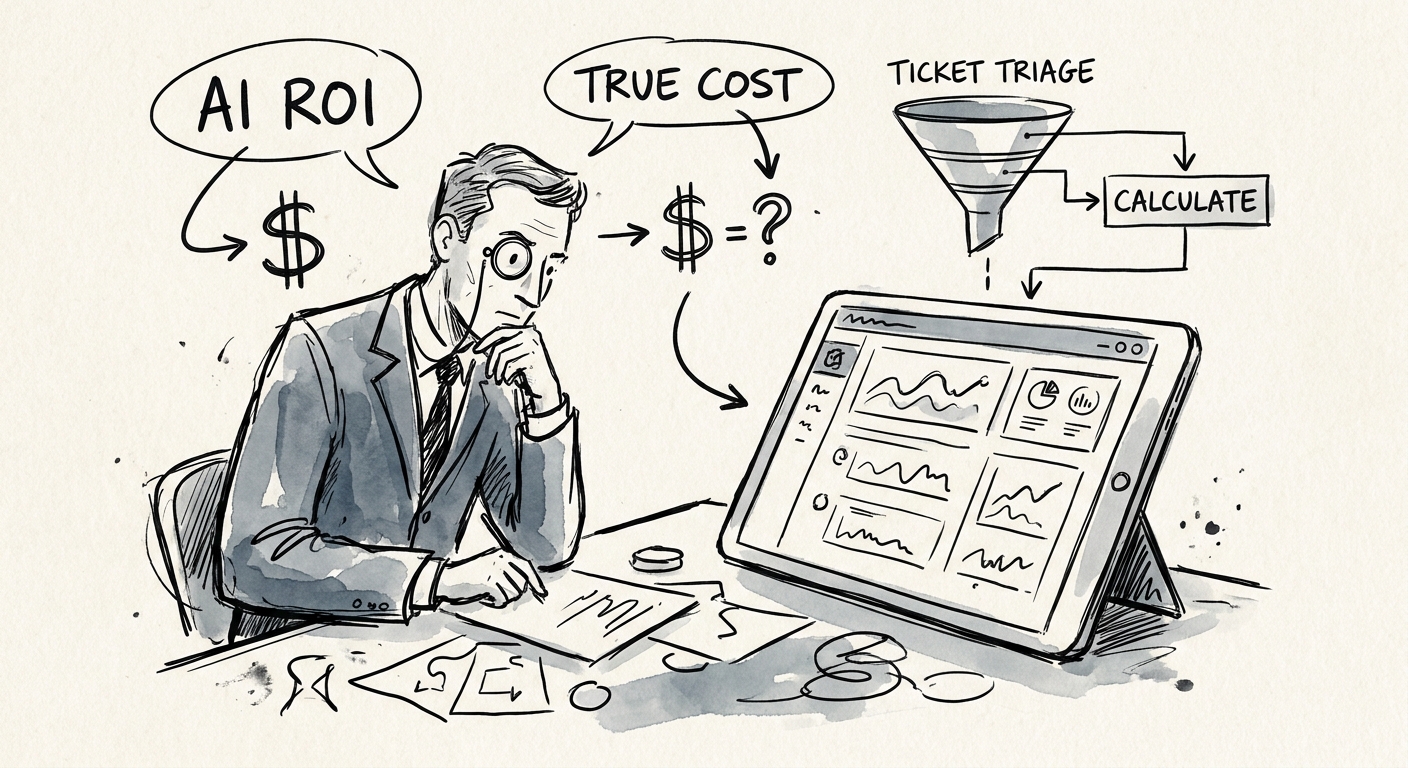
The Real ROI of AI Ticket Triage Is Measured in Misroutes, Not Minutes
Handle time tells you nothing about AI ticket triage ROI. Here are the five queue behaviors that actually prove value—or expose a model quietly creating risk.
5 measures needed for customer ticket triage ROI
BRIEF · AI INDUSTRY USE CASES
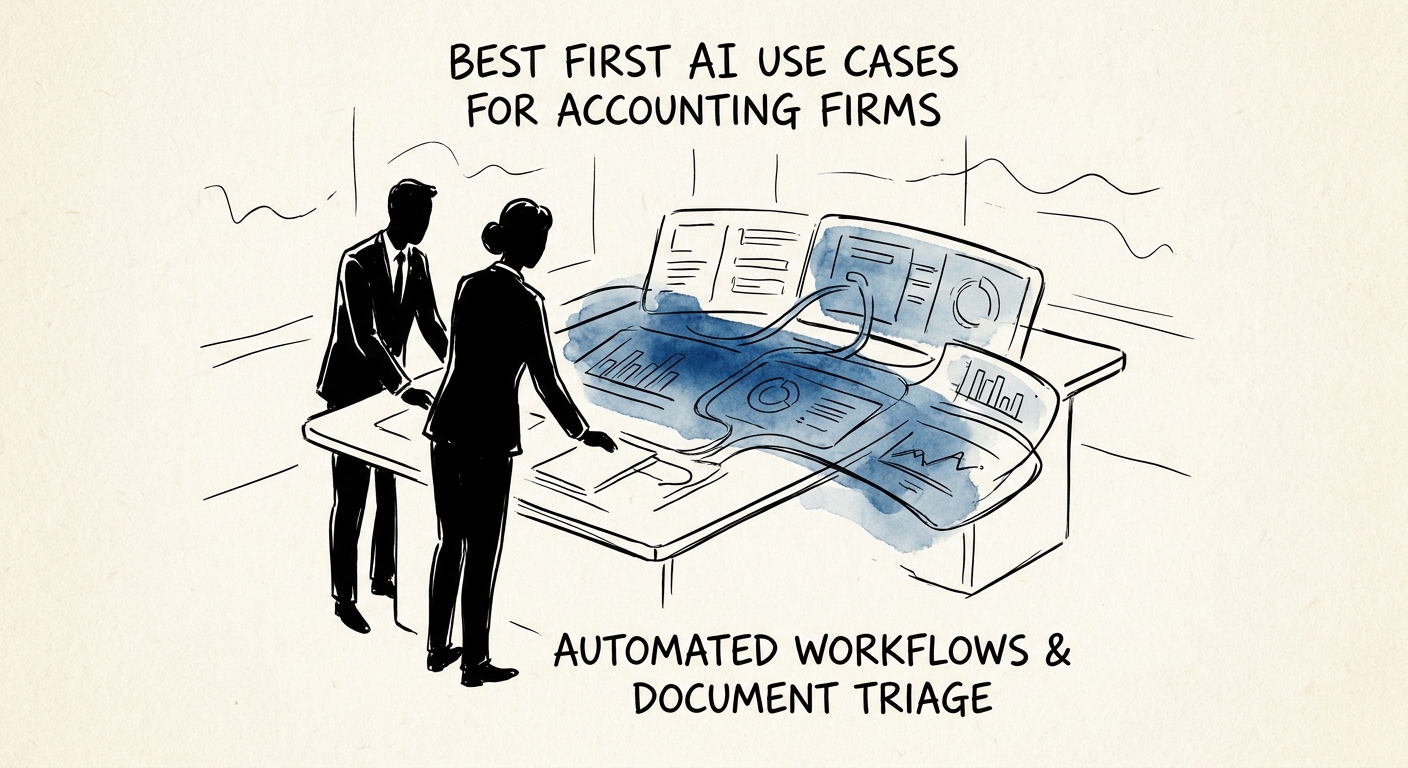
The First AI Job in an Accounting Firm Is Chasing the PBC List, Not Doing the Return
The smartest first AI use case for an accounting firm isn't the tax return. It's the missing-document chase, the close binder, and the PBC backlog. Here's why.
2 safe lanes Two governed workflows before broad AI adoption