BRIEF · PROCESS DOCUMENTATION
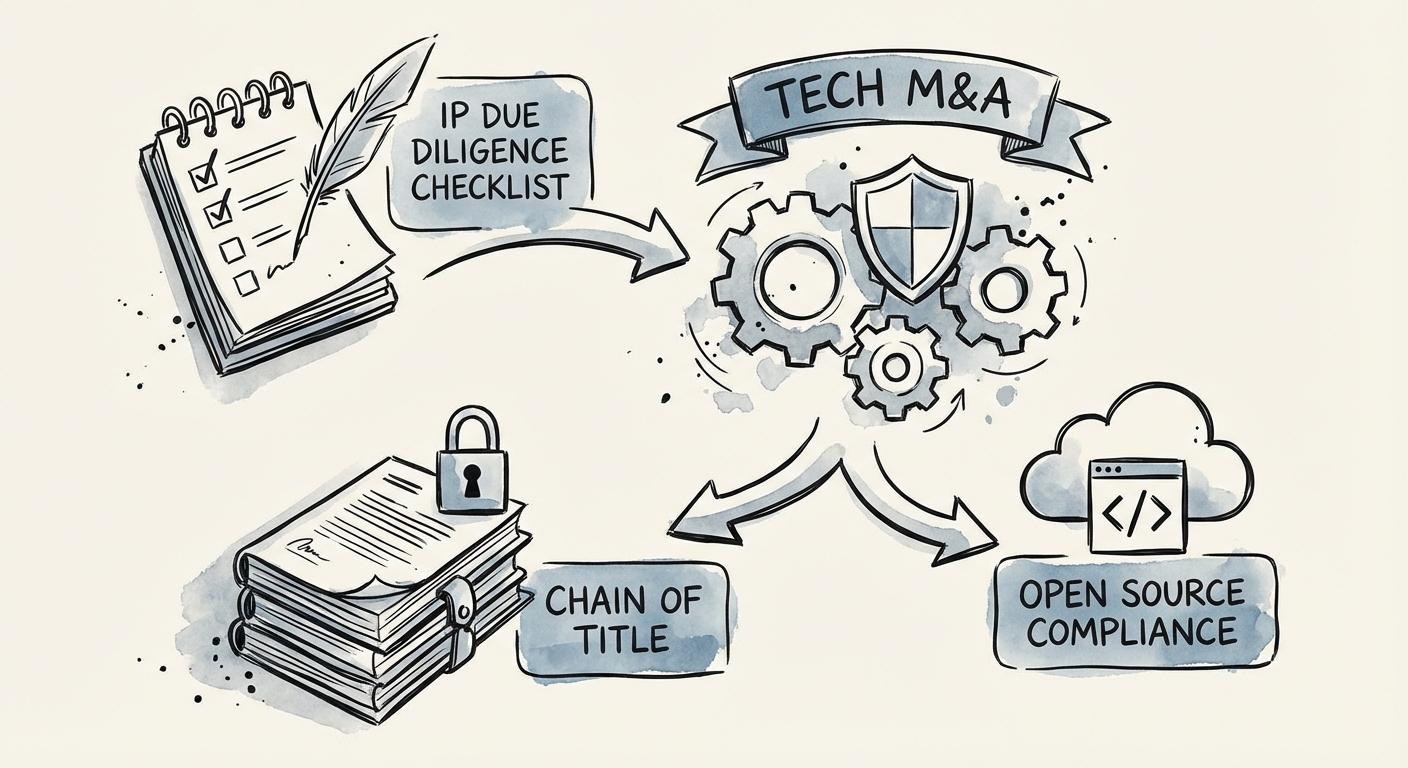
The Three Documents That Decide Whether Your IP Is an Asset or a Holdback
A buyer's scanner maps your codebase in 48 hours. Here are the three IP documents — assignments, SBOM, trade-secret register — that protect deal value.
30% Valuation Haircut for IP Gaps
BRIEF · EXIT READINESS
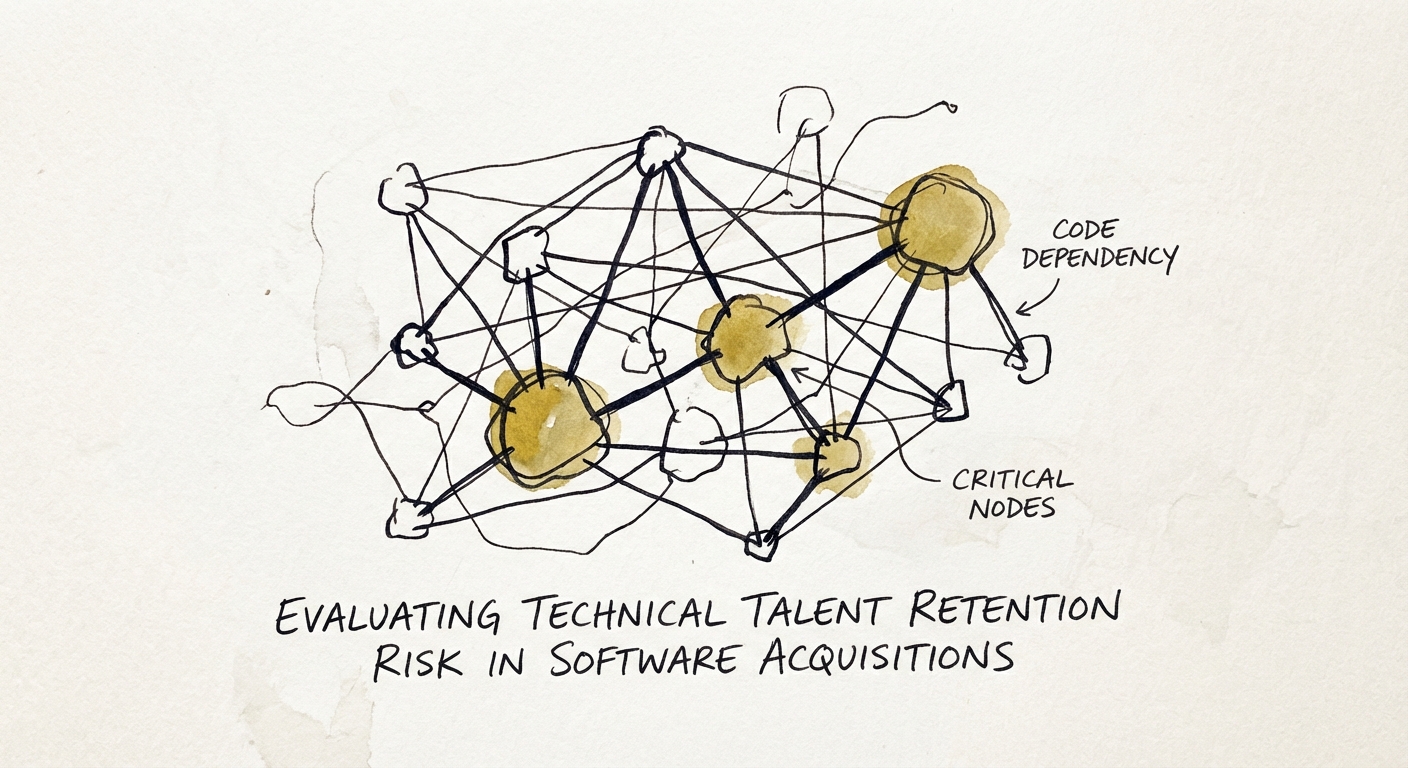
The "Brain Drain" Discount: Evaluating Technical Talent Retention Risk in Software Acquisitions
47% of key employees leave within a year of acquisition. Learn how to evaluate technical retention risk and prevent the 'brain drain' that kills deal value.
47% Key Employee Attrition Rate (Year 1)
BRIEF · REVENUE ARCHITECTURE
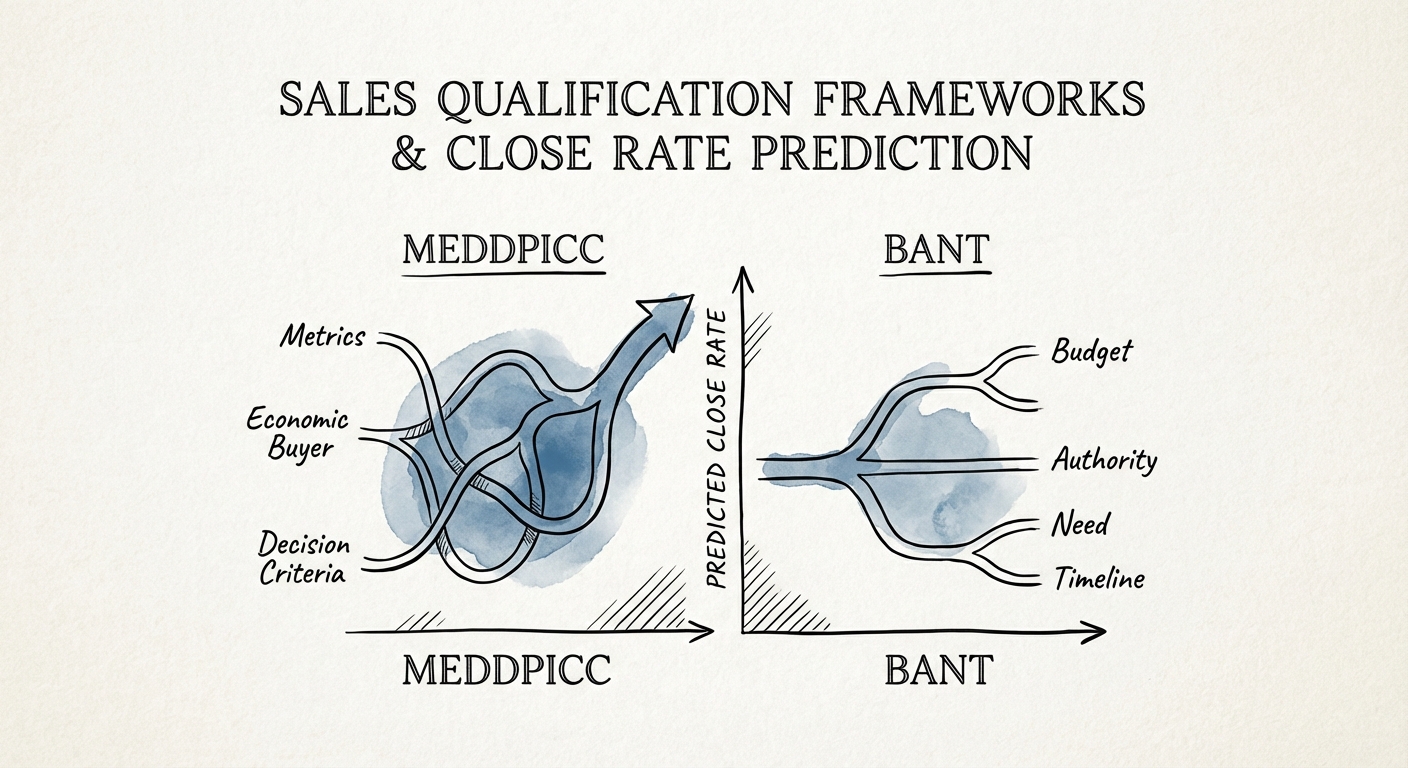
Sales Qualification Frameworks That Predict Close Rates
Stop relying on gut-feel forecasting. Learn how MEDDPICC, economic-buyer evidence, and multi-threading make enterprise close rates more predictable.
Economic buyer Critical Qualification Gate
BRIEF · PROCESS DOCUMENTATION
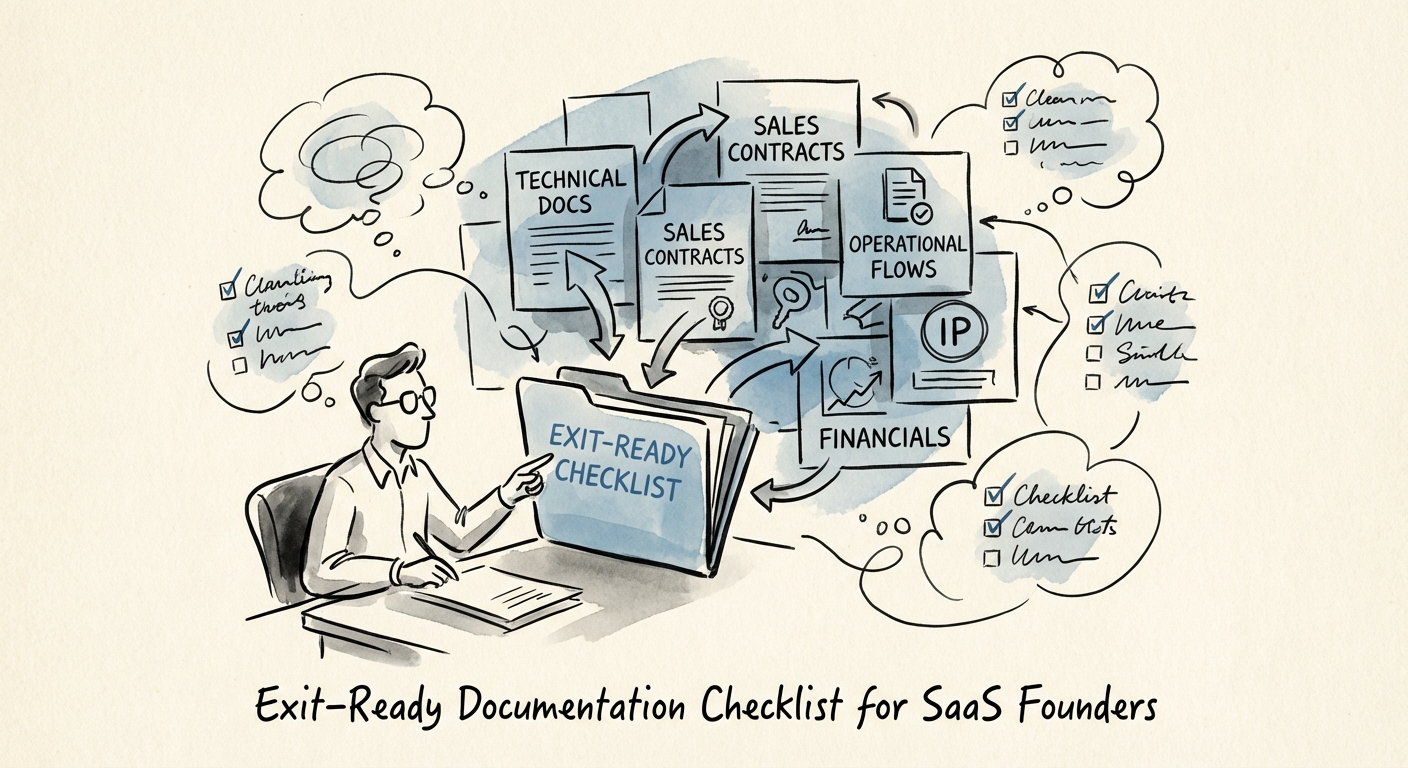
The Exit-Ready Documentation Checklist: Preventing the 30% 'Process Discount' in SaaS M&A
Prevent the 30% 'Process Discount' in your SaaS exit. A diagnostic checklist for documentation that drives premium valuations, from IP assignments to revenue recognition.
30% Valuation Discount for 'Tribal Knowledge'
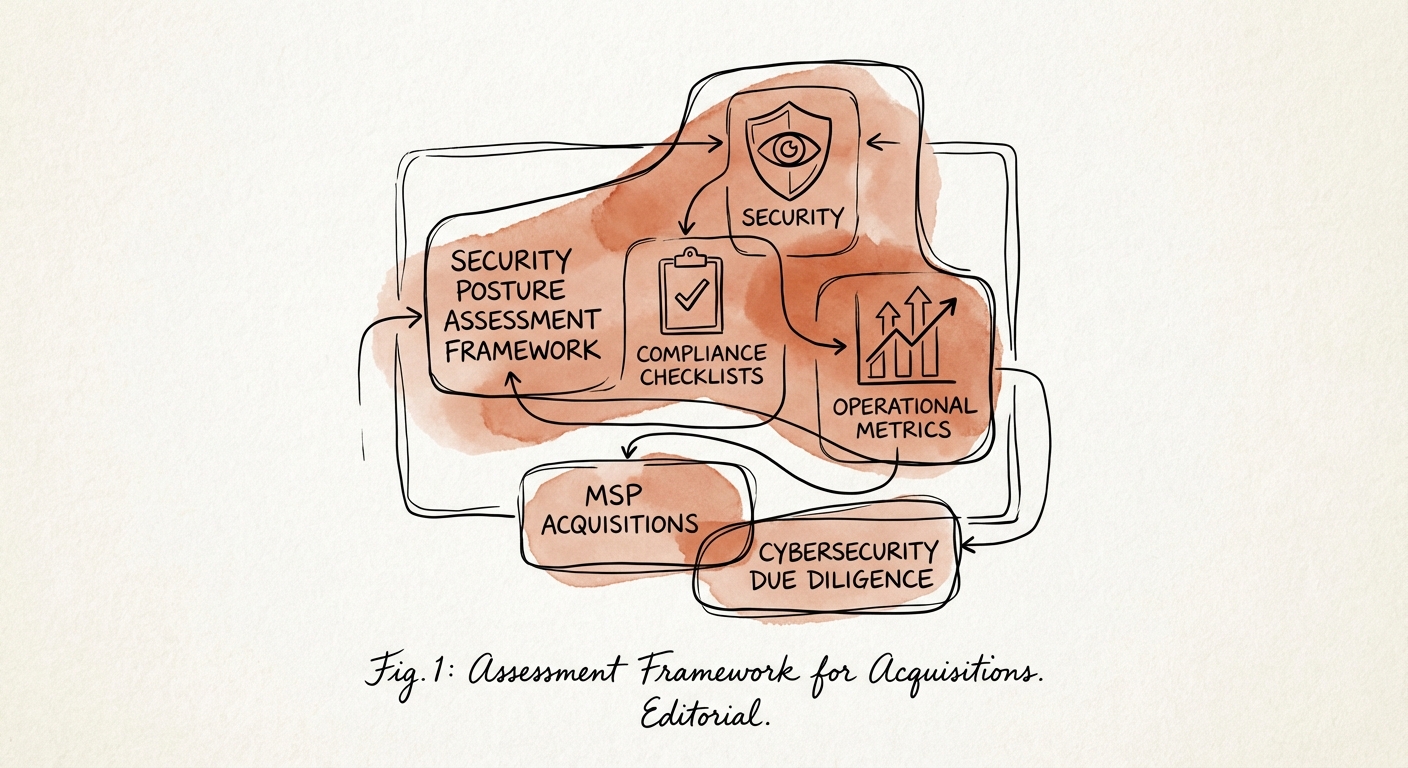
BRIEF · TECHNICAL DEBT
The "Compliance Mirage": A Security Posture Assessment Framework for MSP Acquisitions
Standard due diligence fails to catch the operational security debt in MSPs. Use this 5-point assessment framework to identify risks that kill deal value.
$2.73M Average Ransomware Recovery Cost (2024)
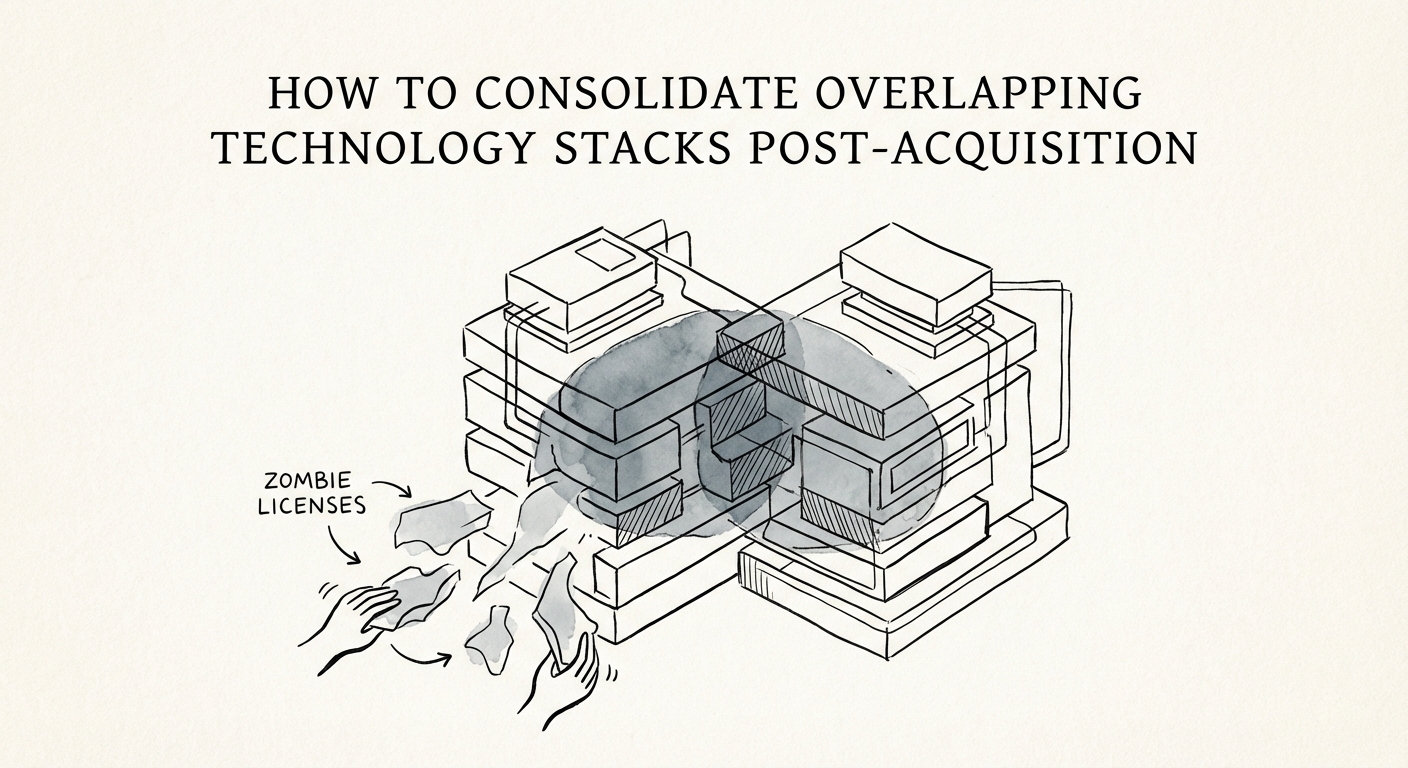
BRIEF · MIGRATION & INTEGRATION
The 'Inactive License' Tax: Why 27% of Your Acquired Tech Stack Is Burning Cash (And How to Fix It)
Discover how to rationalize overlapping technology stacks post-merger. Learn why 27% of acquired cloud spend is wasted and how to capture G&A synergies in the first 100 days.
27% Of Acquired Cloud Spend is Wasted
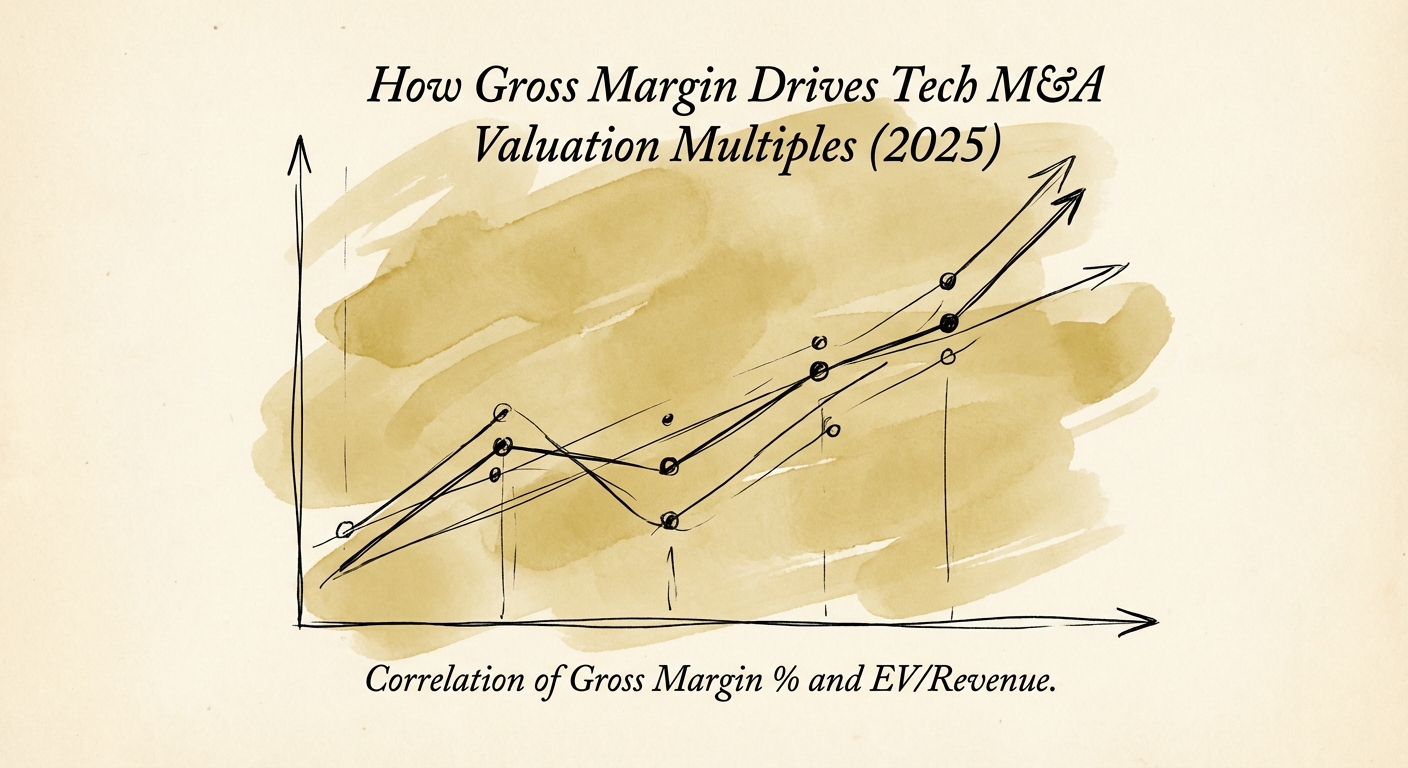
BRIEF · EXIT READINESS
The Gross Margin Multiplier: Why 80% Margins Command a 105% Valuation Premium
New 2025 data shows SaaS companies with >80% gross margins trade at a 105% valuation premium over those below 60%. Here is the diagnostic guide to fixing your COGS before exit.
105% Valuation Premium for >80% Gross Margins
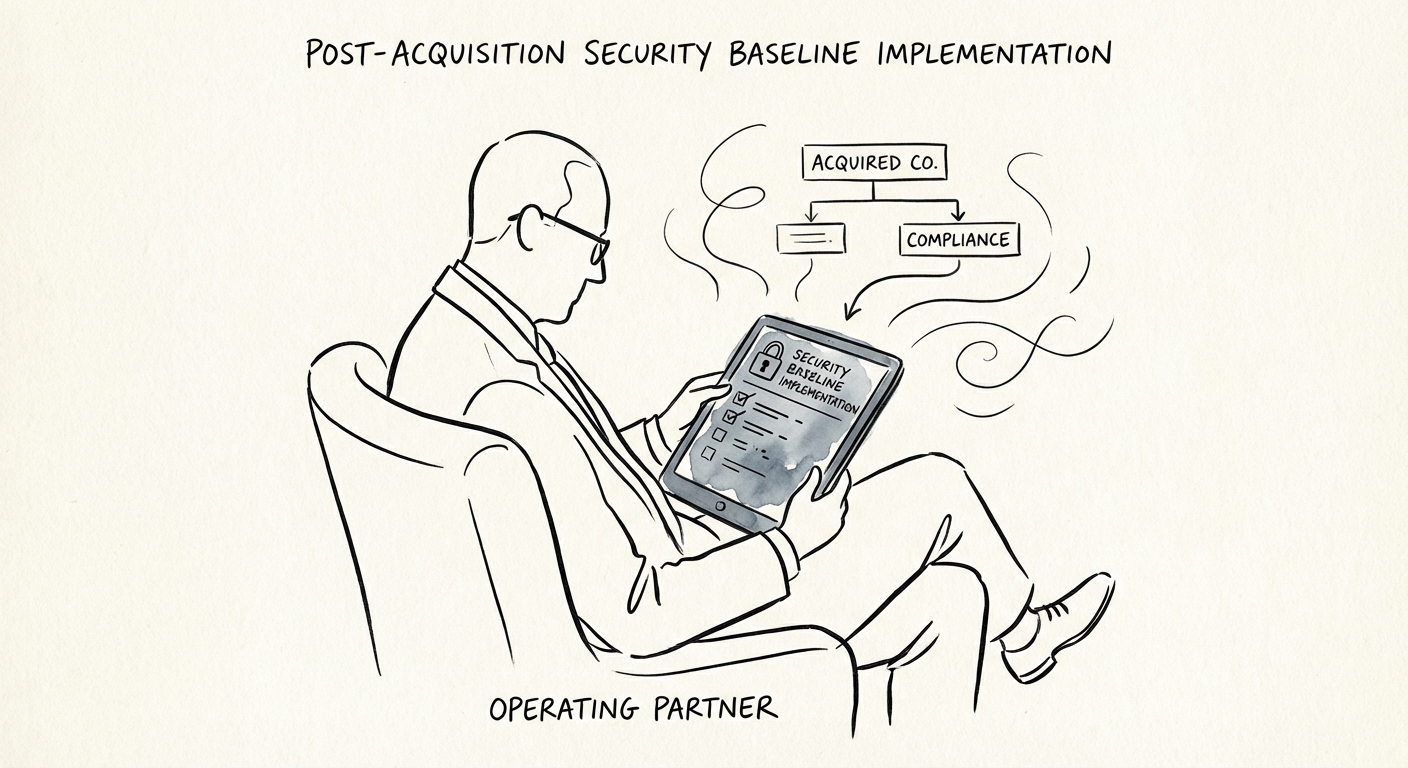
BRIEF · MIGRATION & INTEGRATION
The 100-Day Security Gap: Why 'Standardizing Later' Costs $4.88M
Why delaying security integration costs PE firms $4.88M per breach. A 100-day playbook for implementing a standardized security baseline in acquired portfolio companies.
$4.88M Avg. Cost of Data Breach (2024)
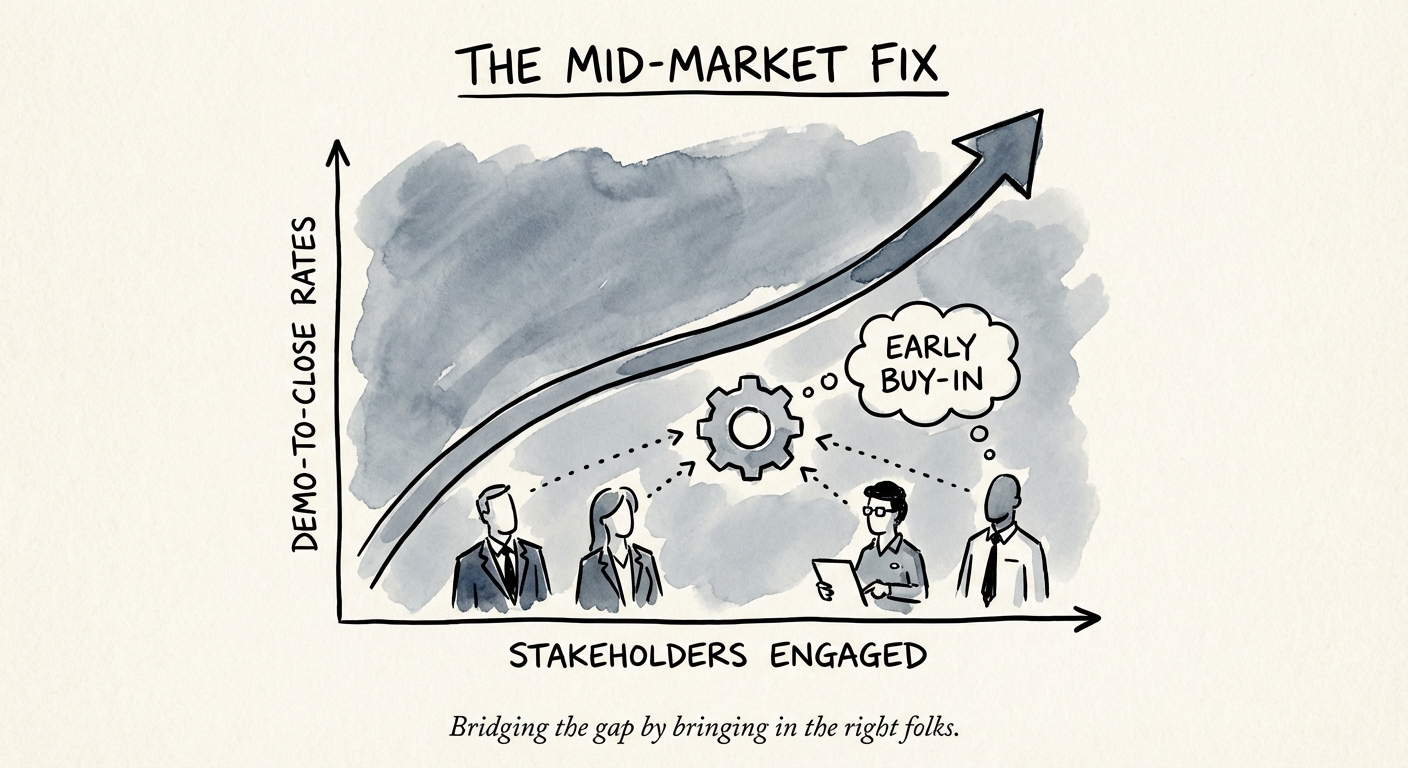
BRIEF · GTM EXECUTION
The Mid-Market SaaS Demo Looked Great. Three Weeks Later It Went Dark. Here's Why.
Three out of four mid-market SaaS demos end in no-decision. The pattern behind it, and the three checks that separate a real $40k deal from a polite conversation.
25% Avg. Demo-to-Close Rate
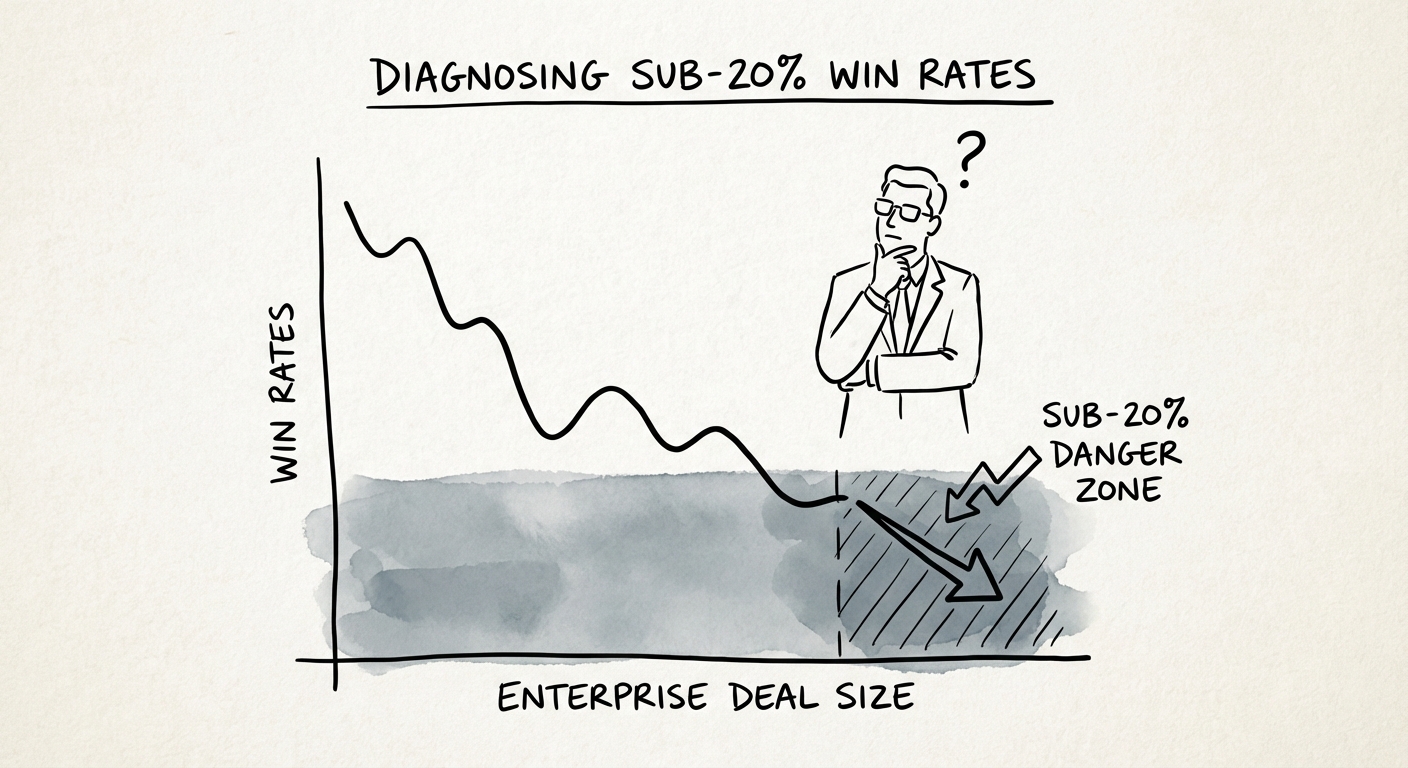
BRIEF · GTM EXECUTION
Diagnosing Sub-20% Win Rates: Why Your Enterprise Deals Die in the Dark
Why enterprise win rates are falling below 20% and how to fix it. Benchmarks, 'no decision' analysis, and the multi-threading multiplier for PE-backed CROs.
40-60% Deals Ending in 'No Decision'
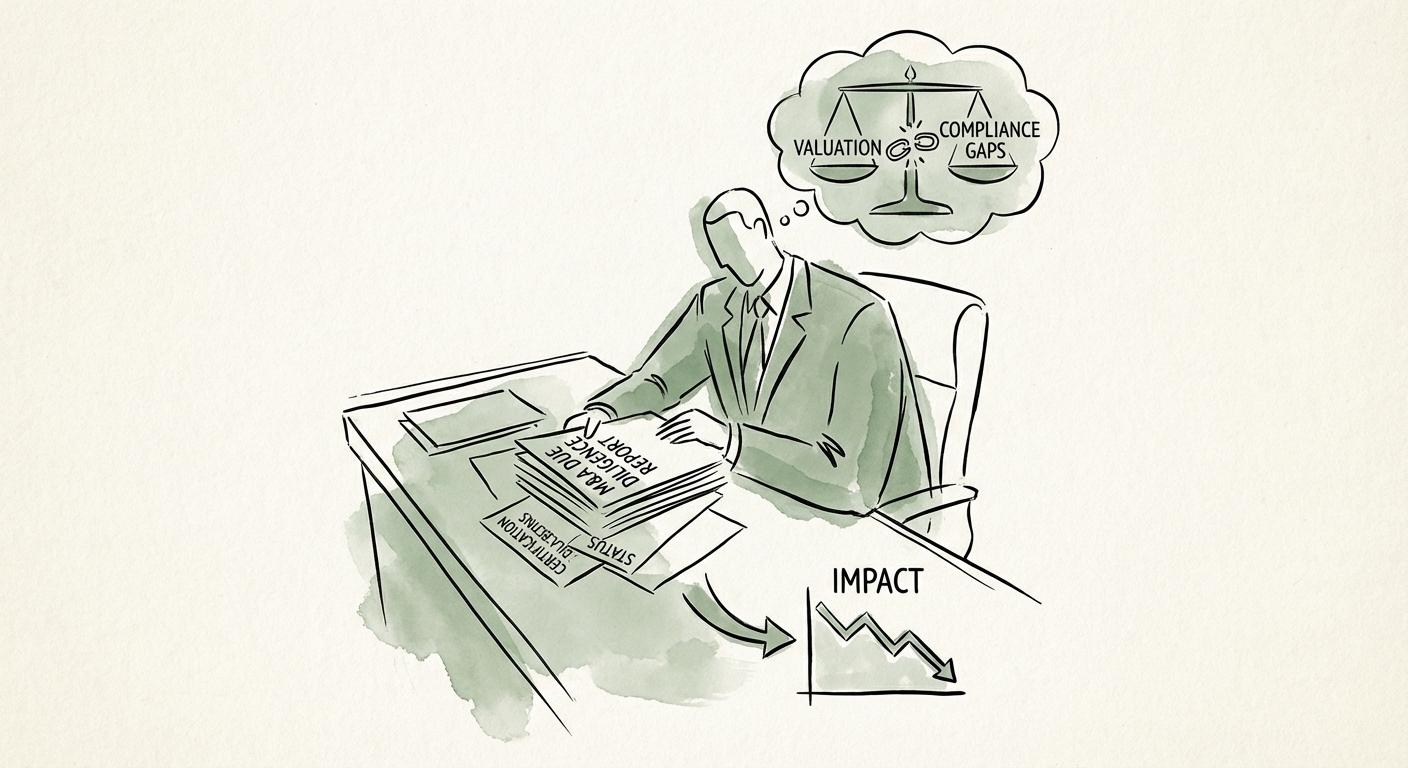
BRIEF · EXIT READINESS
The Compliance Multiplier: Valuing Technical Certifications in M&A
New data reveals how technical certifications impact M&A valuations. Learn why FedRAMP commands a premium while lack of SOC 2 drives a 30% discount.
30% Deal Value at Risk
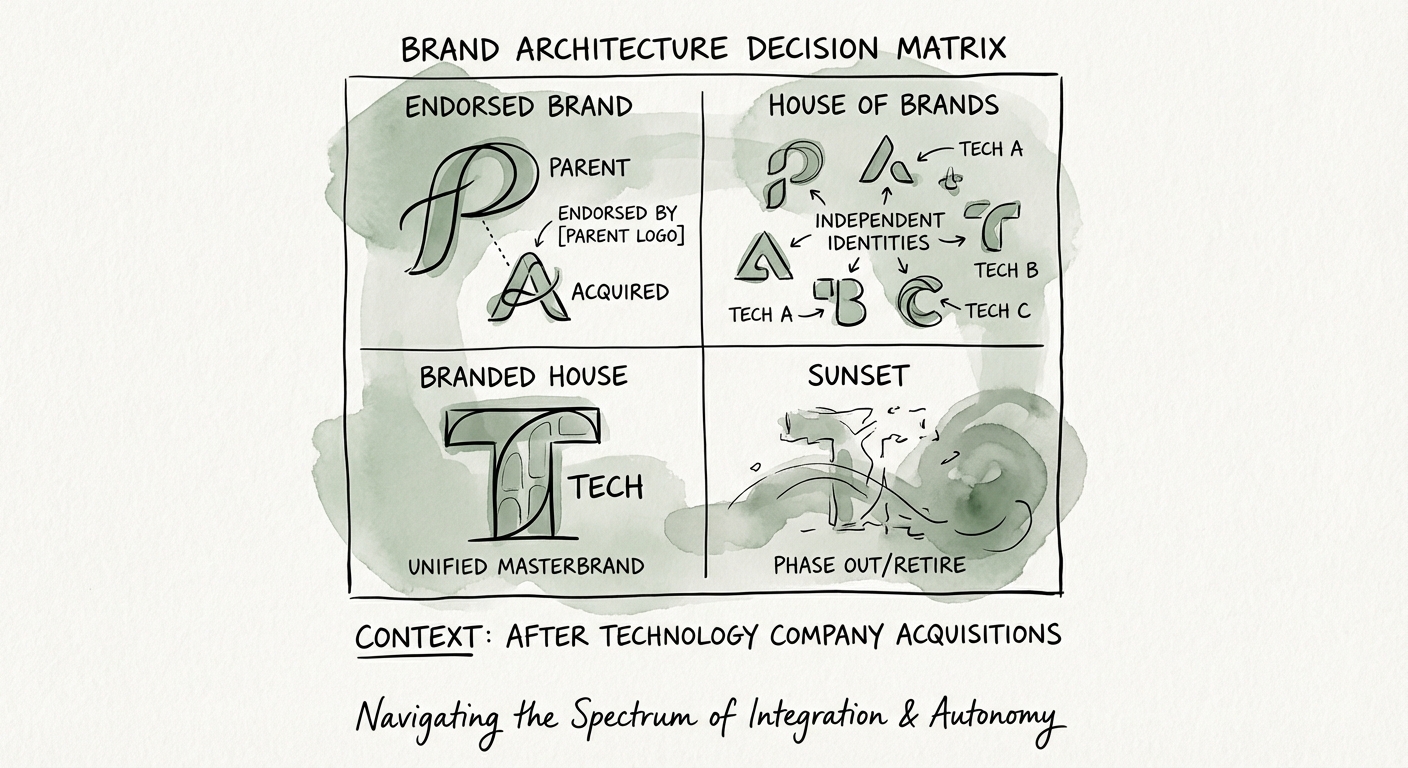
BRIEF · MIGRATION & INTEGRATION
The Brand Equity Bridge: Why 20% of Acquired Revenue Evaporates During Rebranding
A diagnostic guide for Private Equity sponsors on navigating brand architecture post-acquisition. Learn the 4-part decision matrix to preserve brand equity.
80% Consumer preference drop immediately following acquisition announcements (RSM Study)
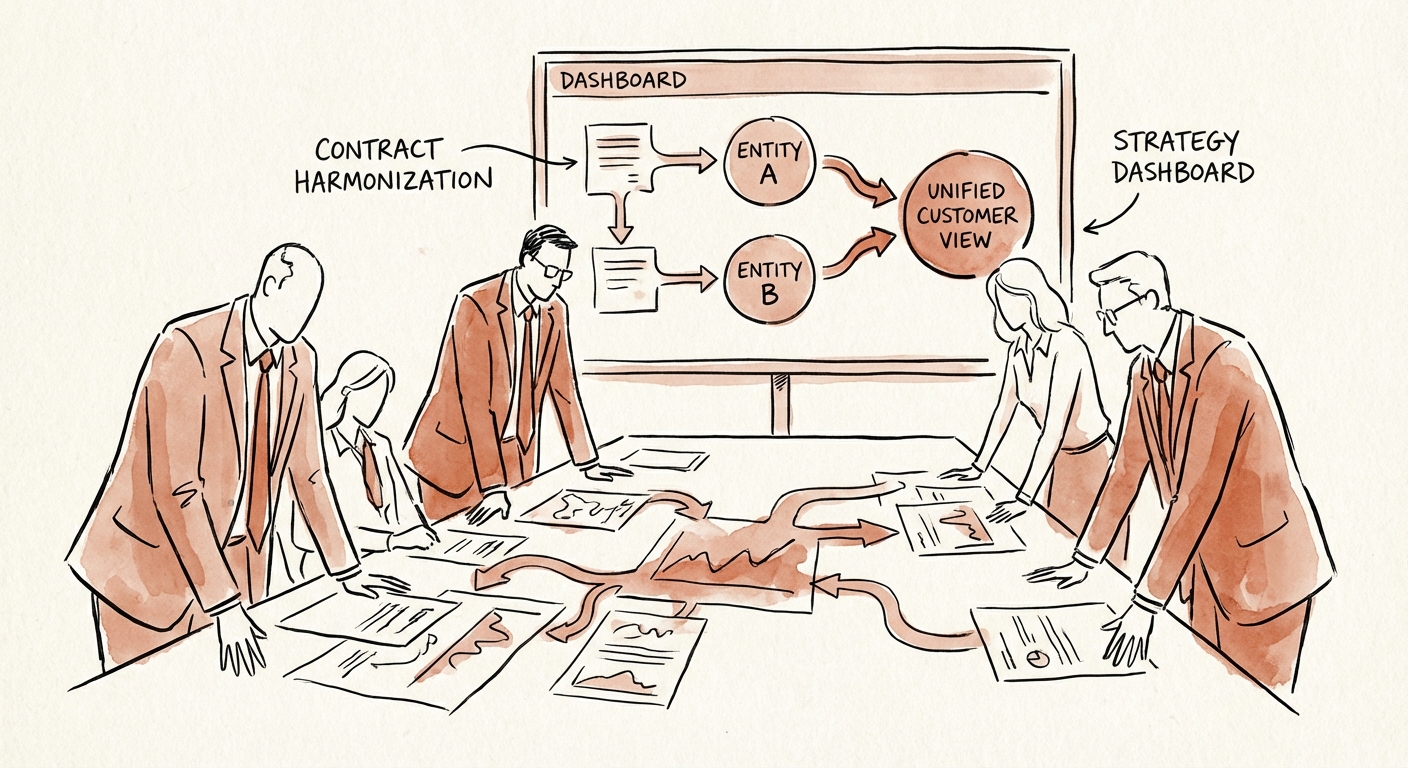
BRIEF · MIGRATION & INTEGRATION
The 'Frankenstein' Contract Portfolio: Why Harmonization Is Your First 100-Day Priority
In PE buy-and-build strategies, inconsistent customer contracts cost 9.2% of annual revenue. Here is the diagnostic playbook for post-merger contract harmonization.
9.2% Annual Revenue Leakage
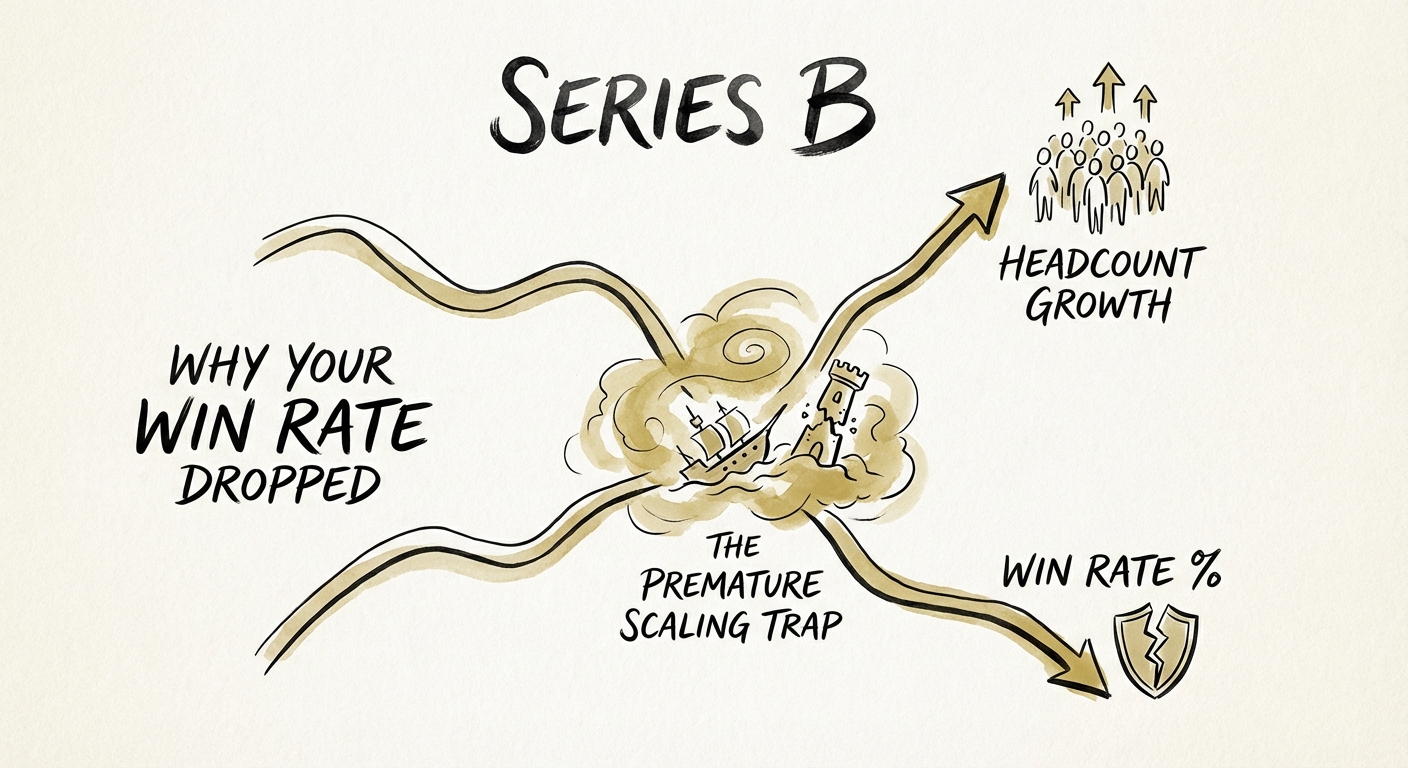
BRIEF · REVENUE ARCHITECTURE
The Series B Win Rate Collapse: Why Your 'Growth' Round Just Killed Your Efficiency
New data shows B2B win rates drop to 17% after Series B scaling. Learn why 'premature scaling' kills efficiency and how to fix your revenue architecture.
5.7 Months Avg Sales Ramp Time
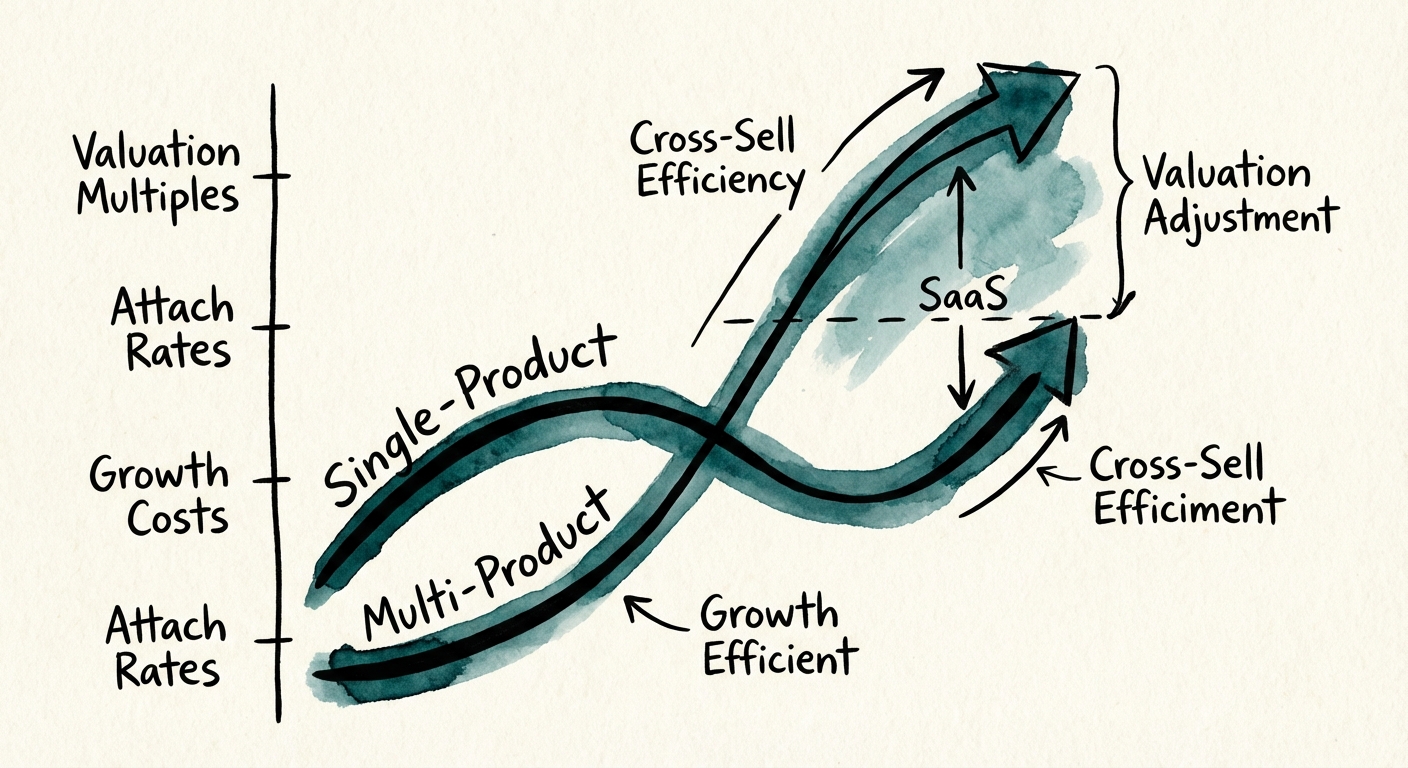
BRIEF · EXIT READINESS
The Multi-Product Valuation Paradox: Why 1+1=1.5 (And How to Fix It)
Why PE buyers discount multi-product companies by 20% and how to flip the narrative. Benchmarks for attach rates, cross-sell CAC, and platform premiums.
30% Min. Attach Rate for Platform Premium
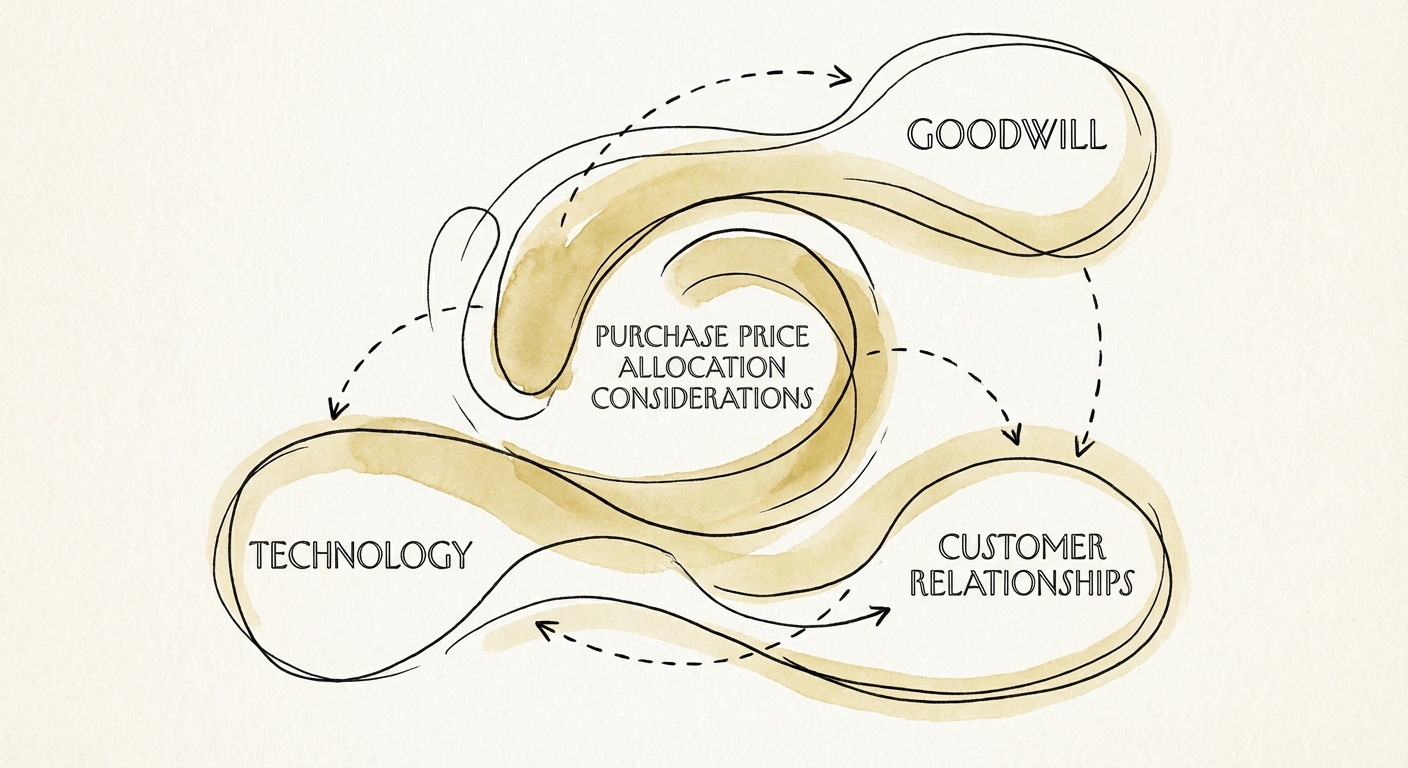
BRIEF · EXIT READINESS
The Footnote That Eats Your Earnout: PPA in a SaaS Acquisition
In a SaaS acquisition, the buyer's PPA can assign your code an 18-month useful life and quietly gut a Net-Income earnout. Here's how to fight it pre-close.
3-5 Years Avg. Software Useful Life
BRIEF · EXIT READINESS
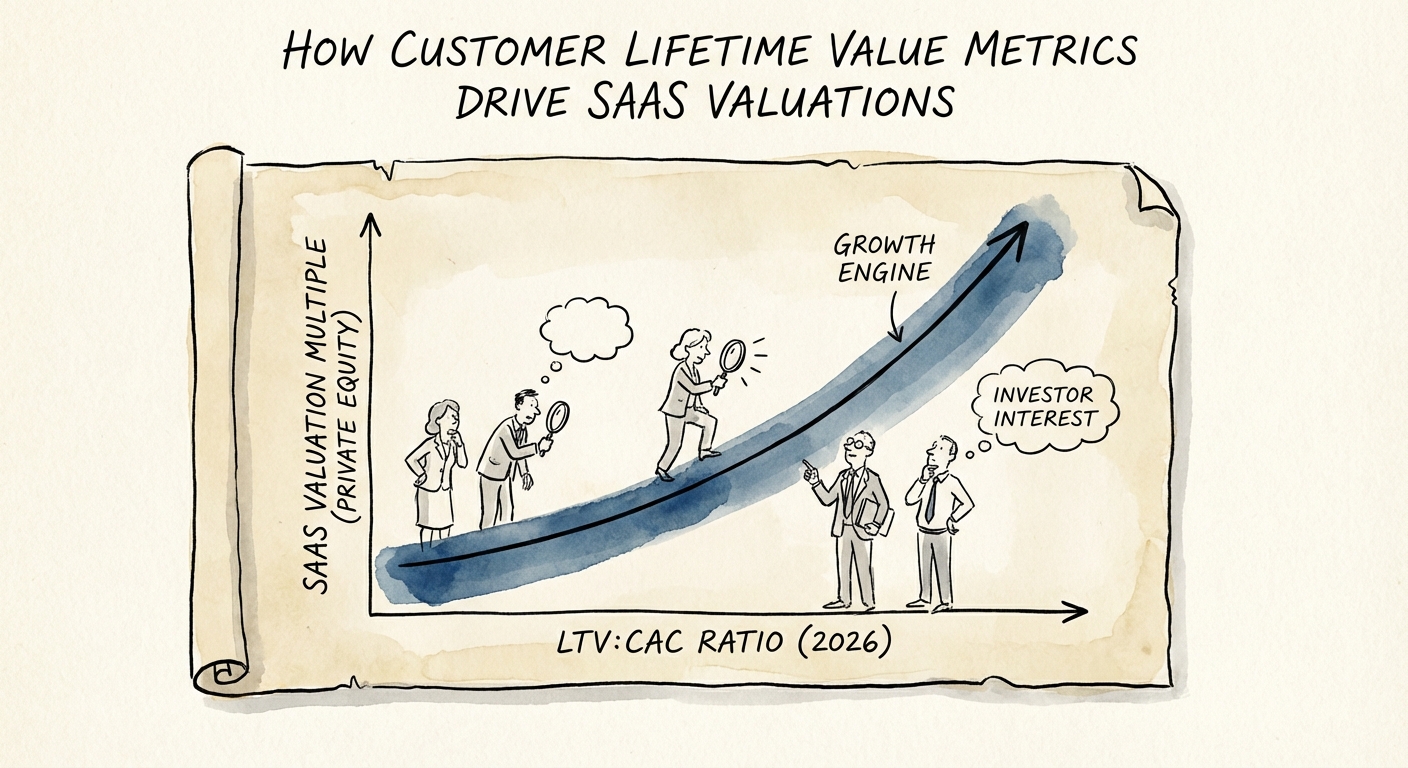
How Customer Lifetime Value Metrics Drive SaaS Valuations: The 2026 Diagnostic
Discover how LTV:CAC ratios impact SaaS valuation multiples in 2026. Learn the diagnostic framework to calculate true unit economics and command a 30-50% premium.
30-50% Valuation Premium for LTV:CAC > 5x
BRIEF · PROCESS DOCUMENTATION
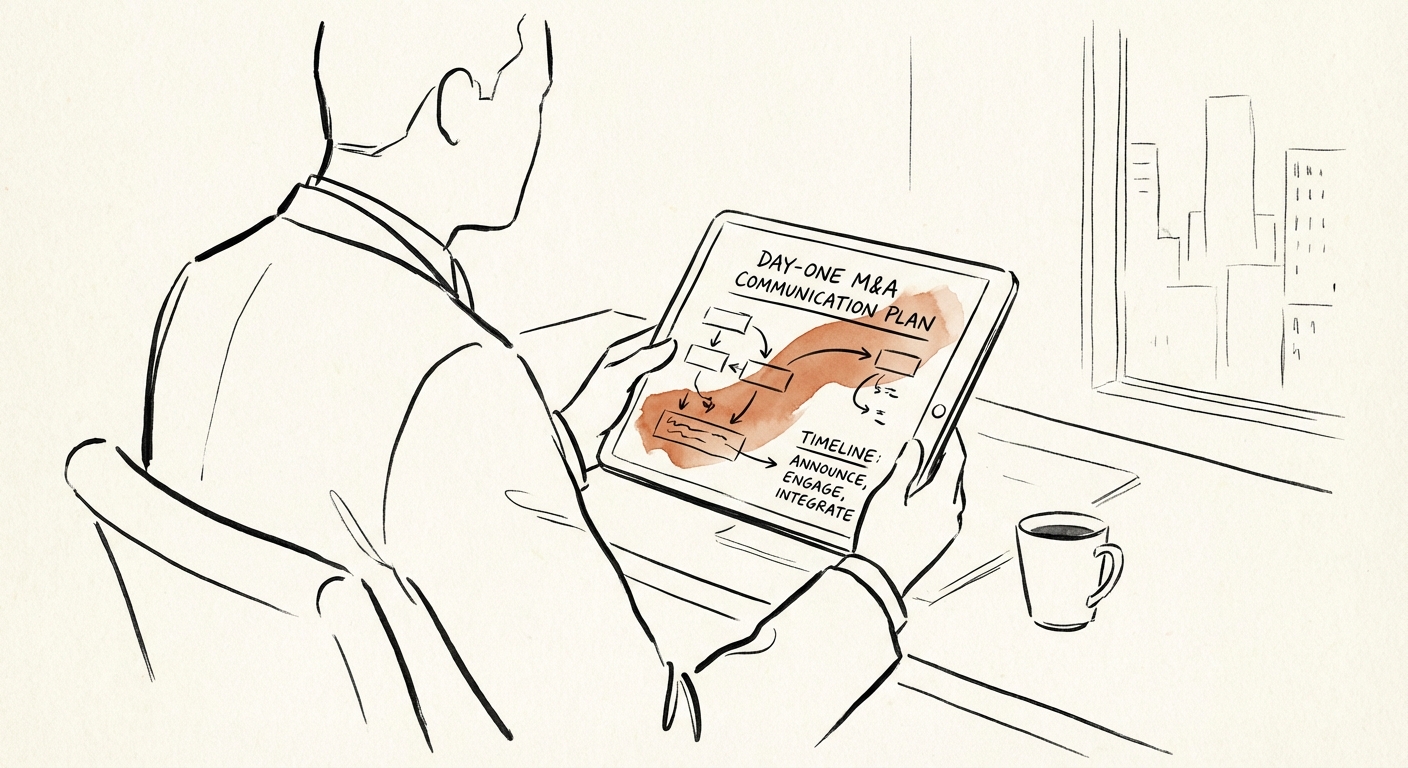
Day-One Communication Plan Templates for Tech Acquisitions: The 48-Hour Survival Guide
Prevent the 47% attrition spike. A 48-hour communication protocol for tech acquisitions, including specific scripts for employees, customers, and leadership.
47% Year-1 Attrition Risk
BRIEF · EXIT READINESS
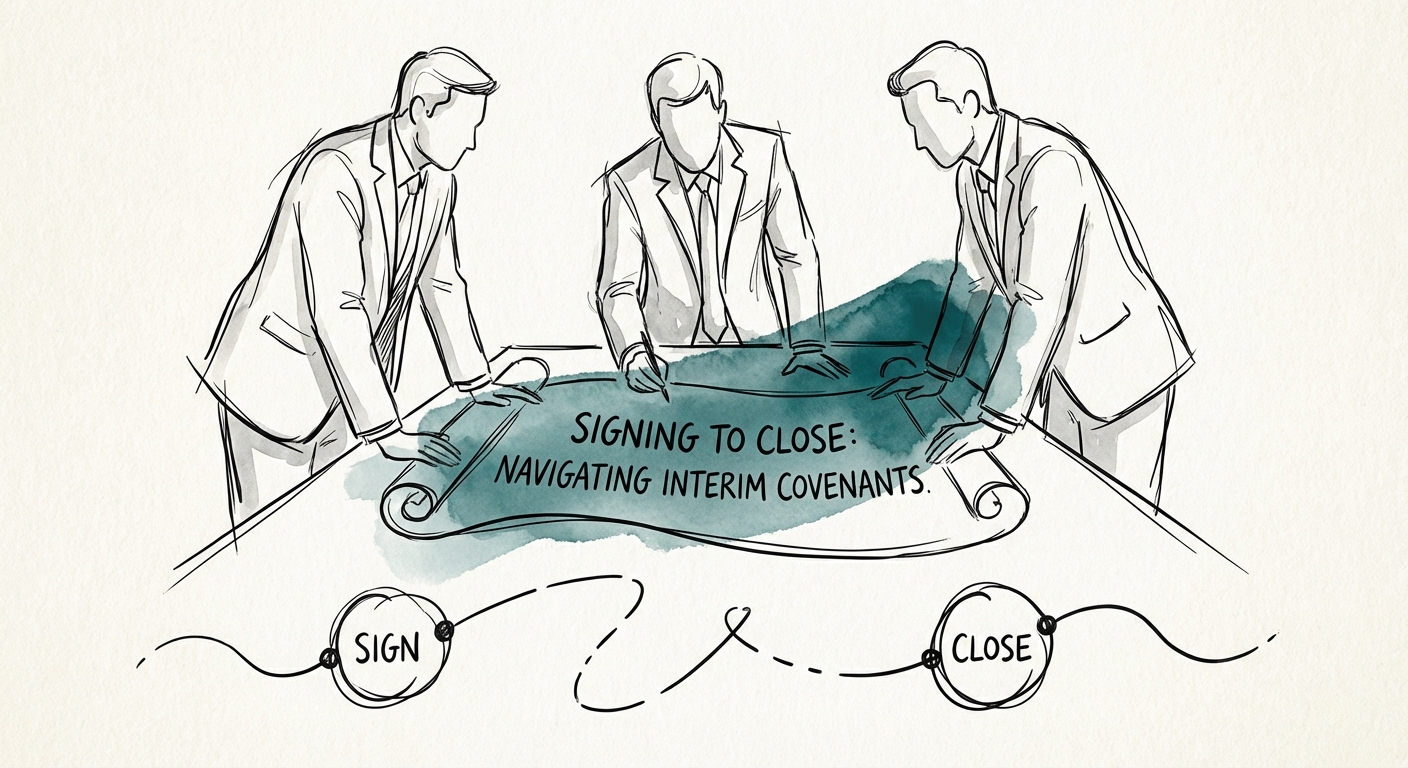
The 'Frozen Zone' Trap: Negotiating Interim Operating Covenants Without Killing Your Momentum
The period between signing and closing is the most dangerous phase of an exit. Learn how to negotiate interim operating covenants that prevent PE buyers from freezing your business.
30% of major acquisitions now face significant delays, extending the interim period
BRIEF · PROCESS DOCUMENTATION
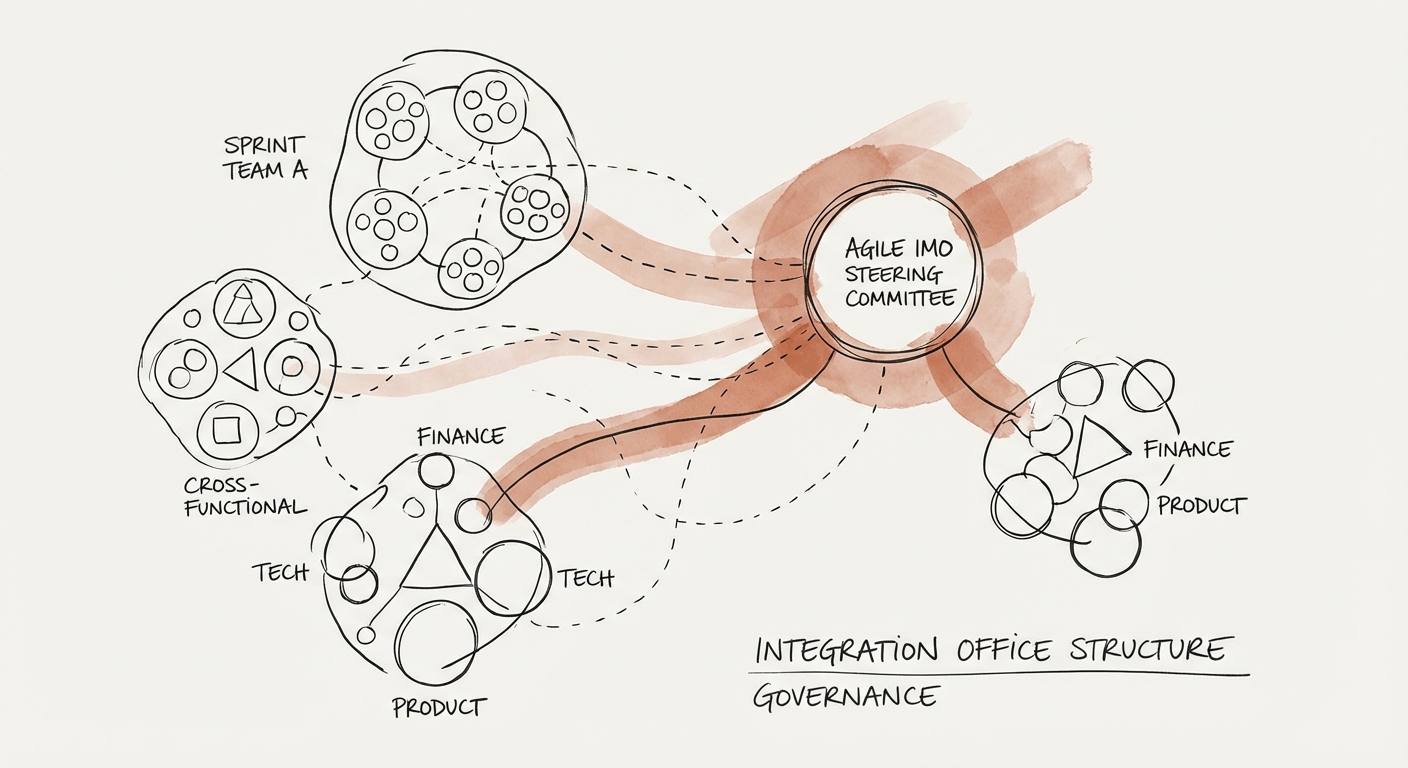
The Integration Governance Gap: Why 70% of Synergies Die in the 'Steering Committee'
Why 70% of tech M&A synergies fail due to poor governance. A diagnostic guide to structuring an Agile Integration Management Office (IMO) that reduces decision latency and protects deal value.
70% Synergy Realization Failure Rate
BRIEF · EXIT READINESS
Representations and Warranties Analysis: The 'Silent' 10% Valuation Trap in Tech M&A
R&W insurance isn't a silver bullet. Discover the 'silent' 10% valuation trap in tech M&A, from AI code exclusions to the 'Sufficiency of Assets' clawback.
55% of R&W claims stem from financial statement breaches
BRIEF · EXIT READINESS
The Silent Deal Killer: Quantifying Contingent Liabilities in Tech Acquisitions
A diagnostic framework for PE buyers to quantify contingent liabilities in tech M&A. Covers AI indemnity, escrow benchmarks, and the 2026 shift in risk allocation.
10-20% Typical Indemnity Cap
BRIEF · EXIT READINESS
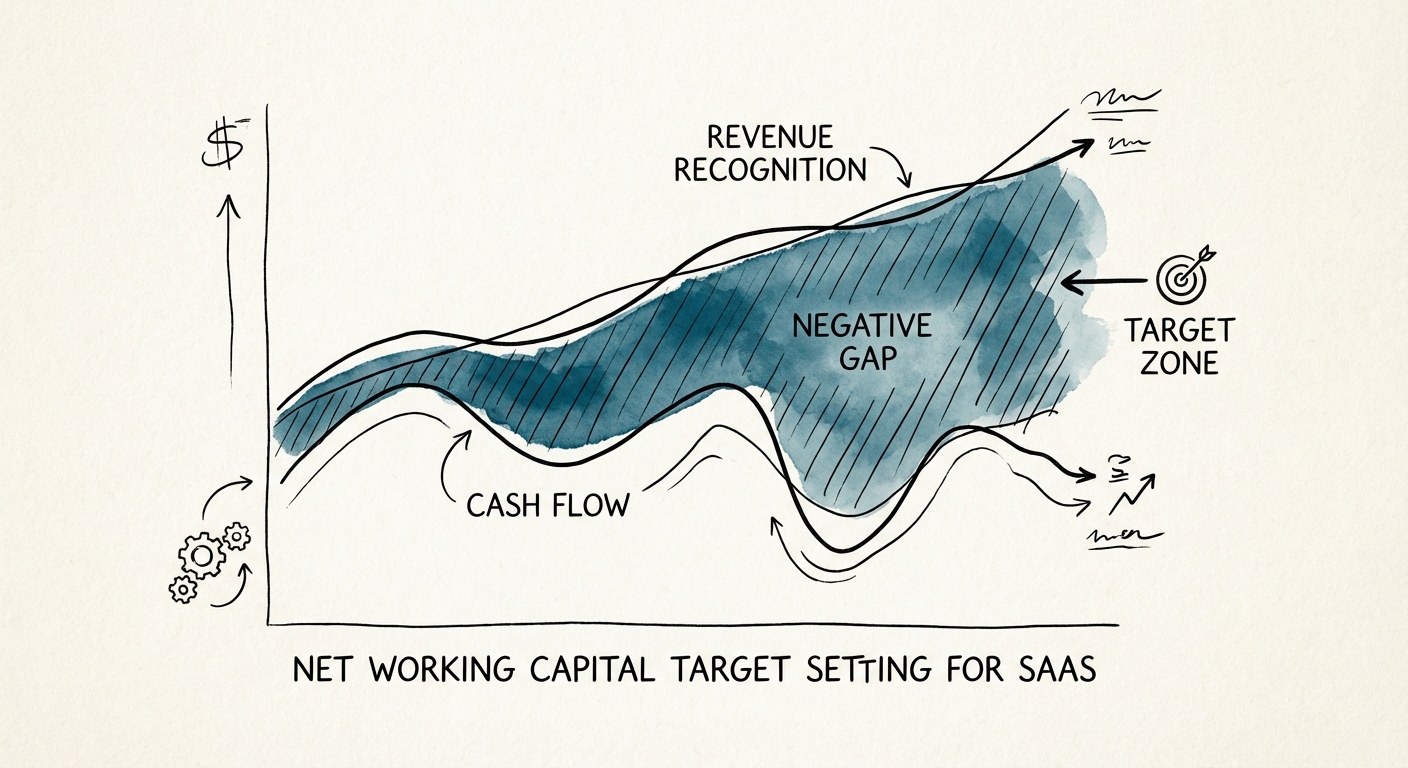
The 'Free Cash' Trap: How Net Working Capital Targets Bleed SaaS Deal Value
Net Working Capital (NWC) targets can silently cost SaaS founders 10-15% of deal value. Learn how to negotiate the 'Peg' and defend deferred revenue treatment.
$1.2M Avg. Adjustment Loss
BRIEF · MIGRATION & INTEGRATION
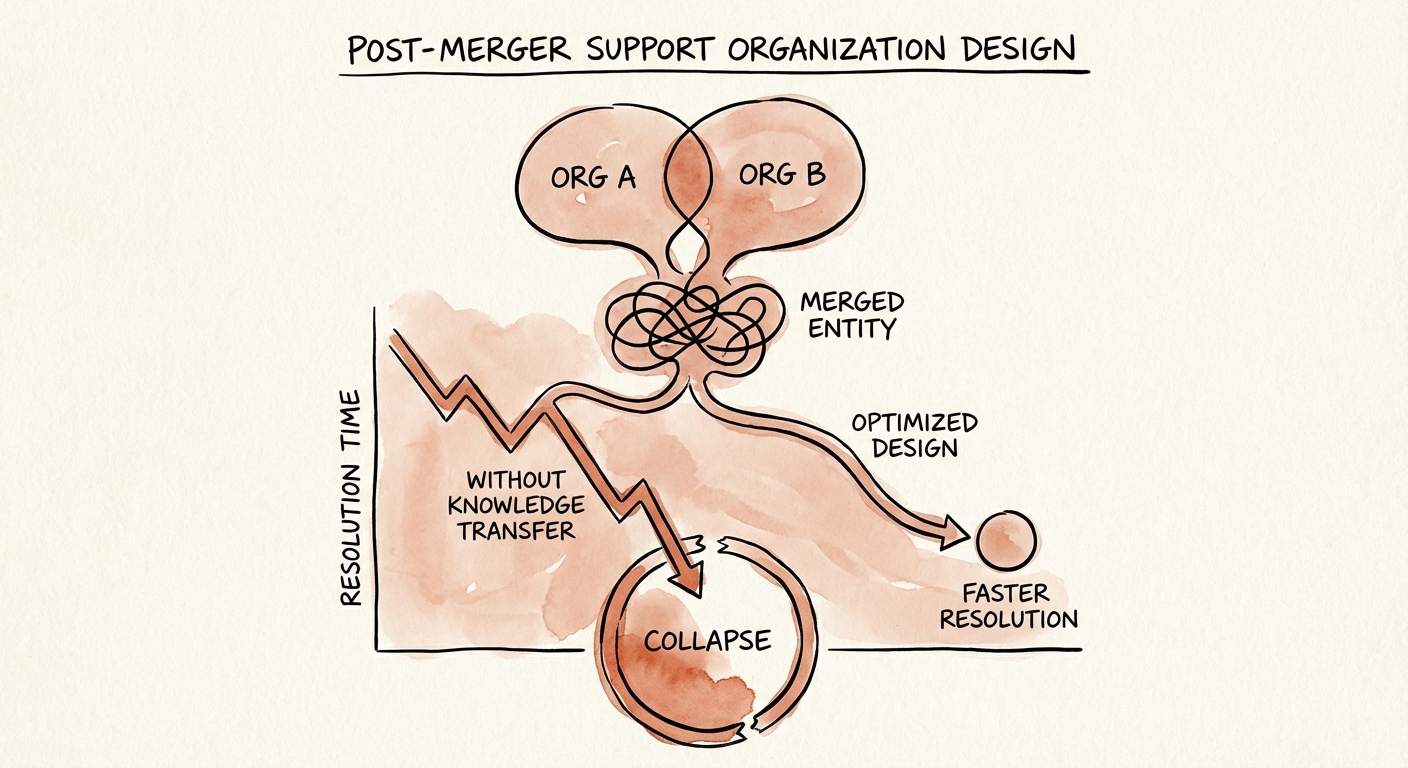
Post-Merger Support Organization Design: The 'Follow-the-Sun' Fallacy
Post-merger support integration failures drive 30% customer attrition. Here is the diagnostic playbook for PE sponsors to align service tiers, tools, and talent.
30% Post-Merger Attrition Risk