BRIEF · EXIT READINESS
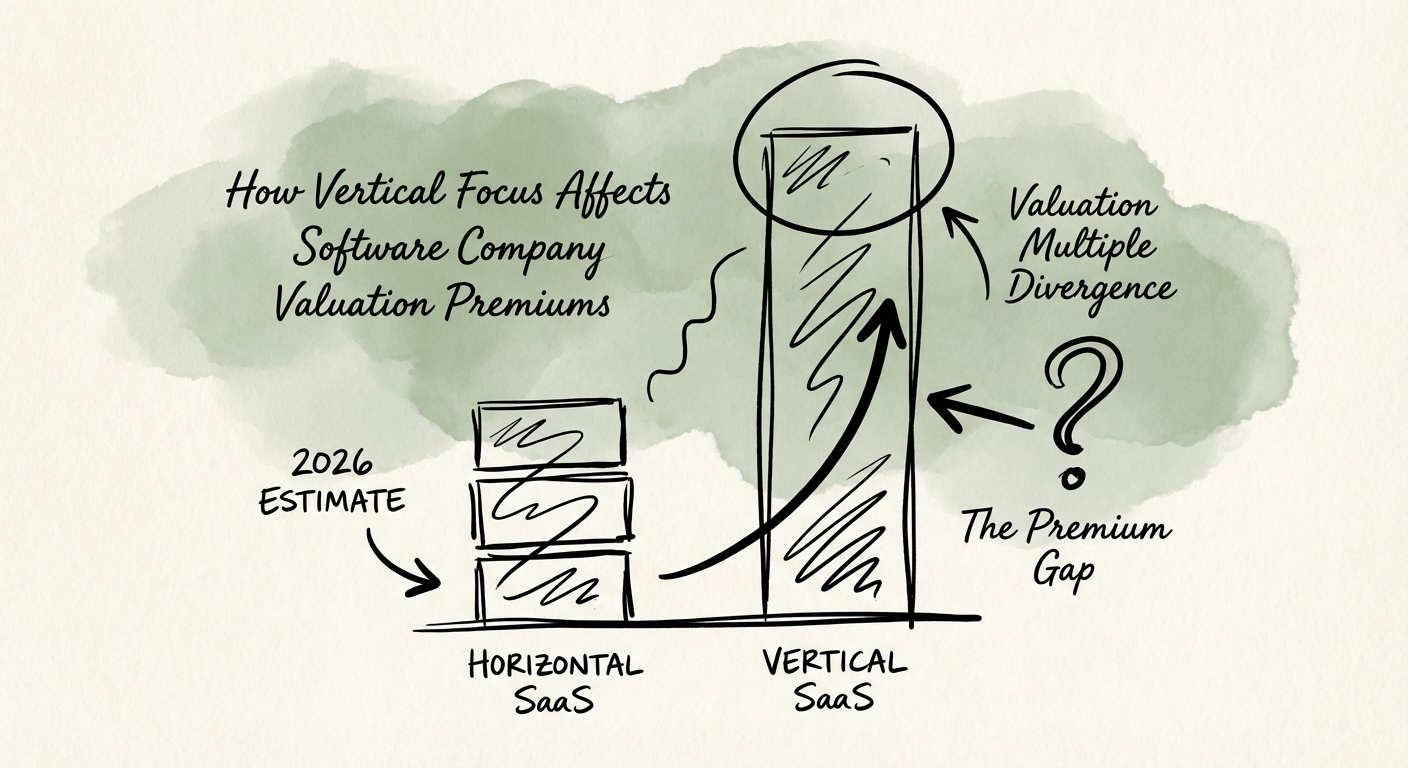
The Vertical Premium: Why Niche Software Commands Higher Exit Multiples in 2026
Why vertical SaaS companies command higher exit multiples than horizontal generalists. New 2026 data on CAC efficiency, NRR, and PE buyout trends.
46% Faster Growth Rate for Vertical SaaS vs. Horizontal
BRIEF · MIGRATION & INTEGRATION
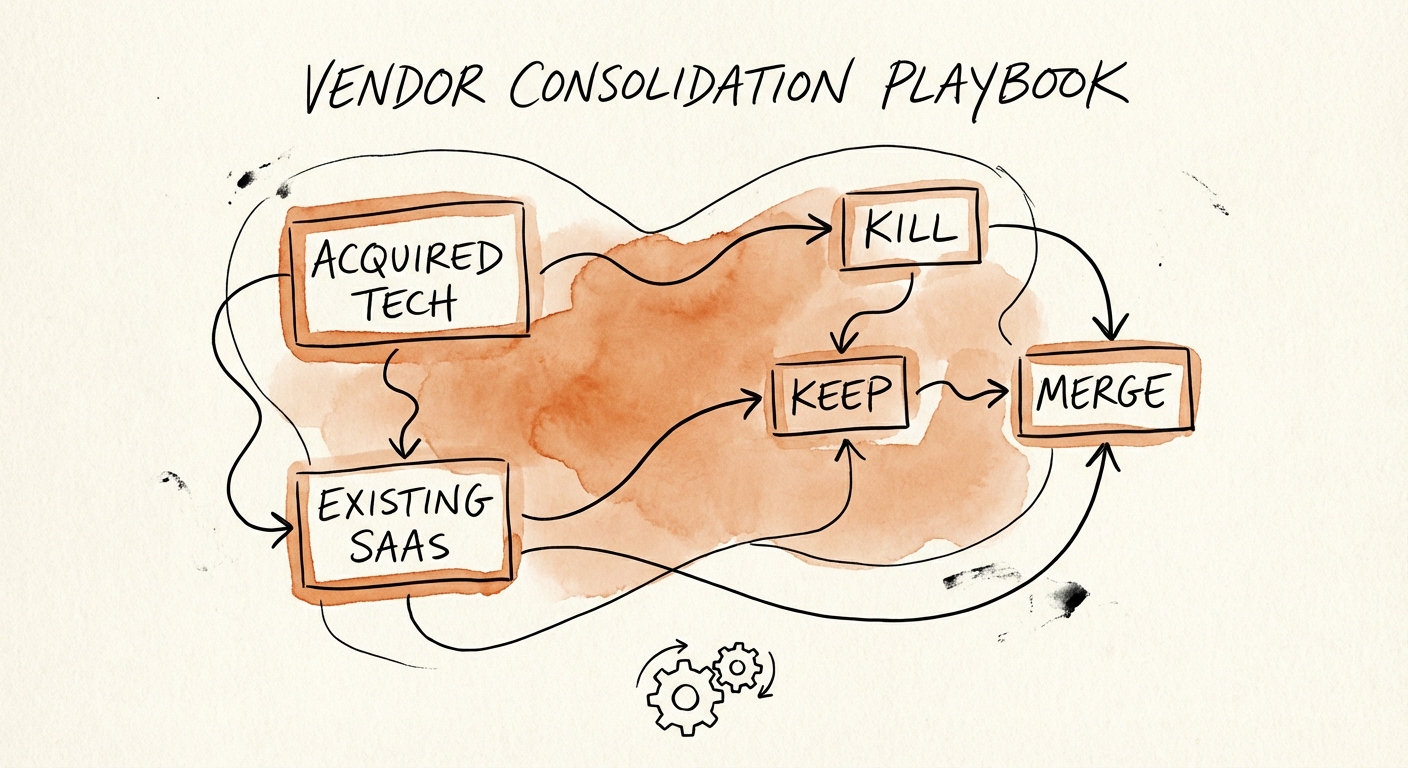
The Vendor Consolidation Playbook: How to Cut 30% of IT Spend in 100 Days Post-Close
A 100-day guide for PE Operating Partners to capture 30% IT cost synergies after a technology acquisition. Benchmarks, negotiation tactics, and consolidation frameworks.
27% Average SaaS Spend Wasted Post-Close
BRIEF · EXIT READINESS
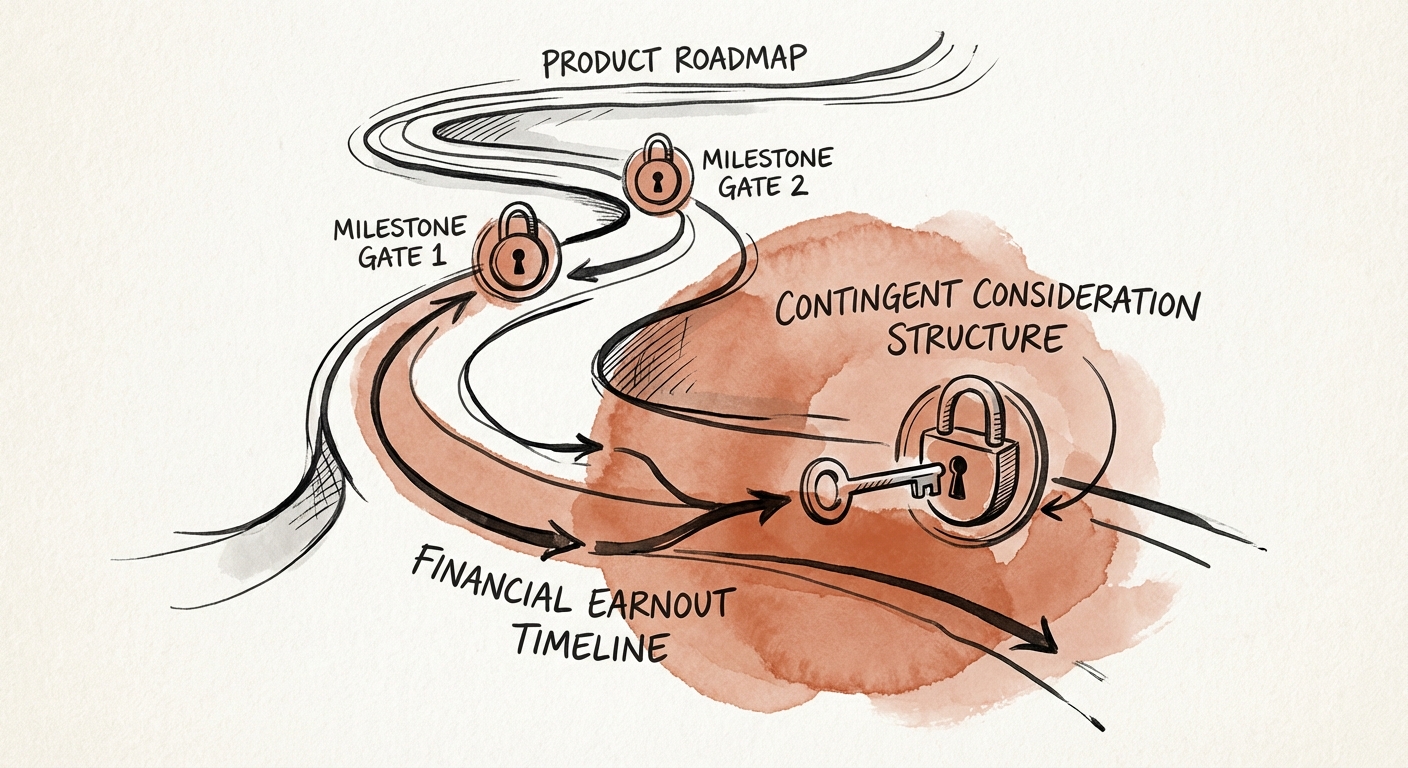
The Product Earnout Trap: Why Technical Milestones Pay 21 Cents on the Dollar (And How to Fix It)
Product-based earnouts are bridging valuation gaps in 2026 tech M&A, but they only pay out 21% on average. Here is how to structure technical milestones that actually convert to cash.
21% Average payout rate for earnouts in U.S. tech deals
BRIEF · MIGRATION & INTEGRATION
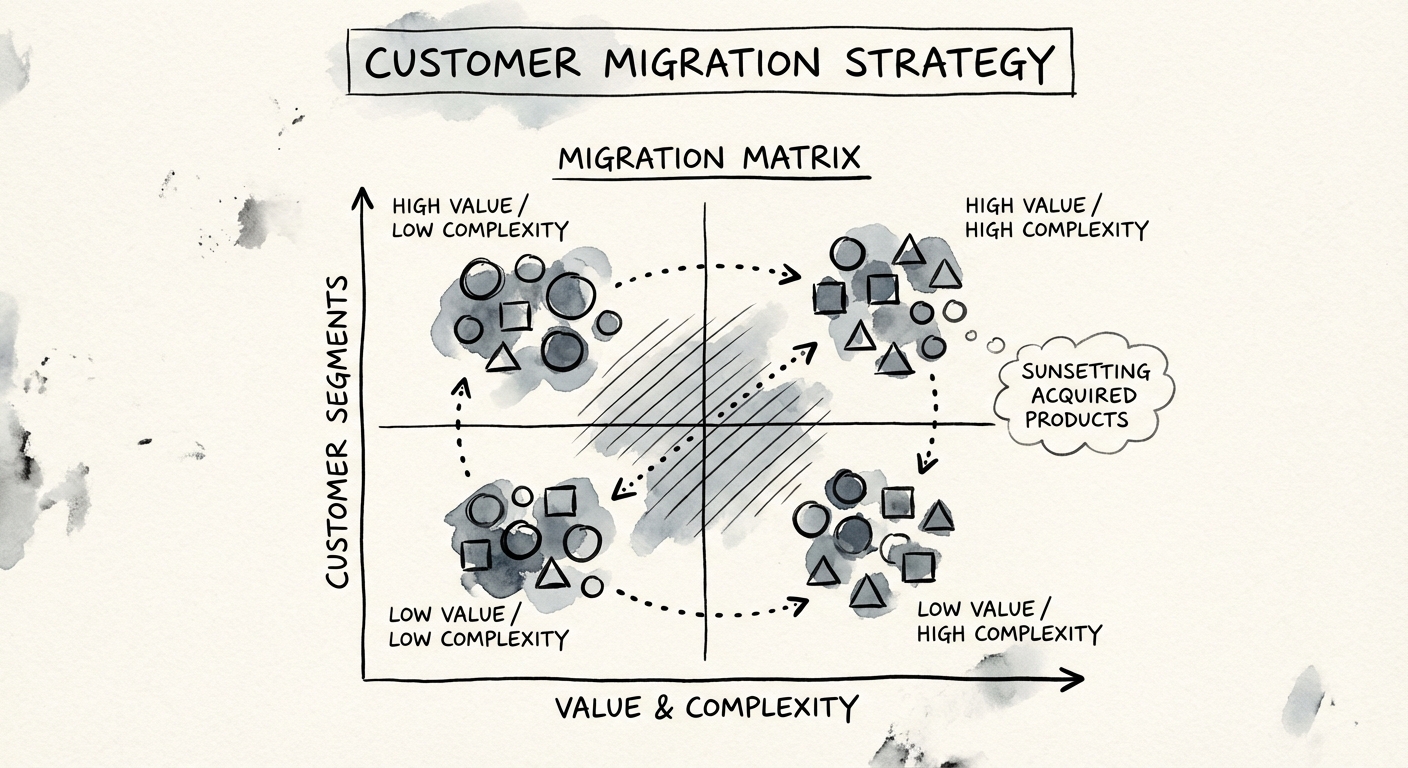
The Sunset Paradox: Why 32% of Acquired Revenue Evaporates During Product Sunsets (And How to Keep It)
Forced product migrations often trigger 32% churn. Learn the retention strategy for sunsetting acquired products without destroying deal value.
32% Risk of Revenue Churn During Forced Migrations
BRIEF · REVENUE ARCHITECTURE
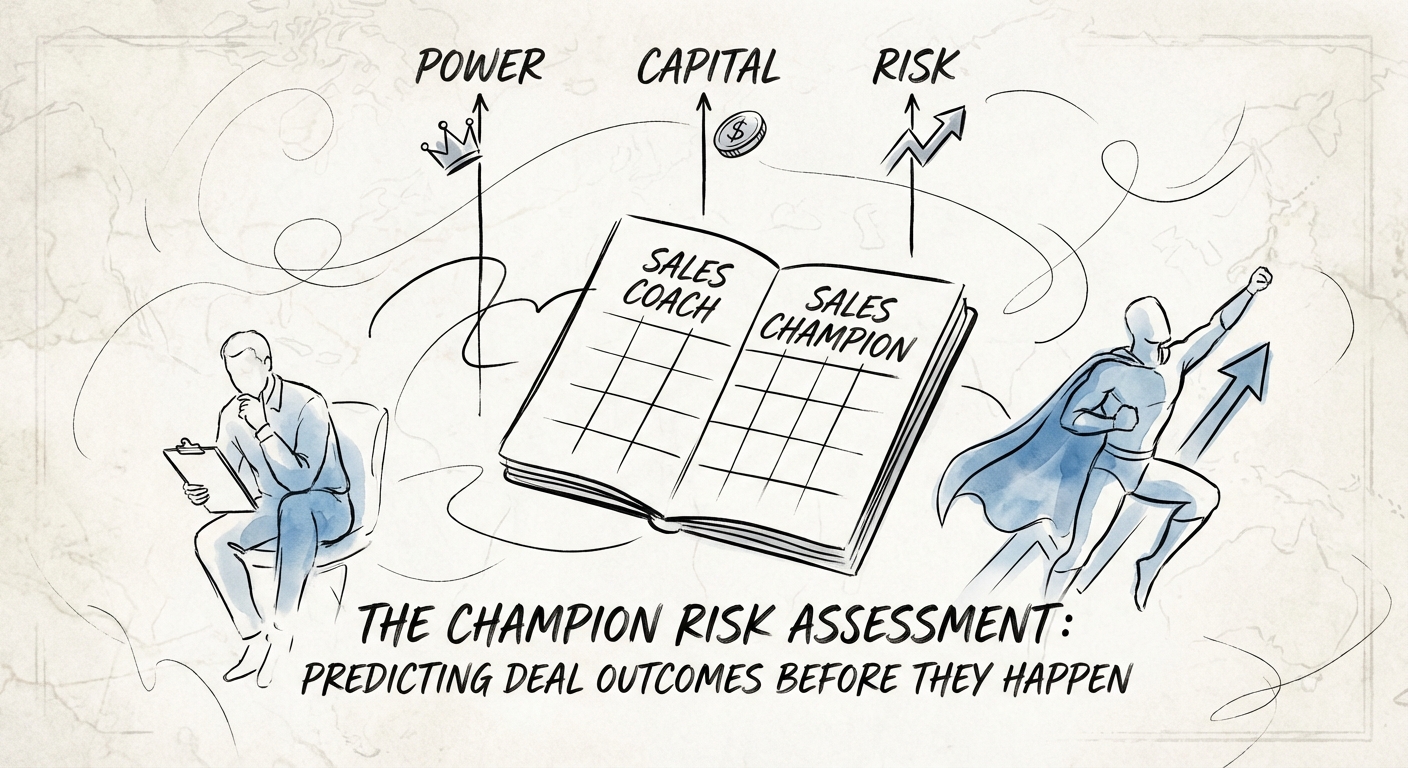
The Champion Risk Assessment: Predicting Deal Outcomes Before They Happen
Stop relying on 'hope' in your pipeline reviews. The Champion Risk Assessment differentiates true Mobilizers from mere Coaches, doubling win rates from 19% to 37%.
37% Win Rate with Verified Champion
BRIEF · EXIT READINESS
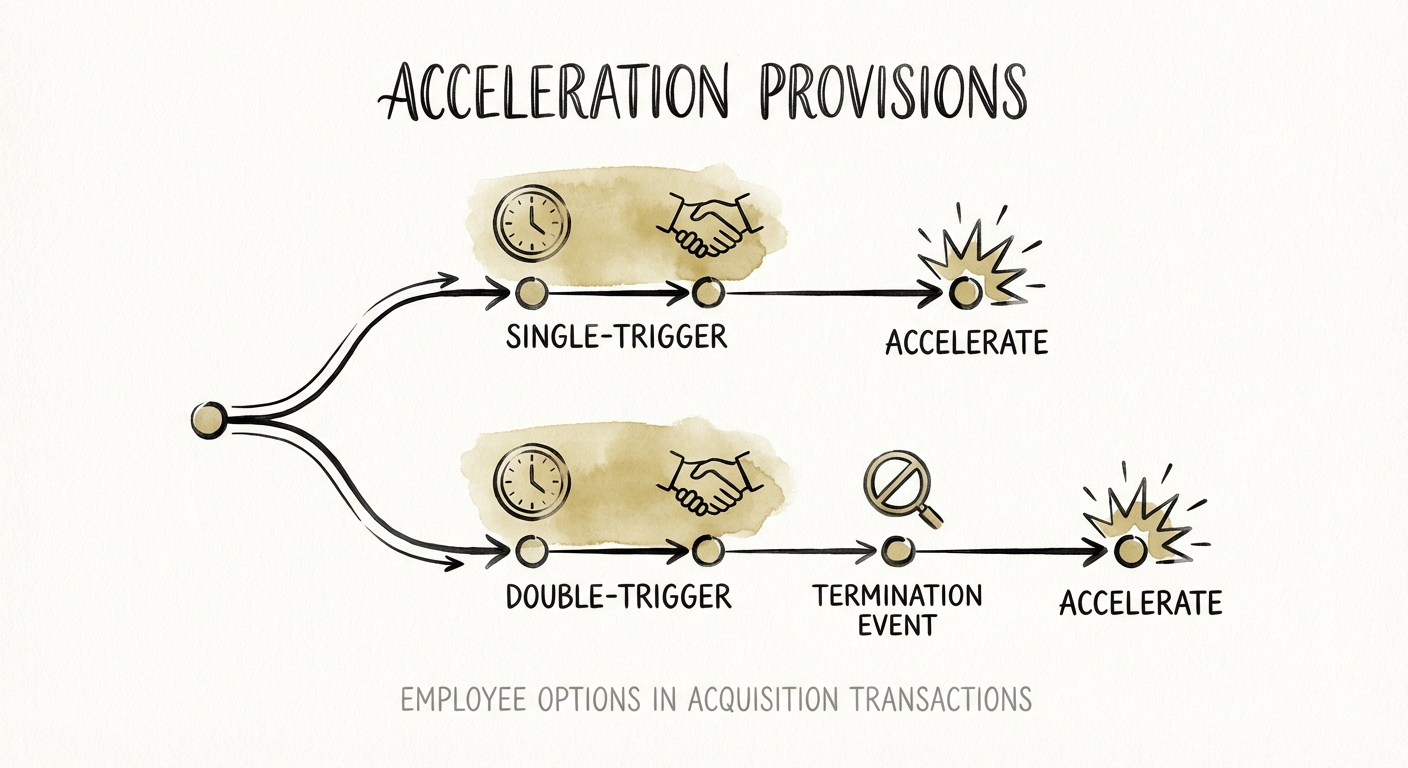
The Acceleration Trap: Why Your 'Generous' Option Grants Are a Poison Pill for Private Equity Exits
Single-trigger option acceleration isn't a perk—it's a poison pill. Learn why PE buyers demand double-trigger vesting and how to fix your cap table before the LOI.
15-20% Deal Value at Risk (Retention Holdback)
BRIEF · EXIT READINESS
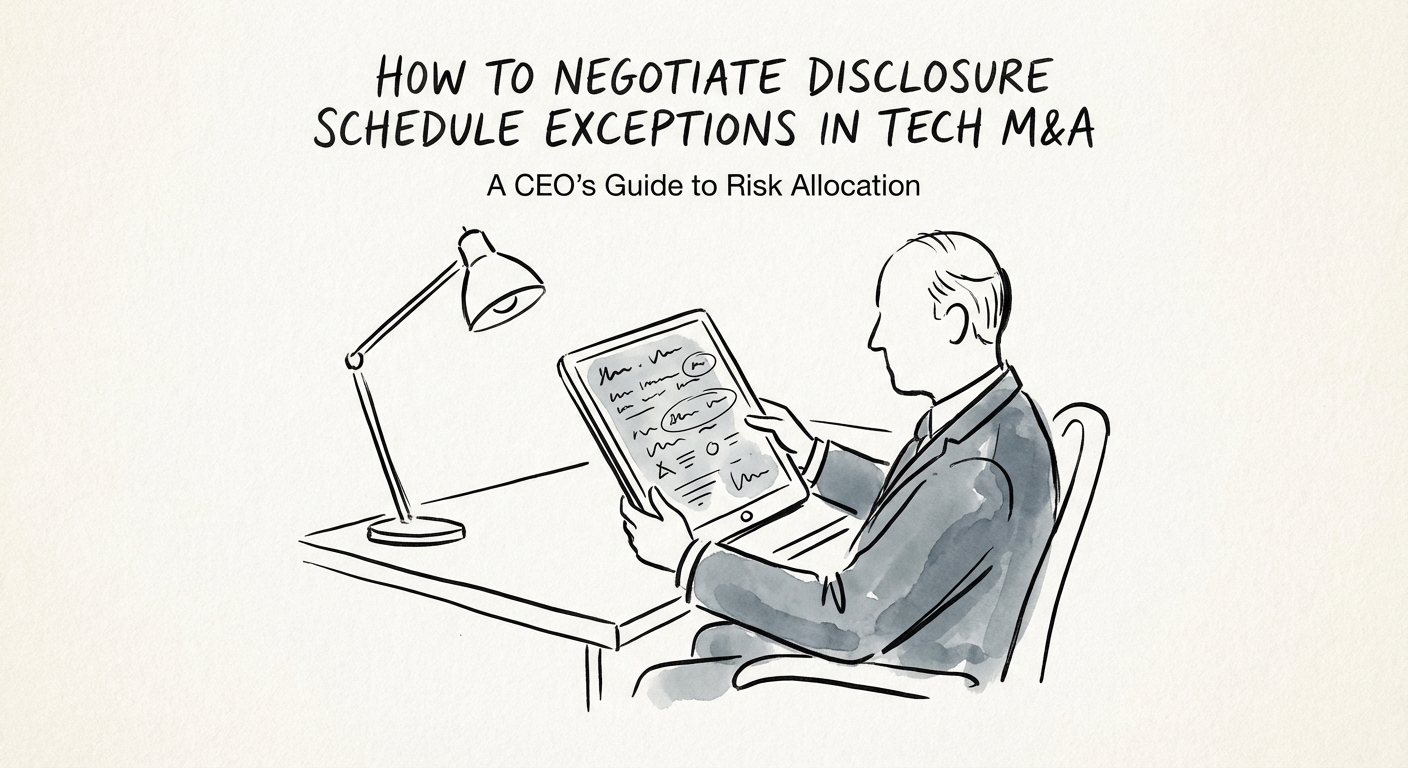
The 'Against the Box' Strategy: Negotiating Disclosure Schedule Exceptions in Tech M&A
Founders often treat disclosure schedules as administrative paperwork, but they are your primary defense against post-closing clawbacks. Here is the 2026 guide to negotiating exceptions in tech M&A.
24% of M&A indemnification claims are for 'Undisclosed Liabilities'
BRIEF · MIGRATION & INTEGRATION
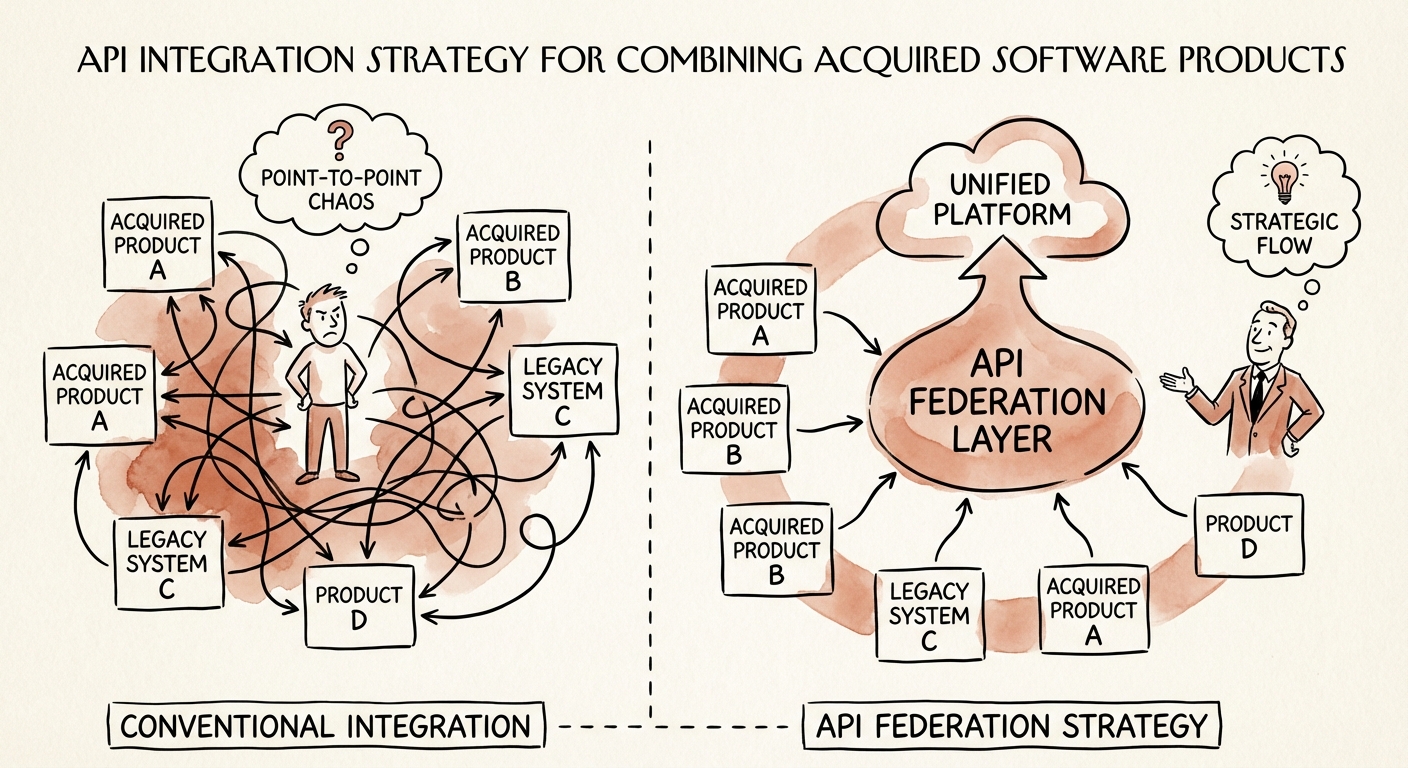
The 'Frankenstein' Platform: Why API Federation Is the Only Viable Integration Strategy for PE Roll-Ups
Stop building 'Frankenstein' platforms. Learn why API federation cuts integration TCO by 50% and accelerates cross-product revenue in PE roll-ups.
50% TCO Reduction
BRIEF · EXIT READINESS
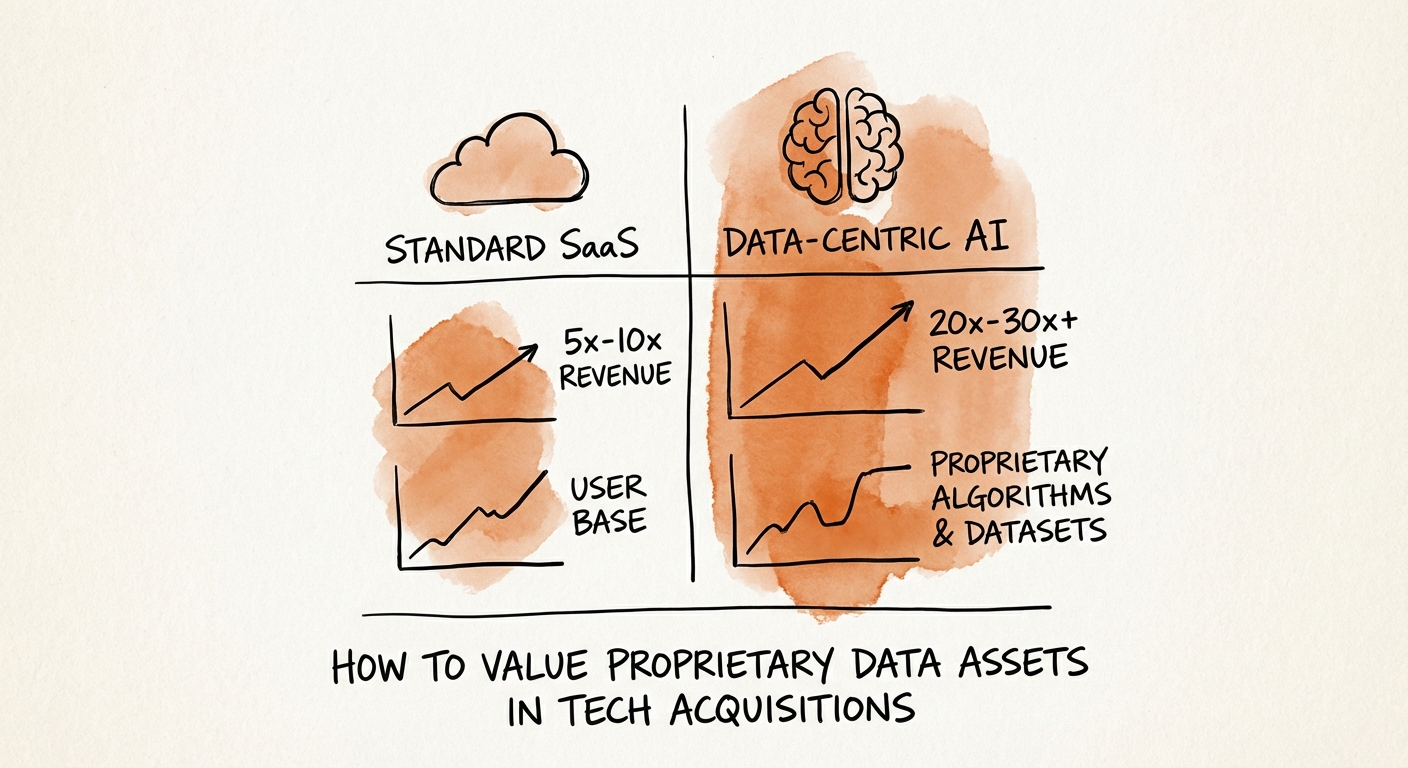
The Hidden Multiple: How to Value Proprietary Data Assets in Tech Acquisitions
Proprietary data assets can drive valuation multiples from 6x to 25.8x. Learn the 3-part framework for valuing data moats in PE and strategic acquisitions.
25.8x Avg. Revenue Multiple for Data/AI Assets (vs. 6.0x for SaaS)
BRIEF · GTM EXECUTION
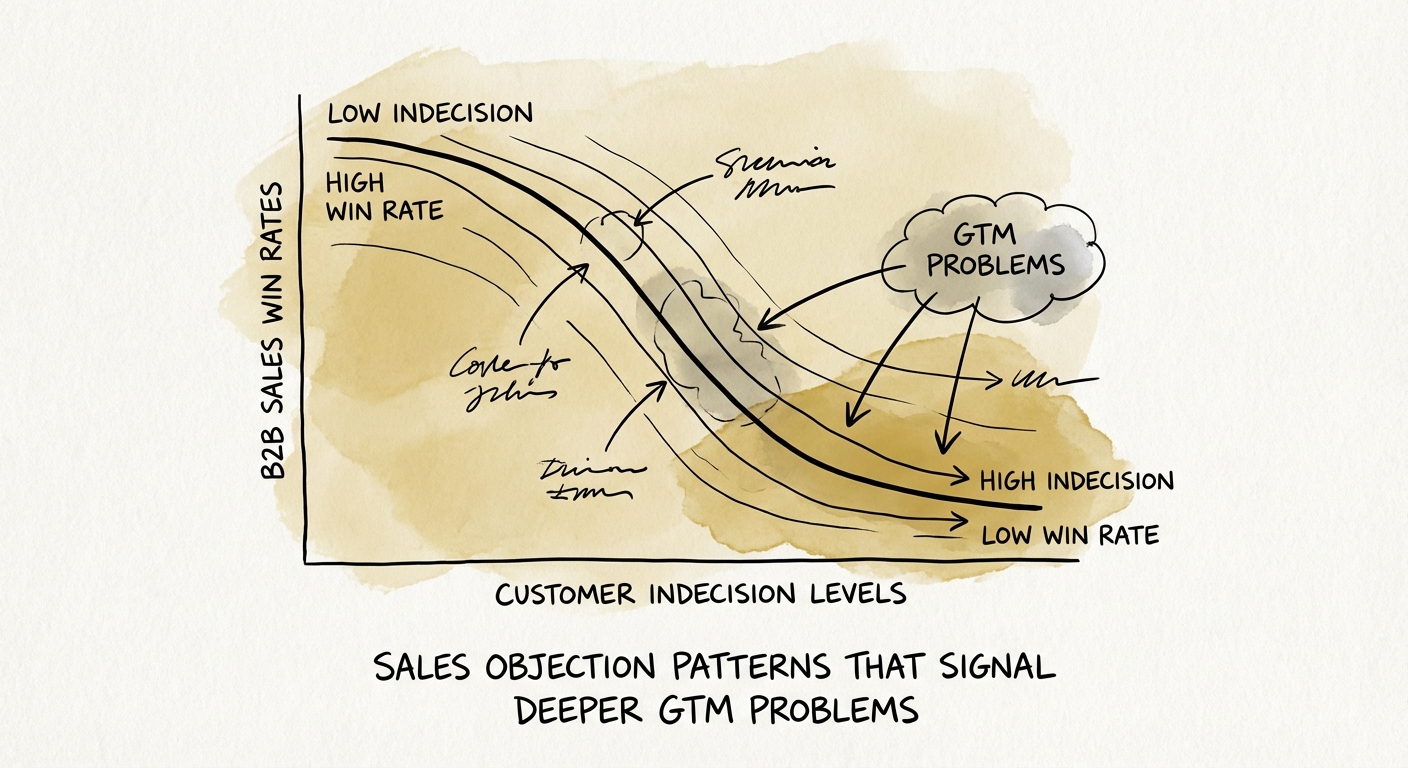
Sales Objection Patterns That Signal Deeper GTM Problems
Stop treating sales objections as isolated hurdles. Learn how to diagnose systemic GTM failures using objection patterns like 'No Decision' and 'Price' vs. Value.
40-60% Deals Lost to 'No Decision'
BRIEF · EXIT READINESS
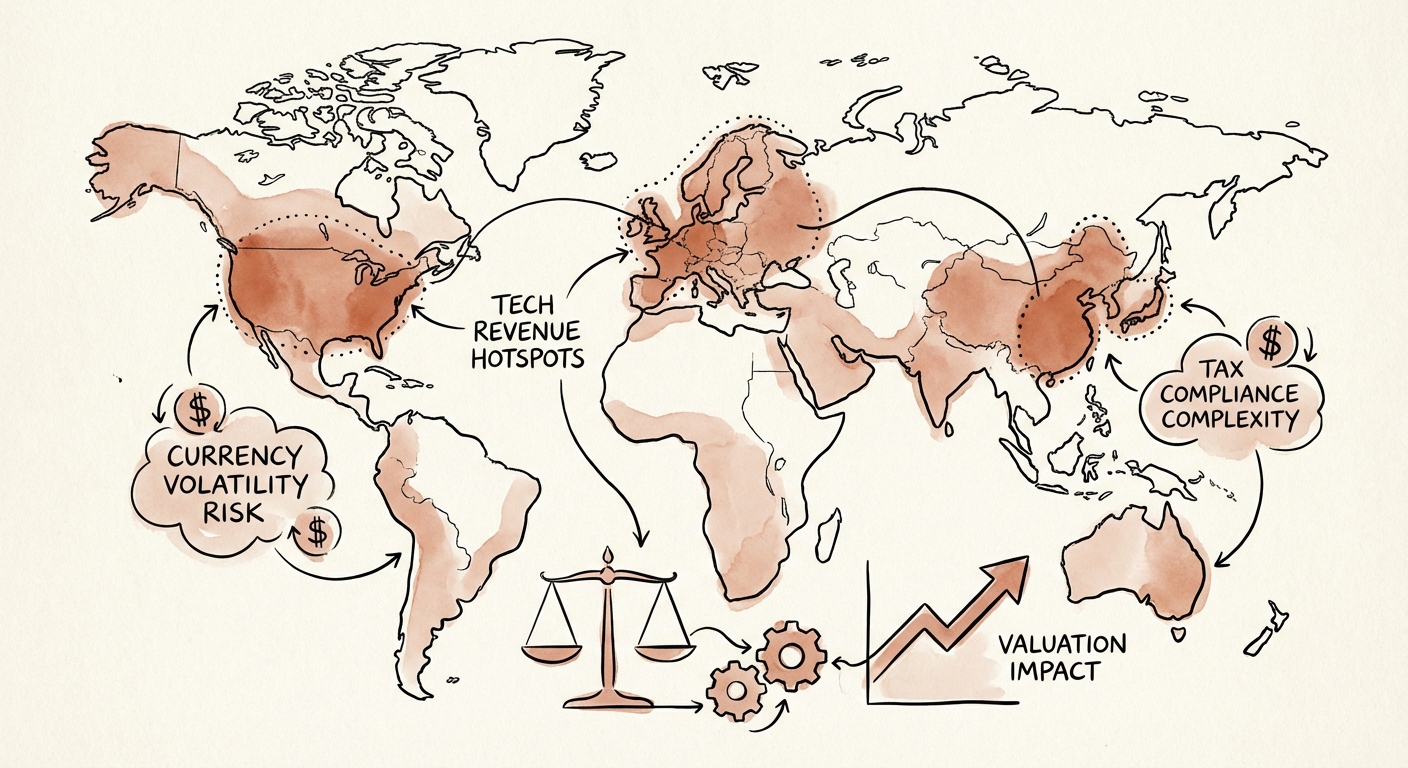
The International Revenue Discount: Why 'Global' Growth Can Kill Your Exit Multiple
International revenue isn't always an asset. Discover why 'accidental exports' create a 20% valuation discount and how to restructure global revenue for a premium exit.
15-20% Valuation Discount for Unhedged FX Risk
BRIEF · EXIT READINESS
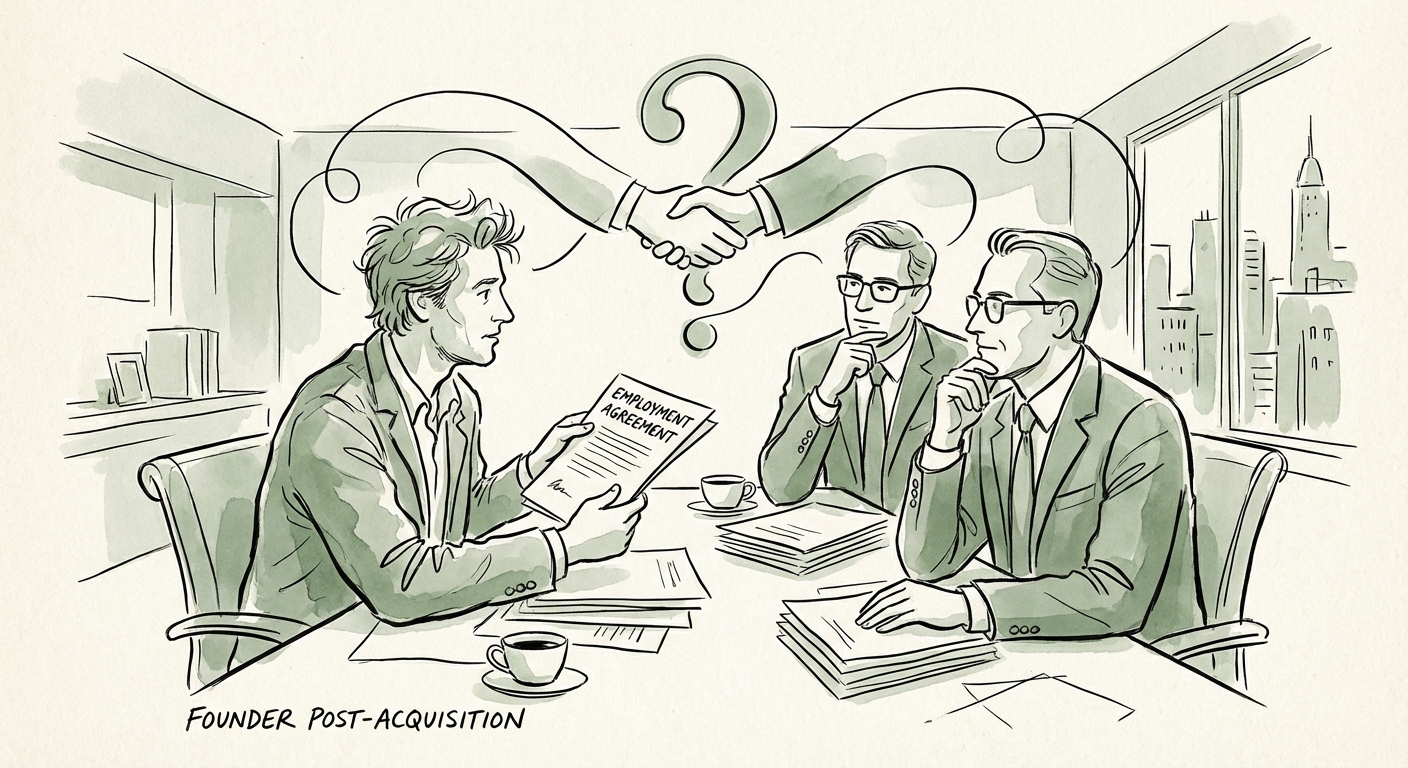
The 'Employee #1' Trap: Negotiating Your Post-Exit Employment Agreement
Don't let 'standard' terms trap your rollover equity. A diagnostic guide to negotiating Good Leaver clauses, non-competes, and retention packages in PE deals.
5.8 Years Median PE Hold Period (2025)
BRIEF · EXIT READINESS
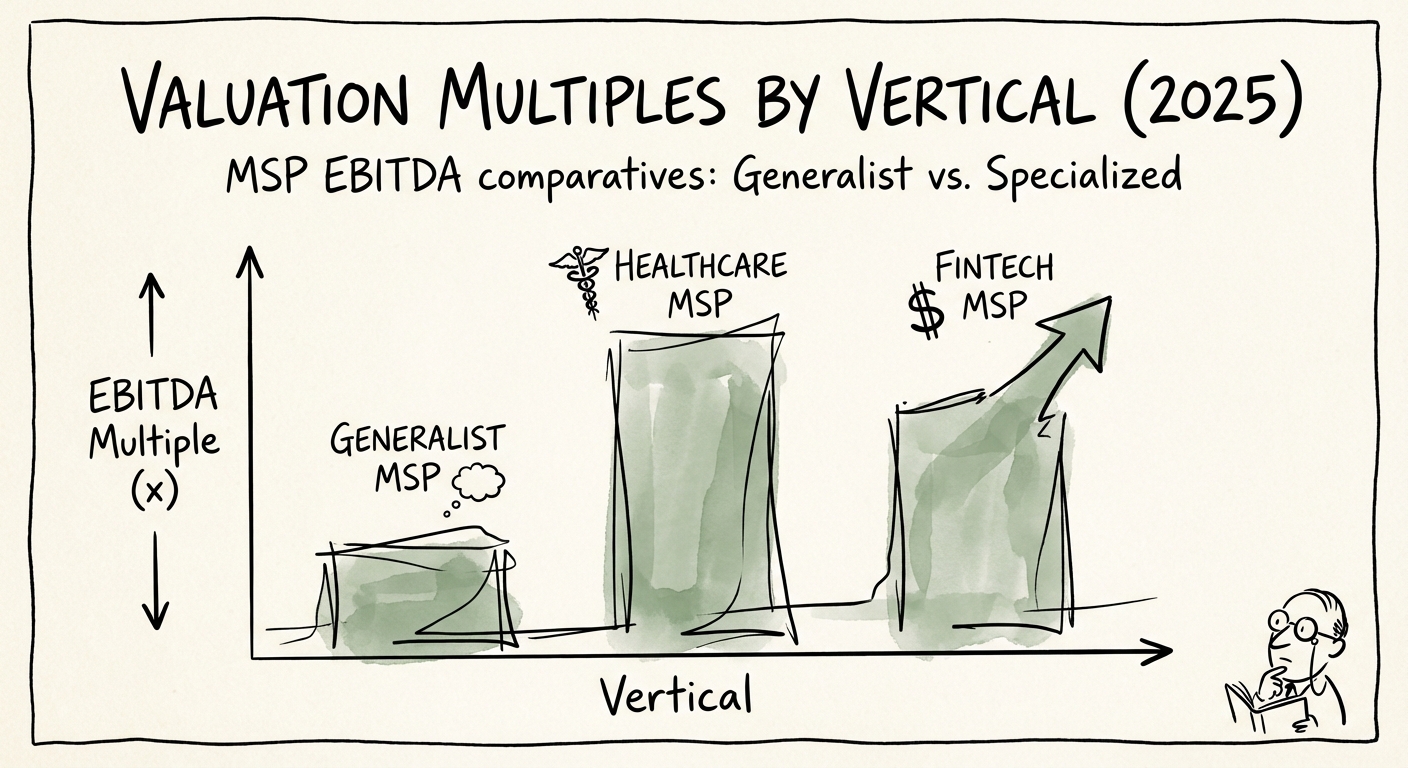
The Vertical Premium: Why Healthcare & FinTech MSPs Trade at 10x While Generalists Stall at 5x
Compare MSP valuation multiples by vertical, including healthcare, FinTech, compliance-led niches, and generalist MSPs preparing for exit.
4.2x EBITDA Multiple Spread (Specialist vs. Generalist)
BRIEF · REVENUE ARCHITECTURE
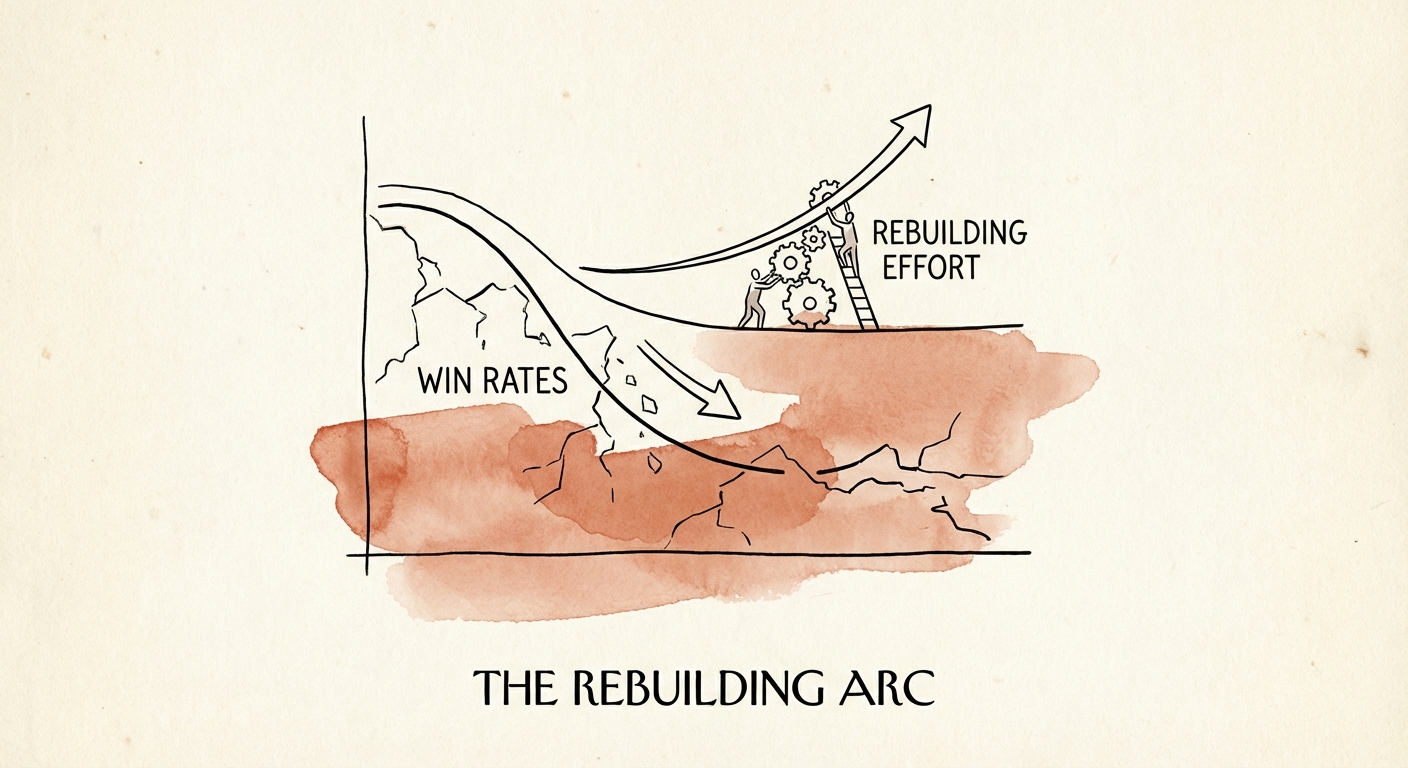
Rebuilding Win Rates After Product-Market Fit Drift: The GTM Realignment Playbook
Declining win rates often signal Product-Market Fit (PMF) Drift, not sales failure. Learn the diagnostic playbook to realign GTM strategy and recover lost deal value.
21% Median B2B Win Rate
BRIEF · MIGRATION & INTEGRATION
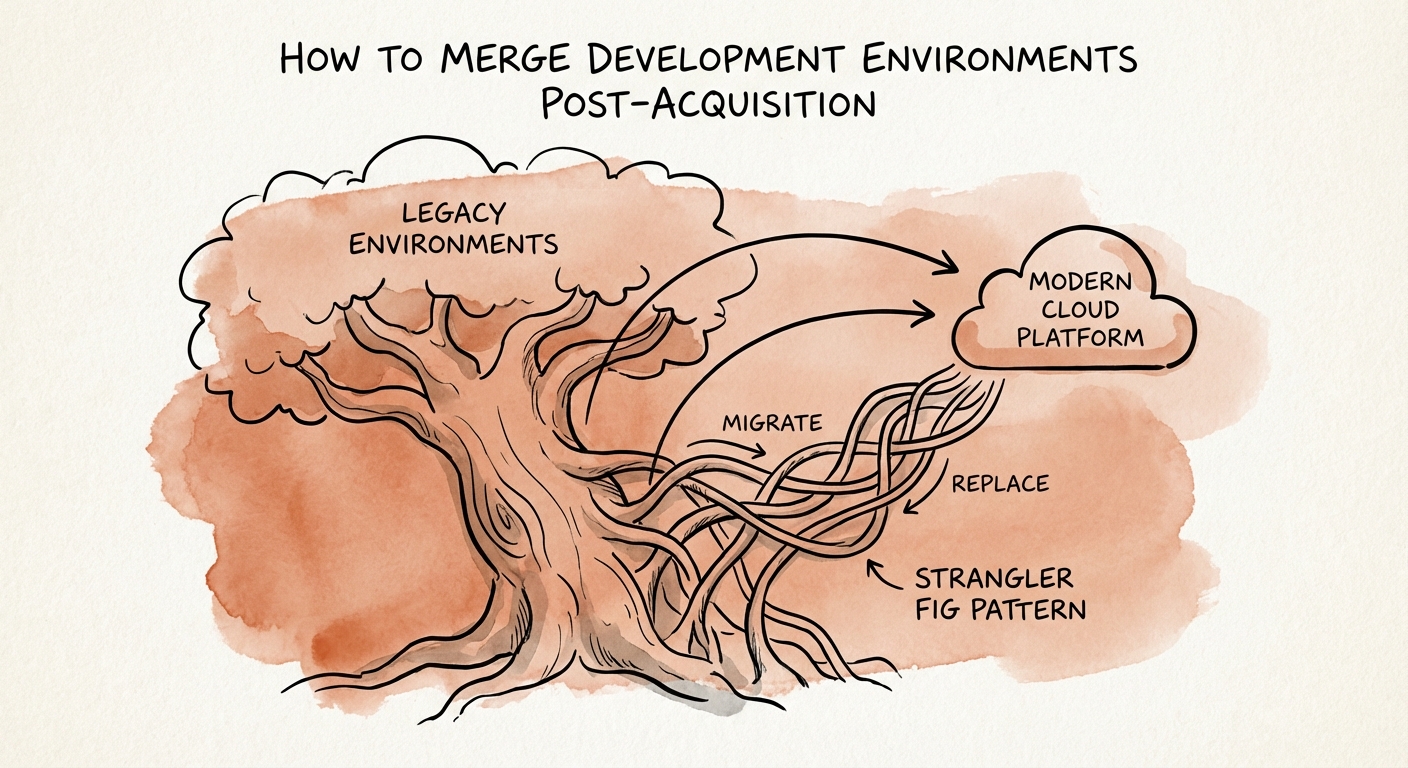
The 'Velocity Tax': Why Keeping Separate Development Environments Kills Deal Value
Stop paying the 'Velocity Tax.' A diagnostic guide for PE-backed CTOs on merging development environments, unifying CI/CD pipelines, and protecting deal value.
3x Higher Maintenance Cost
BRIEF · EXIT READINESS
The Federal Discount vs. The Sovereign Premium: Valuing Government Revenue in 2026
The gap between 4x and 14x multiples in GovTech M&A comes down to contract transferability. Learn how to value set-asides, funded backlog, and FedRAMP authority.
3x-14x Valuation Gap (Set-Aside vs. Full & Open)
BRIEF · MIGRATION & INTEGRATION
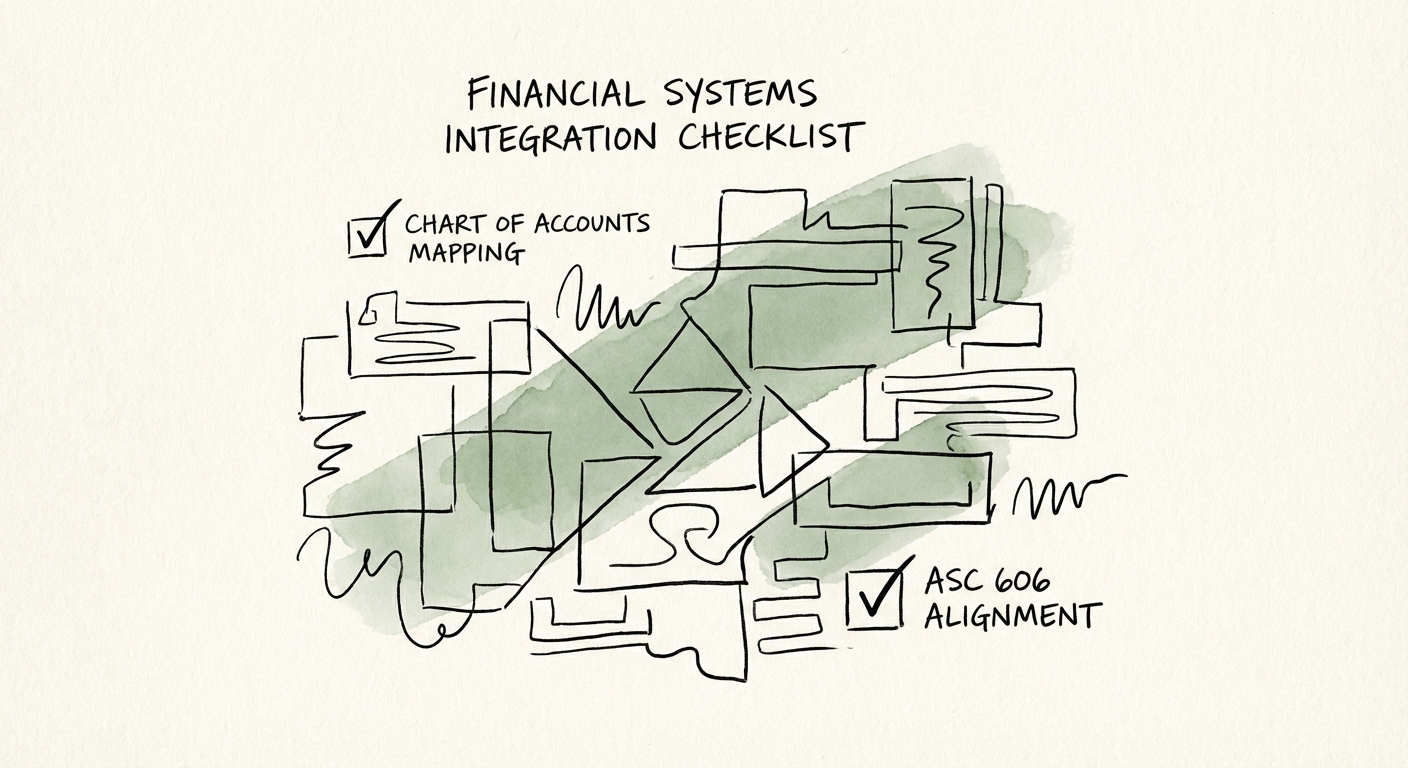
The Financial Systems Integration Checklist: Preventing the 'Black Box' Merger
A diagnostic checklist for PE sponsors and CFOs to prevent financial integration failure. Covers ERP consolidation, ASC 606 alignment, and the 'Two-Tier' strategy.
40% Integration Delay Risk
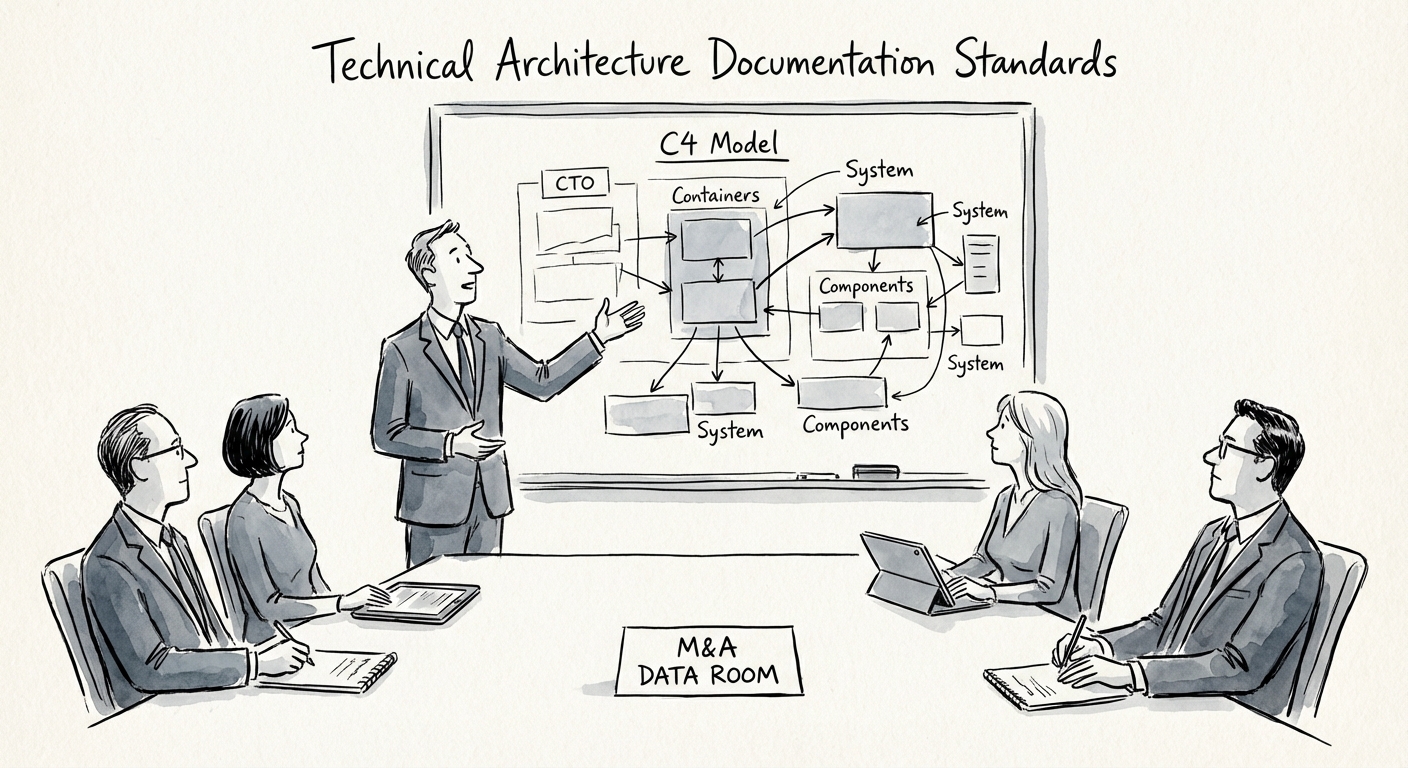
BRIEF · PROCESS DOCUMENTATION
Technical Architecture Documentation Standards: The Difference Between a 'Red Flag' and a 'Platform Asset'
Why 'tribal knowledge' kills exit valuations. A CTO's guide to C4 model architecture documentation standards for private equity due diligence.
31% Avg. Technical Debt in Acquired Codebases
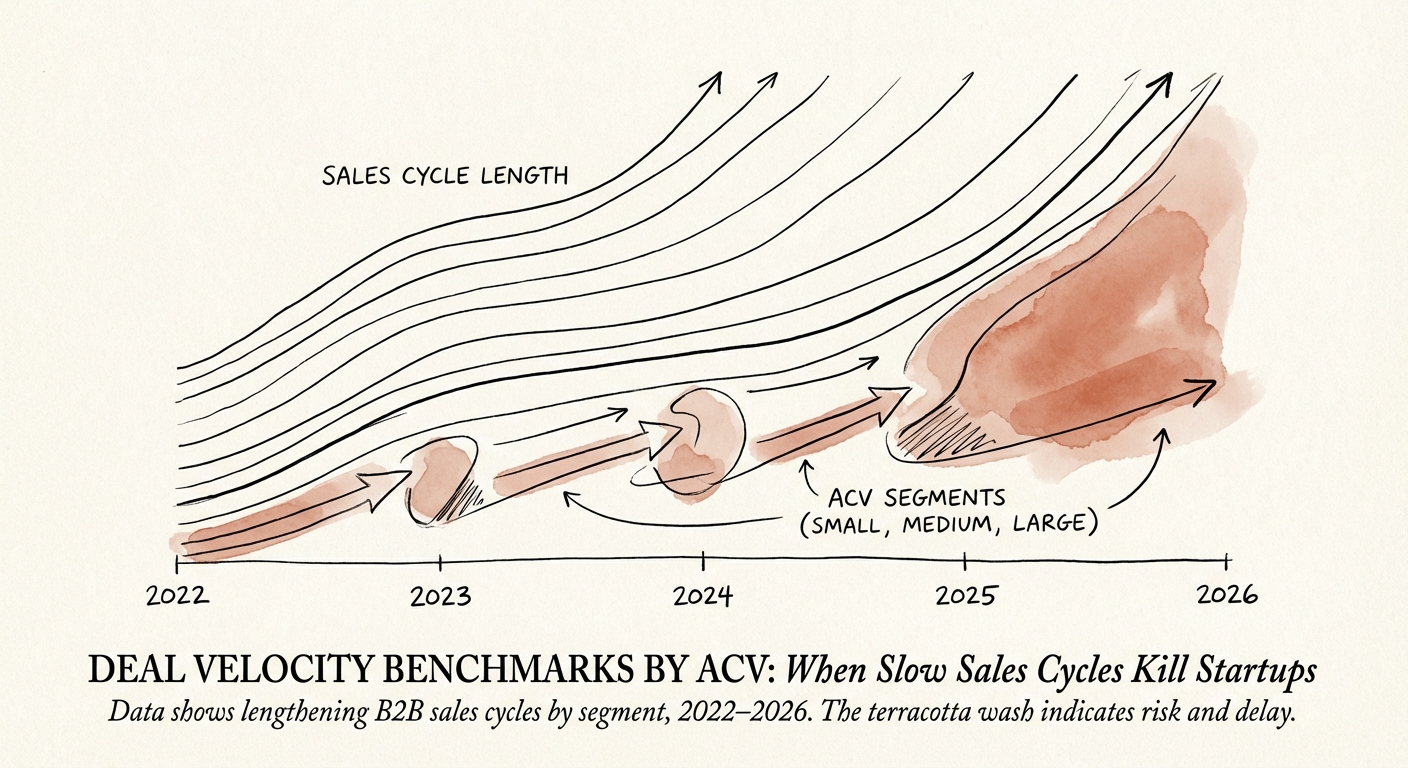
BRIEF · GTM EXECUTION
Deal Velocity Benchmarks by ACV: When Slow Sales Cycles Kill Startups
New 2026 data reveals average sales cycles have lengthened by 22%. Compare your deal velocity against $25k, $50k, and $100k ACV benchmarks to spot stalled pipeline.
126 Days Avg. Sales Cycle ($50k-$100k ACV)
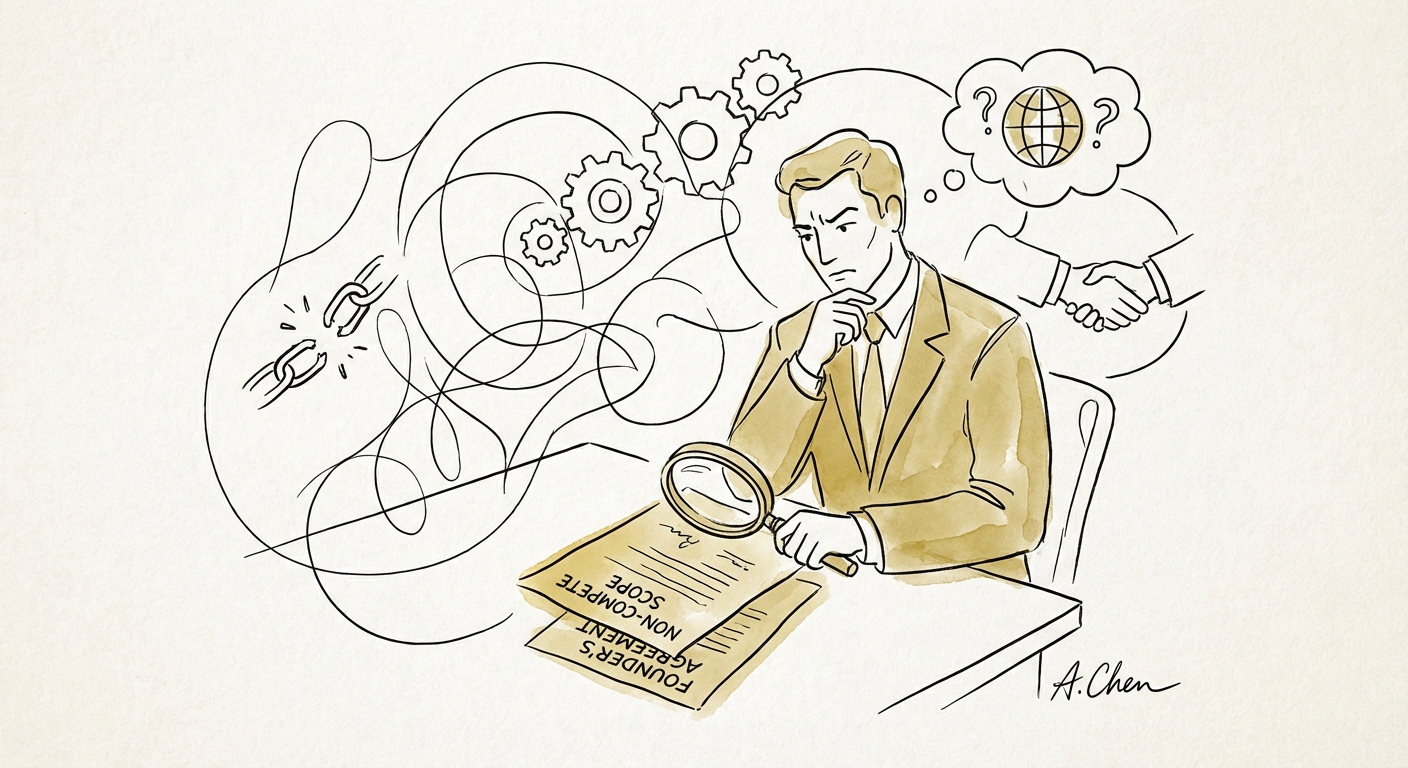
BRIEF · EXIT READINESS
The 5-Year Career Gap: Negotiating Non-Competes in the 'Sale of Business' Era
While employee non-competes face bans, founder 'sale of business' covenants are getting stricter. Learn the 2026 benchmarks for duration, scope, and the critical definitions that protect your future.
5 Years Standard Duration for Founder Non-Competes
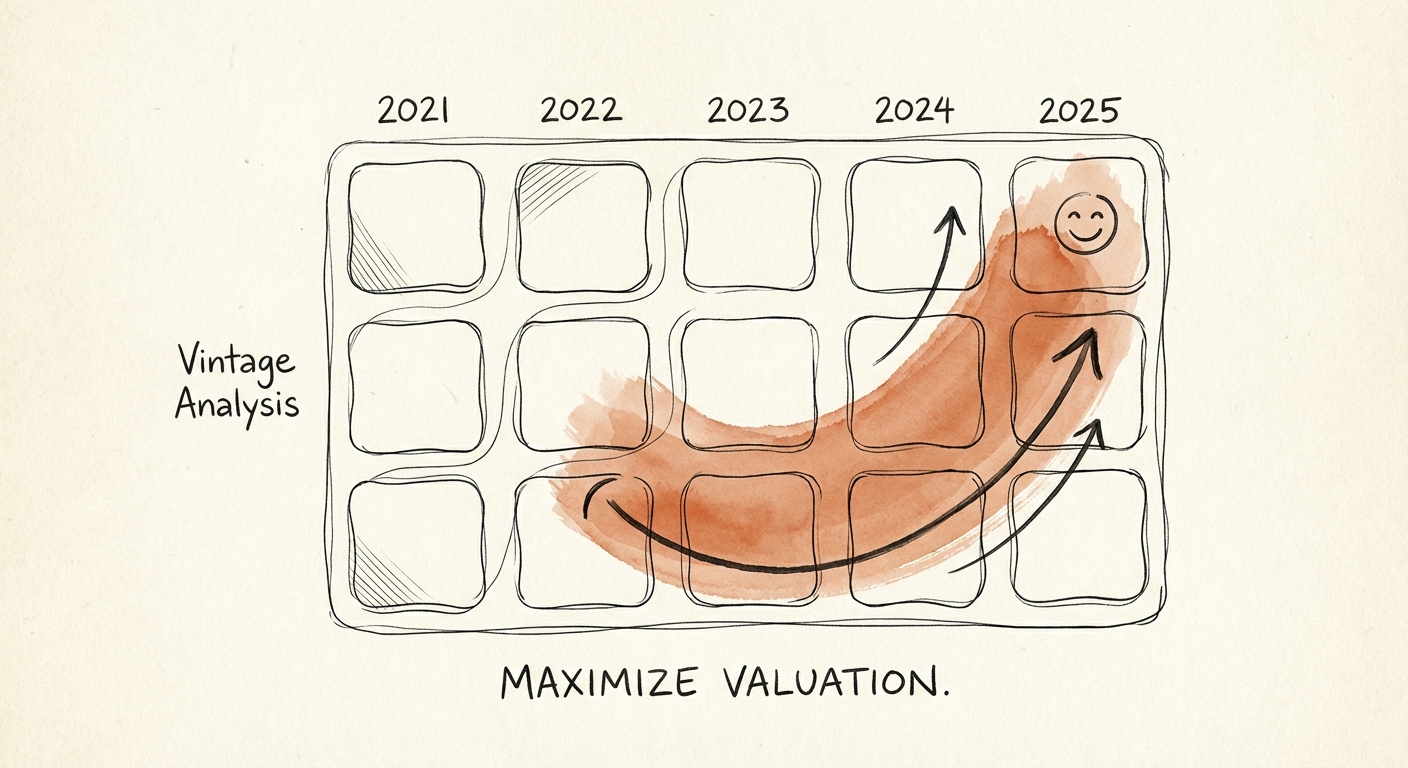
BRIEF · EXIT READINESS
The Valuation Gap: How to Present Customer Cohort Data to Maximize Your Exit Multiple
Stop presenting aggregate churn. Learn how to visualize customer cohort data to unlock a 63% valuation premium. 2026 benchmarks for NRR, GRR, and retention heatmaps.
63% Valuation Premium for Top-Quartile NRR
BRIEF · PROCESS DOCUMENTATION
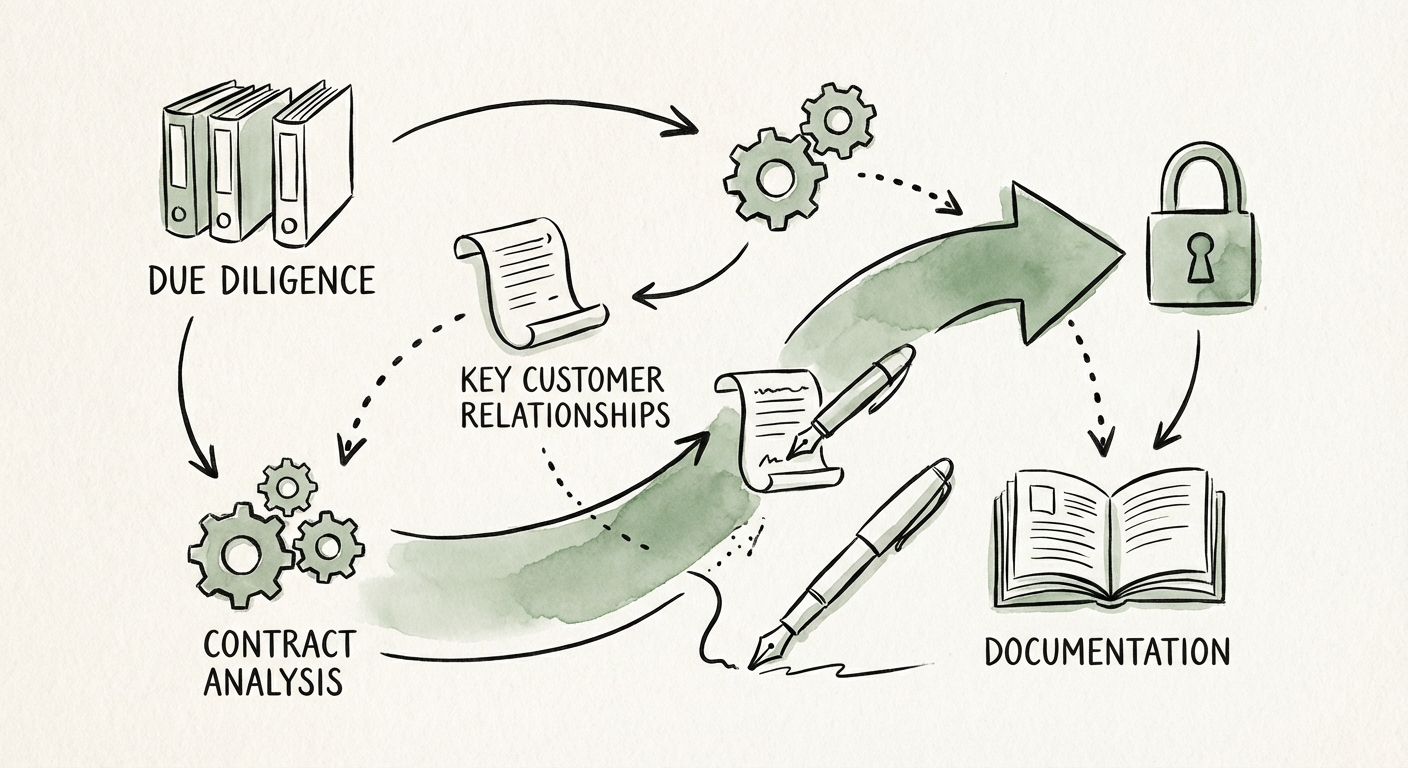
The Handshake Discount: Why Undocumented Customer Relationships Hurt Exit Value
Undocumented customer relationships create transfer risk in M&A. Learn the 3-level framework buyers expect before trusting customer revenue.
3 Buyer Documentation Levels
BRIEF · MIGRATION & INTEGRATION
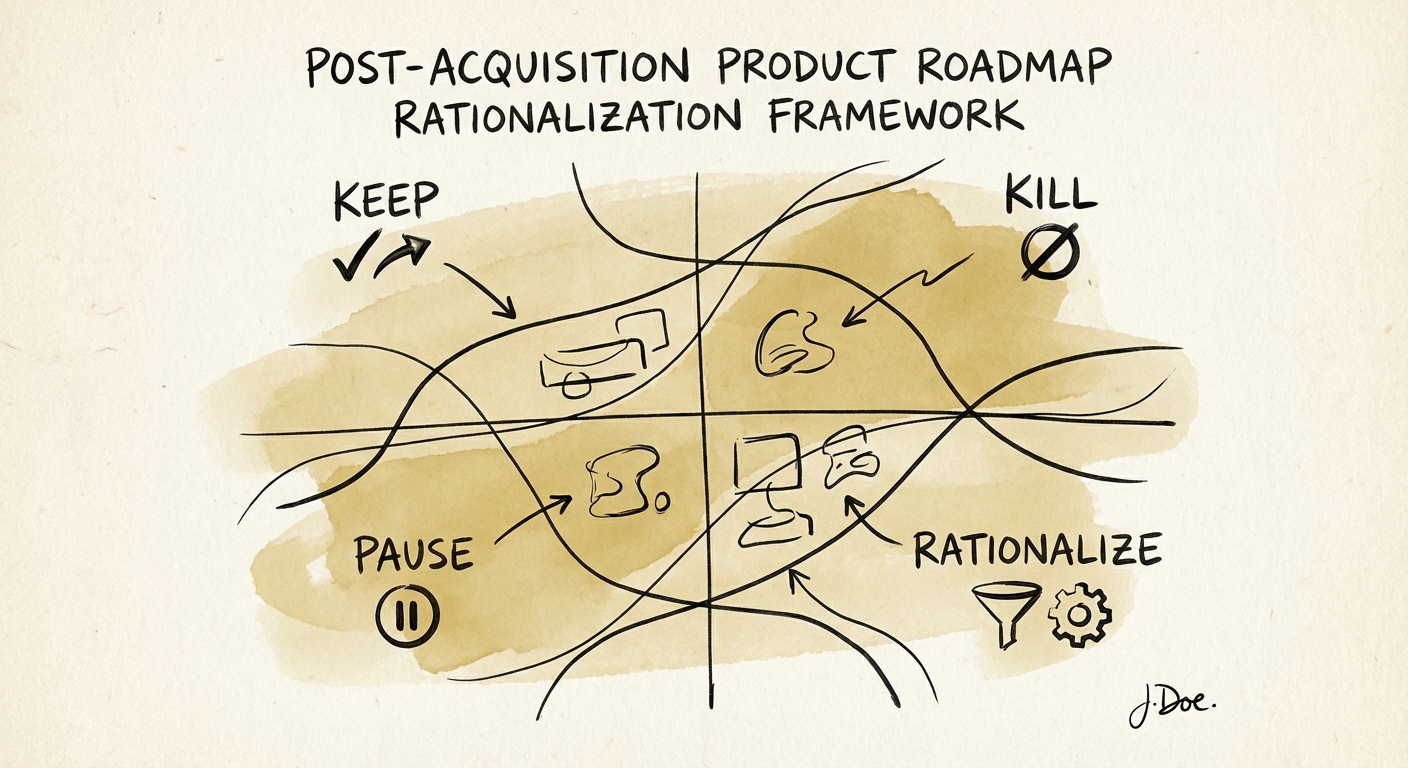
Post-Acquisition Product Roadmap Rationalization Framework
A diagnostic framework for Private Equity Operating Partners to rationalize product roadmaps post-acquisition. Learn why 80% of features are waste and how to realign engineering with EBITDA.
80% of SaaS features are rarely or never used
BRIEF · REVENUE ARCHITECTURE
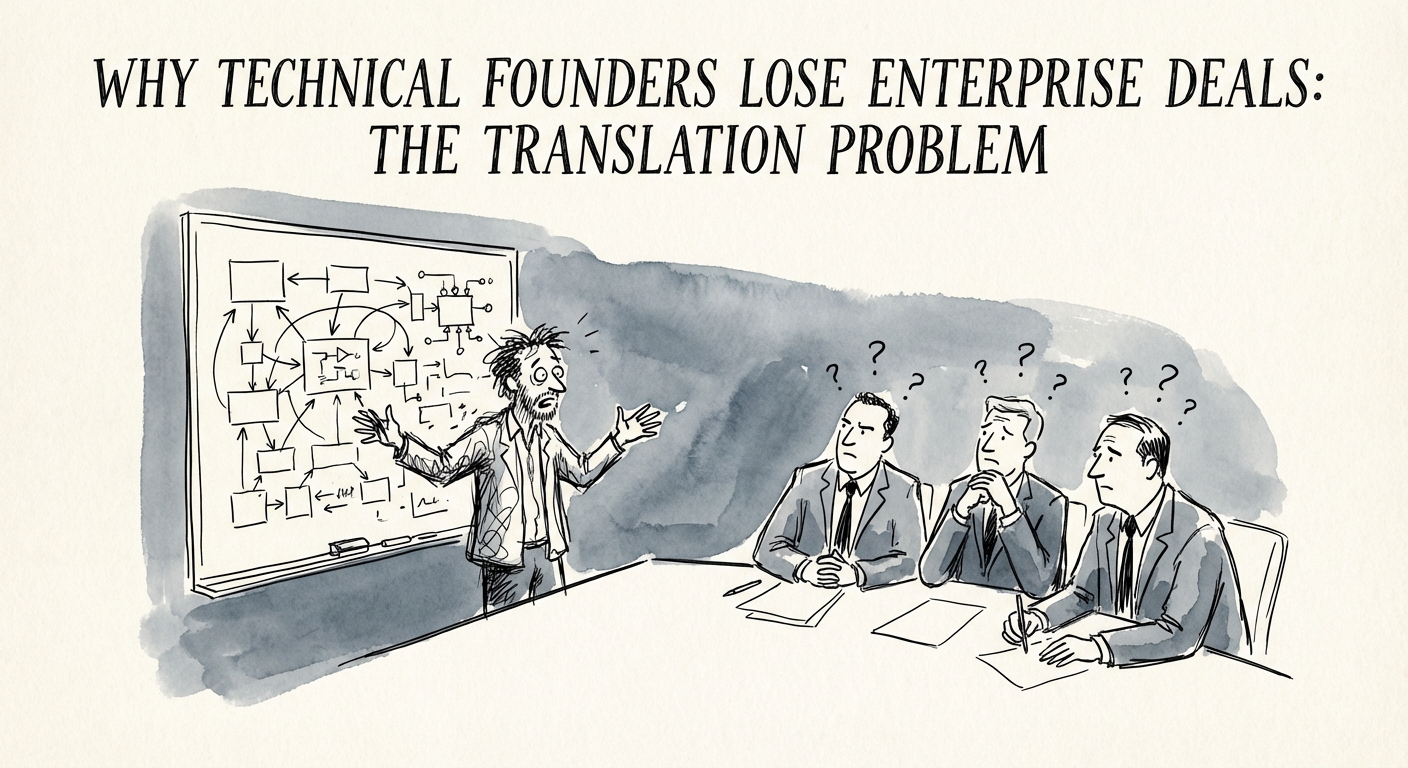
Why Technical Founders Lose Enterprise Deals: The Translation Problem
Technical founders often fail in enterprise sales not because of their product, but their pitch. Learn how to fix the 'Translation Problem' and close more deals.
54.5% Misalignment on Core Problem