BRIEF · TECHNICAL DEBT
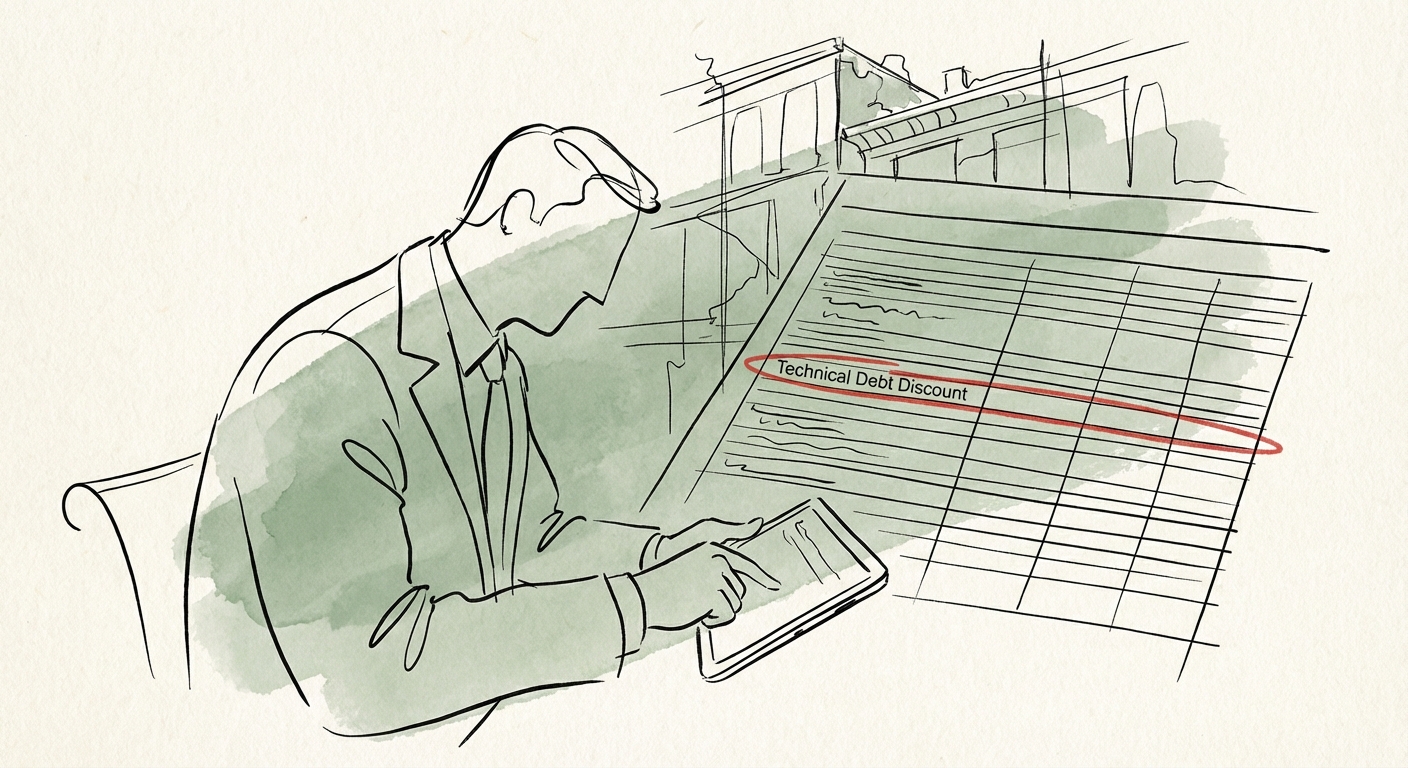
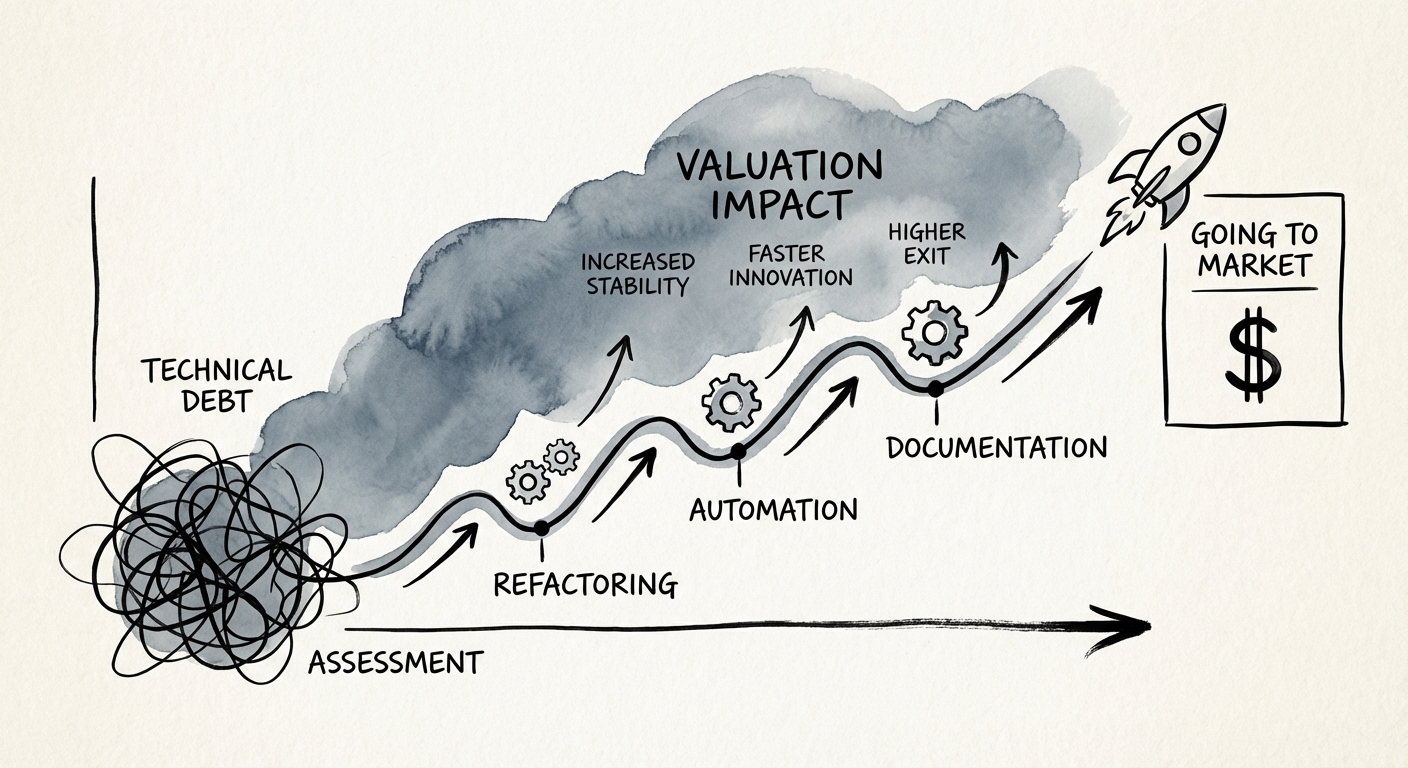
The Legacy Code Discount: Why Aging Tech Stacks Cost You 3 Valuation Turns
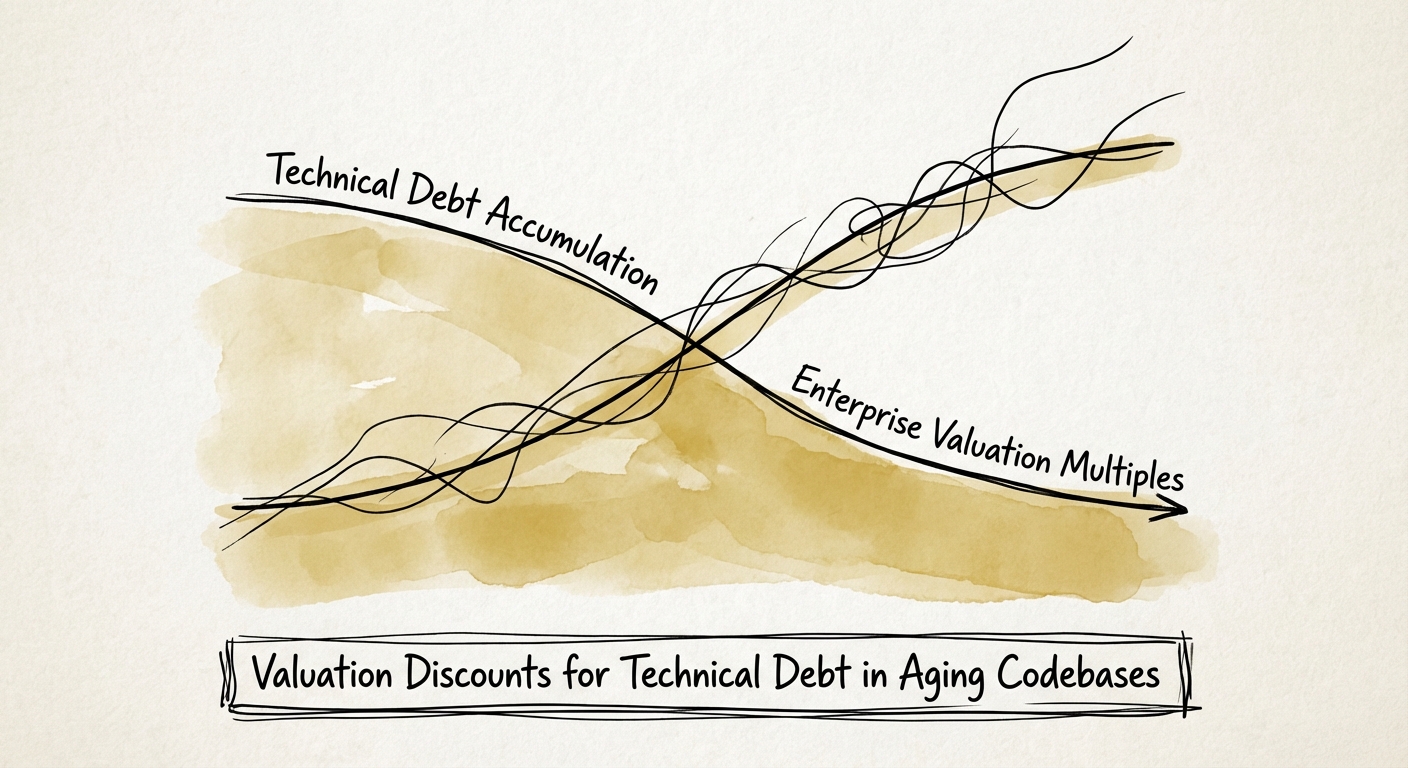
Technical debt isn't just an engineering problem; it's a 30% valuation haircut. Learn how aging codebases depress M&A multiples and how to quantify the 'Innovation Tax' in due diligence.
30% Valuation Discount
BRIEF · TECHNICAL DEBT
The Legacy Code Discount: Why Your Portfolio Company is Worth 30% Less Than You Think
New 2026 data reveals how technical debt creates a 30% valuation discount in PE exits. Learn the benchmarks for code aging and remediation costs.
30% Valuation Discount
BRIEF · EXIT READINESS
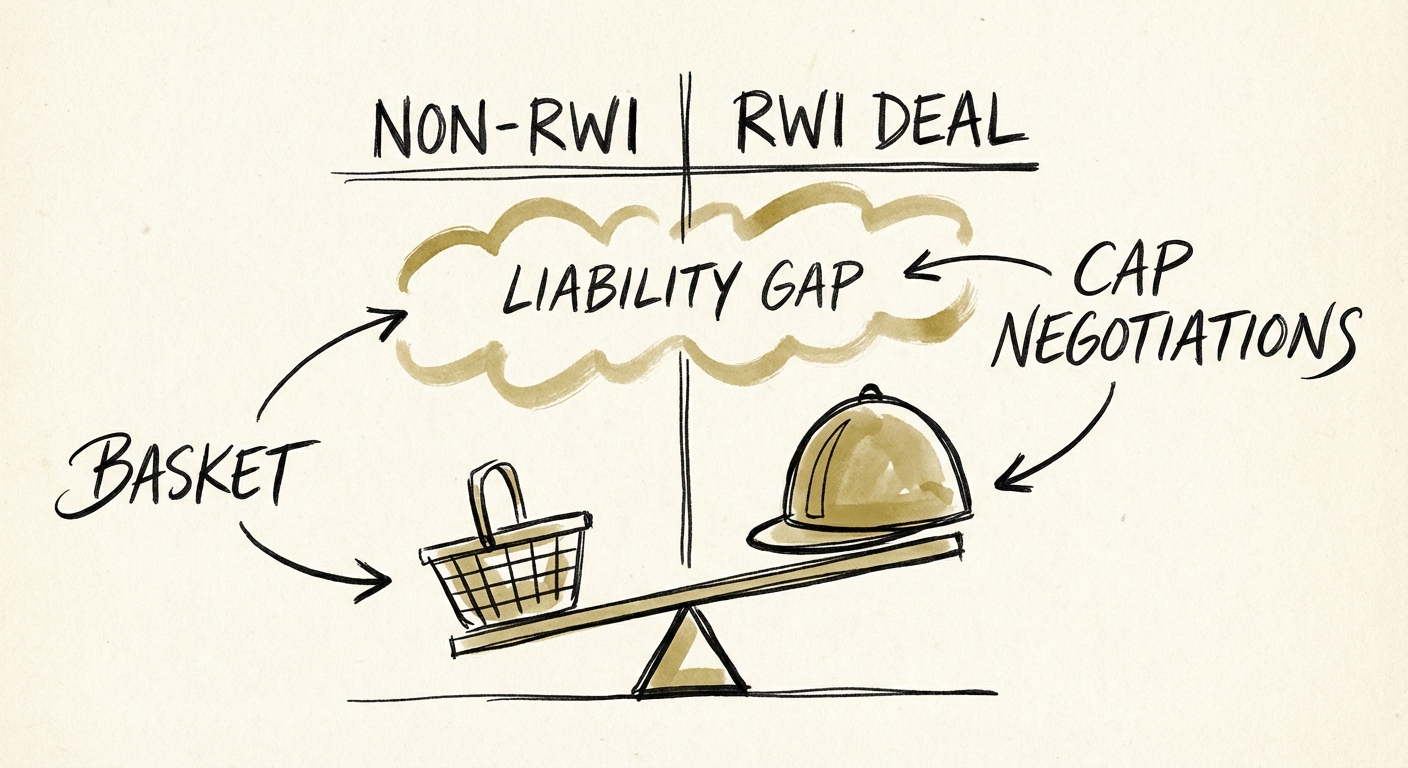
The 9.5% Risk Gap: Why 'Standard' Indemnity Terms Are a Valuation Trap
Founders focus on valuation, but indemnification caps determine what you keep. New 2026 data on RWI, baskets, and the 'No-Recourse' deal structure.
9.5% Deal Value Risk Delta
BRIEF · REVENUE ARCHITECTURE
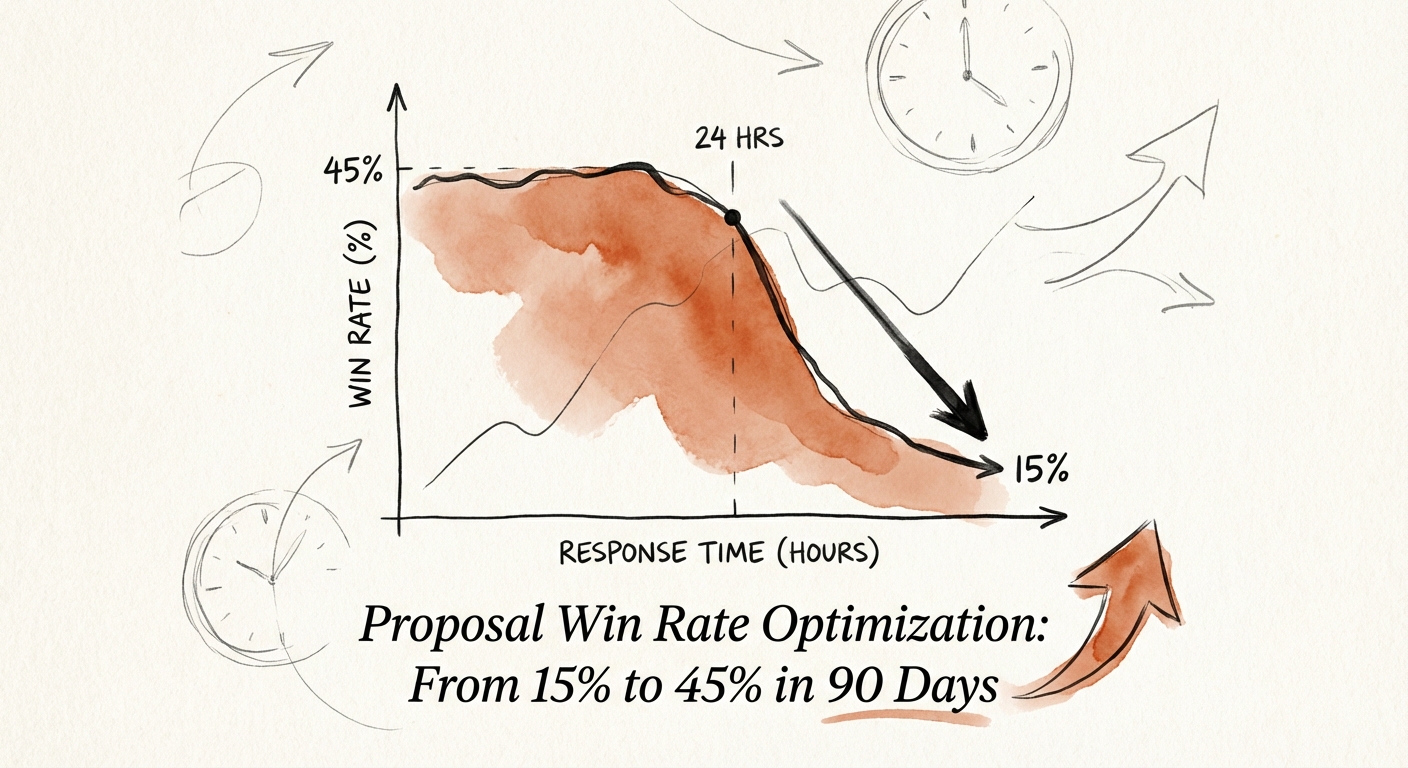
Proposal Win Rate Optimization: From 15% to 45% in 90 Days
A diagnostic guide for PE sponsors to optimize portfolio company proposal processes. Move from 15% win rates to 45% using 'Go/No-Go' logic, executive summary restructuring, and speed-to-value metrics.
45% Target Win Rate
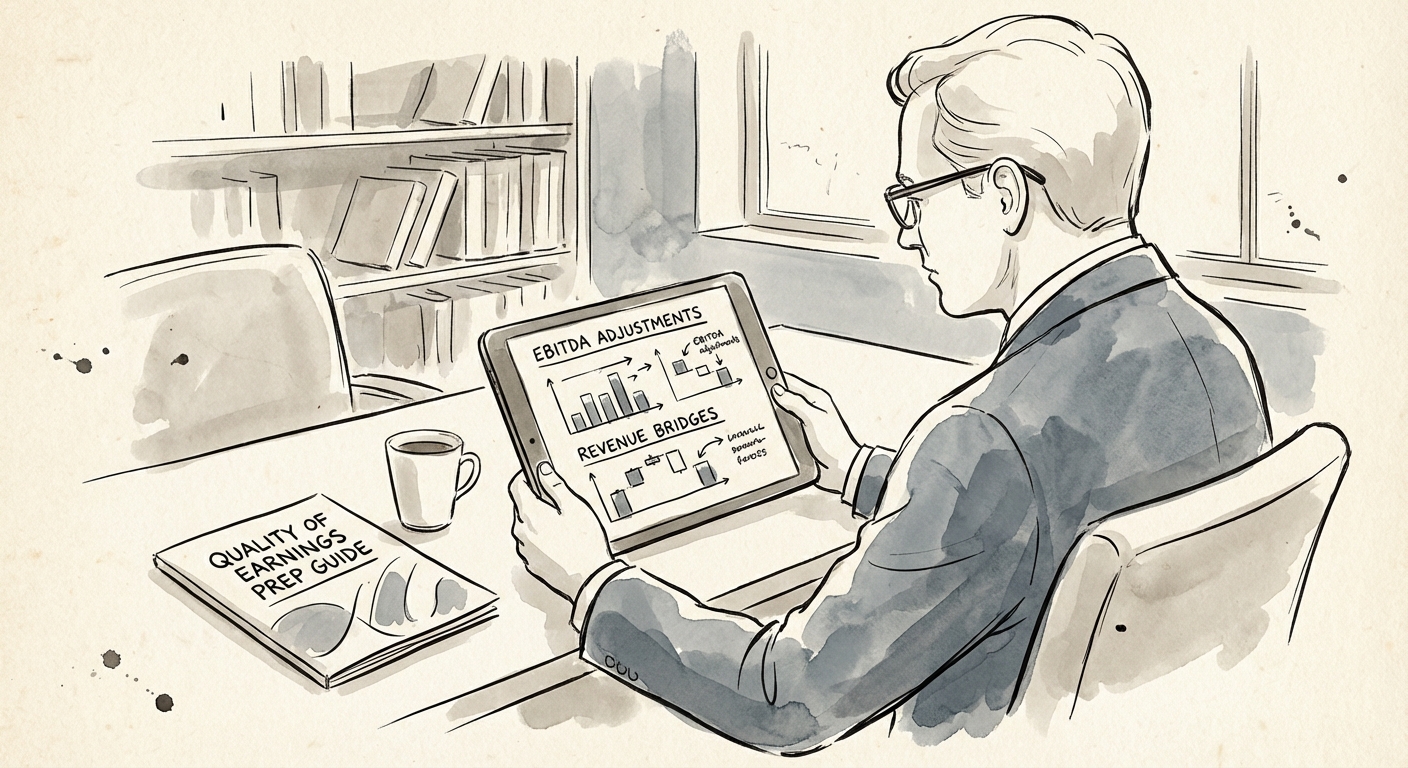
BRIEF · PROCESS DOCUMENTATION
Quality of Earnings Preparation Guide for Software Companies: Avoiding the 30% Re-Trade
A comprehensive Quality of Earnings (QoE) preparation guide for software founders. Learn how to avoid the 30% re-trade, navigate ASC 606, and leverage new 2026 capitalization rules.
30% Potential Valuation Haircut from Poor QoE
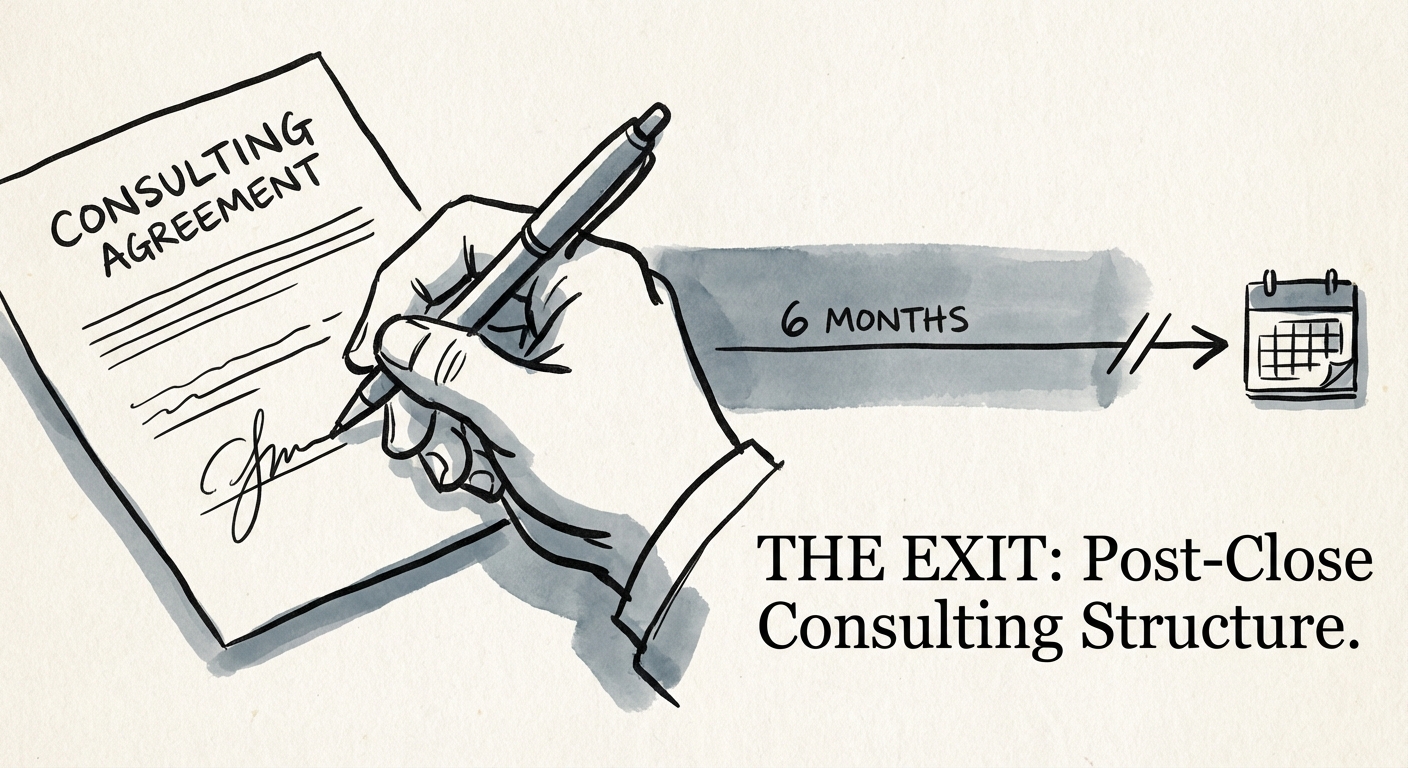
BRIEF · EXIT READINESS
The Founder Consulting Agreement: Why Most of Them Quietly Blow Up the Deal
The post-close consulting agreement is the deal document most likely to trigger a 20% 409A penalty or create a Shadow CEO. Here's how to structure it right.
20% Max Service Level for 409A Separation
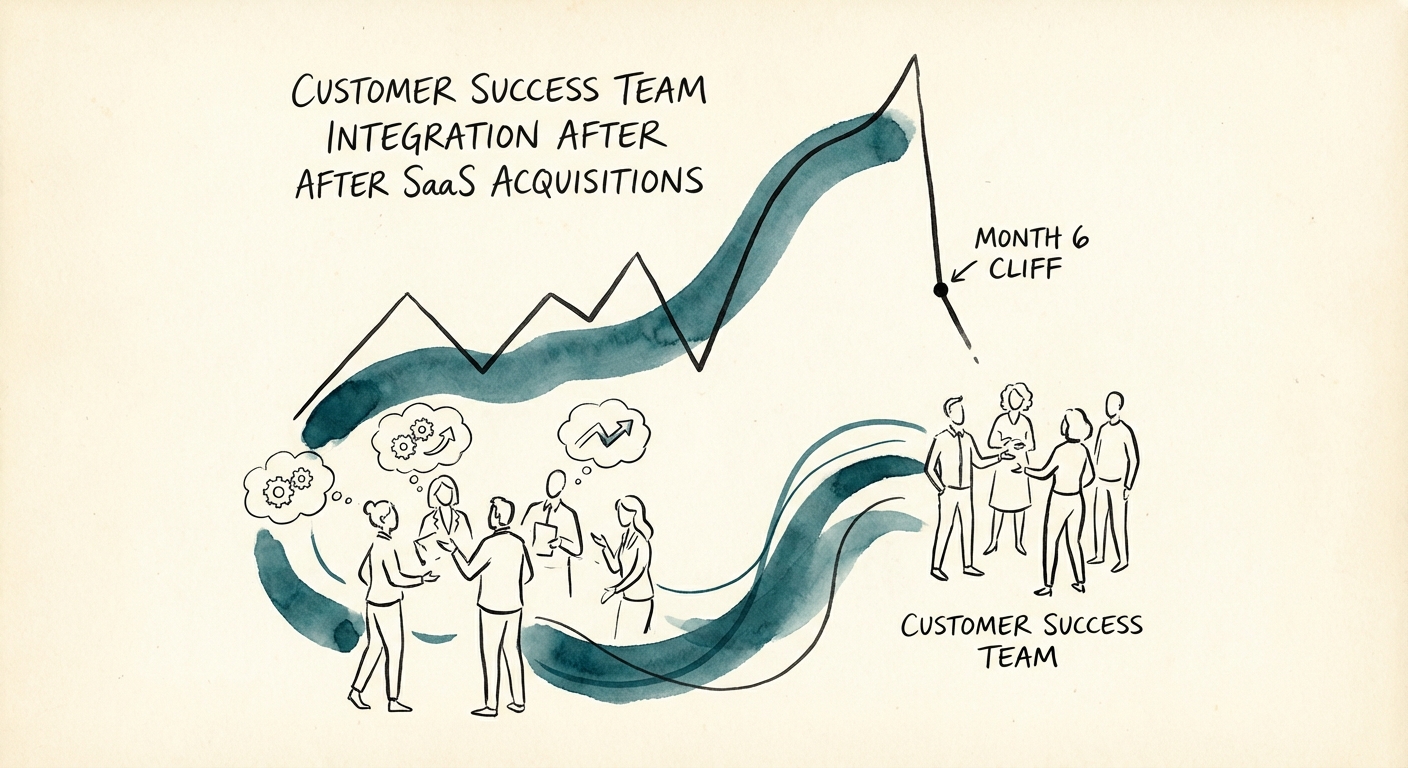
BRIEF · MIGRATION & INTEGRATION
Customer Success Integration: The 'Month 6 Cliff' That Kills Deal Value
Post-acquisition customer success integration failures cost PE firms 18% of deal value. Learn the diagnostic framework to prevent the 'Month 6 Cliff' and merge CS teams without destroying NRR.
47% Key Employee Turnover (Year 1 Post-M&A)
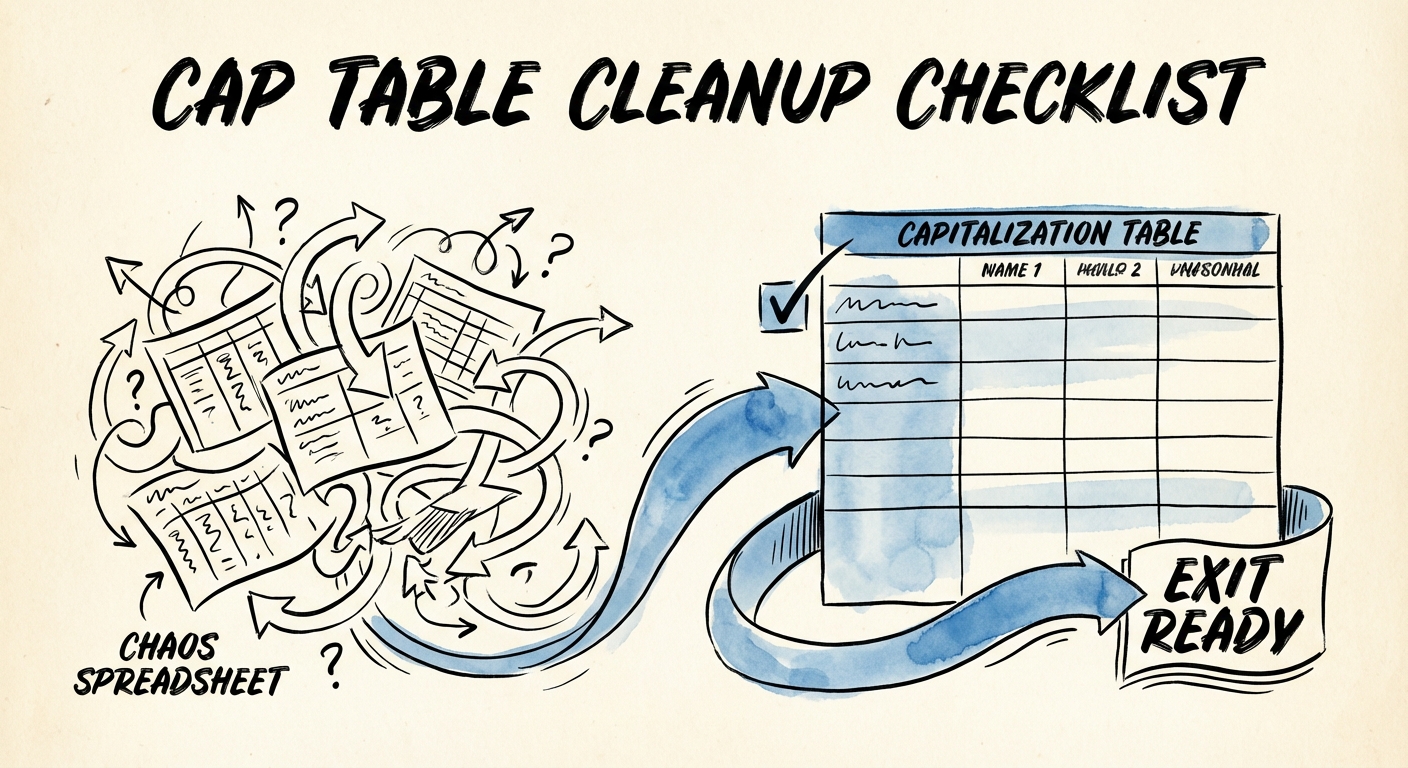
BRIEF · EXIT READINESS
The Cap Table Cleanup Checklist: Preventing the 'Silent Deal Killer' in 2026
Messy cap tables kill deals. This diagnostic checklist covers dead equity, missing warrants, and 409A gaps that delay M&A exits by 35%.
35% Increase in Diligence Duration
BRIEF · EXIT READINESS
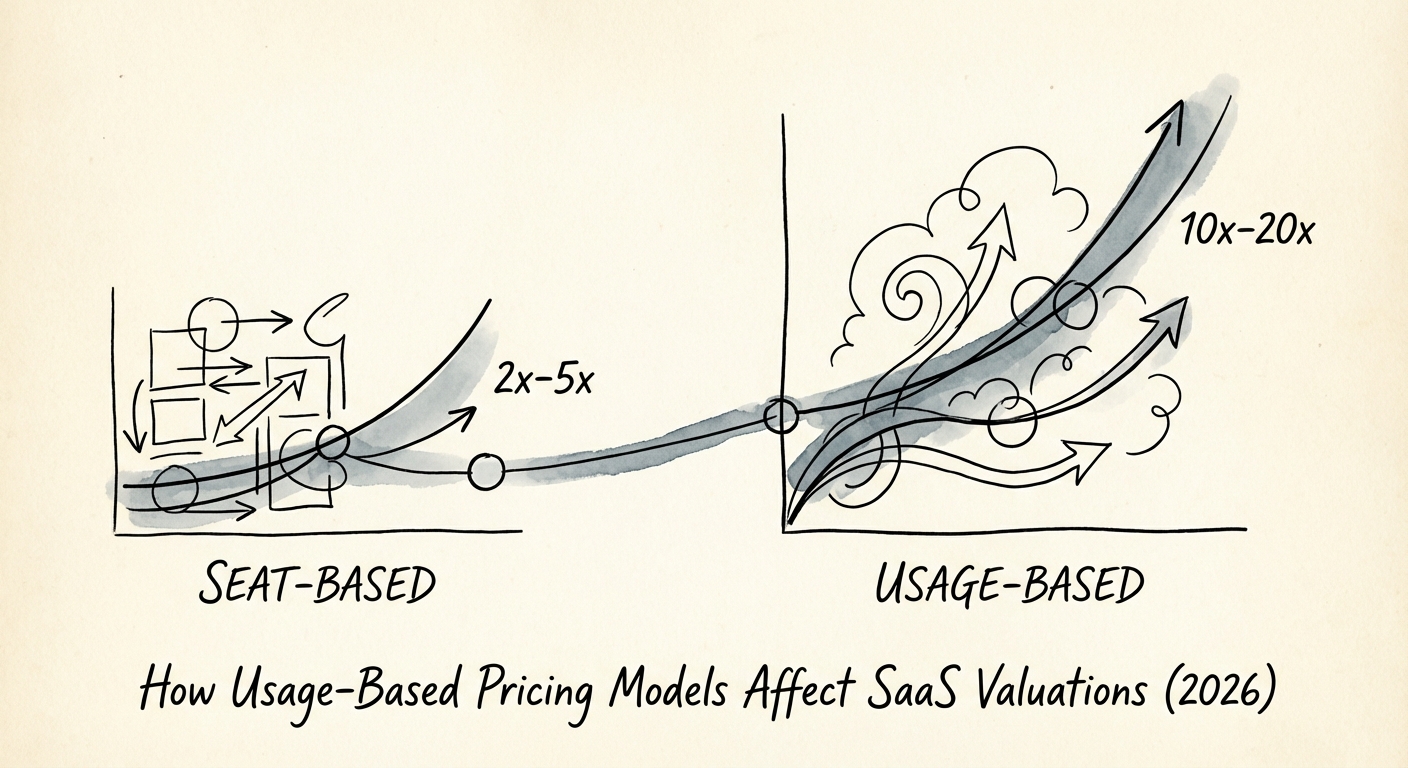
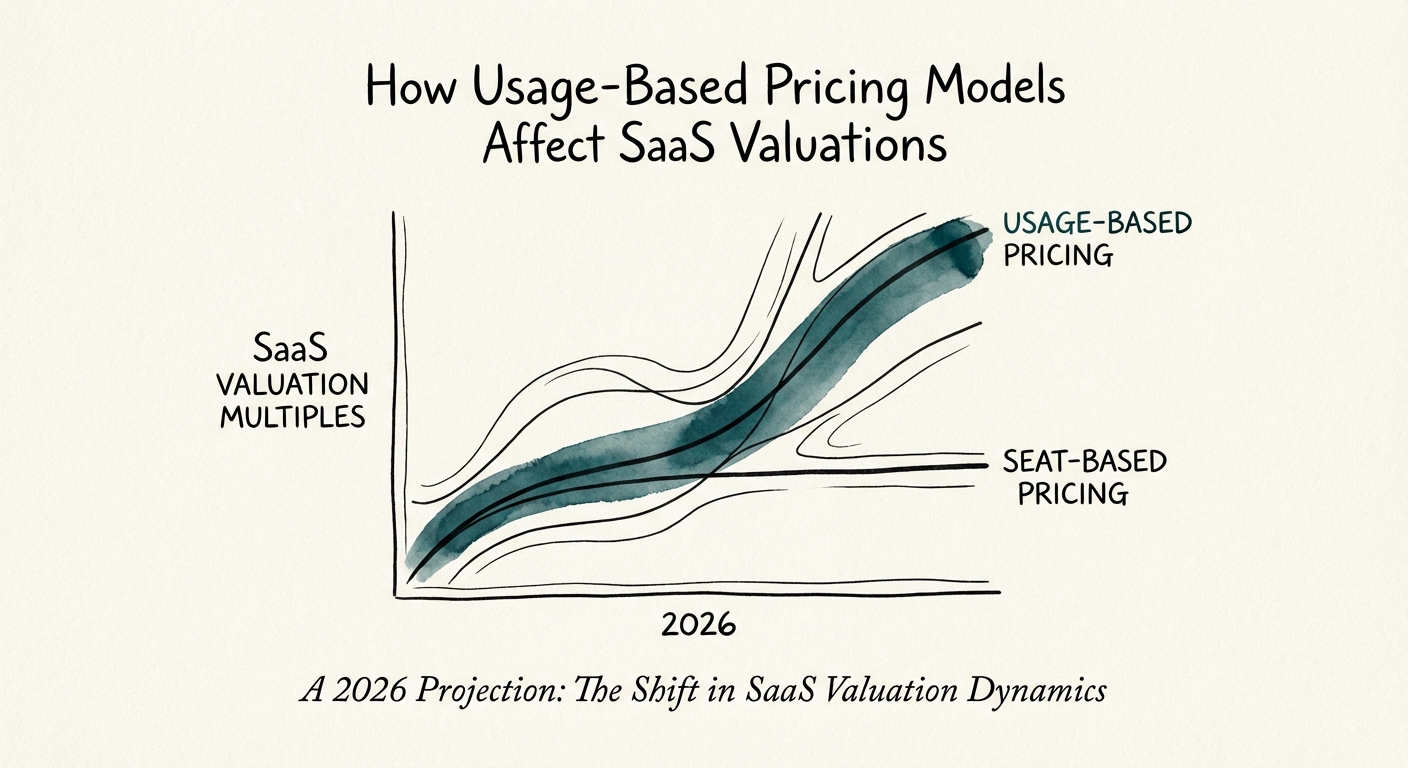
The Consumption Premium: Why Usage-Based Models Command 8x Multiples (And How to Fix the Volatility Discount)
Usage-based pricing models are trading at a 50% premium over seat-based SaaS. Here is the diagnostic guide to consumption pricing, NRR, and valuation multiples for 2026 exits.
50% Valuation Premium for Consumption Revenue
BRIEF · EXIT READINESS
The Consumption Premium: Why Usage-Based SaaS Trades at Higher Multiples (If You Survive the Volatility)
New 2026 data shows usage-based SaaS companies trade at 24x revenue vs 19x for seat-based peers—but only if they solve the volatility problem. Here is the diagnostic.
38% Faster Growth for Usage-Based vs. Seat-Based Models
BRIEF · GTM EXECUTION
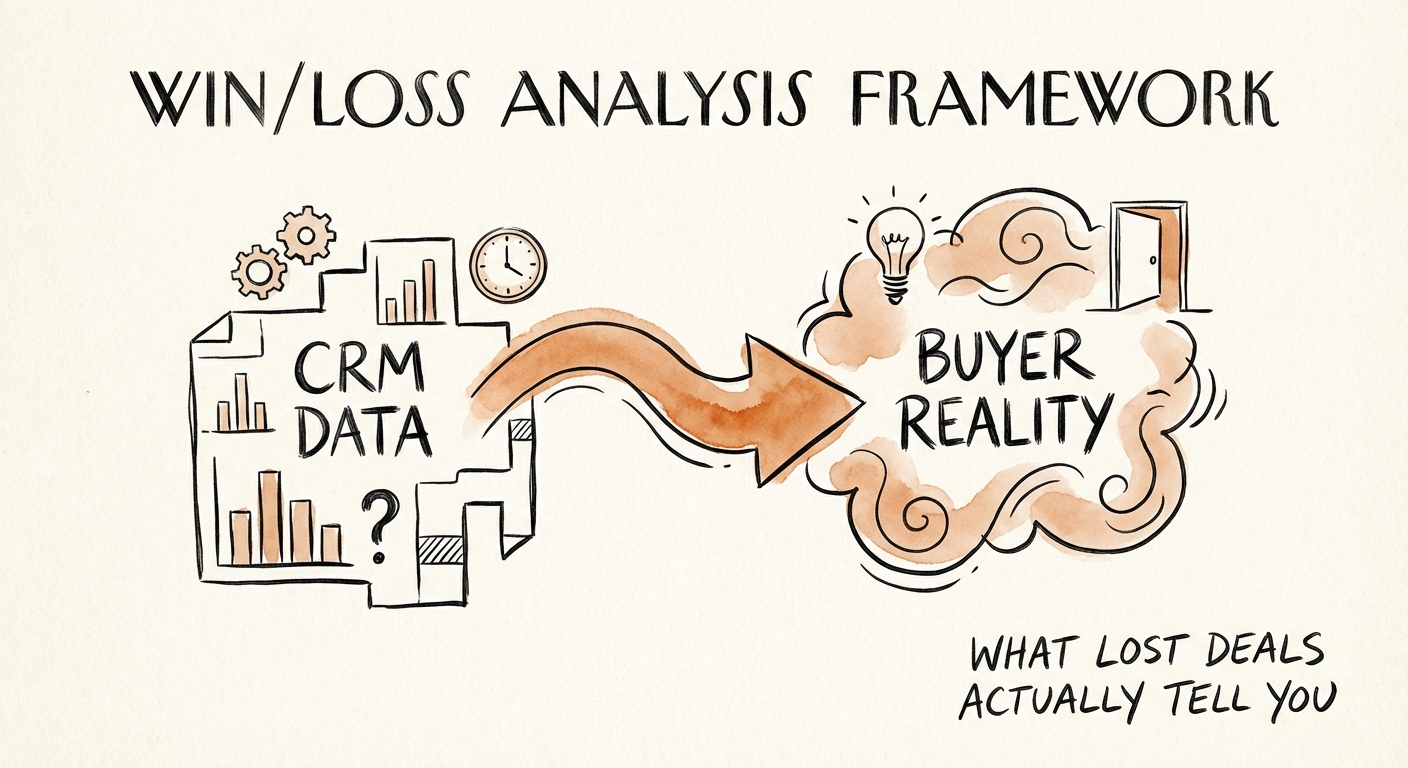
Win/Loss Analysis Framework: The "Price" Excuse vs. Reality
Stop relying on CRM checkboxes. A diagnostic framework for win/loss analysis that uncovers the 70% of deal insights your sales team is missing.
70% Discrepancy Between Rep-Reported and Buyer-Reported Loss Reasons
BRIEF · REVENUE ARCHITECTURE
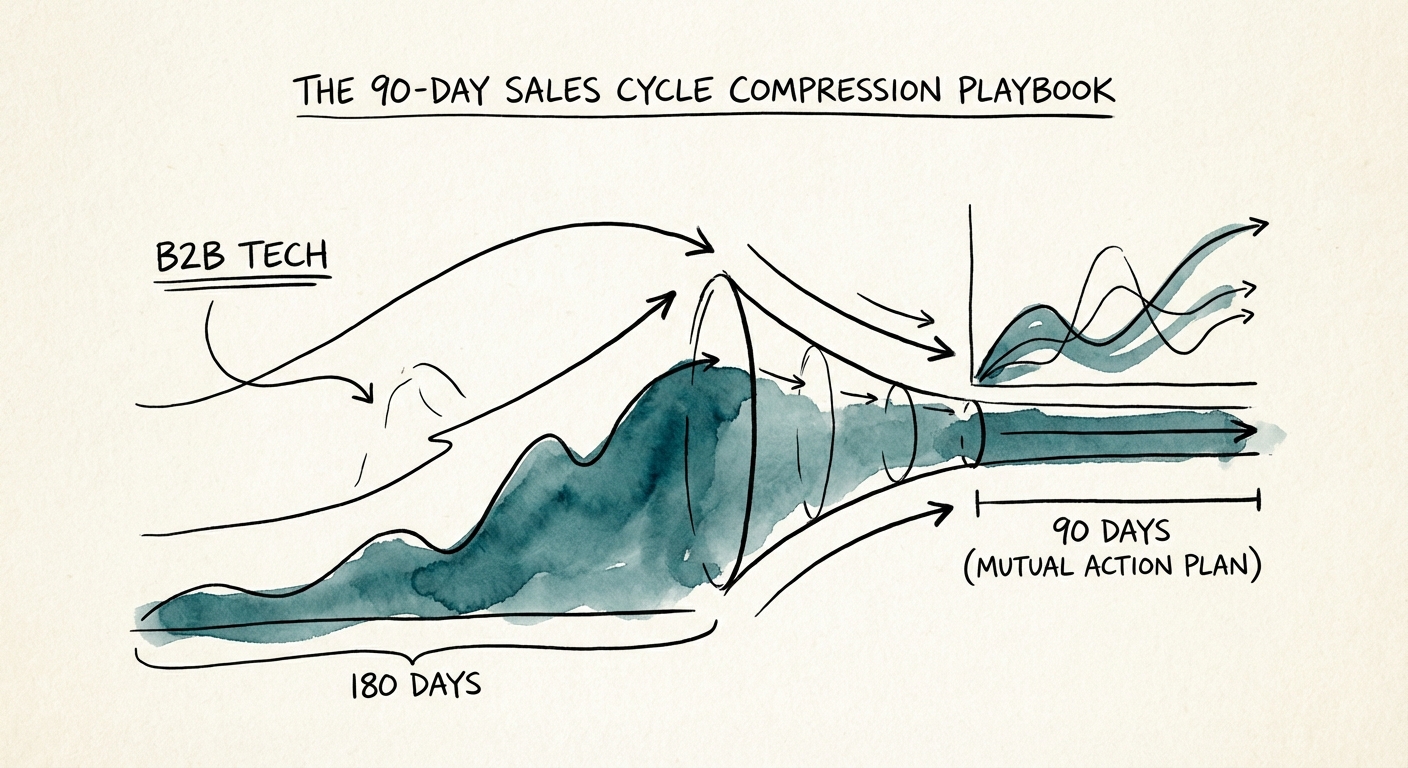
The 90-Day Sales Cycle Compression Playbook for B2B Tech
Stop the 6-month slip. This diagnostic reveals why 61% of deals stall in indecision and provides a 90-day compression playbook for VPs of Sales.
180 Days Average Enterprise Sales Cycle (2025)
BRIEF · EXIT READINESS
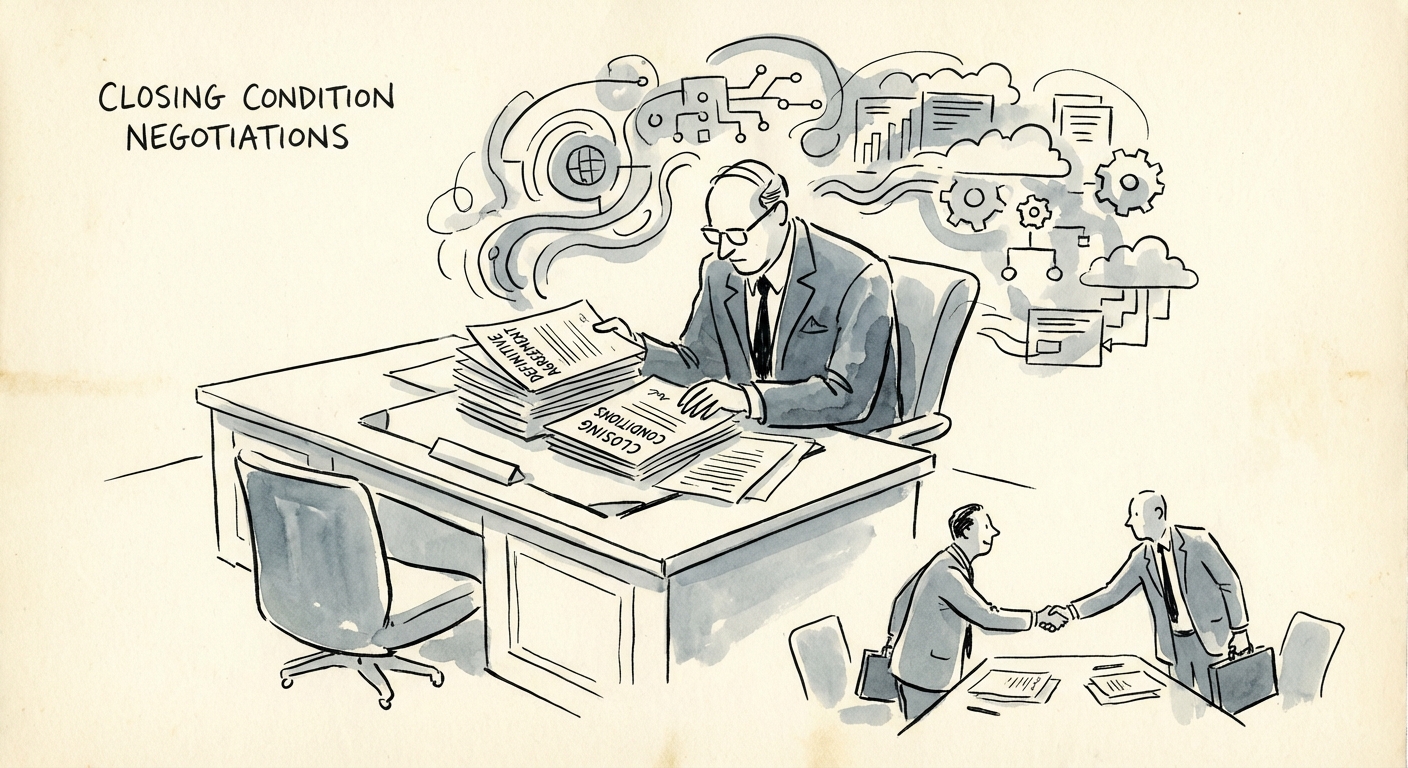
The Closing Trap: Why 'Standard' Conditions Are Weaponized in 2026 Tech M&A
The gap between signing and closing is where deal value can move. Learn how to negotiate tech-specific closing conditions, MAE clauses, and bring-down certificates to protect your exit.
50% Higher Earnout Risk in LMM Deals
BRIEF · EXIT READINESS
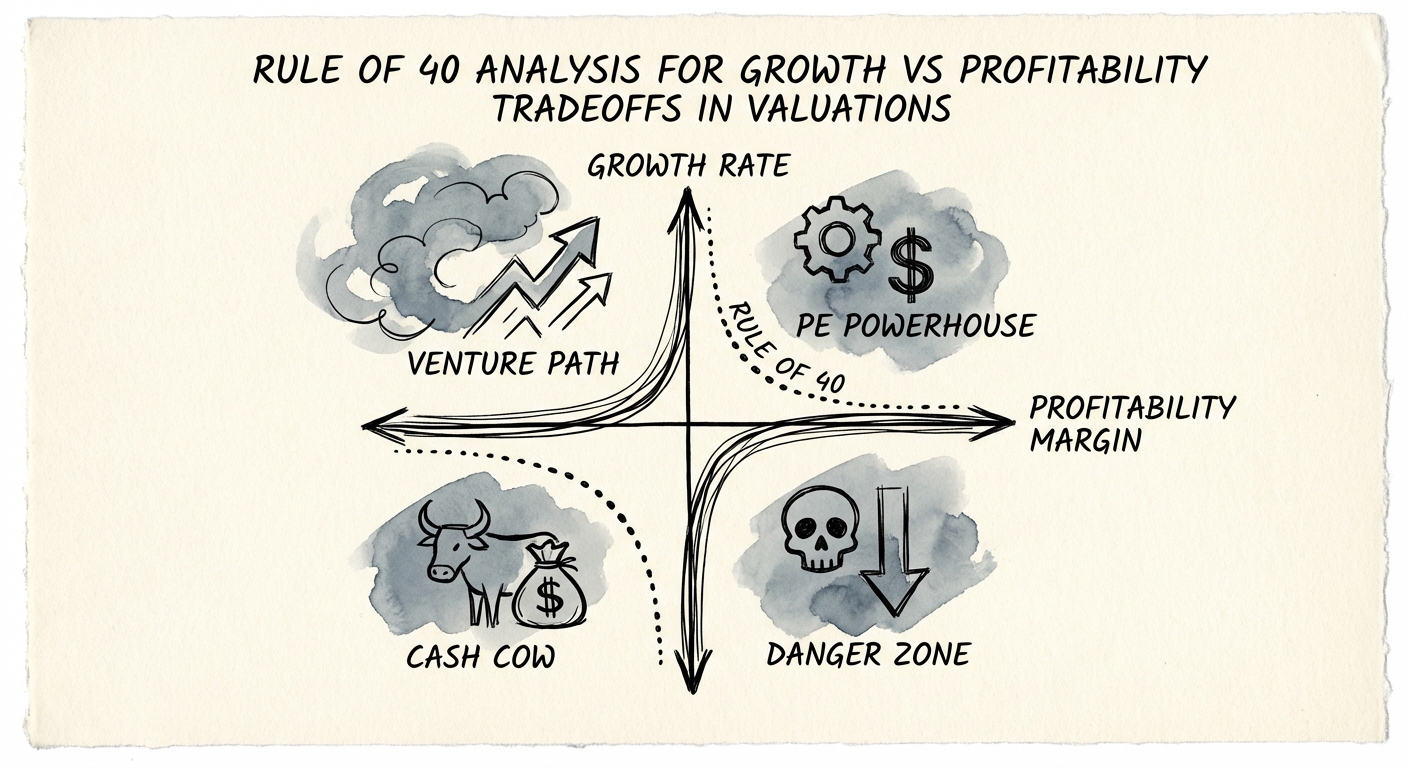
The Weighted Rule of 40: Why PE Buyers Discount 'Growth at All Costs' in 2026
In 2026, the Rule of 40 determines exit multiples. Learn why PE firms value 'Balanced 40' companies at a 121% premium over 'Growth at All Costs' peers.
121% Valuation Premium for Rule of 40 Beaters
BRIEF · EXIT READINESS
The Management Carve-Out: How to Get Paid When the Preference Stack Eats Your Exit
How to structure management carve-out plans when liquidation preferences eat your exit. Benchmarks for pool size, allocation, and vesting terms in 2026 tech M&A.
10-15% Typical Carve-Out Pool (% of Deal Value)
BRIEF · MIGRATION & INTEGRATION
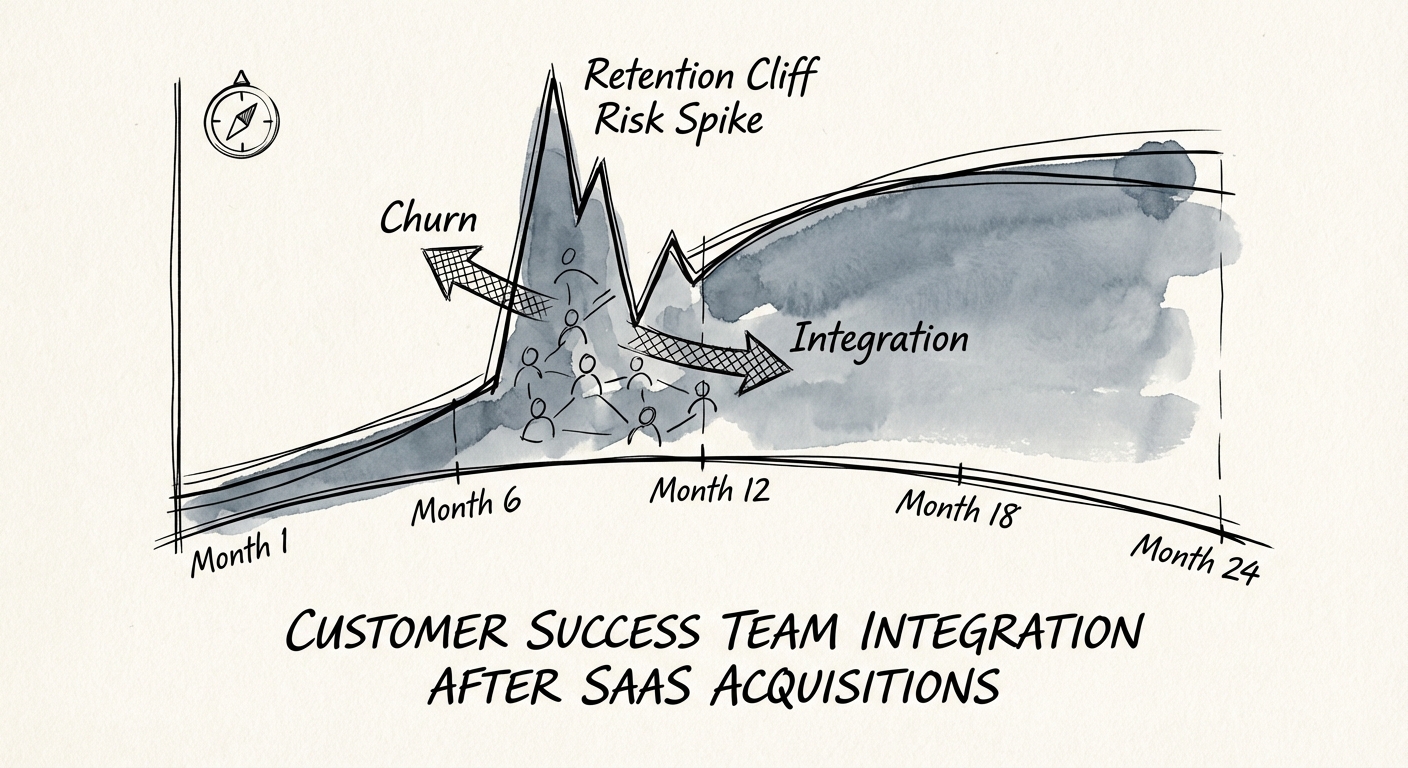
The 'Retention Cliff': A Diagnostic for Integrating Customer Success Teams After Acquisition
Why customer churn risk can rise after a SaaS acquisition, and how to spot the 'Retention Cliff' before it destroys your exit multiple.
3x Higher Churn Risk Post-M&A
BRIEF · EXIT READINESS
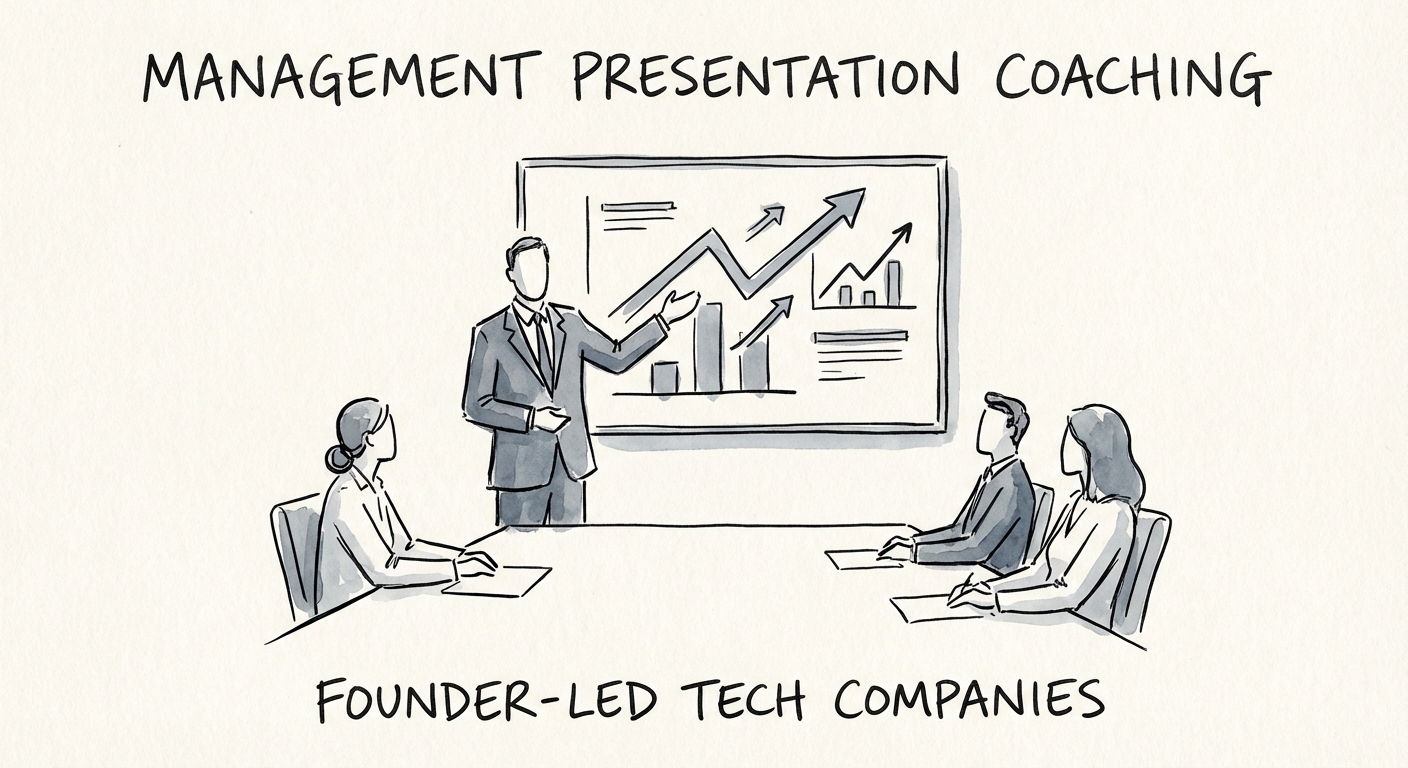
The Management Presentation Paradox: Why 'Perfect' Decks Kill Deals (And How to Fix It)
Why 30% of deals stall at the Management Presentation stage. A diagnostic guide for founder-led tech companies to bridge the 'Conviction Gap' and secure premium PE exits.
30% Deal Conviction Gap
BRIEF · TECHNICAL DEBT
What a PE Buyer's Code Scanner Finds in Week Two — and How to Get There First
A PE buyer runs Black Duck on your repo during exclusivity. The findings cut your price. Here's the 6-month plan to fix what re-trades a deal — and document the rest.
15-30% Potential Valuation Haircut from Findings
BRIEF · EXIT READINESS
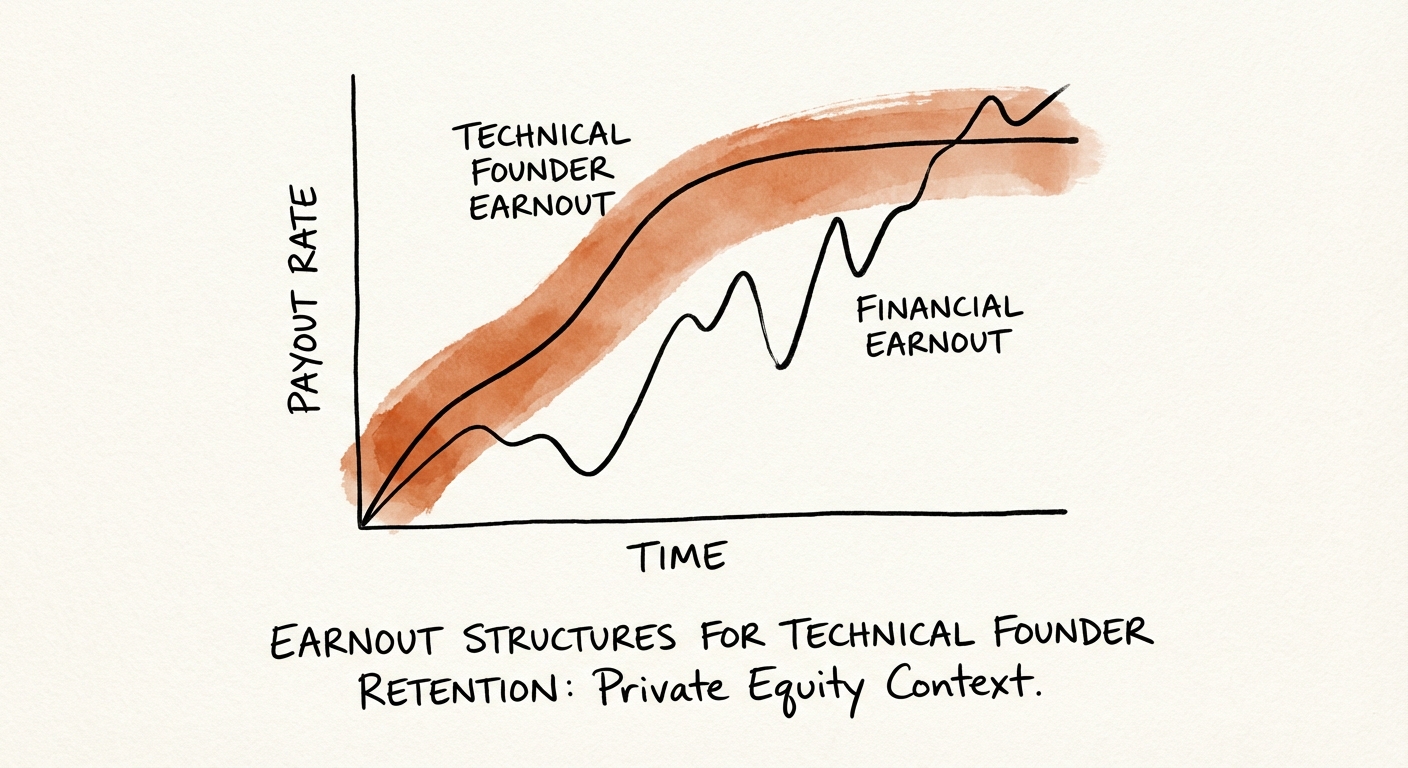
The 'retention packages' Fallacy: Why Financial Earnouts Fail Technical Founders (And What Works Instead)
Why 79% of earnout value evaporates for technical founders. A guide to structuring retention packages based on product milestones, not EBITDA.
$0.21 Avg. Payout per $1 of Earnout
BRIEF · MIGRATION & INTEGRATION
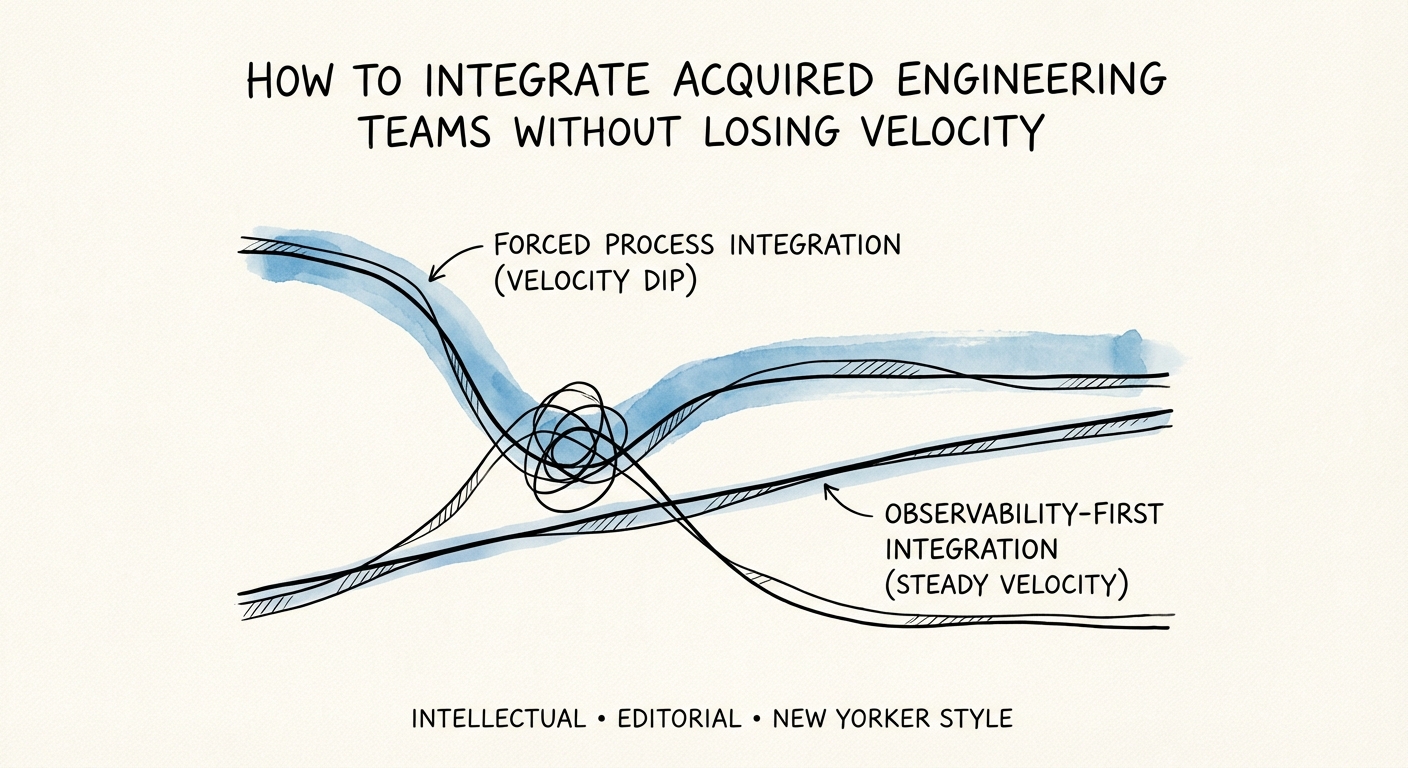
The 'Velocity Tax': Why Acquired Engineering Teams Stall for 6 Months (And How to Fix It)
Acquired engineering teams often face a 47% attrition rate in Year 1. Learn the 'Observability First' integration strategy that protects velocity and retains top talent.
47% Year 1 Engineer Attrition Rate Post-M&A
BRIEF · GTM EXECUTION
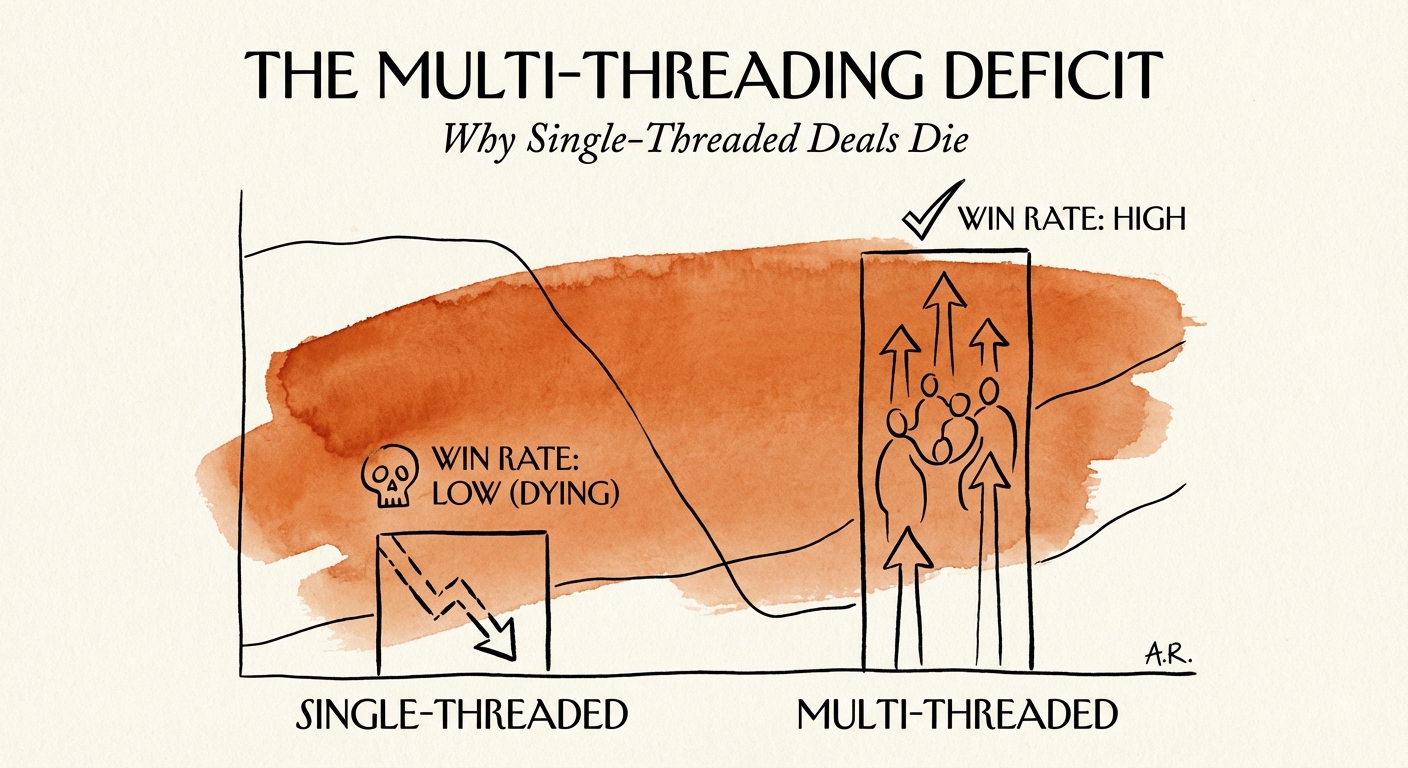
The Single-Threaded Deal: Why Your Best-Looking Pipeline Is Lying to You
A deal with one champion isn't a commit, it's a coin flip. Why 78% of reps are single-threaded, what it does to your forecast, and the grid that fixes it.
37% Higher Win Rate
BRIEF · EXIT READINESS
The LOI Decoder: Why "Standard" Terms Cost Founders 15% of Deal Value
Diagnostic guide for analyzing PE term sheets. Benchmarks for indemnity caps (10% vs 1%), exclusivity periods (75 days), and working capital pegs.
15% Deal Value At Risk
BRIEF · EXIT READINESS
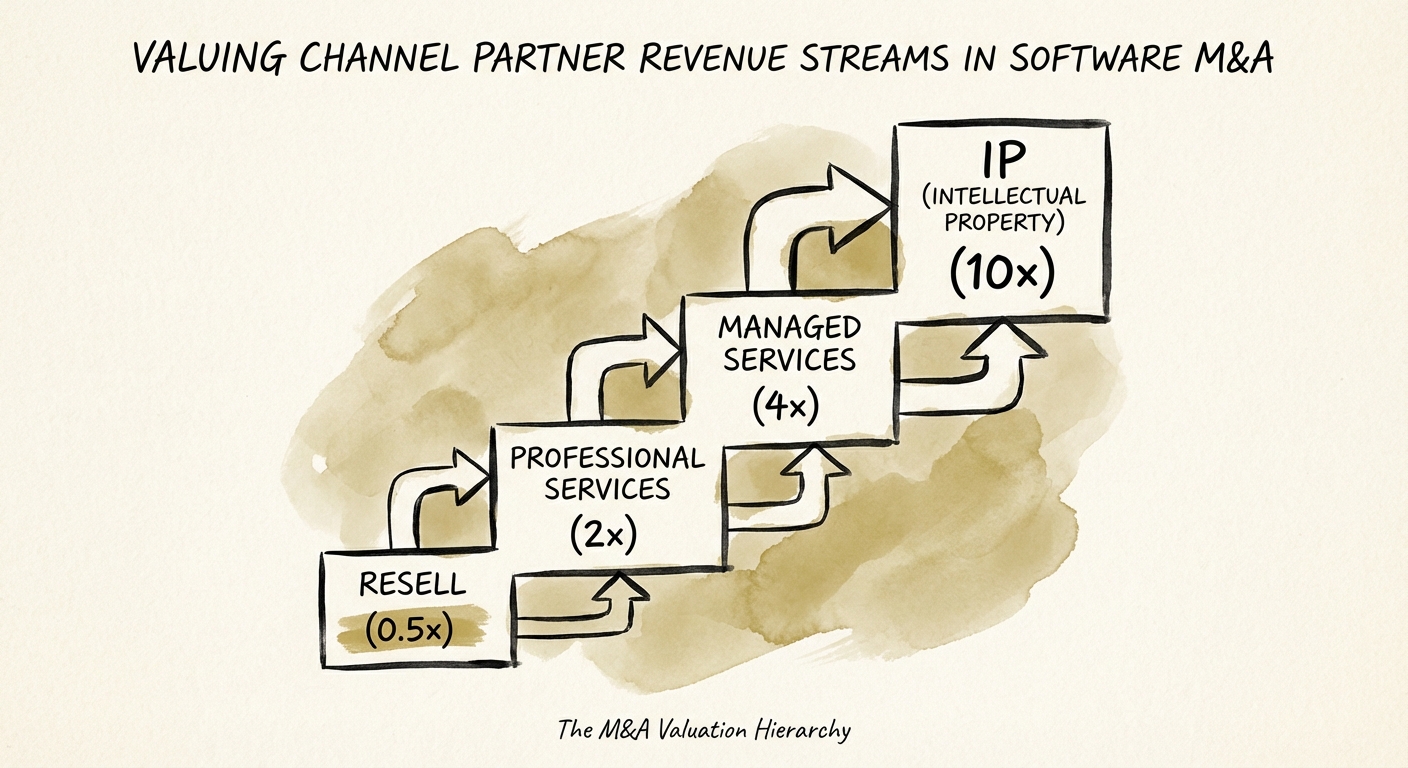
Why a Buyer Will Pay More for Your $10M ISV Than Your $50M Microsoft Reseller
A buyer's diligence team will tear your channel P&L into four revenue streams and price each one separately. Here's how to see your reseller business the way they will.
12x vs. 0.8x Valuation Gap (IP vs. Resell)
BRIEF · TECHNICAL DEBT
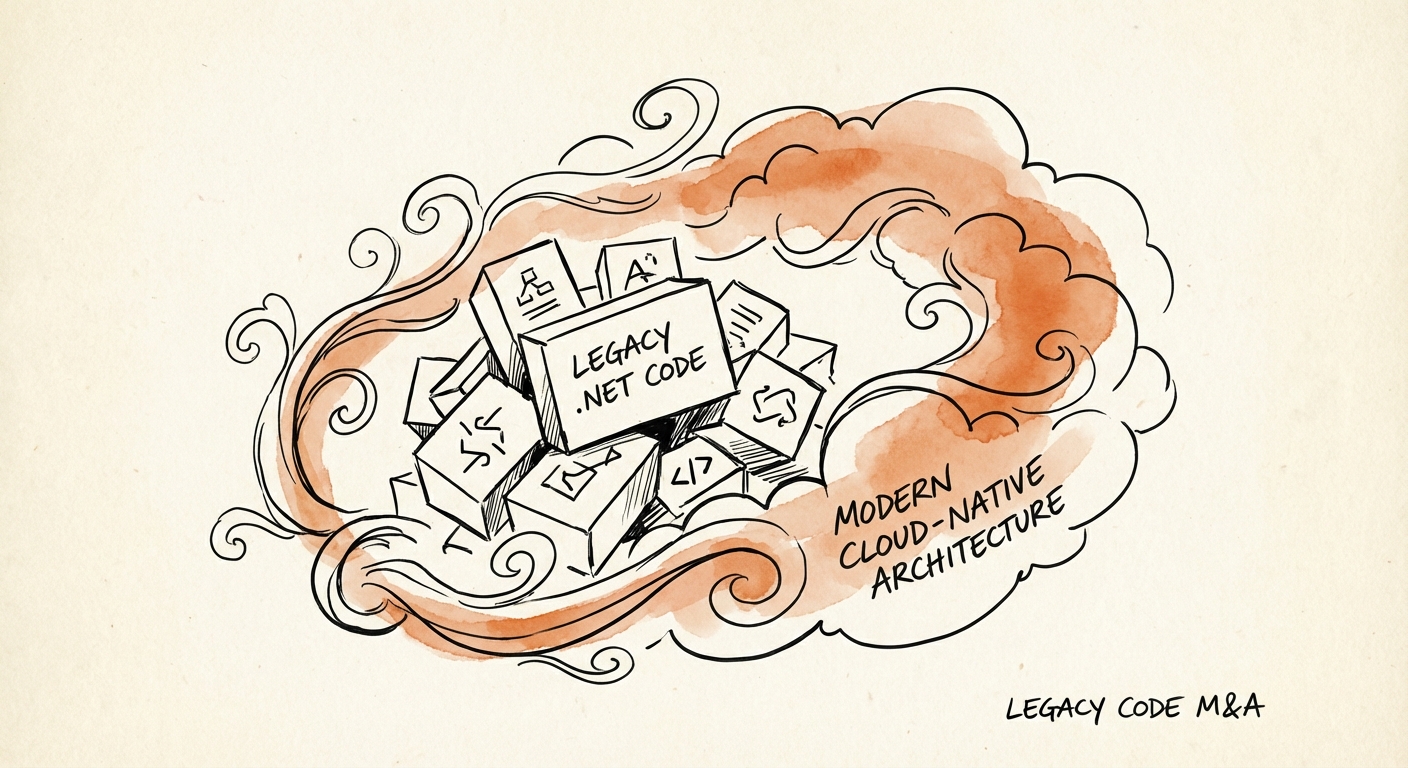
The .NET Trap: How Legacy Codebases Conceal a 30% Valuation Haircut
A guide for PE sponsors and CTOs on assessing legacy .NET codebases during due diligence. Benchmarks for migration costs, salary premiums, and valuation impacts.
40% Salary Premium for Legacy Talent