BRIEF · EXIT READINESS
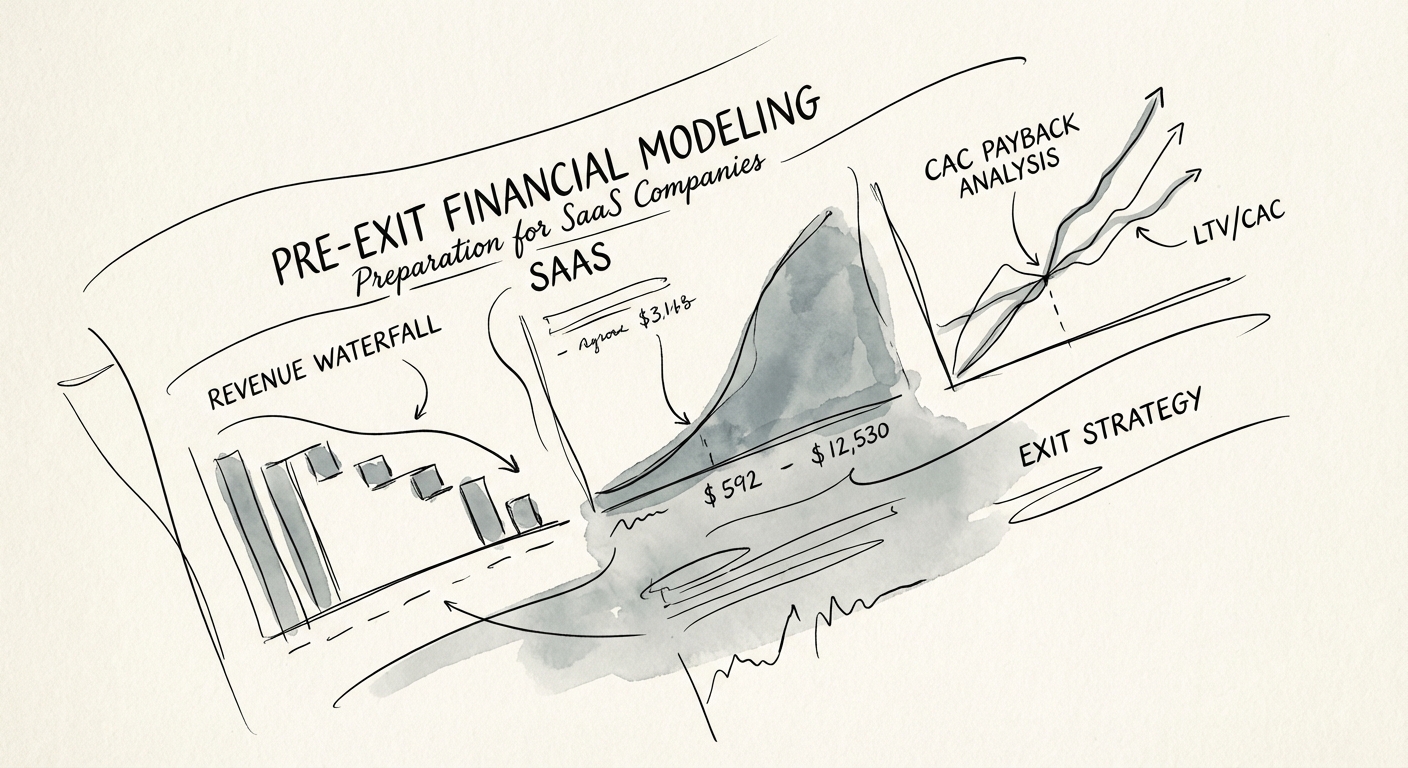
Pre-Exit Financial Model Preparation: Stress-Testing Your Forecast Before PE Due Diligence
Your financial model will determine if you exit at 10x or get re-traded at 6x. Learn how to stress-test your SaaS forecast for Private Equity due diligence.
12% Median Rule of 40 Score (Q1 2025)
BRIEF · EXIT READINESS
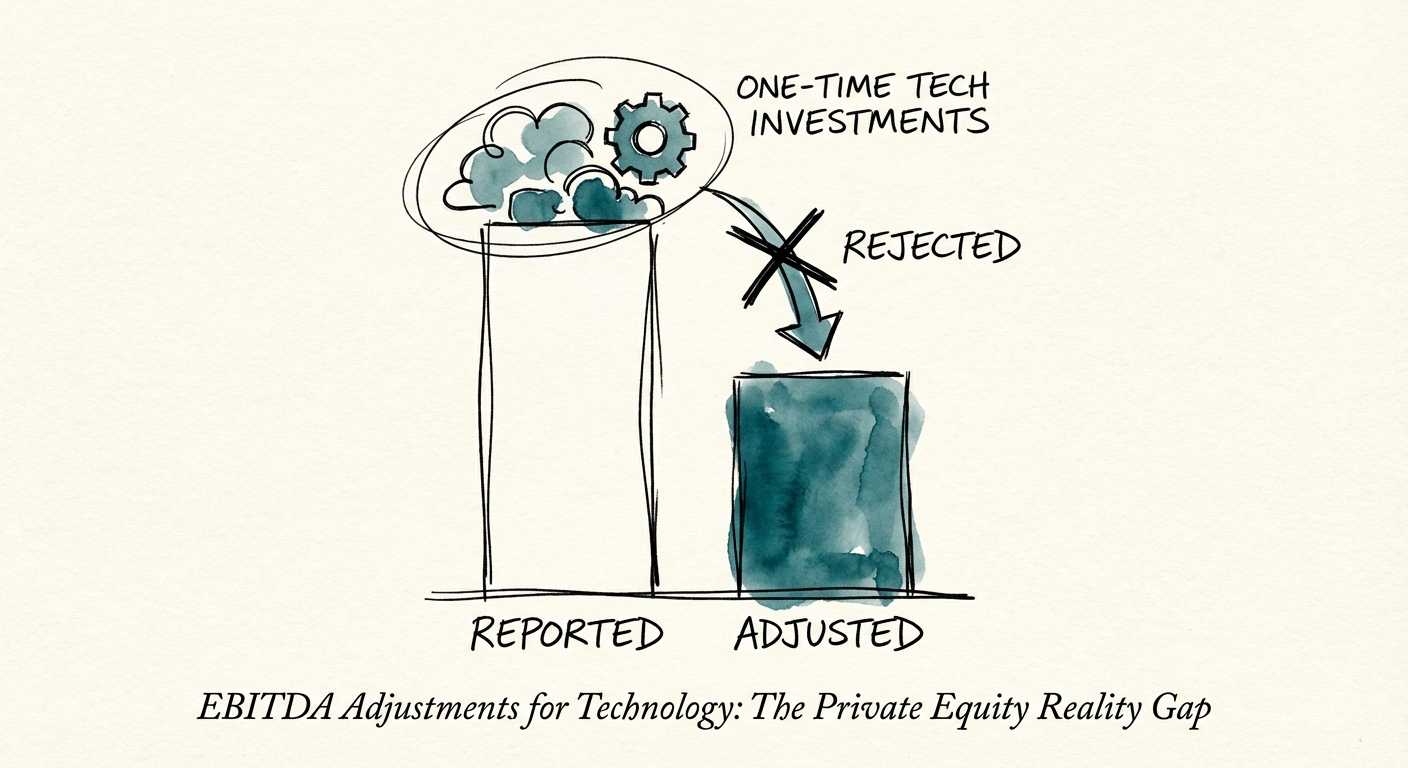
EBITDA Adjustments for One-Time Technology Investments: The 2026 Diagnostic
Learn which technology costs qualify as EBITDA add-backs in 2026. A diagnostic guide for founders and PE firms on defending 'one-time' tech investments in due diligence.
66.1% Avg. Add-Backs as % of LTM EBITDA in Tech Deals
BRIEF · PROCESS DOCUMENTATION
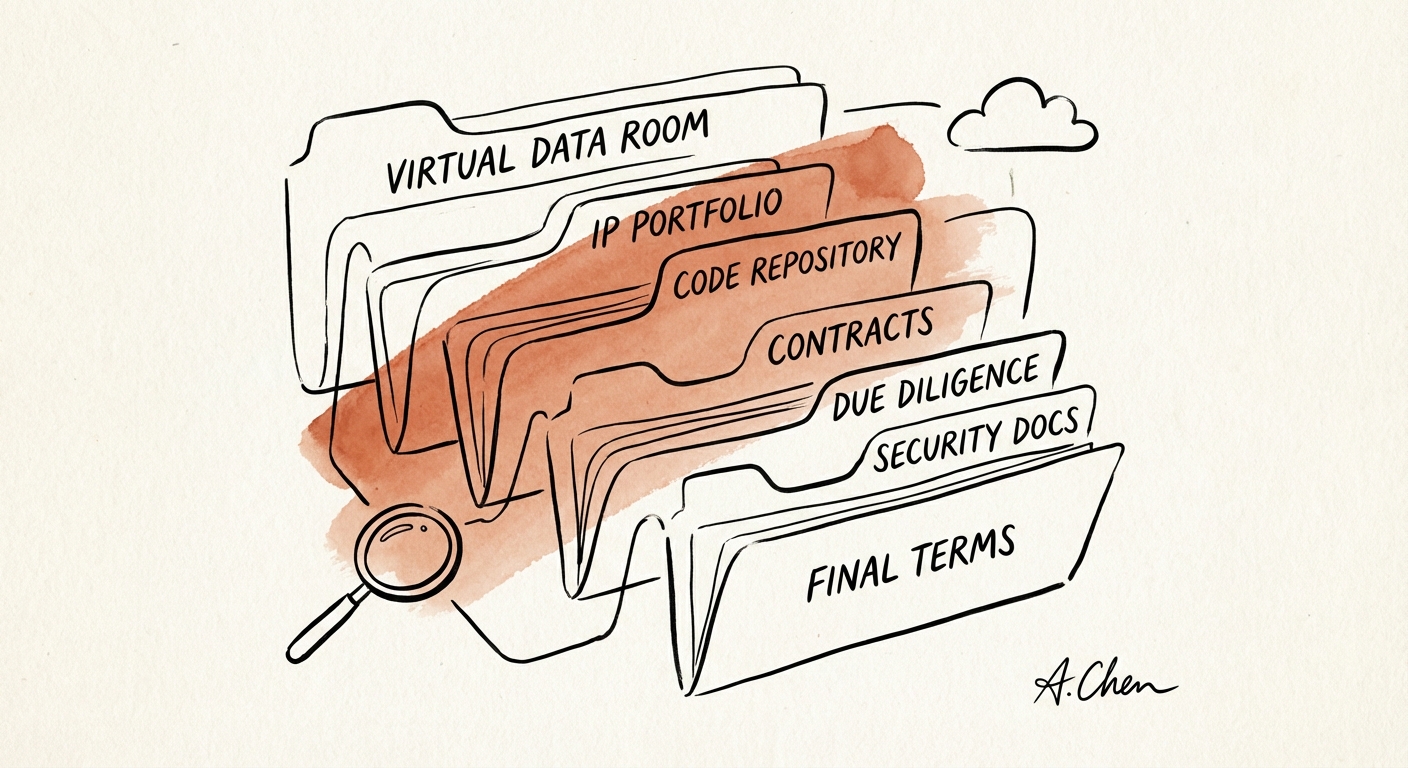
The VDR "Confidence Gap": Why Disorganized Data Rooms Cost 15% in Valuation
Disorganized data rooms extend due diligence by 30% and kill deal momentum. Here is the diagnostic framework for organizing a VDR that protects valuation.
247 Days Average Due Diligence Duration (Up from 189)
BRIEF · EXIT READINESS
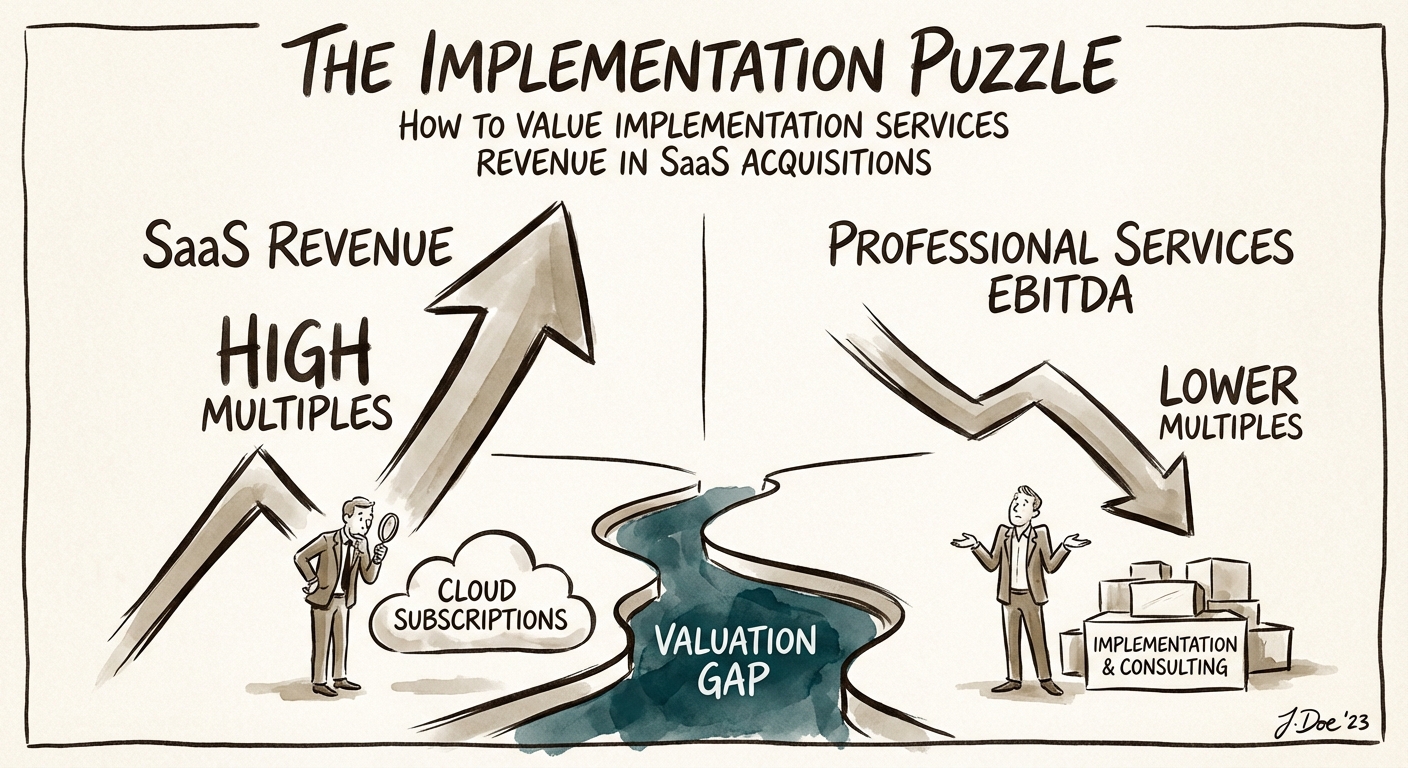
How to Value Implementation Services Revenue in SaaS Acquisitions
Stop applying your SaaS multiple to services revenue. Learn the 2026 Sum-of-the-Parts (SOTP) valuation framework to calculate the true value of your hybrid business.
30% Minimum Services Gross Margin
BRIEF · TECHNICAL DEBT
The AWS Native Due Diligence Checklist: How to Spot $5M in Hidden Technical Debt
A 50-point AWS technical due diligence checklist for private equity. Uncover hidden cloud costs, security risks, and technical debt before signing the LOI.
32% of cloud spend is wasted annually (Flexera 2025)
BRIEF · EXIT READINESS
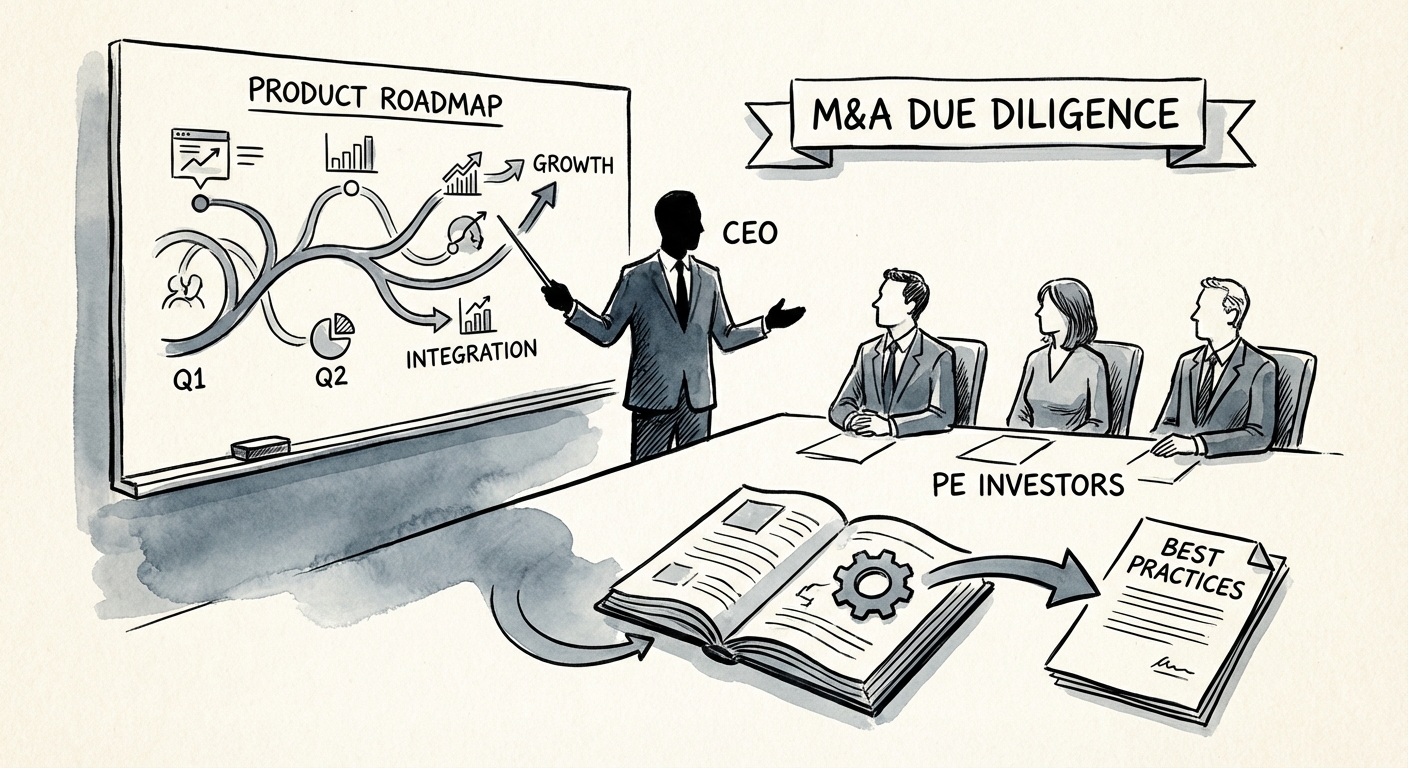
The M&A Product Roadmap: Why 'Innovation' Changes Deals and 'Predictability' Drives 14x Exits
Learn why 'innovation theater' kills deal value and how to present a product roadmap that drives premium multiples. 2026 M&A benchmarks and 3-slide framework.
15-20% Avg. Valuation Re-Trade Due to Roadmap Risk
BRIEF · TECHNICAL DEBT
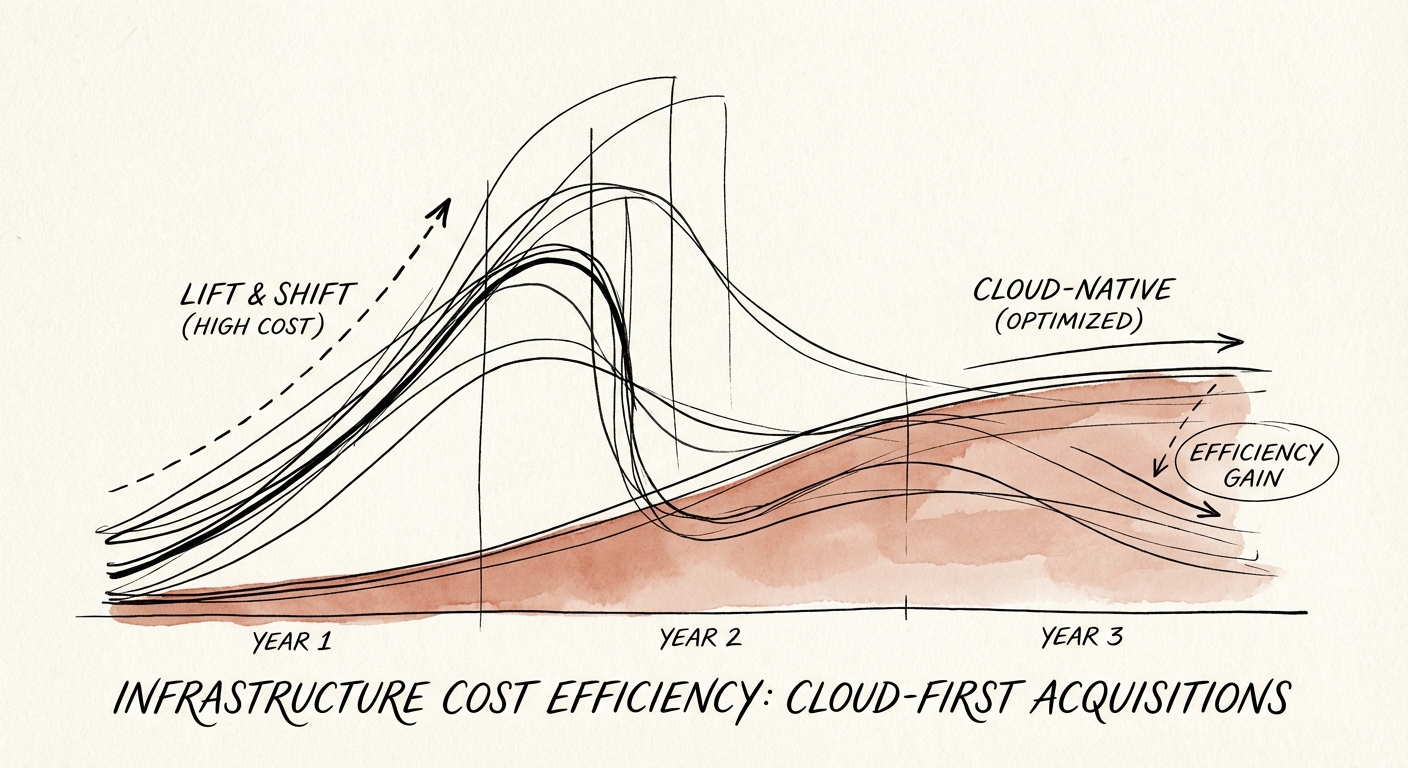
The 'Cloud-First' Trap: Why Your Target's AWS Bill Is Hiding $2M in EBITDA
Stop overpaying for 'Cloud-First' acquisitions. Learn how to audit AWS/Azure spend, identify 32% waste, and optimize cloud unit economics before you sign.
32% Average Cloud Budget Waste
BRIEF · EXIT READINESS
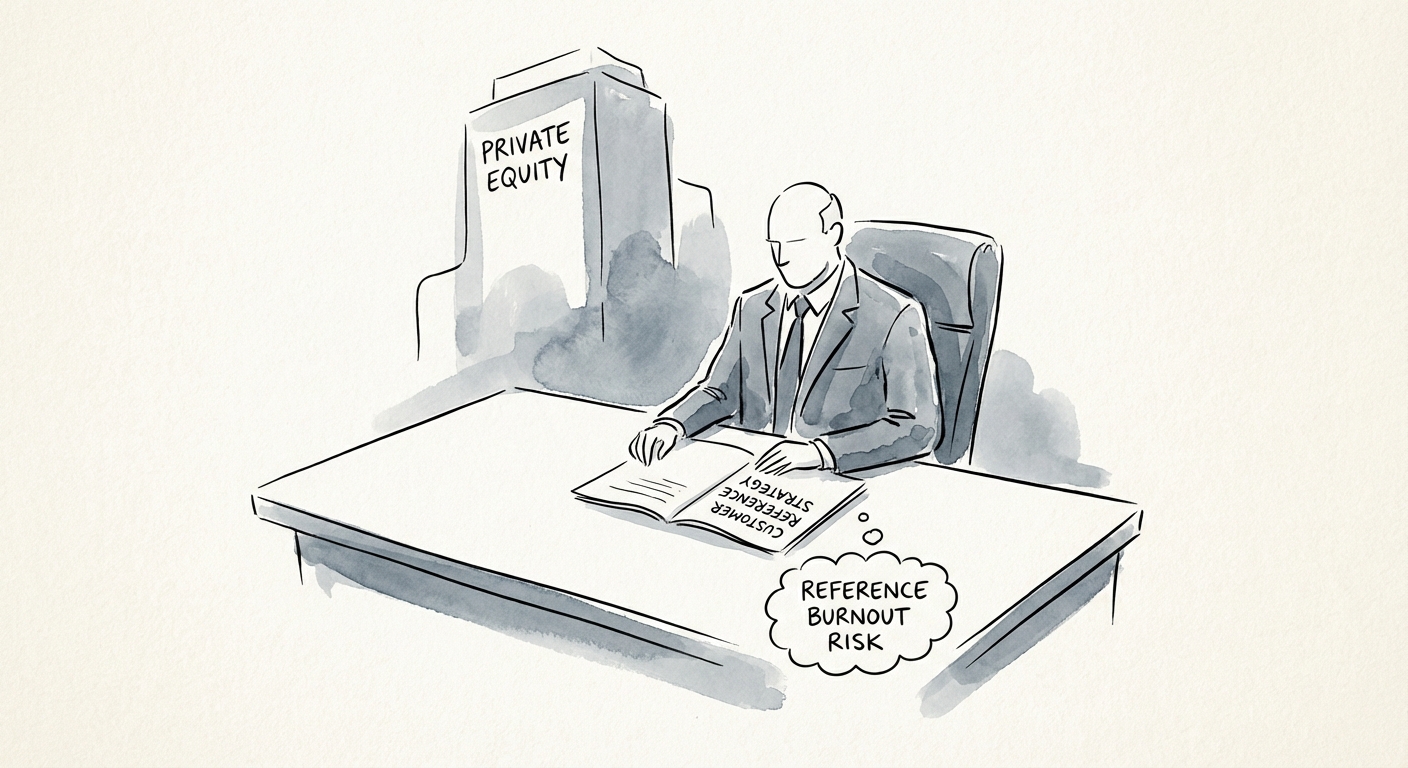
The Reference Roulette: Why Your Best Customers Can Kill Your Exit (And How to Stop Them)
Prevent reference burnout and protect your valuation. A diagnostic guide for Founders and CEOs on managing customer reference calls during private equity due diligence.
25% Potential Deal Value Holdback
BRIEF · EXIT READINESS
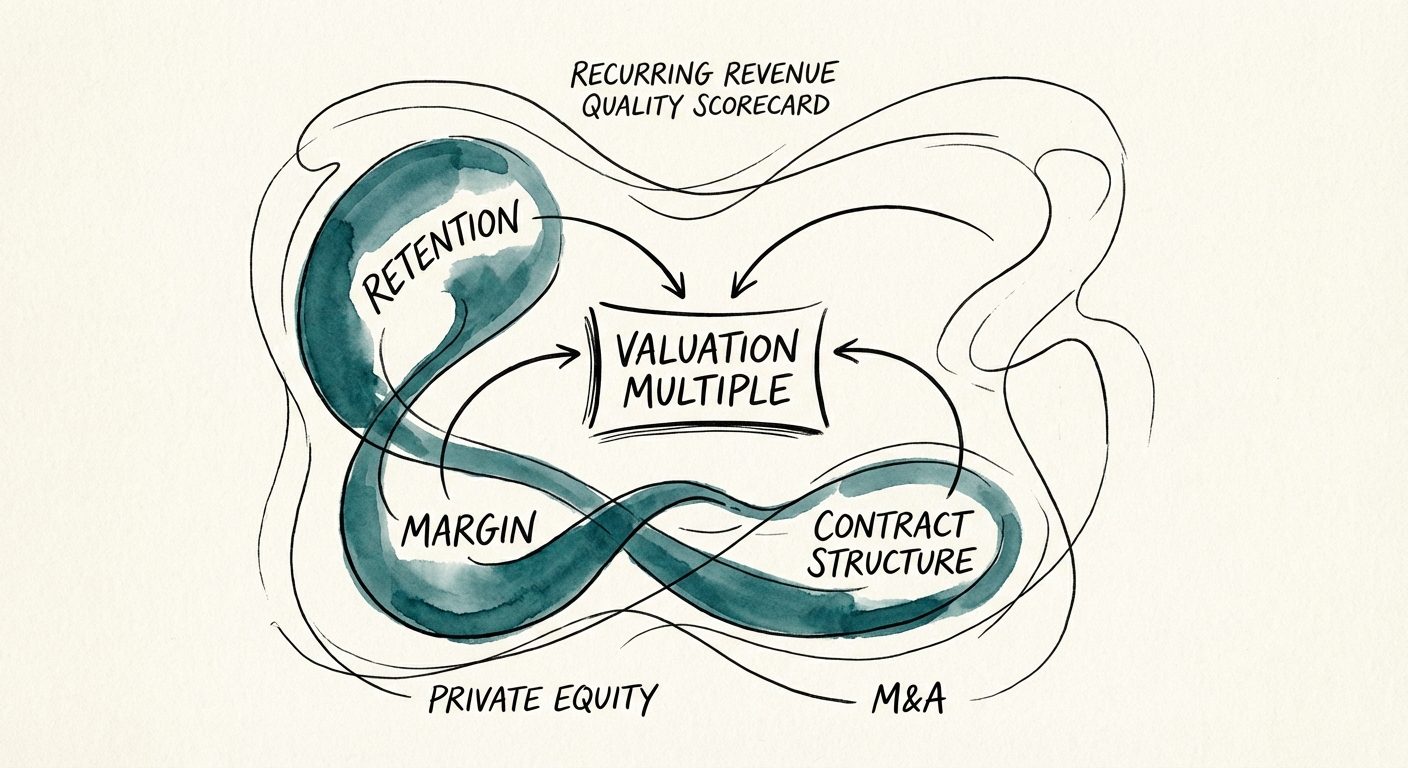
The Revenue Quality Scorecard: Why PE Firms Are Discounting Your ARR by 30%
Not all ARR is created equal. Learn how PE firms score revenue quality in 2026 and why low-quality revenue streams trigger 30% valuation discounts.
30% Valuation Discount for Low-Quality ARR
BRIEF · EXIT READINESS
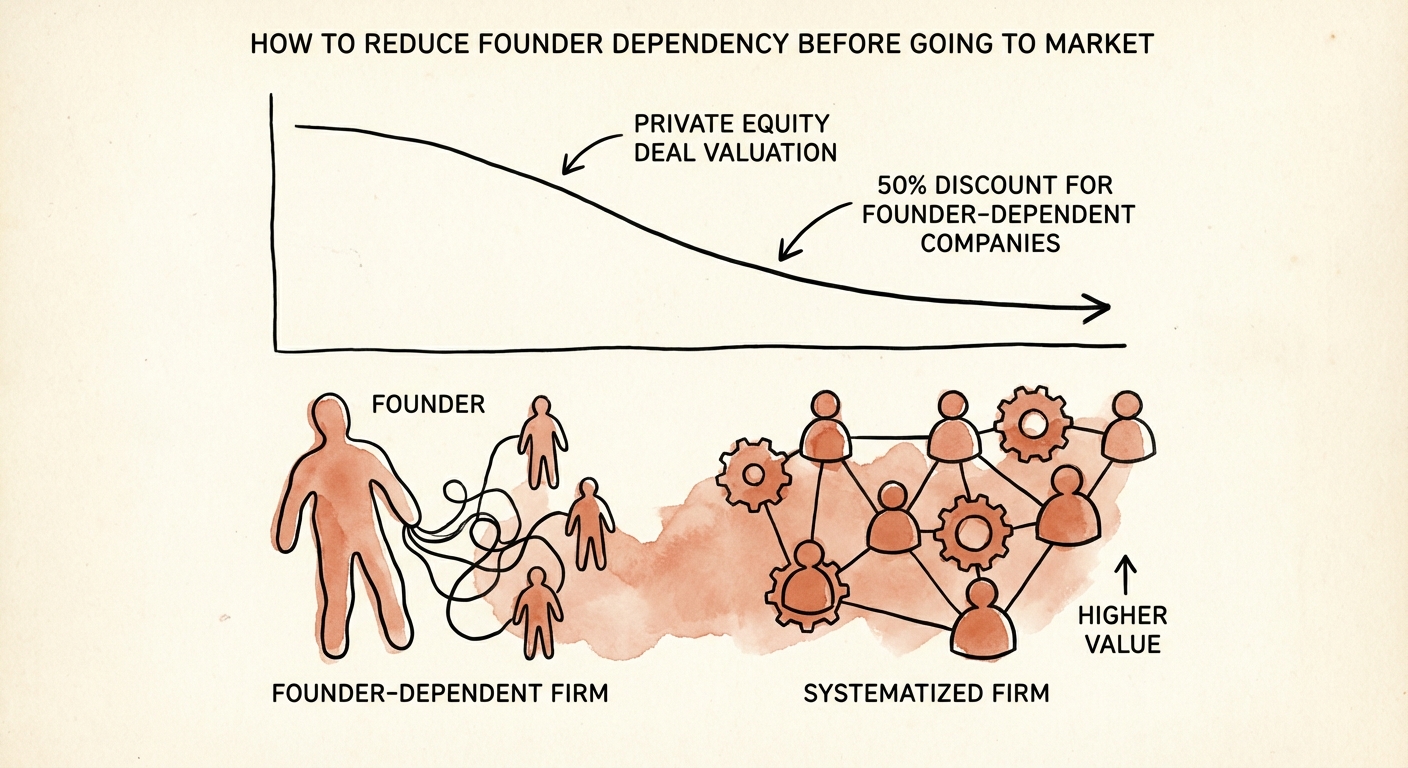
The Founder Discount: Why Being the Only One Who Understands Your Codebase Caps Your Exit at 3x
In a B2B tech exit, founder dependency cuts multiples roughly in half. A 3-test diagnostic and a 12-month extraction sprint to de-risk key person risk before LOI.
50% Valuation Discount
BRIEF · TECHNICAL DEBT
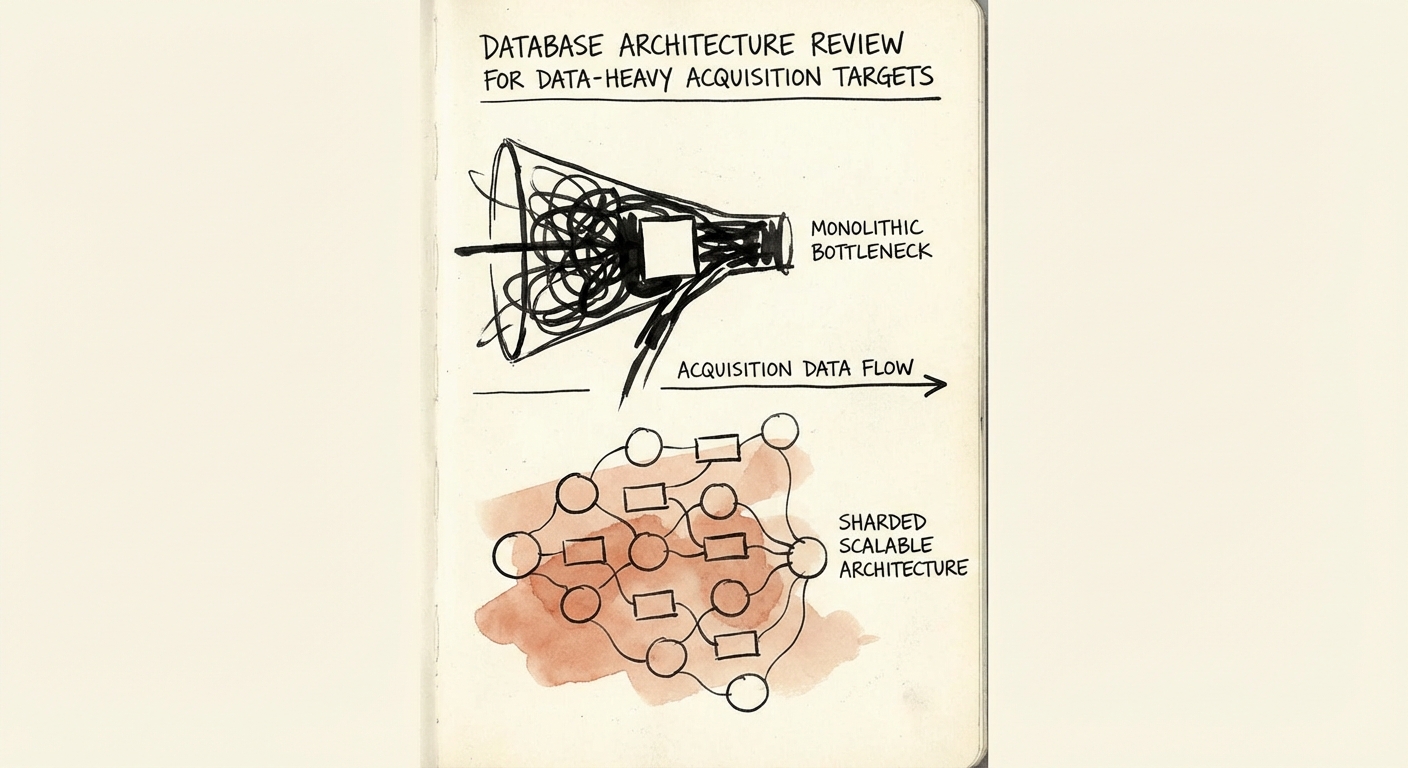
Database Architecture Due Diligence: The $2M Scalability Trap Hidden in Your Target's Schema
Why standard code audits miss critical database architecture risks. A due diligence guide for PE sponsors evaluating data-heavy targets.
83% Data migration failure rate
BRIEF · PROCESS DOCUMENTATION
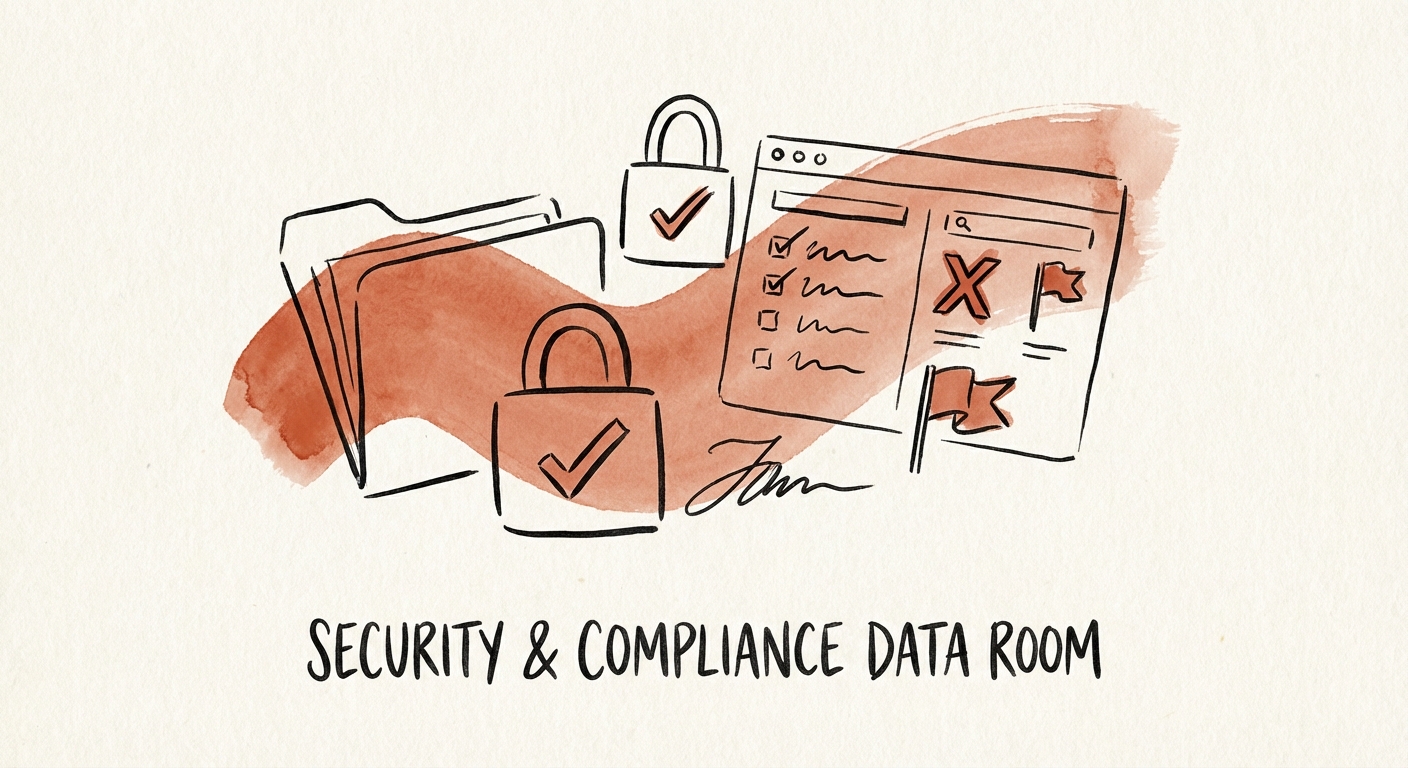
The $5M Slide: Why "Compliance Debt" Kills M&A Deals in 2026
Missing security documentation kills M&A deals. Learn the 2026 data room requirements for PE buyers, from SOC 2 reports to penetration test evidence.
97% Dealmakers citing cybersecurity as top diligence scrutiny
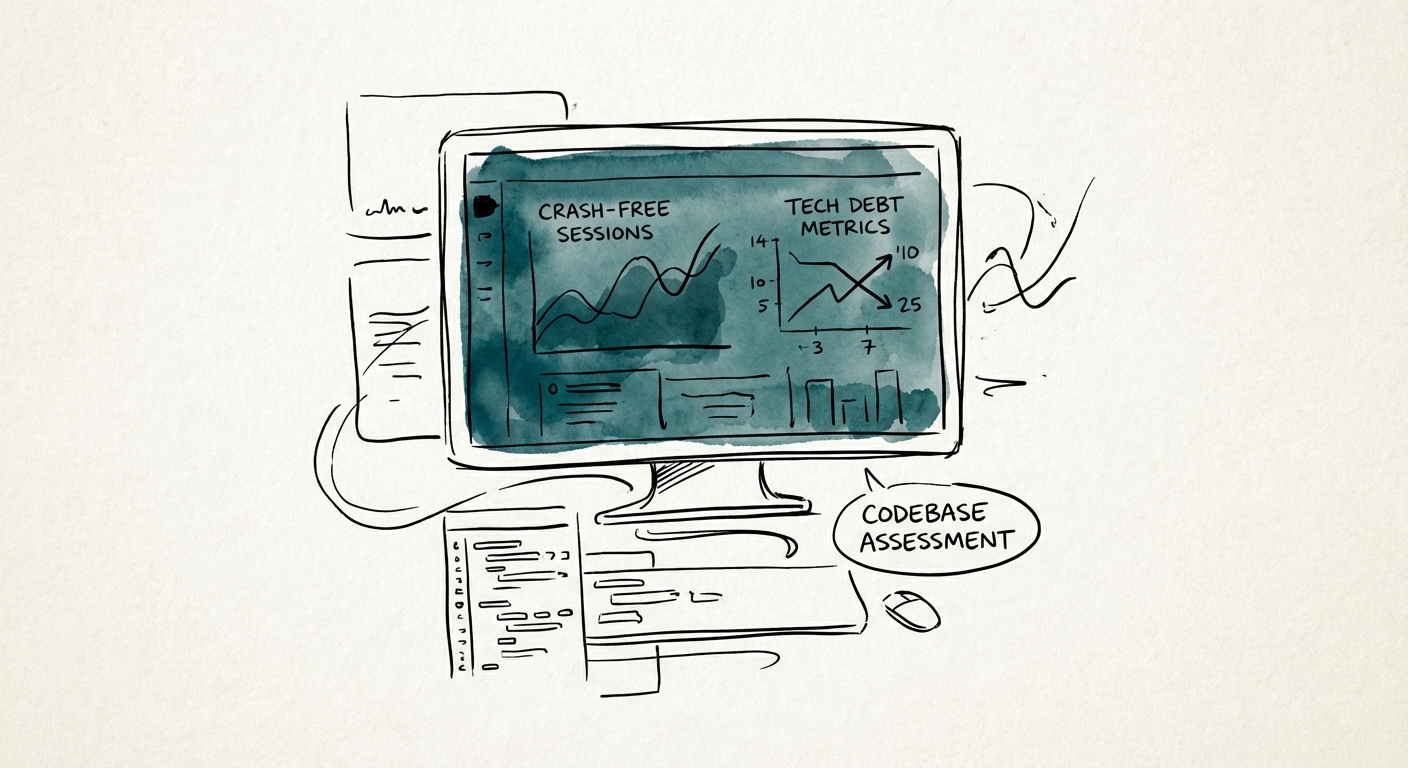
BRIEF · TECHNICAL DEBT
The $1.5M "Rewrite" Risk: Auditing Mobile App Codebases in Consumer Tech Deals
Consumer tech acquisitions often hide $1.5M in technical debt behind a glossy UI. Here is the 2026 mobile app due diligence checklist for private equity.
99.95% Target Crash-Free Session Rate
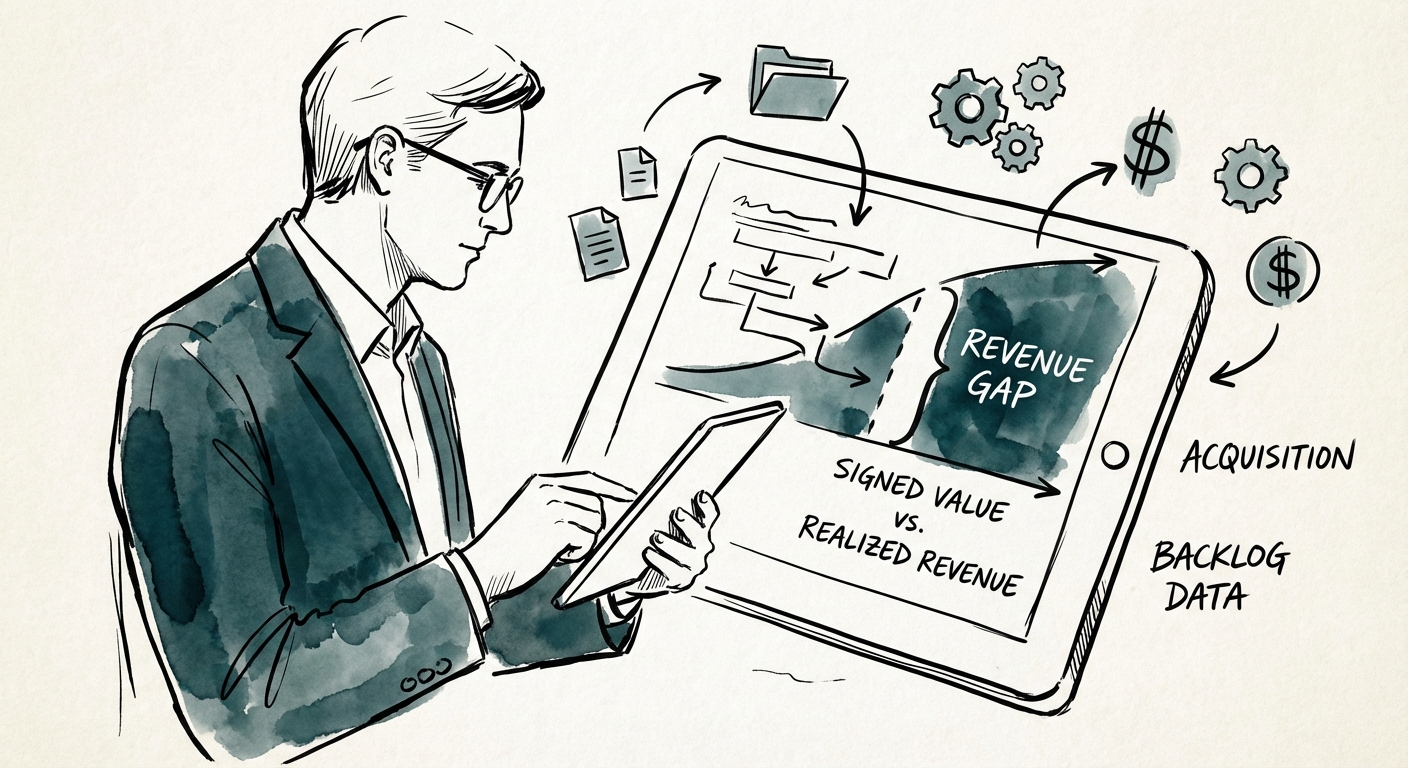
BRIEF · PROCESS DOCUMENTATION
Contract Revenue Analysis: Why 23.5% of Your Target's Backlog Is a Hallucination
Stop overpaying for 'ghost revenue.' This diagnostic framework helps PE investors stress-test IT consulting backlogs, calculate leakage rates, and adjust valuations before the deal closes.
23.5% Backlog Leakage Risk (Bottom Quartile)
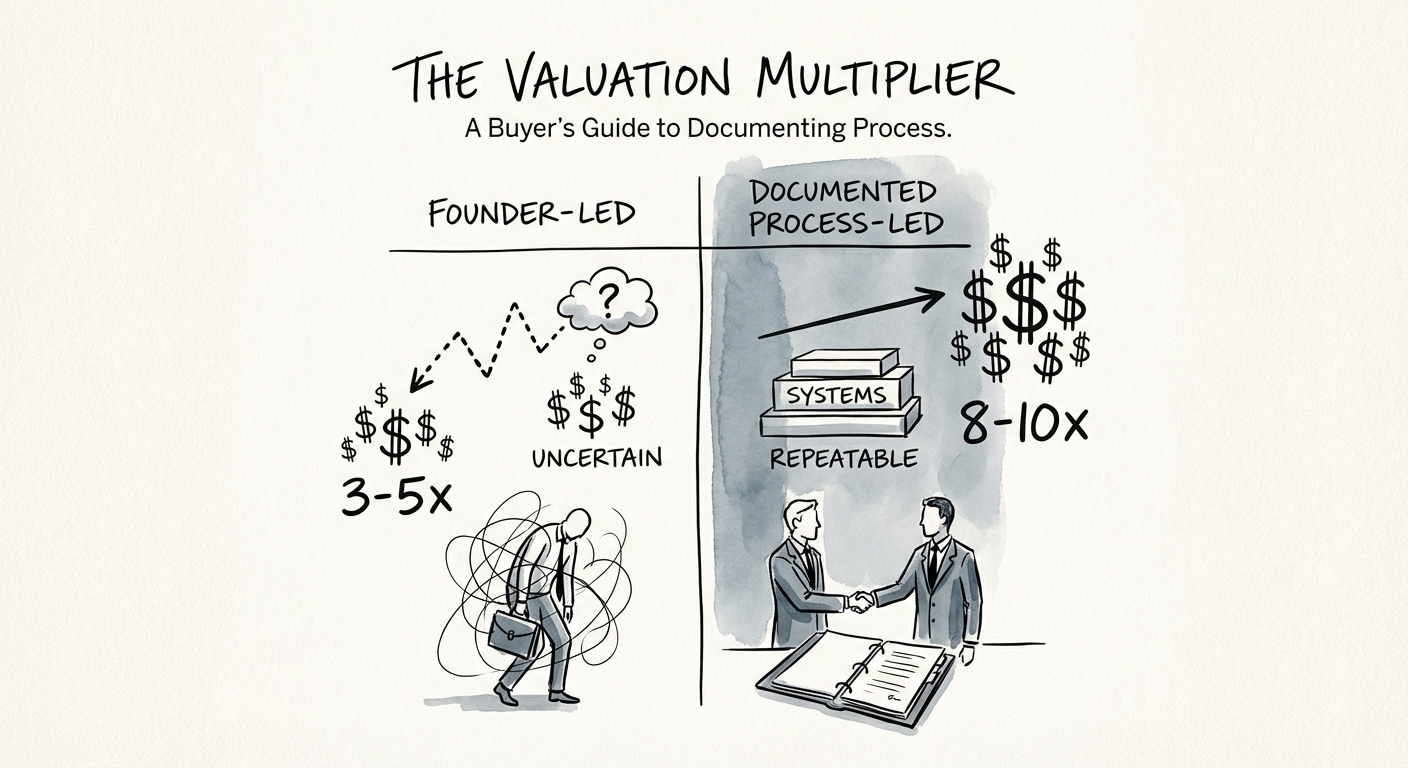
BRIEF · PROCESS DOCUMENTATION
The Transferability Premium: Why Documented Sales Processes Drive 2x Higher Valuation Multiples
Founder-led sales kill exit valuations. Learn how to document your sales process to unlock the 'Transferability Premium' and drive 2x higher multiples in due diligence.
2.4x Higher Valuation Multiple
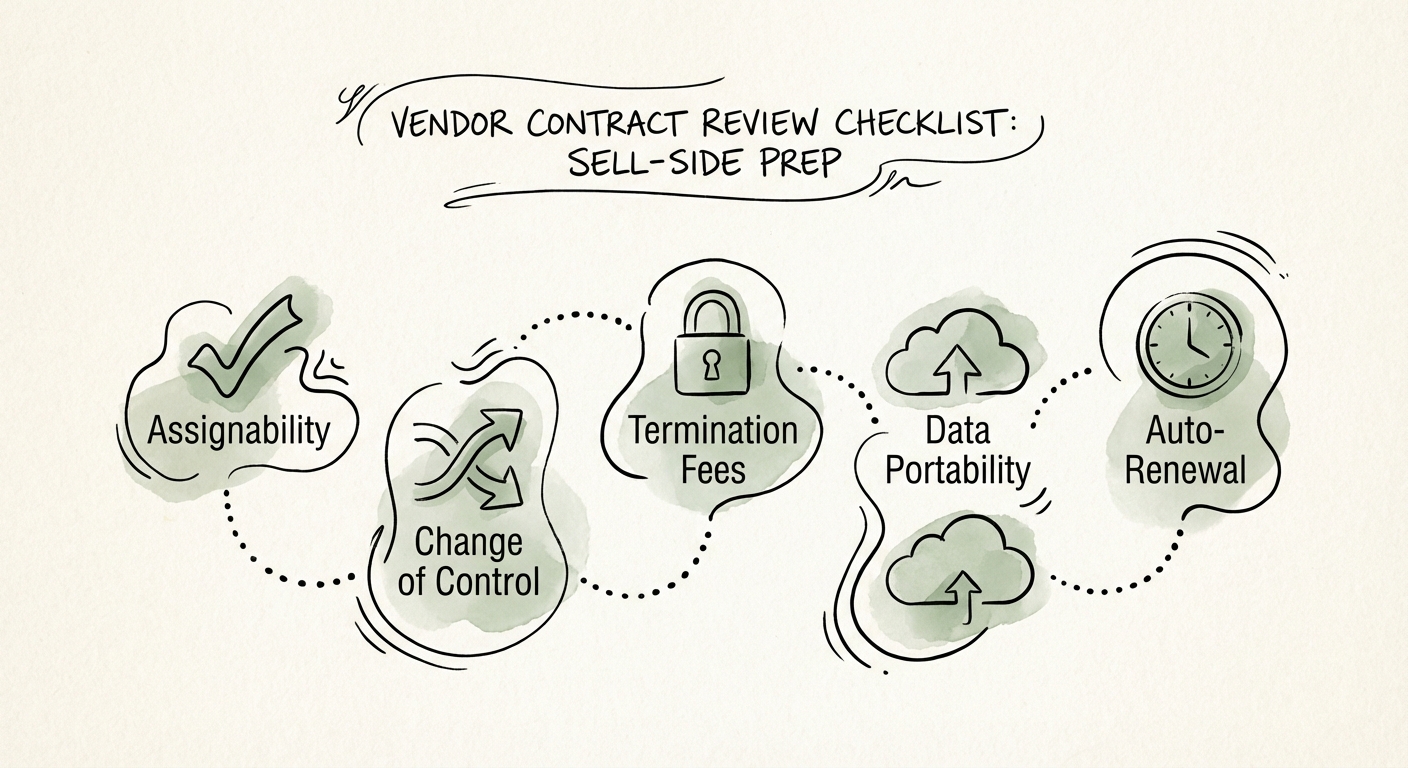
BRIEF · PROCESS DOCUMENTATION
The $150k Vendor Trap: A Contract Review Checklist for Sell-Side Preparation
Don't let a bad software contract kill your deal. A 5-point vendor contract review checklist for sell-side due diligence preparation. Avoid change-of-control traps.
15% Valuation impact of unassignable vendor contracts in tech deals
BRIEF · TECHNICAL DEBT
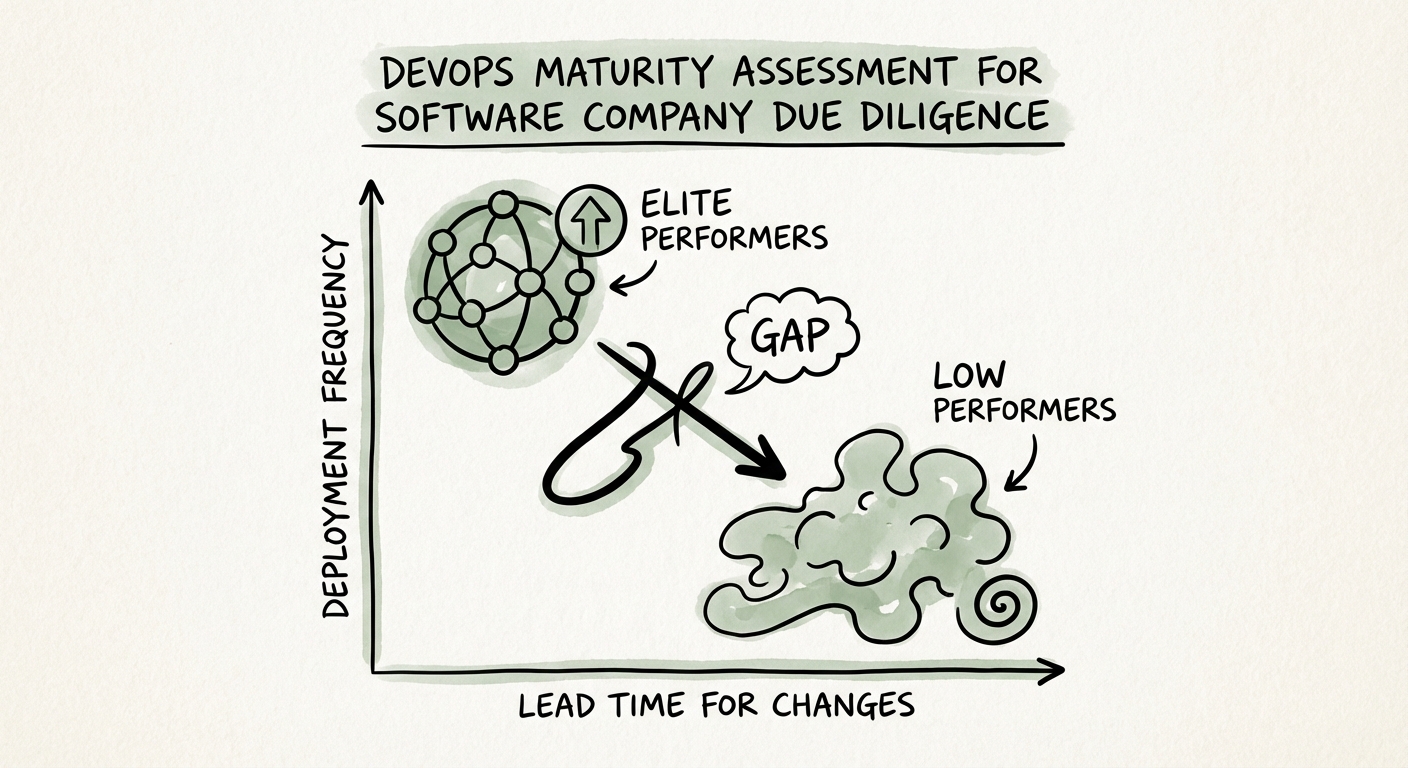
The 'Release Theater' Valuation Trap: Why Your Target's 182x Deployment Gap Kills Deal Value
Stop buying 'Release Theater.' Learn why elite DevOps teams recover 2,293x faster and how to spot the 'Hero Deployment' trap in due diligence.
2,293x Slower Recovery Time for Low Performers
BRIEF · PROCESS DOCUMENTATION
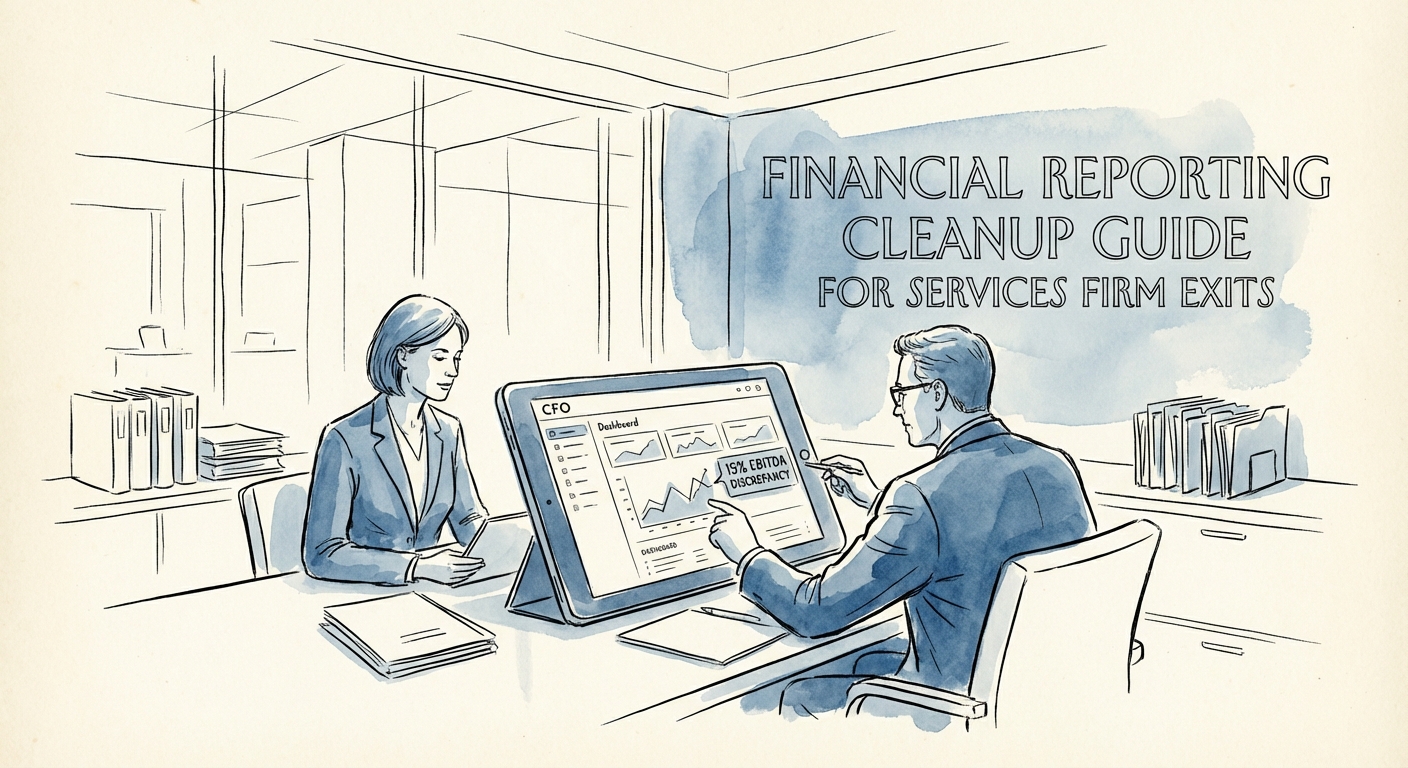
The Financial Cleanup Guide: Preparing Your Services Firm's Ledger for a Premium Exit
A diagnostic guide for cleaning up financial reporting before a services firm exit. Learn how to fix ASC 606 gaps, validate EBITDA add-backs, and survive the Quality of Earnings (QofE) audit.
40% CFO Data Trust Gap
BRIEF · TECHNICAL DEBT
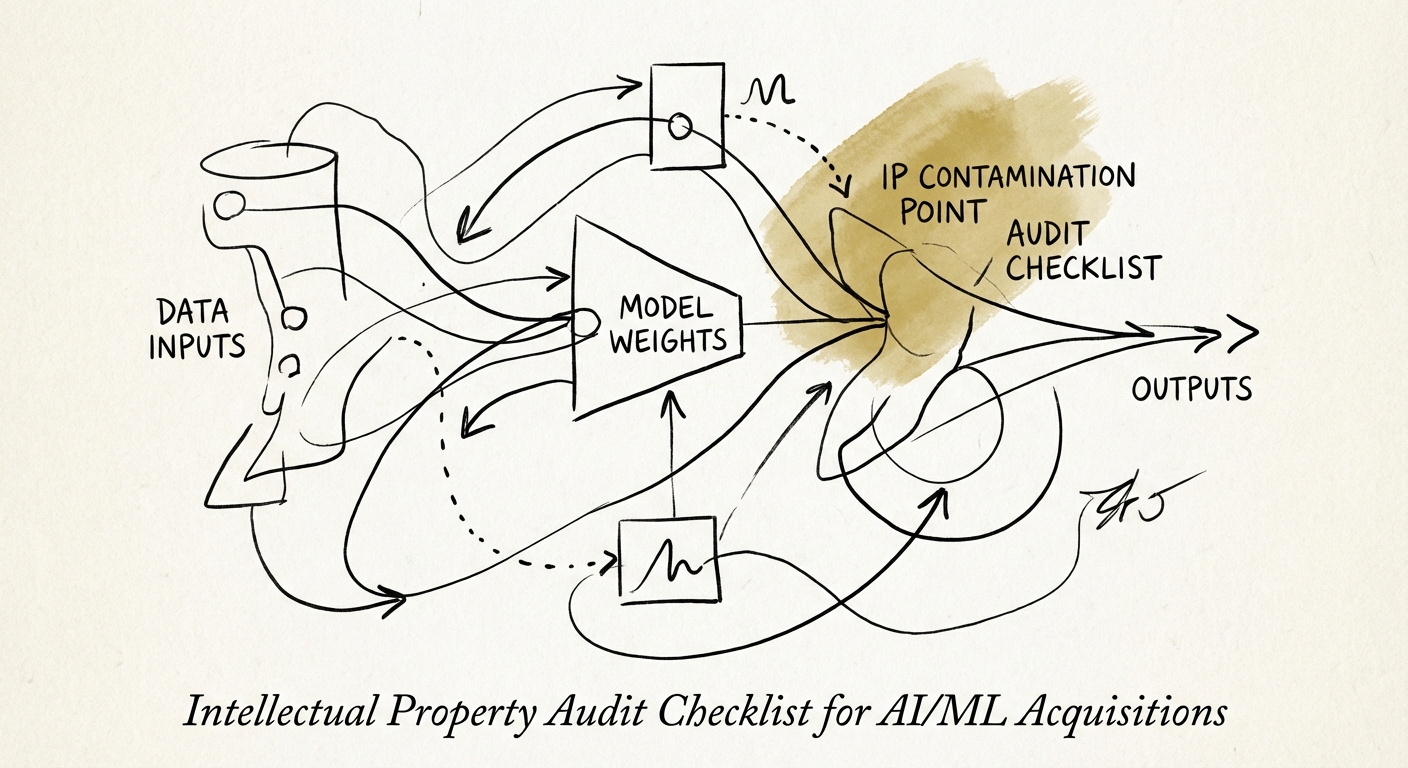
The IP Audit That Decides Whether You're Buying an AI Asset or a Deletion Order
In AI/ML deals, the model weights can be a liability, not an asset. Here's the data-provenance audit and deal structure that protects your basis.
66% of AI codebases contain high-risk IP or security vulnerabilities
BRIEF · PROCESS DOCUMENTATION
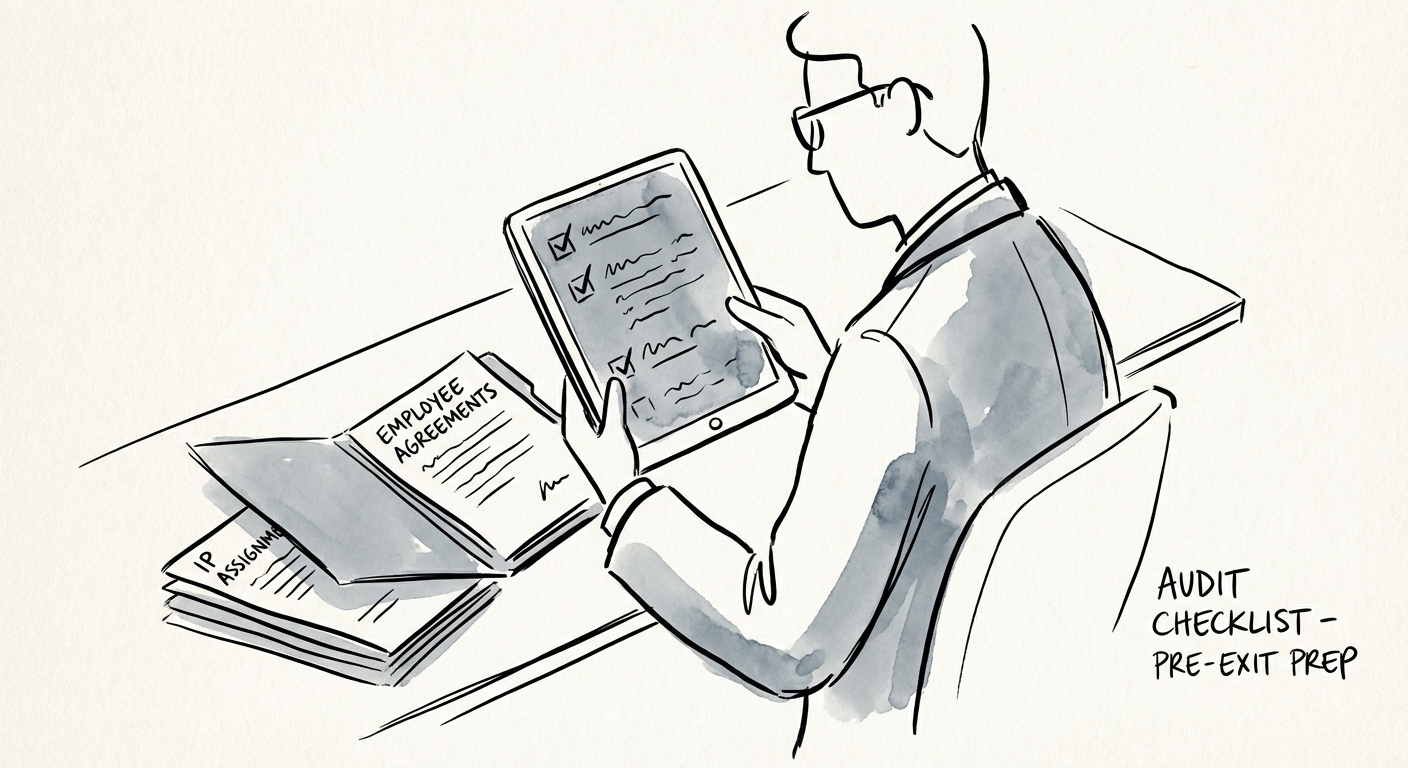
The Employee Agreement Audit: How to Prevent a 15% Valuation Holdback
Prevent a 15% valuation holdback with this employee agreement audit checklist. Cover IP assignments, non-competes, and change of control clauses before buyers look.
15% Typical Valuation Holdback for IP Assignment Gaps
BRIEF · EXIT READINESS
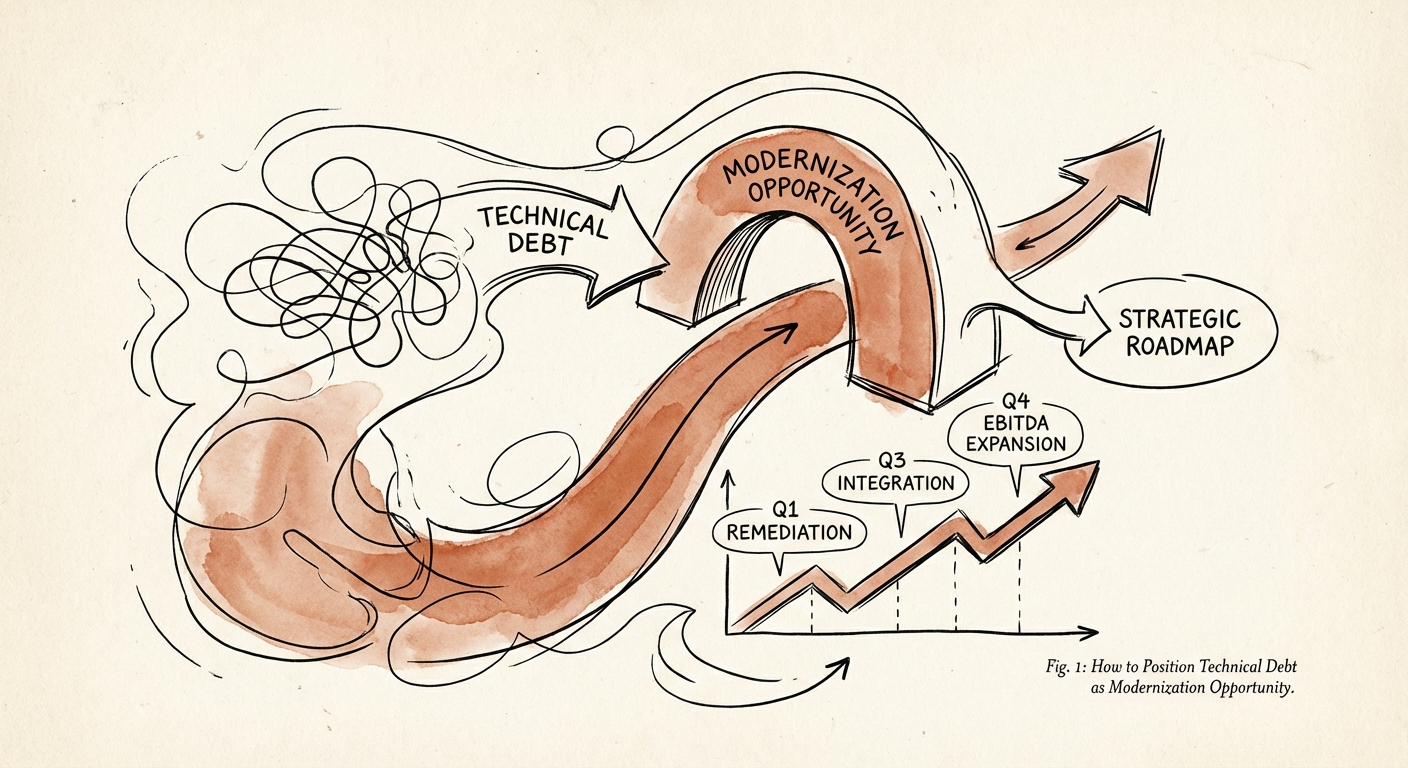
The 'Modernization Asset': Flipping the Technical Debt Narrative in Due Diligence
Stop hiding technical debt in due diligence. Learn how to position legacy code as a 'shovel-ready' modernization opportunity that drives higher exit multiples.
20% Potential Valuation Impact
BRIEF · TECHNICAL DEBT
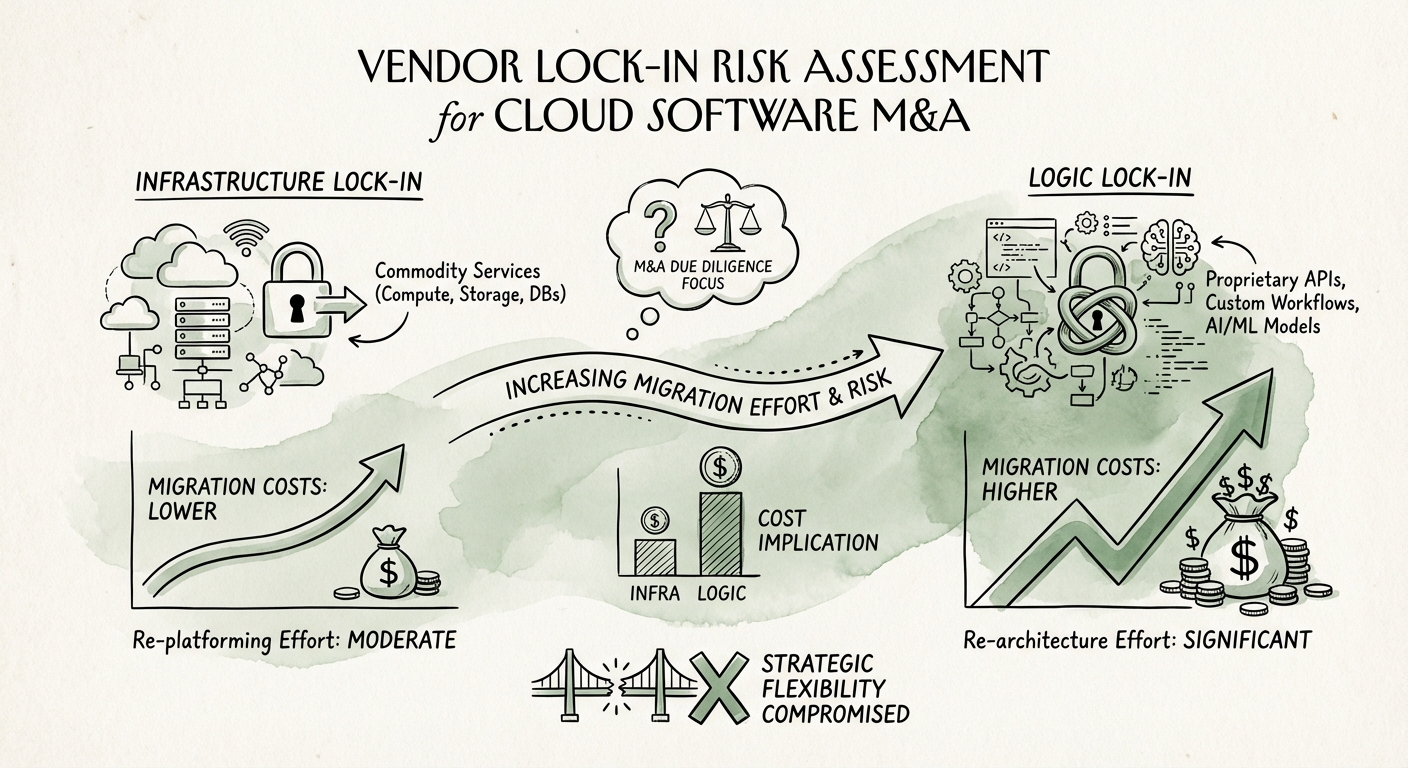
The 'Cloud-Native' Liability: Why Vendor Lock-In Is Killing Your Exit Options
Why 'cloud-native' creates a 15% valuation discount in M&A. A guide for PE sponsors to assess vendor lock-in, migration costs, and architectural dependency.
15-20% Valuation discount for non-portable cloud architectures
BRIEF · TECHNICAL DEBT
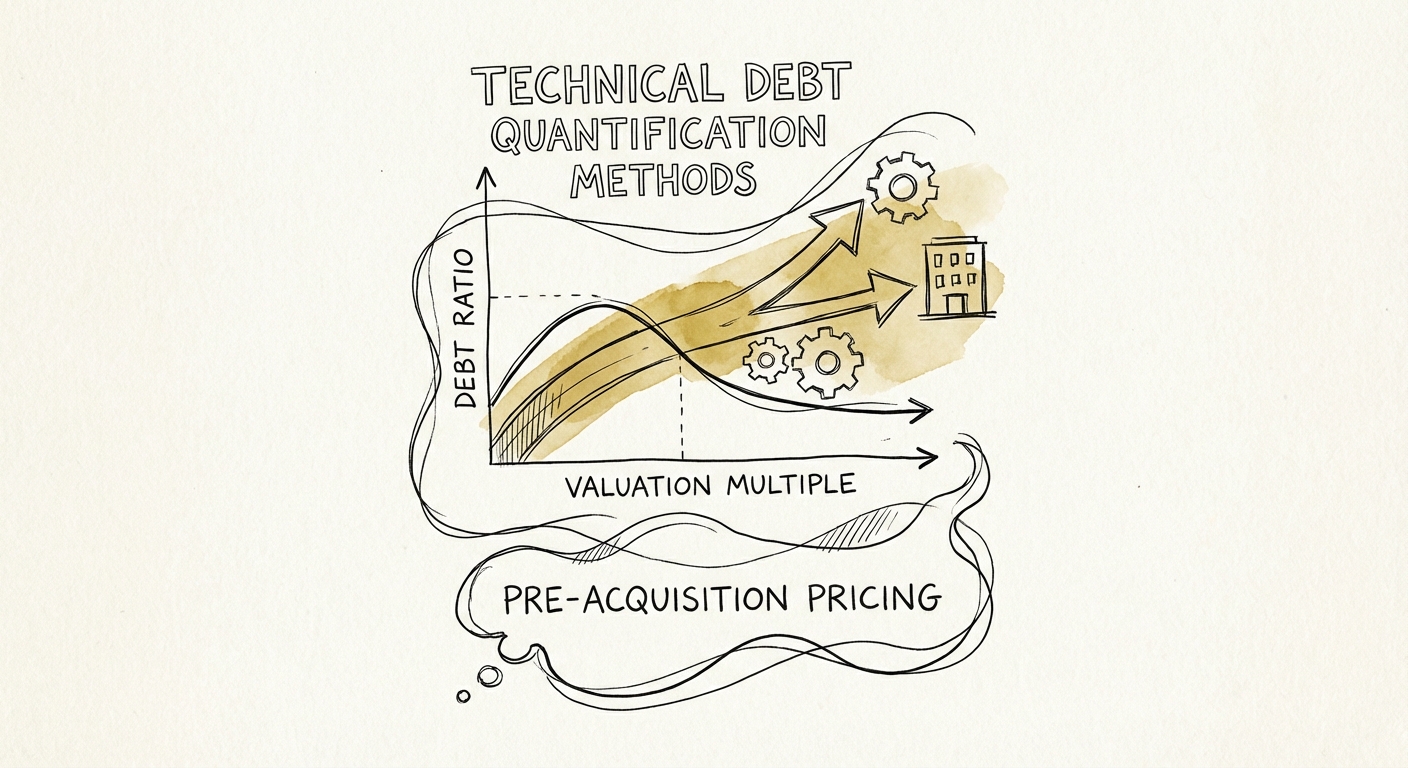
The $5M Code Tax: Quantifying Technical Debt for Pre-Acquisition Pricing Adjustments
Learn how to quantify technical debt in dollar terms to adjust pre-acquisition pricing. A diagnostic guide for PE sponsors to prevent post-close margin erosion.
40% Tech Estate Value as Debt
BRIEF · EXIT READINESS
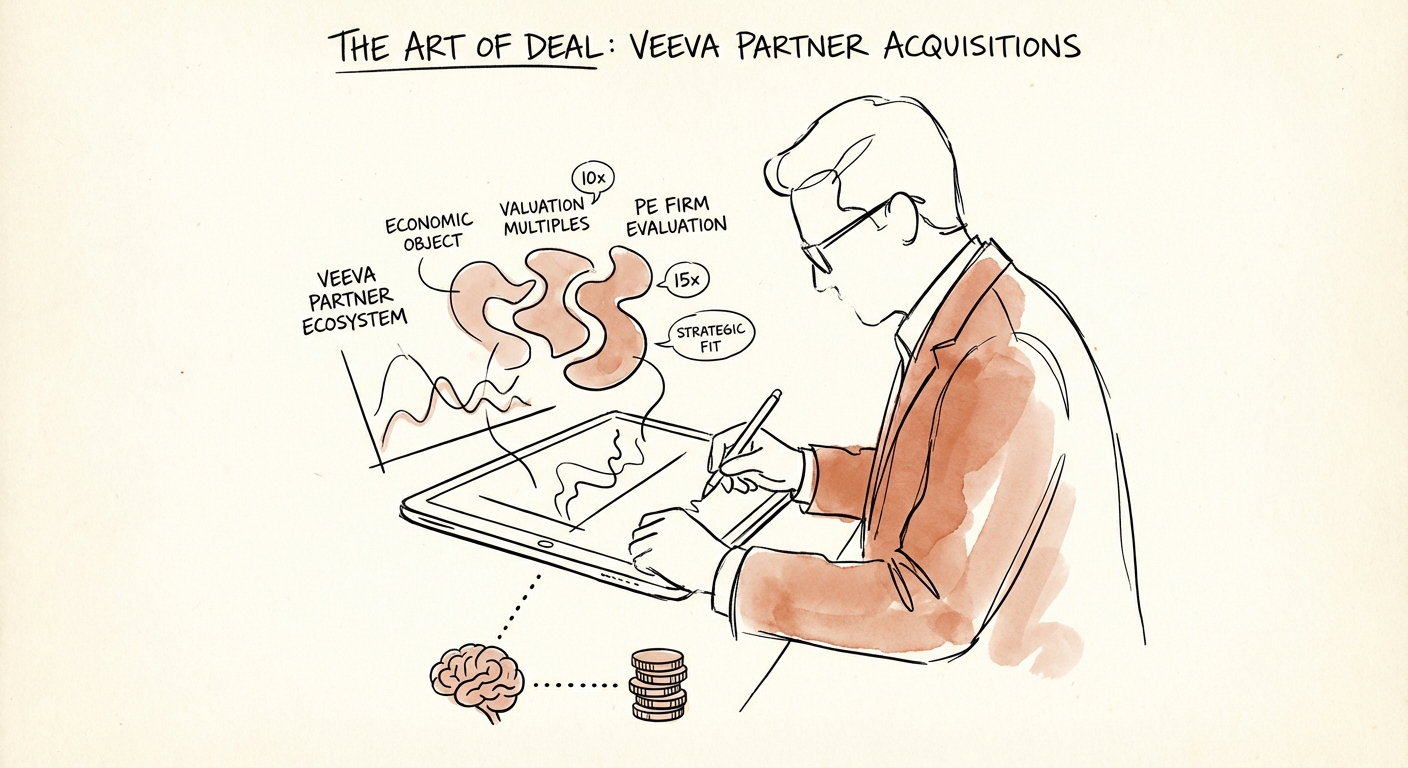
How PE Firms Evaluate Veeva Partner Acquisitions: The 2026 Diagnostic
A Private Equity due diligence framework for evaluating Veeva Systems partners. Benchmarks on Vault CRM migration opportunities, R&D Cloud premiums, and valuation multiples.
14x Specialist EBITDA Multiple