BRIEF · UNIT ECONOMICS
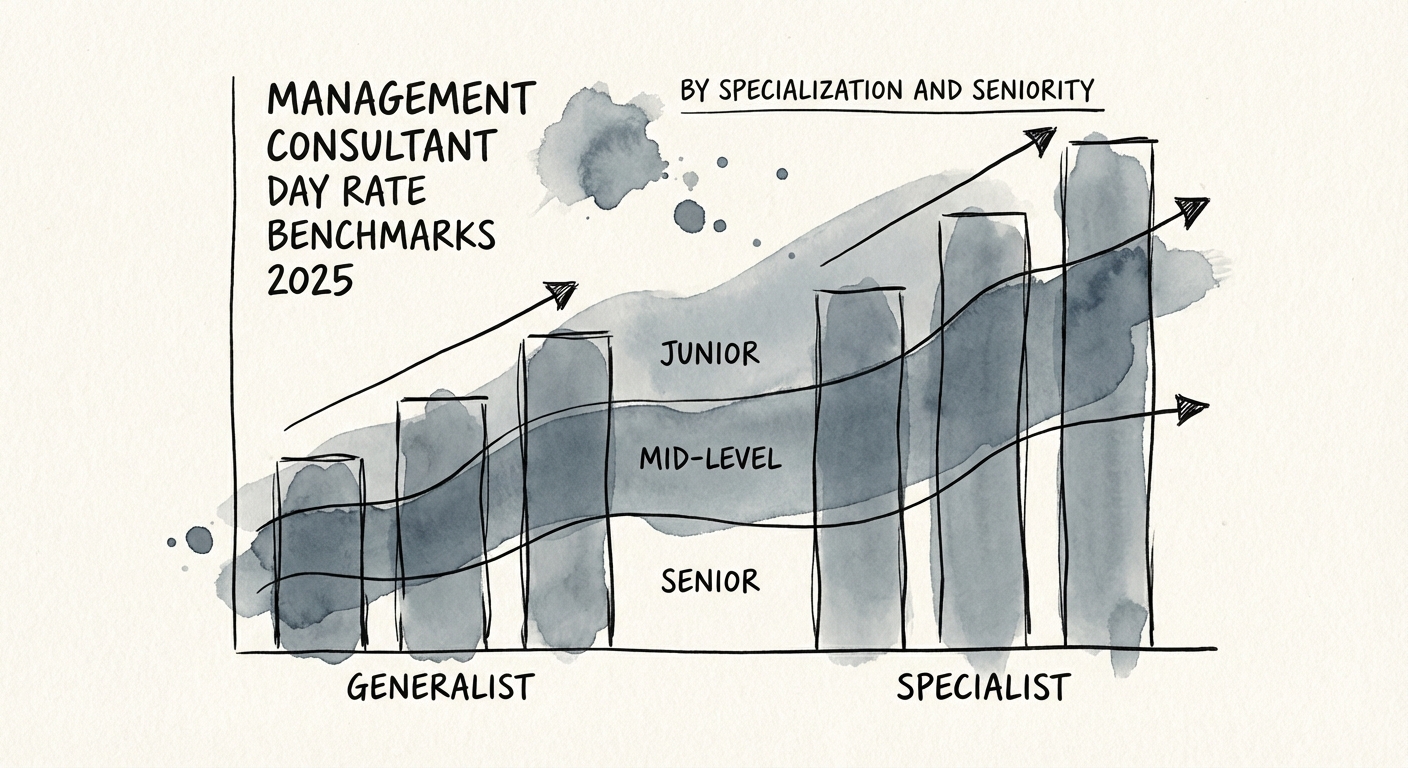
Management Consultant Day Rate Benchmarks 2025: The 'Specialist Premium' Widens
2025 management consultant day rate benchmarks. Data for Analyst to Partner levels across Strategy, Tech, and Implementation. See why specialists command a 42% premium.
42% Specialist Rate Premium
BRIEF · PROCESS DOCUMENTATION
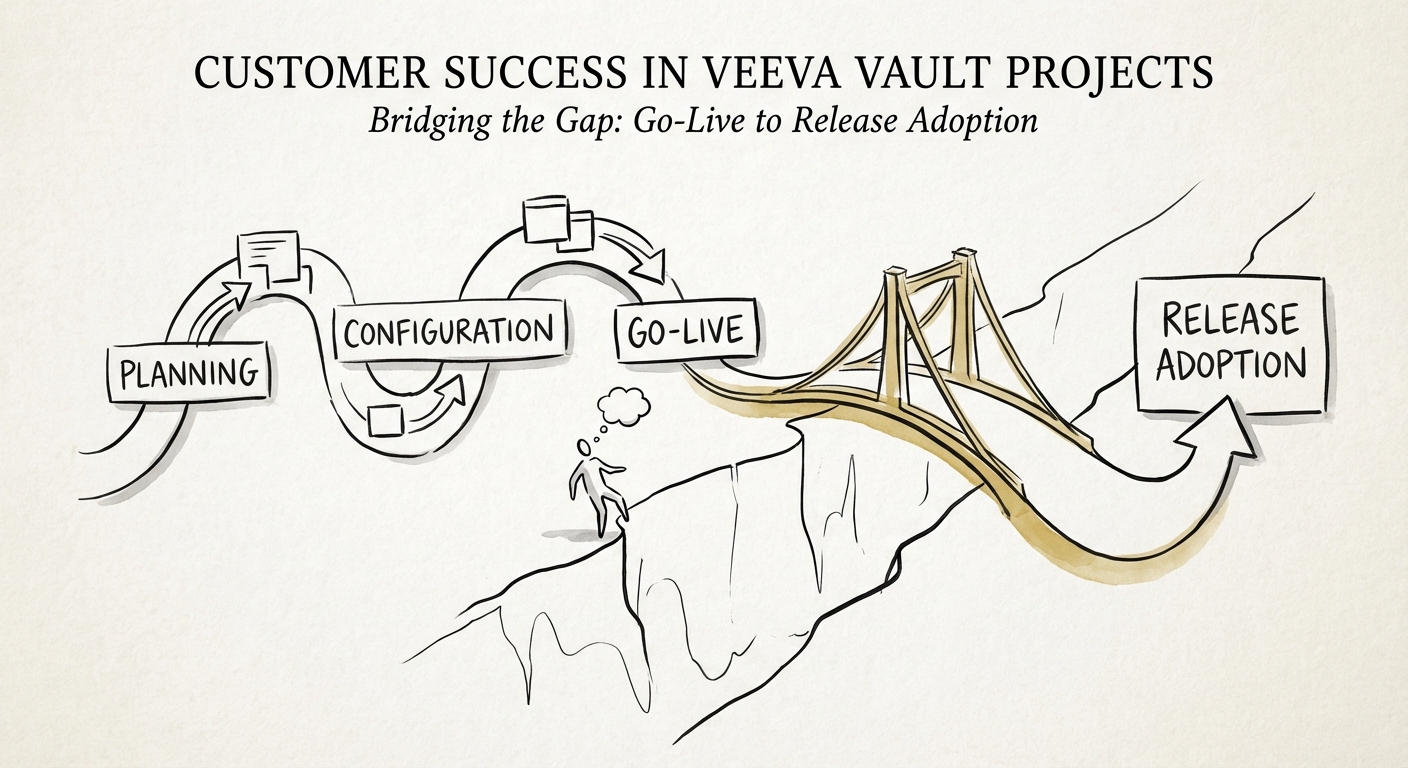
The 'Validation Trap': Why Your Veeva Vault Implementation Is Bleeding ROI
Why 70% of Veeva Vault features go unused and how 'Release Management' serves as the bridge between 6x implementation shops and 14x strategic partners.
$540,000 Daily Cost of Trial Delay
BRIEF · EXIT READINESS
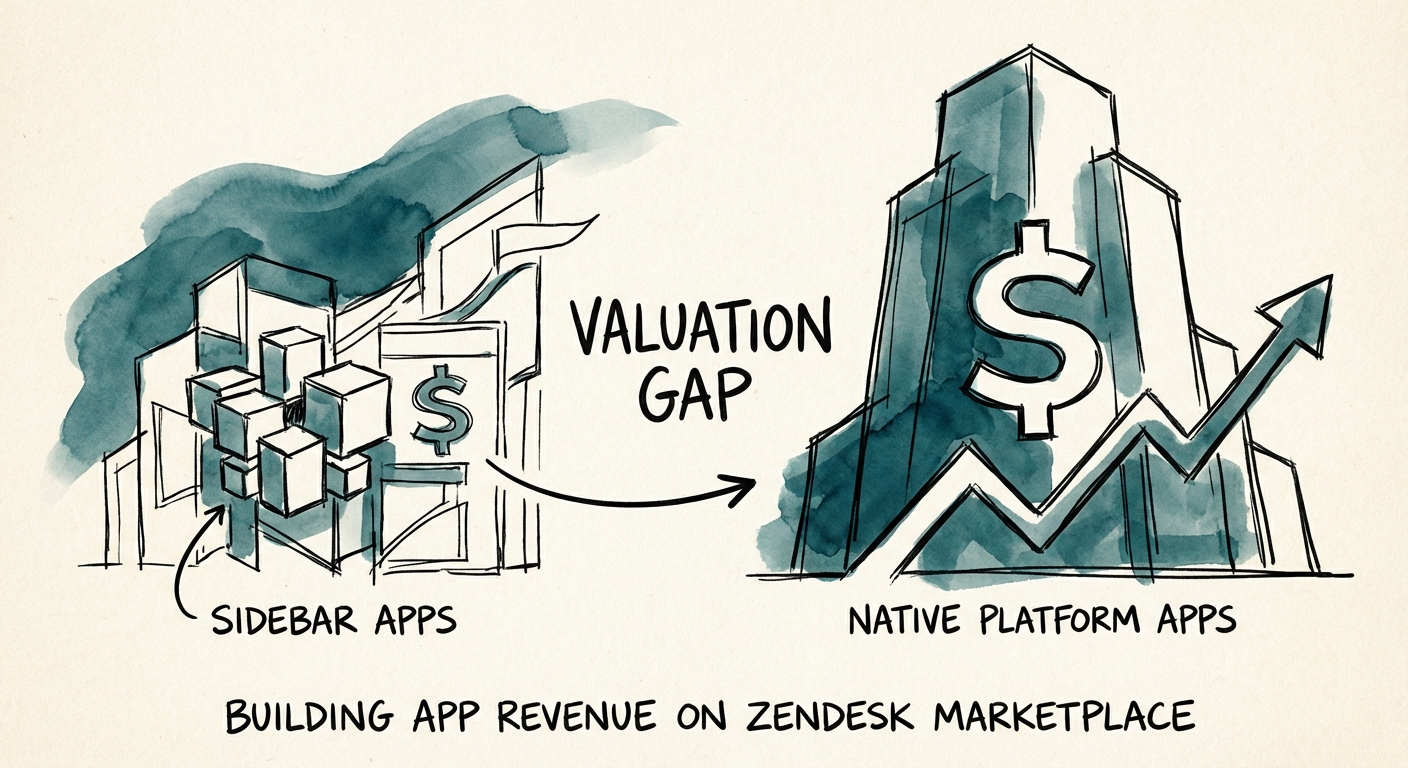
The Zendesk Marketplace Multiplier: Why 'Sidebar' Apps Trade at 2x and 'CX Platforms' Trade at 10x
Why generic Zendesk apps trade at 2x revenue while native CX platforms command 10x multiples. A diagnostic guide for ISV founders on building exit-ready architecture.
10x Potential ARR Multiple
BRIEF · EXIT READINESS
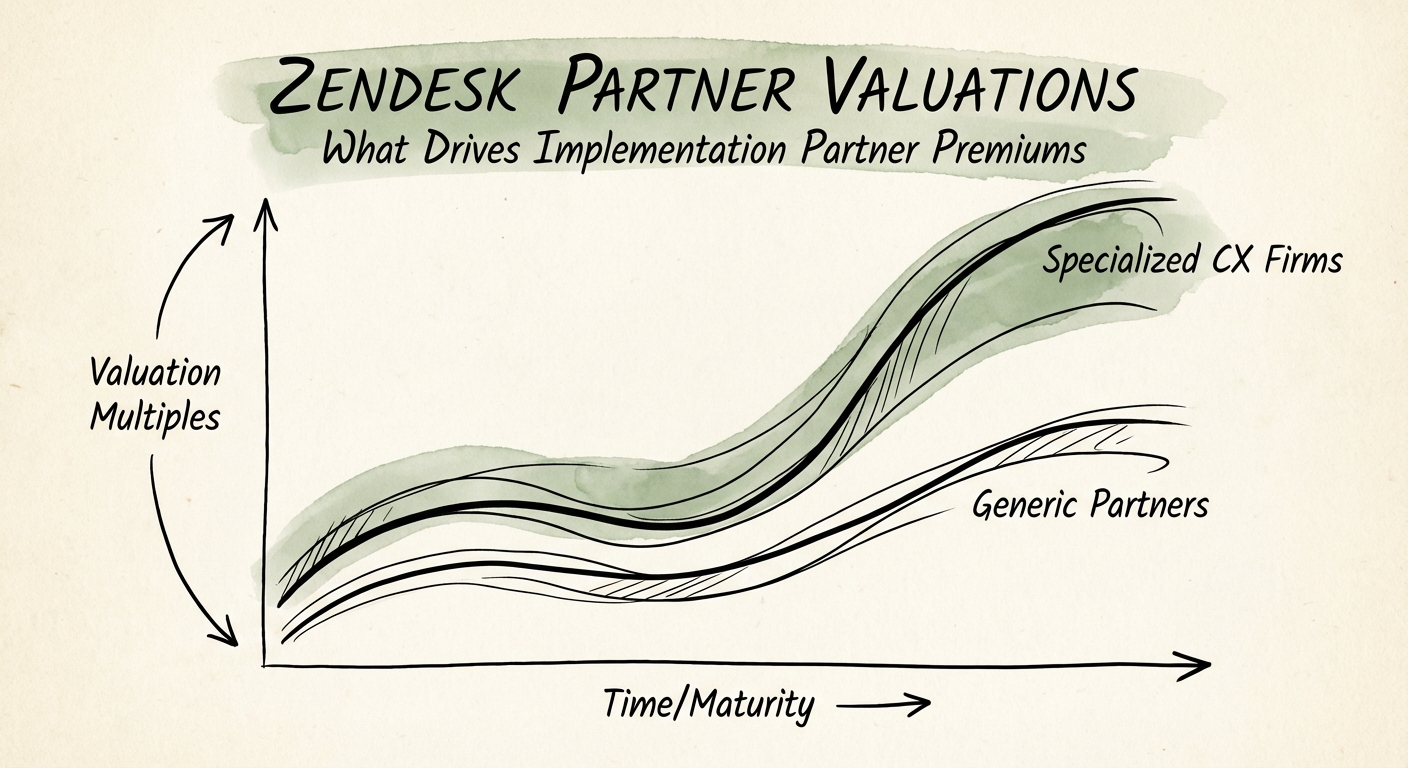
Zendesk Partner Valuations: The Gap Between 'Ticket Flippers' and 'CX Architects'
New data on Zendesk partner valuations. Why 'Ticket Flippers' trade at 5x EBITDA while 'CX Architects' and AI specialists command 12x multiples.
12x Max EBITDA Multiple
BRIEF · UNIT ECONOMICS
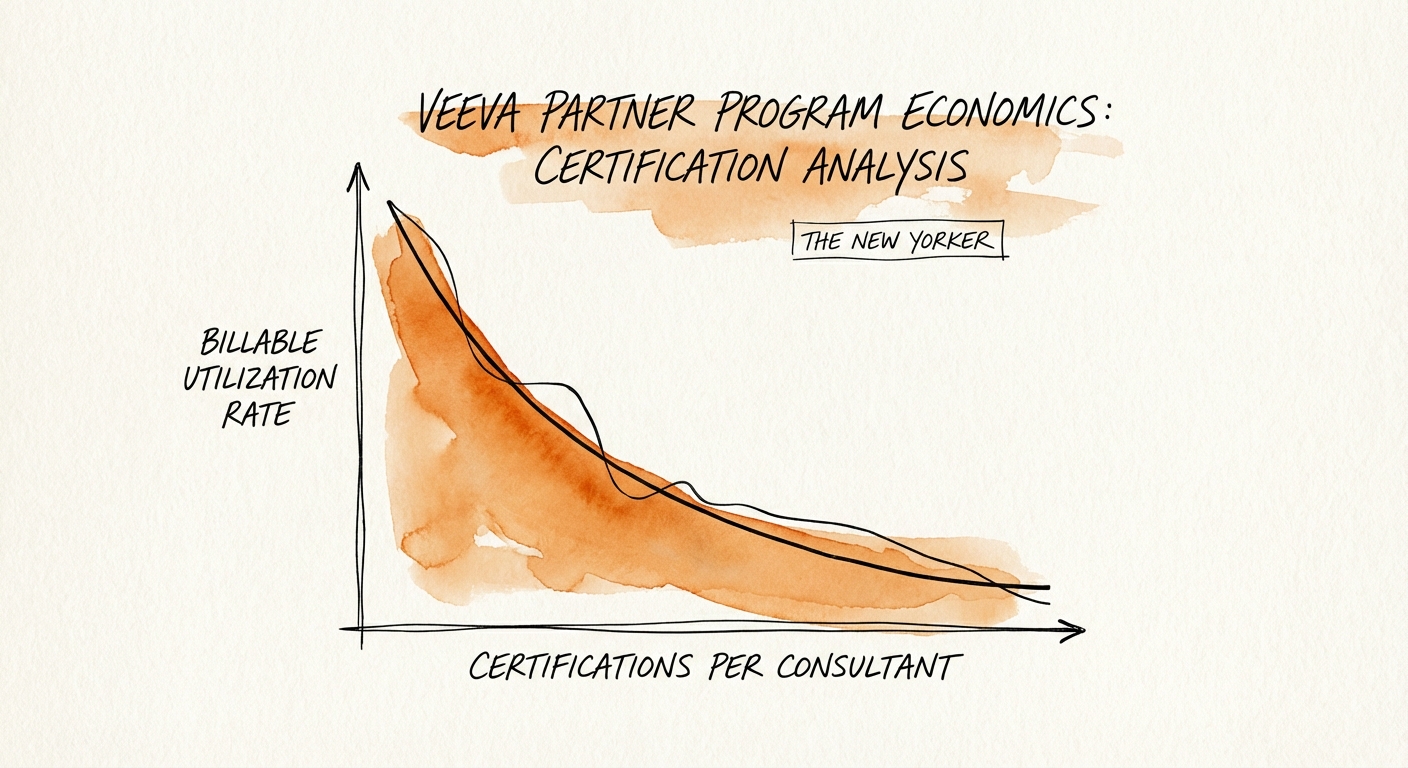
The Veeva Partner Economics Guide: Why 'Badge Collecting' Is Killing Your Margins
Analysis of Veeva partner program economics for PE and Founders. Benchmarks on certification costs, Vault CRM migration opportunities, and valuation multiples.
3x Annual Recertification Cycle
BRIEF · TECHNICAL DEBT
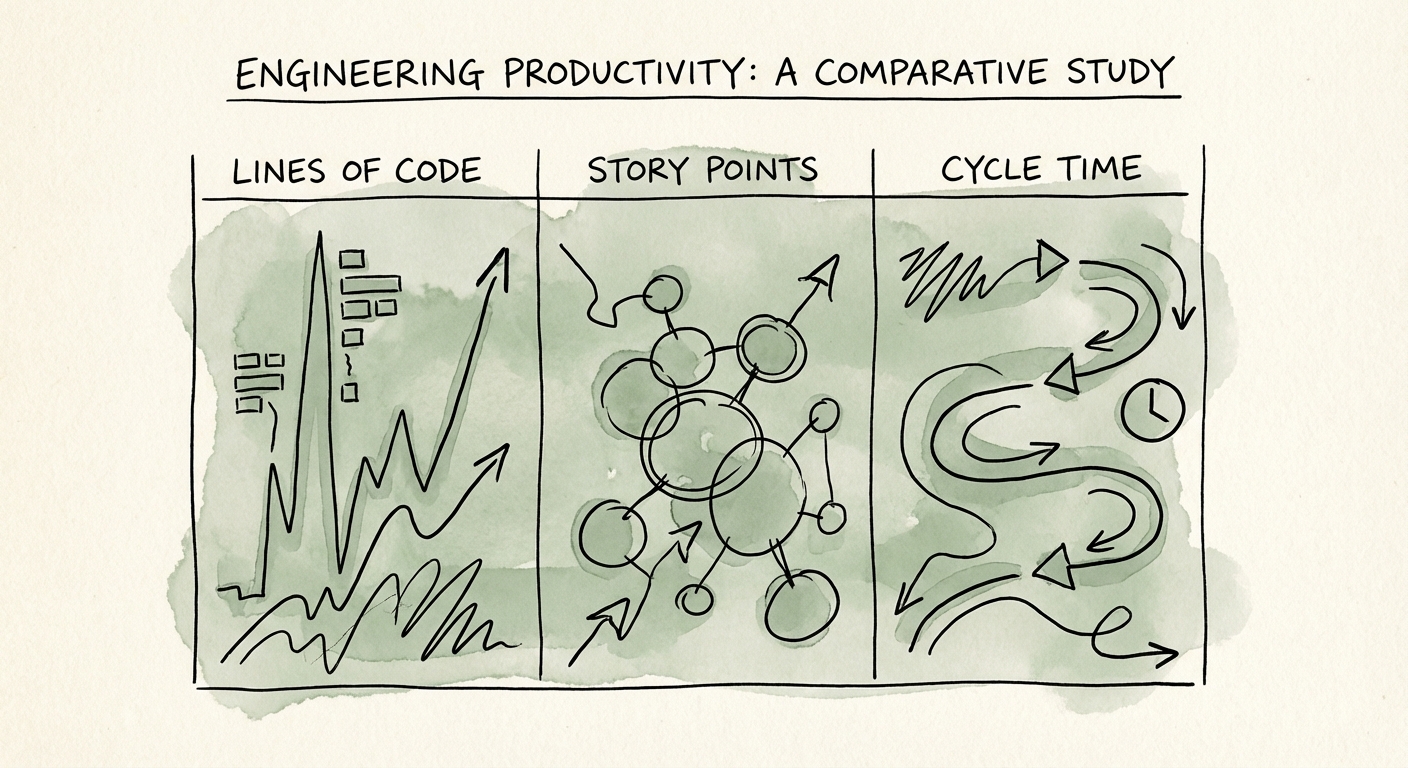
The 'Black Box' of Engineering: Why Your Productivity Metrics Are Lying to You
Stop measuring engineering activity. Start measuring flow. Compare Lines of Code, Story Points, and Cycle Time with 2025 benchmarks for PE-backed teams.
26 Hours Elite Cycle Time Benchmark
BRIEF · EXIT READINESS
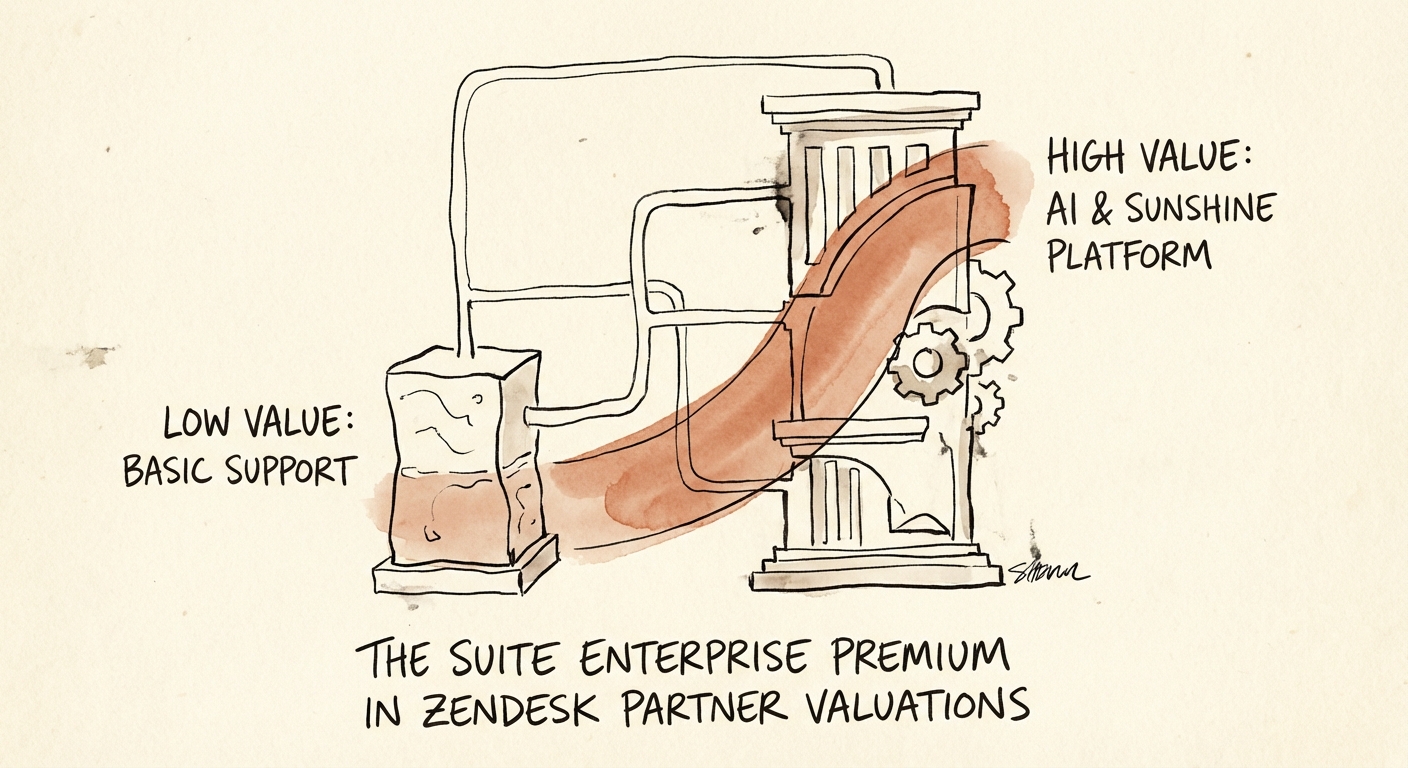
The Suite Enterprise Premium: Why 'Ticket Shops' Trade at 6x and CX Architects Command 12x
Why Zendesk partners focusing on Suite Enterprise and Sunshine trade at 12x multiples while 'ticket deflection' shops stall at 6x.
12x Potential EBITDA Multiple
BRIEF · GTM EXECUTION
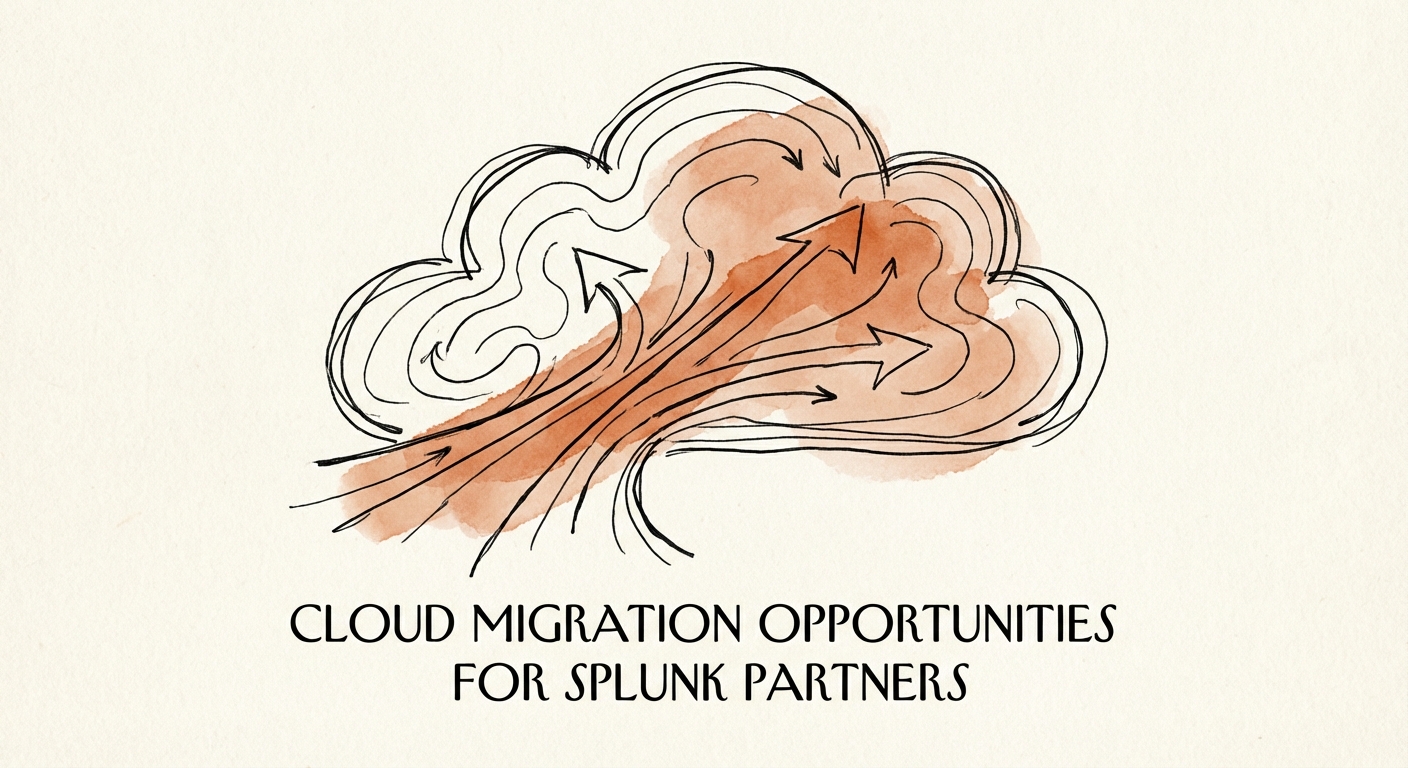
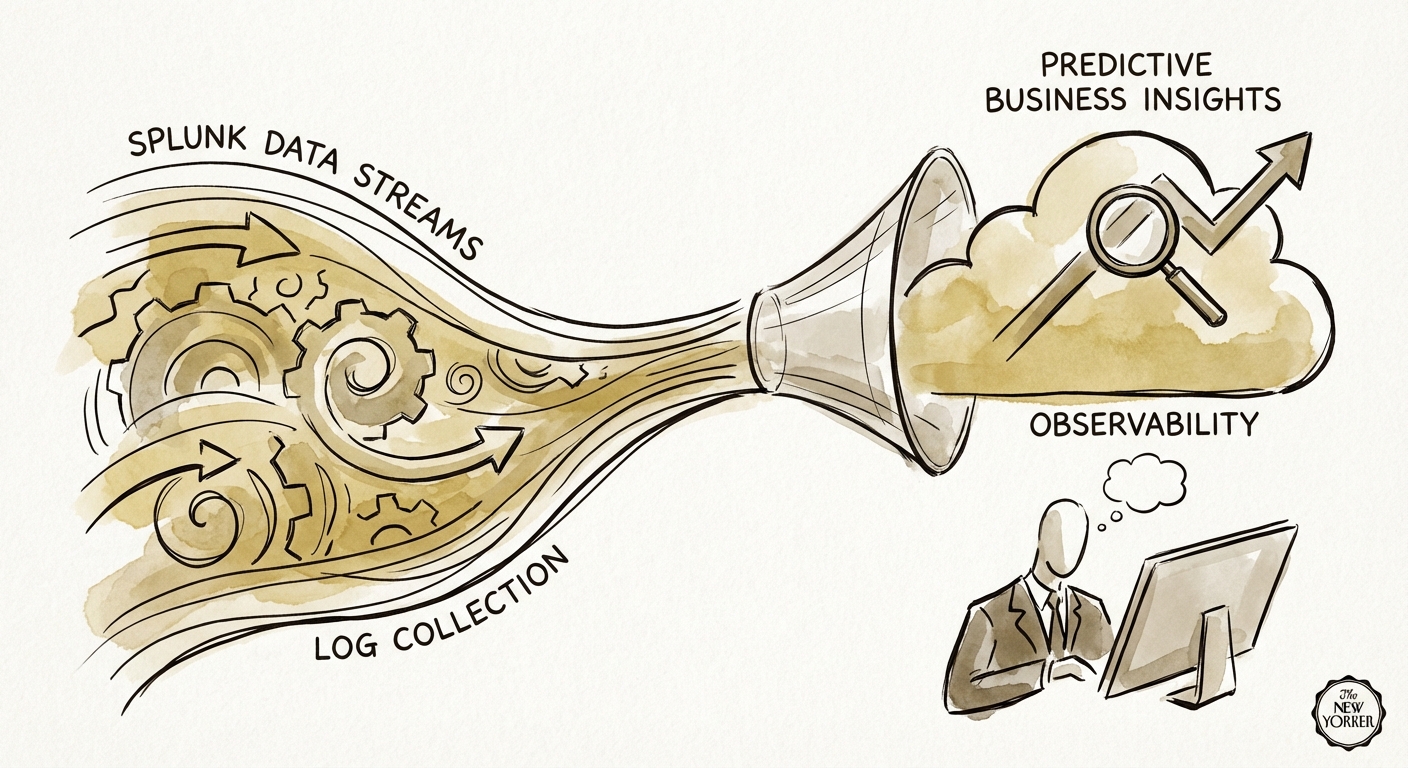
Splunk Cloud Migration Opportunities for Partners
Cisco's acquisition of Splunk increases the importance of cloud migration, ingest optimization, observability architecture, and recurring managed services for partners.
Observability Partner Value Driver
BRIEF · GTM EXECUTION
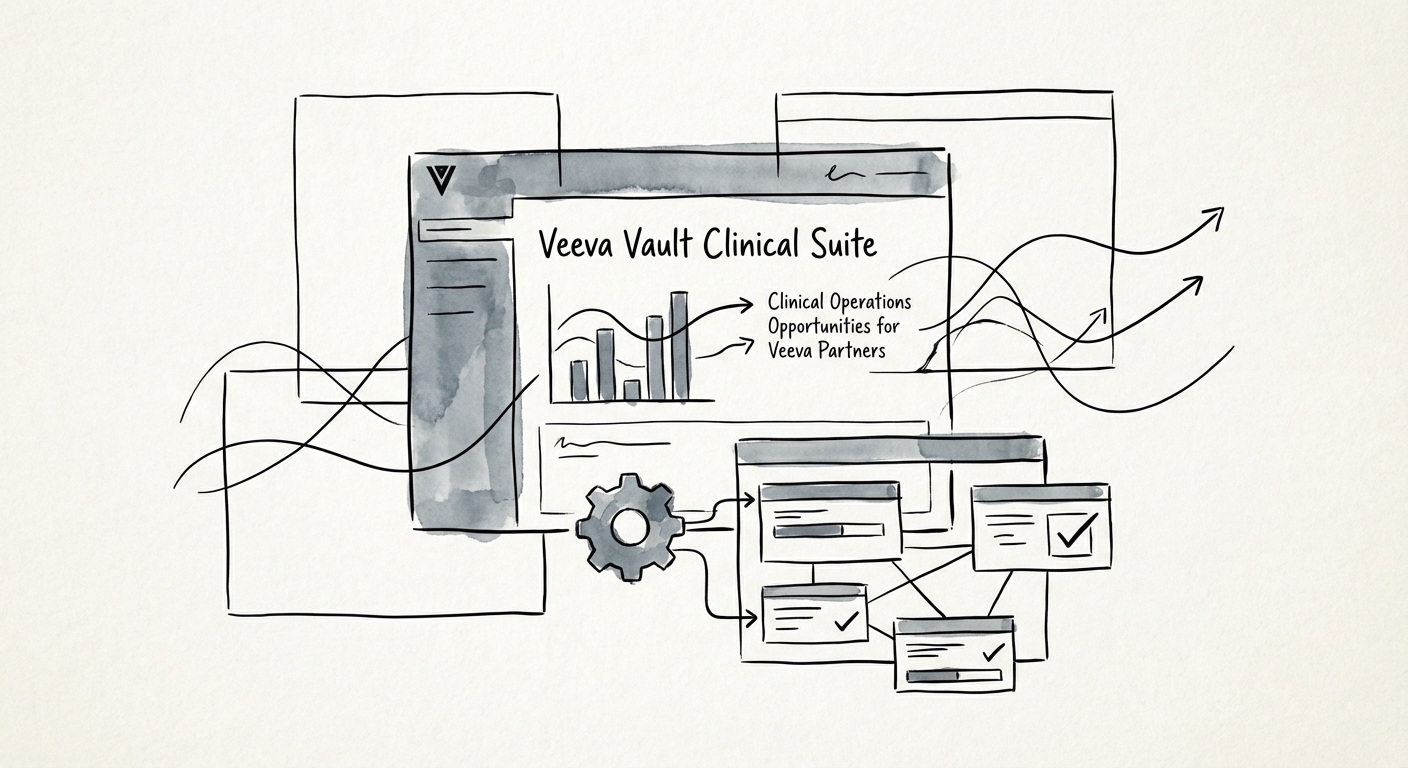
The "Clinical Data" Premium: Why Veeva Partners with CDMS Expertise Trade at 14x (And eTMF Shops Stall at 8x)
Veeva eTMF services are a commodity. Learn why CDMS and Clinical Data expertise drive 14x valuation multiples for Veeva partners in 2026.
$32B Healthcare IT Deal Value (2025)
BRIEF · EXIT READINESS
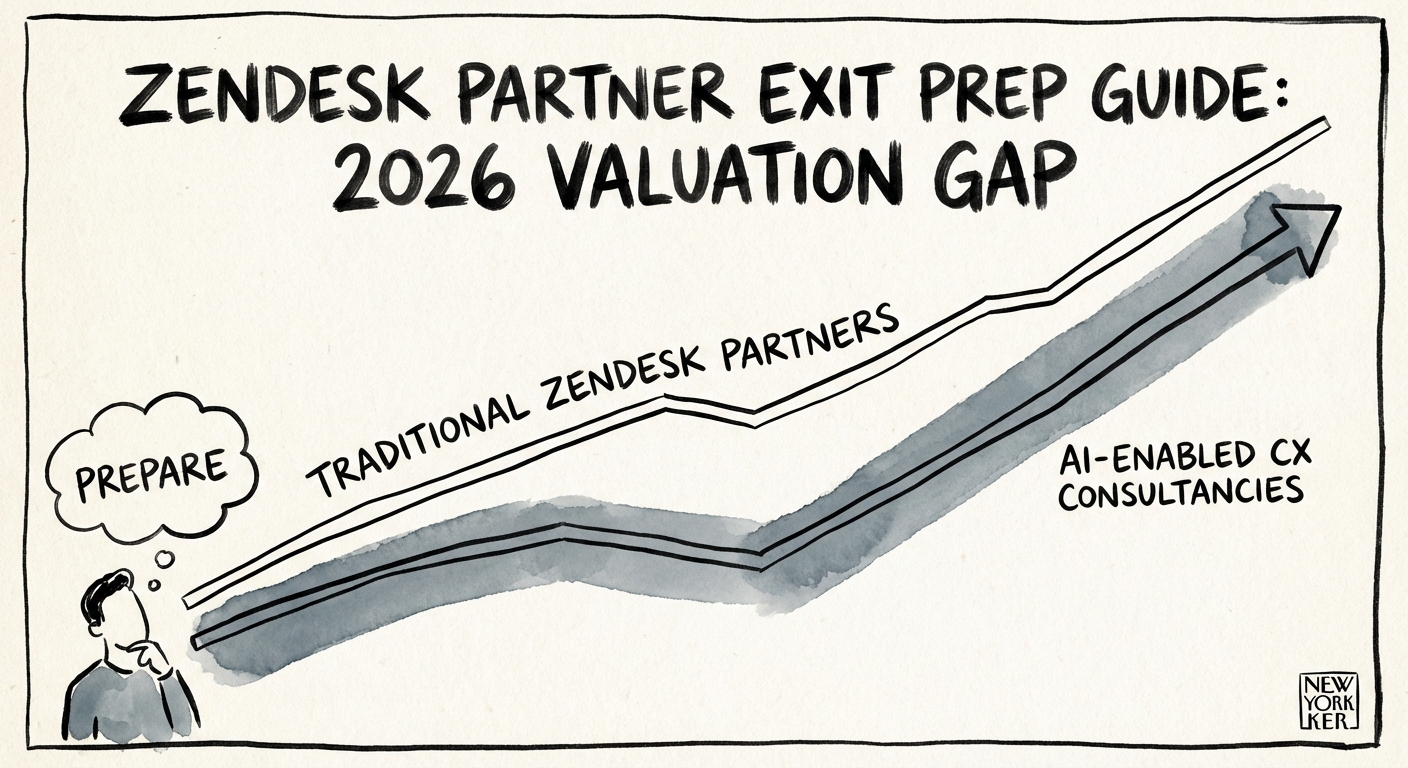
Zendesk Partner Exit Preparation: The Gap Between 'Ticket Deflection' and 'Agentic Strategy'
Why Zendesk partners are bifurcating into 6x 'ticket shops' and 14x 'agentic strategists'. A CEO's guide to maximizing exit value in the age of AI agents.
14x EBITDA Multiple for Agentic CX Partners
BRIEF · MIGRATION & INTEGRATION
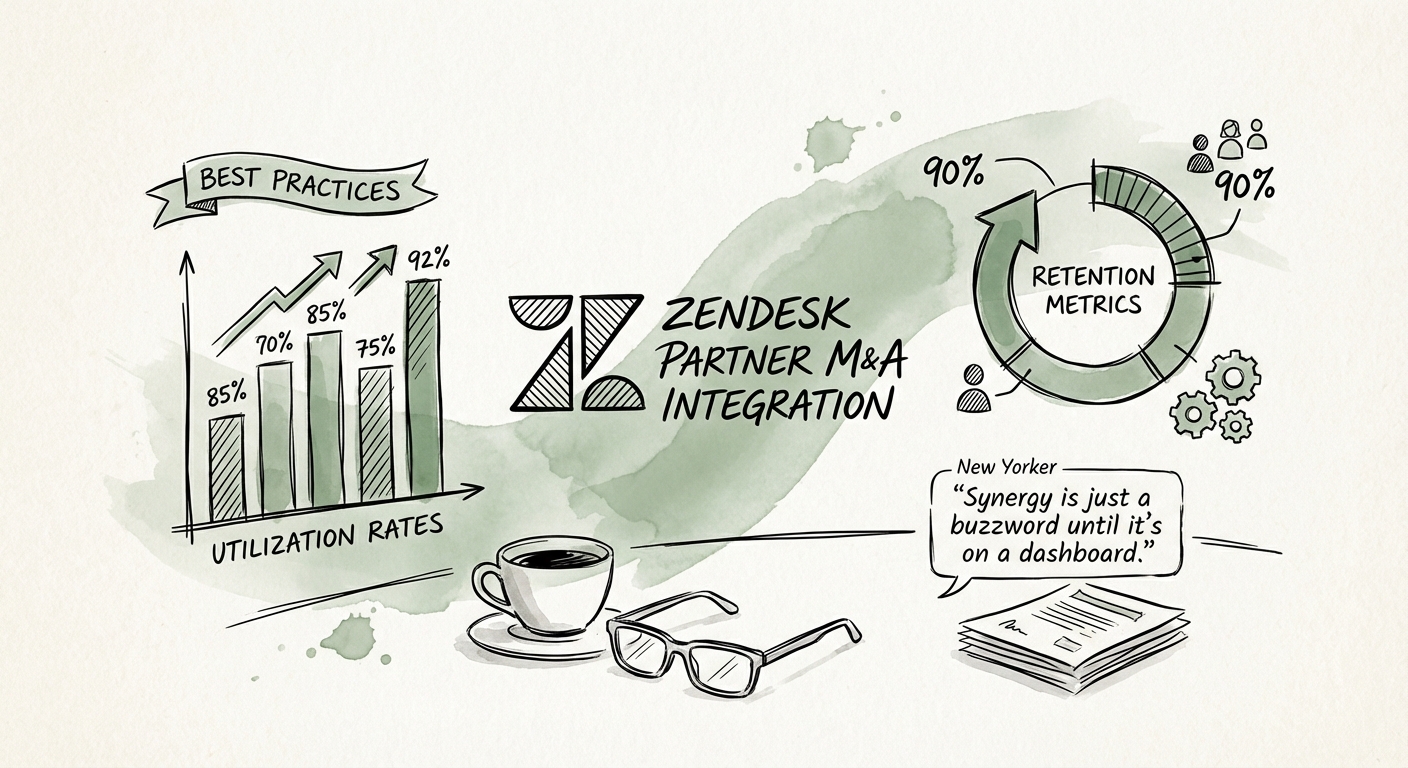
Zendesk Partner M&A Integration: The Playbook for Preventing 'Brain Drain' and Protecting EBITDA
70% of M&A synergies fail due to poor integration. Here is the post-merger playbook for PE-backed Zendesk partners to consolidate instances, retain talent, and unlock value.
47% Key Employee Attrition Rate (Year 1)
BRIEF · EXIT READINESS
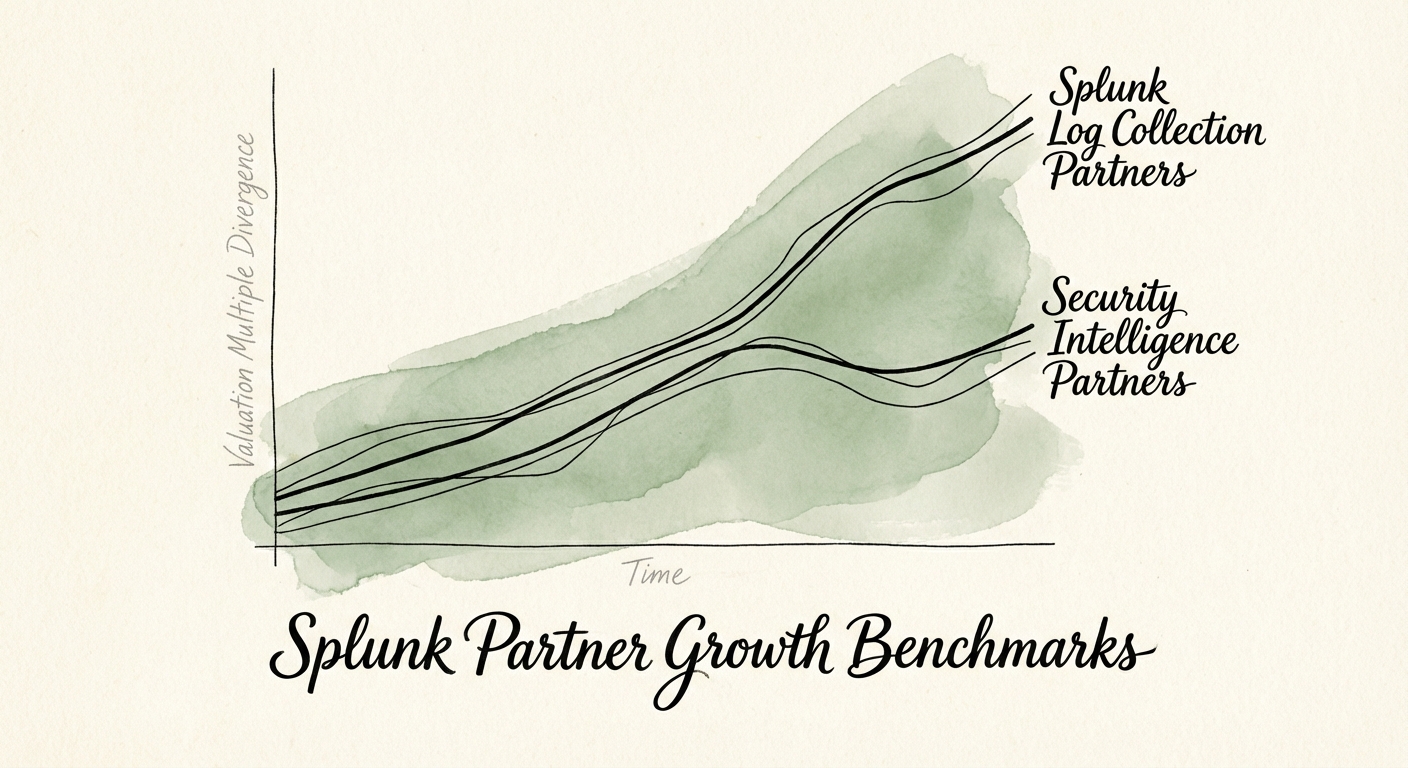
Splunk Partner Growth Benchmarks: The Gap Between "Log Collectors" and Security Intelligence
Analysis of Splunk partner growth stages from $5M to $50M. Why 'Log Collectors' trade at 6x while Security Intelligence firms command 14x in the Cisco era.
14x EBITDA Valuation for Elite Partners
BRIEF · EXIT READINESS
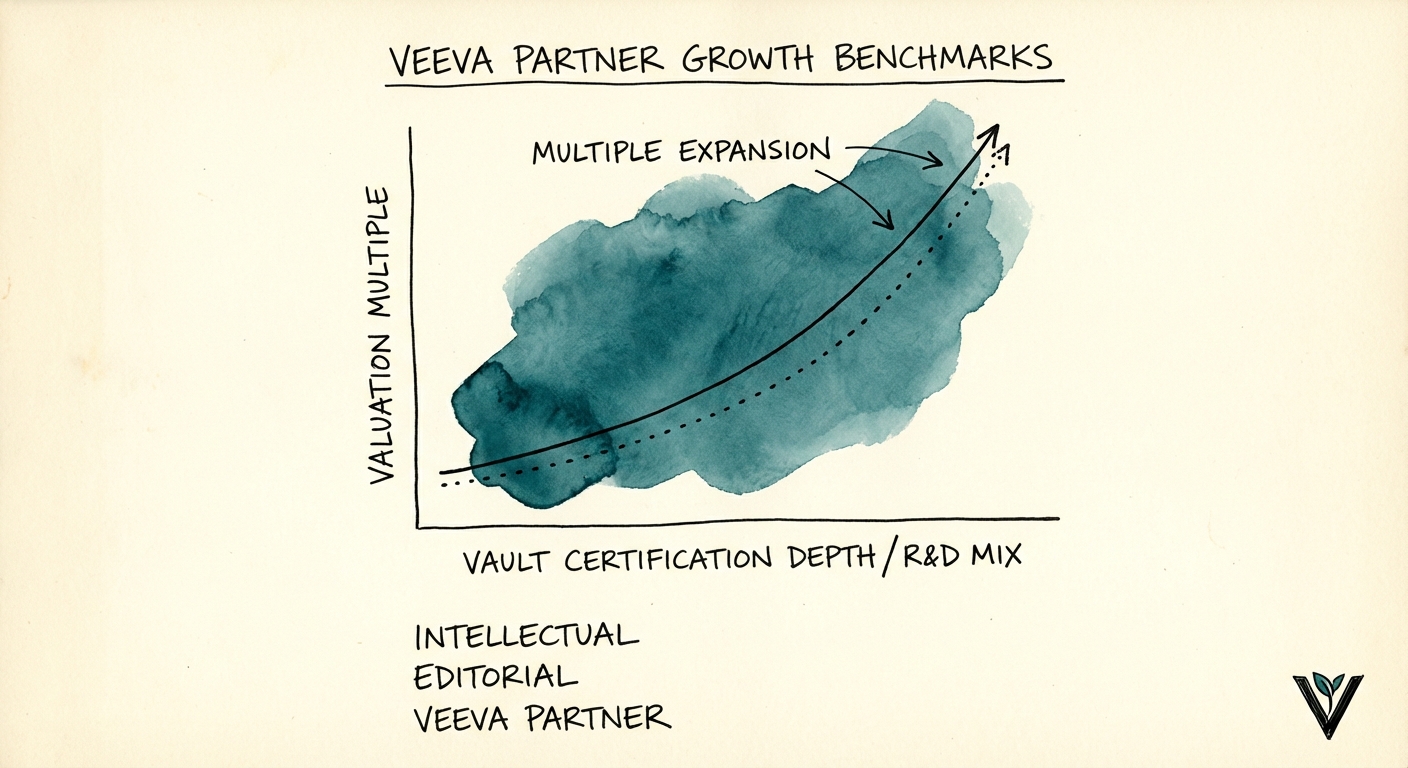
Veeva Partner Growth Benchmarks: The "Vault Premium" and the Path to 14x
New data on Veeva partner valuations. Why 'Commercial Cloud' shops stall at 8x EBITDA while 'Vault' specialists command 14x multiples in 2026.
13.6x Median EBITDA Multiple for Specialized Life Sciences Partners
BRIEF · EXIT READINESS
The IT Operations Specialization in Splunk Valuations: The Gap Between "Log Collectors" and "Predictive Strategists"
Why Splunk partners with ITSI and Observability specializations trade at 14x multiples while generalist log collectors stall at 6x. A diagnostic for PE investors.
14x EBITDA Multiple for ITOps Specialists
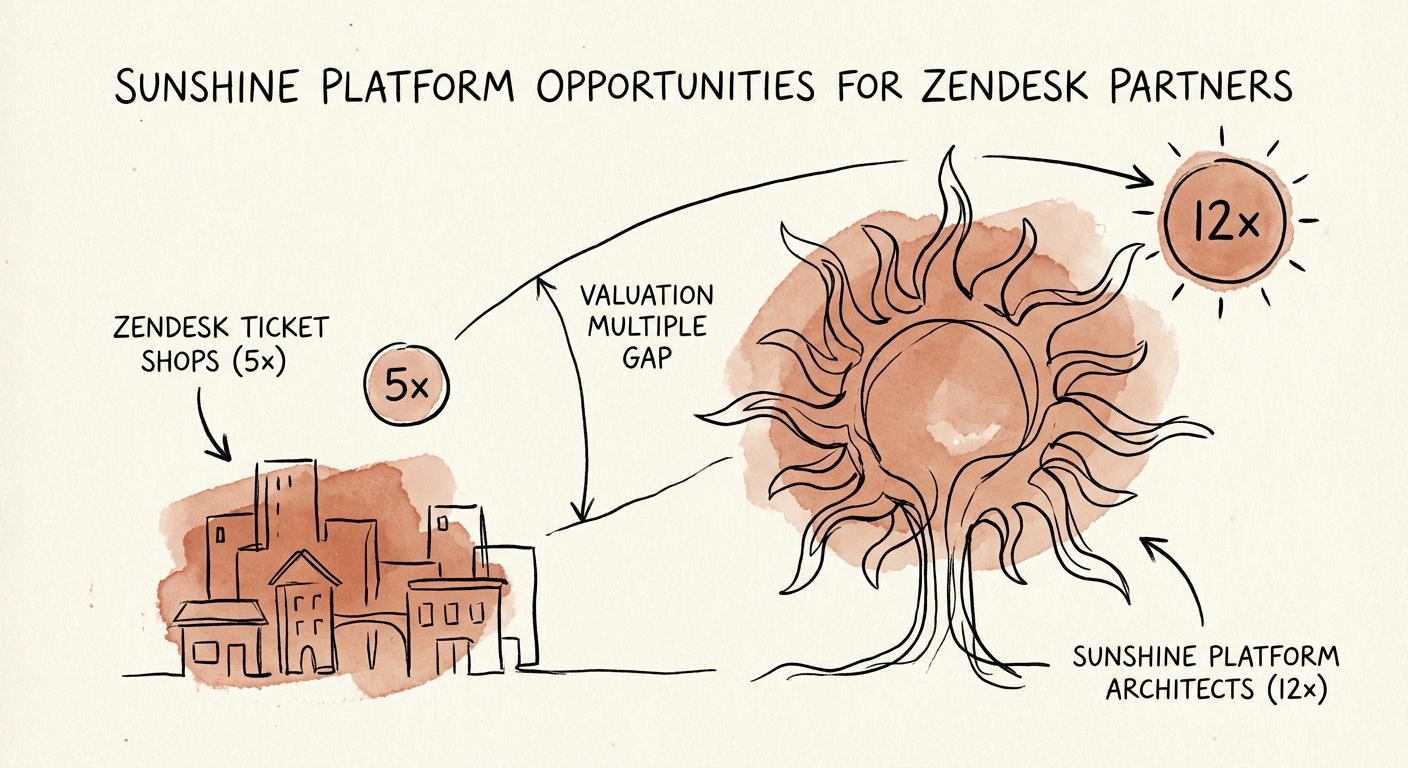
BRIEF · GTM EXECUTION
The Sunshine Premium: Why "Ticket Shops" Stall at 5x and Platform Partners Command 12x
Are you a Zendesk 'Ticket Shop' trading at 5x or a 'Resolution Architect' commanding 12x? Learn how to leverage Sunshine and AI Agents to build premium valuation.
12x EBITDA Valuation Target
BRIEF · EXIT READINESS
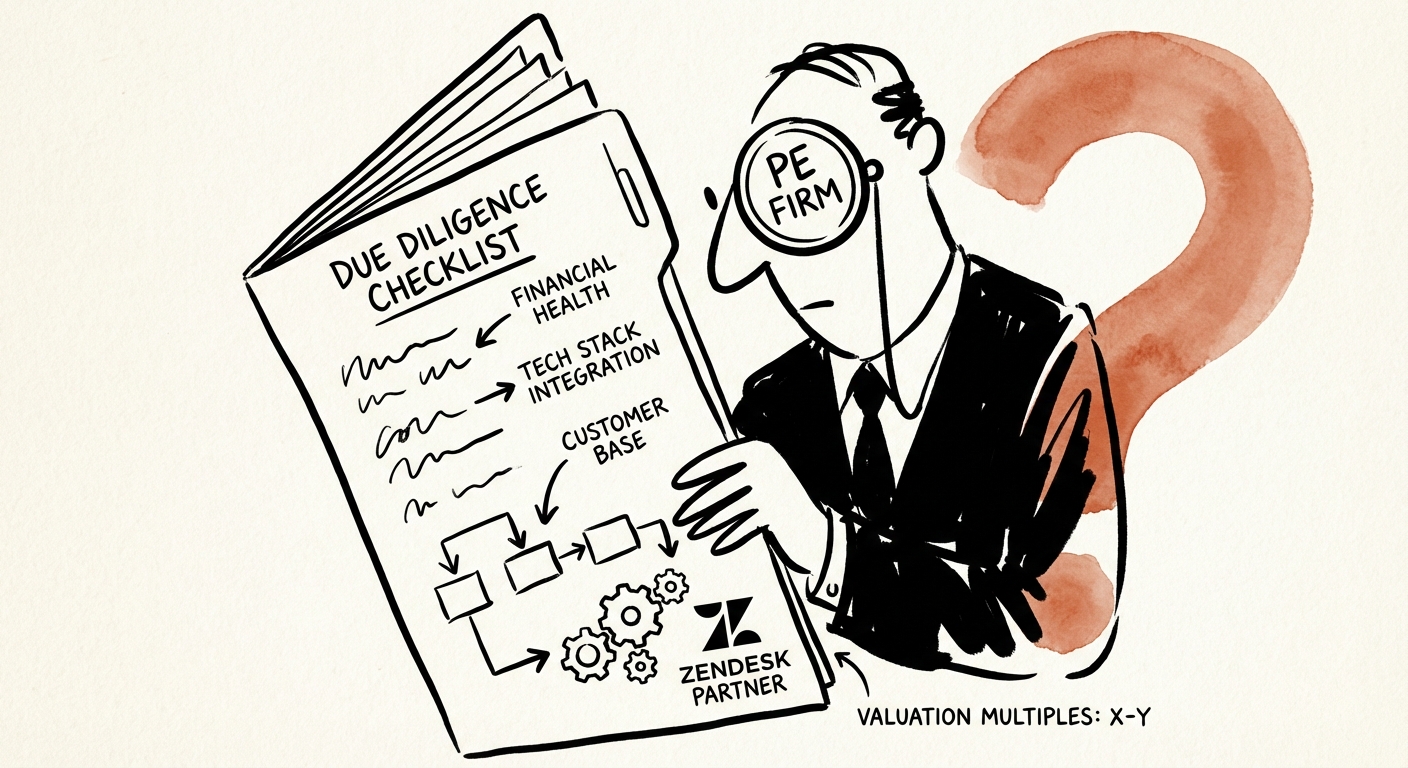
How PE Firms Evaluate Zendesk Partner Acquisitions: The 2026 Diagnostic
Private Equity buyers are bifurcating Zendesk partners into 5x 'Ticket Mechanics' and 12x 'CX Architects.' Here is the due diligence framework used to value your firm.
115% Net Revenue Retention (NRR) Threshold for Premium Multiples
BRIEF · COMPLIANCE & SECURITY
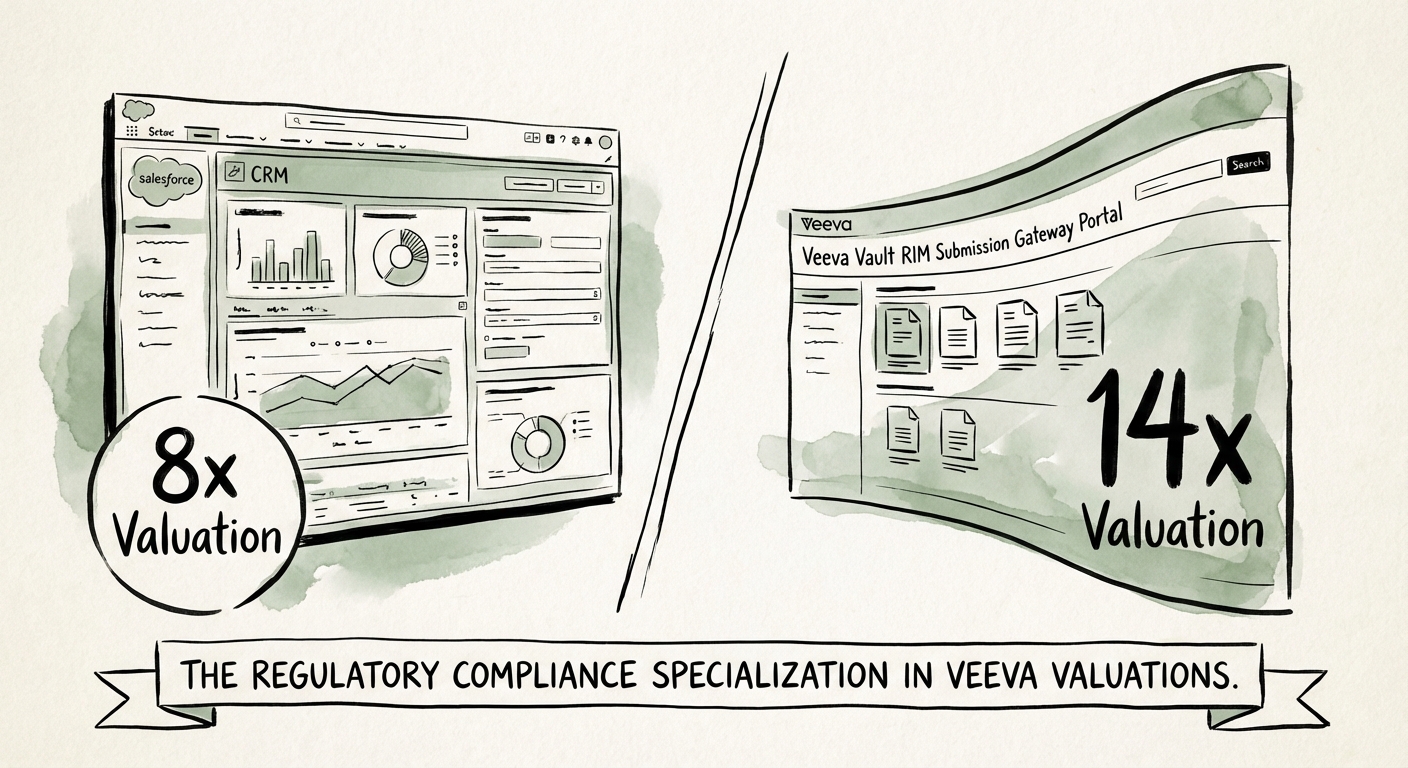
The Regulatory Compliance Premium: Why Veeva Partners with 'RIM' DNA Trade at 14x
Why Veeva Vault RIM specialists trade at 14x EBITDA while Commercial CRM generalists stall at 8x. A valuation diagnostic for PE investors in life sciences IT.
6.5x Valuation Turn Spread (RIM vs. CRM)
BRIEF · EXIT READINESS
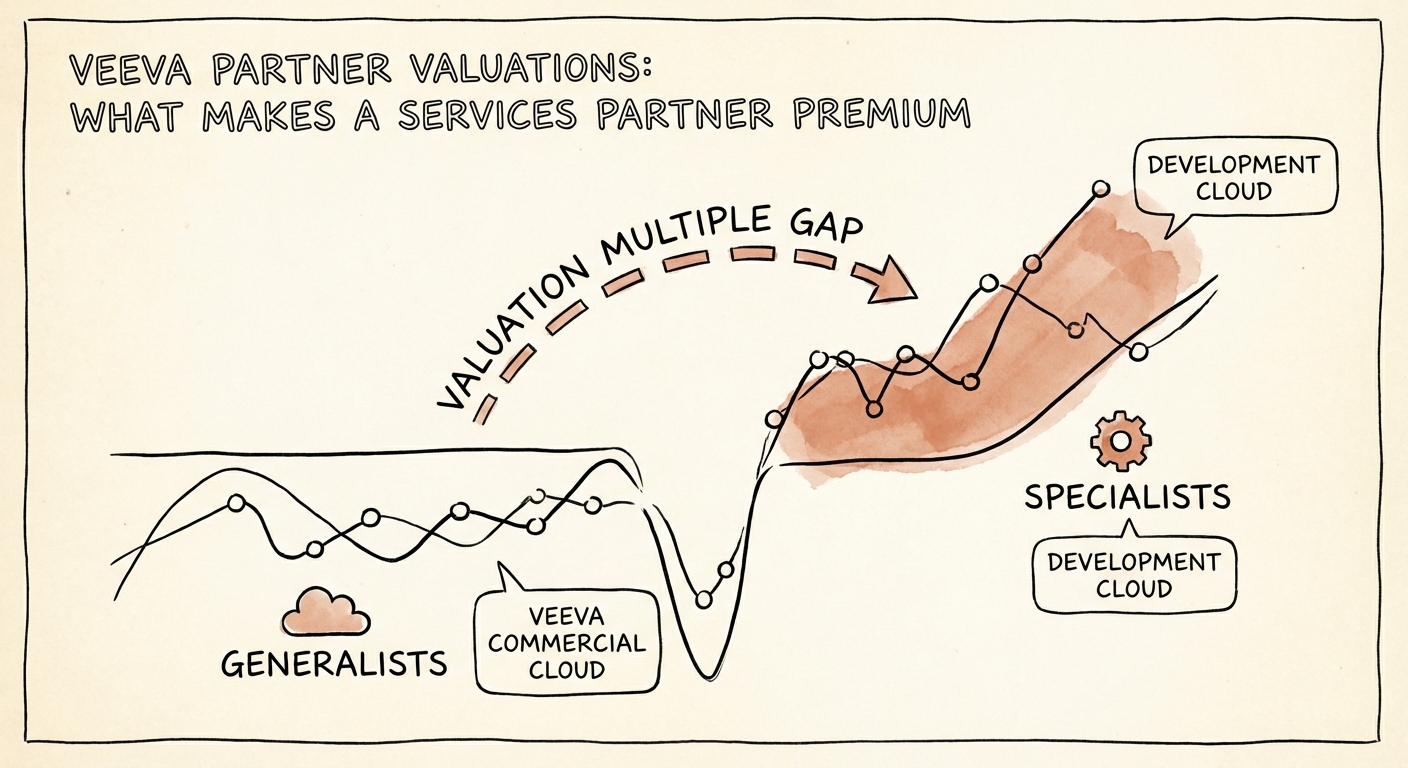
Veeva Partner Valuations: The Gap Between 'CRM Generalists' and 'R&D Specialists'
Veeva services partners are bifurcating. Why 'Development Cloud' specialists command 14x multiples while 'Commercial' shops stall at 8x. PE exit readiness guide.
12.8x Median PE Entry Multiple
BRIEF · EXIT READINESS
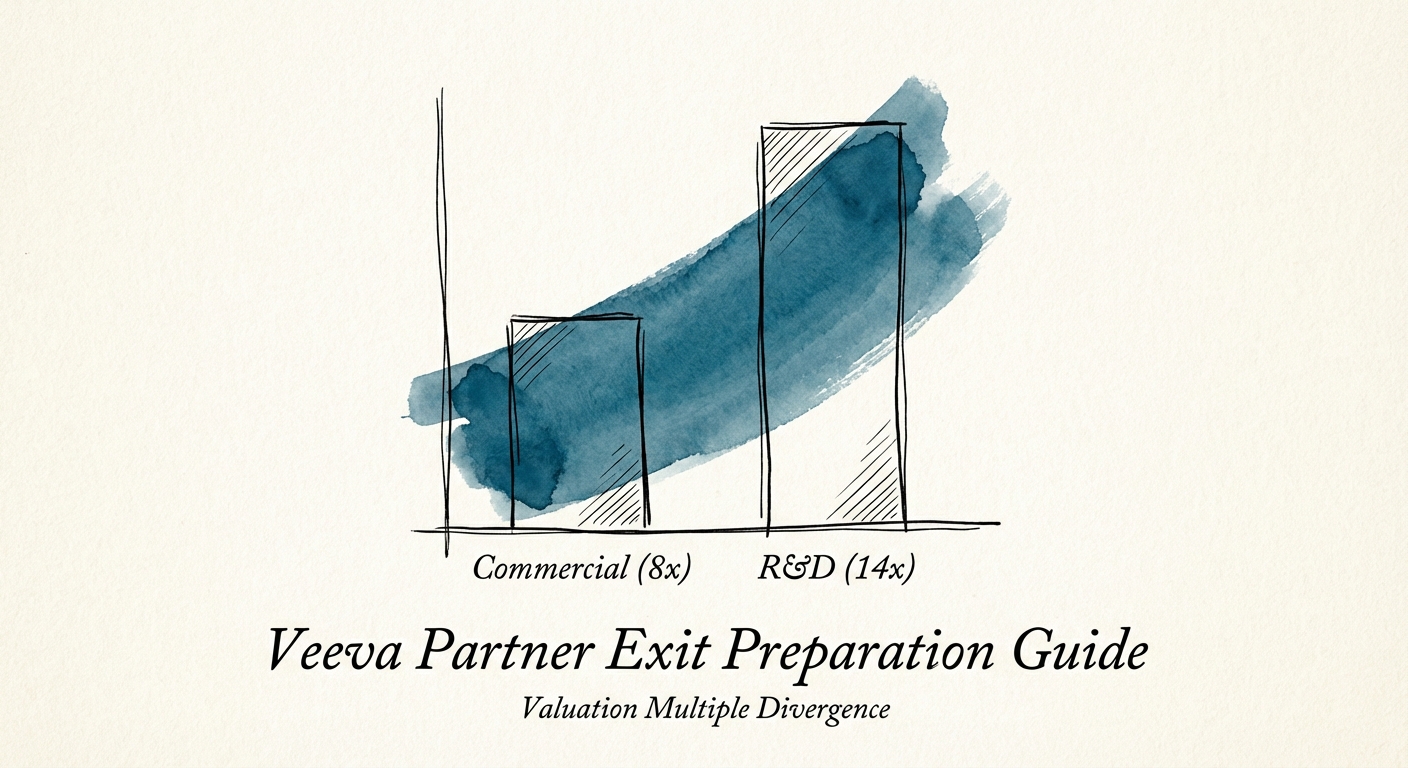
The Veeva Partner Valuation Gap: Why 'Commercial' Shops Trade at 8x and 'Vault R&D' Firms Command 14x
Veeva partners face a historic valuation gap. Why Vault R&D specialists trade at 14x while Commercial CRM generalists stall at 8x. The 2026 exit guide.
14x EBITDA Multiple
BRIEF · PROCESS DOCUMENTATION
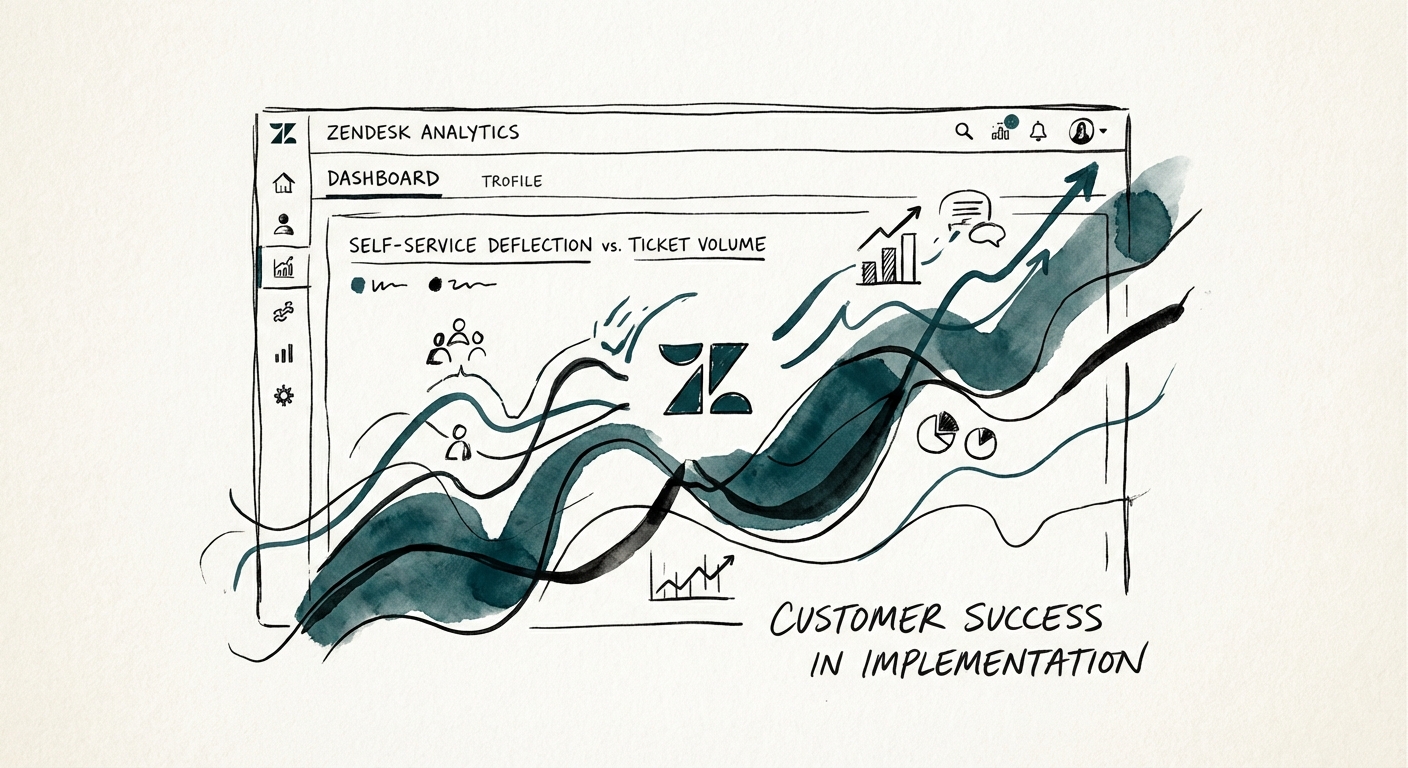
The 'Ticket Factory' Trap: Why Your Zendesk Implementation Is Bleeding Margins
Why 55% of Zendesk implementations fail to scale. A diagnostic guide for PE operating partners and founders on measuring true CX efficiency beyond 'ticket closing'.
15% Self-Service Deflection Rate (Danger Zone)
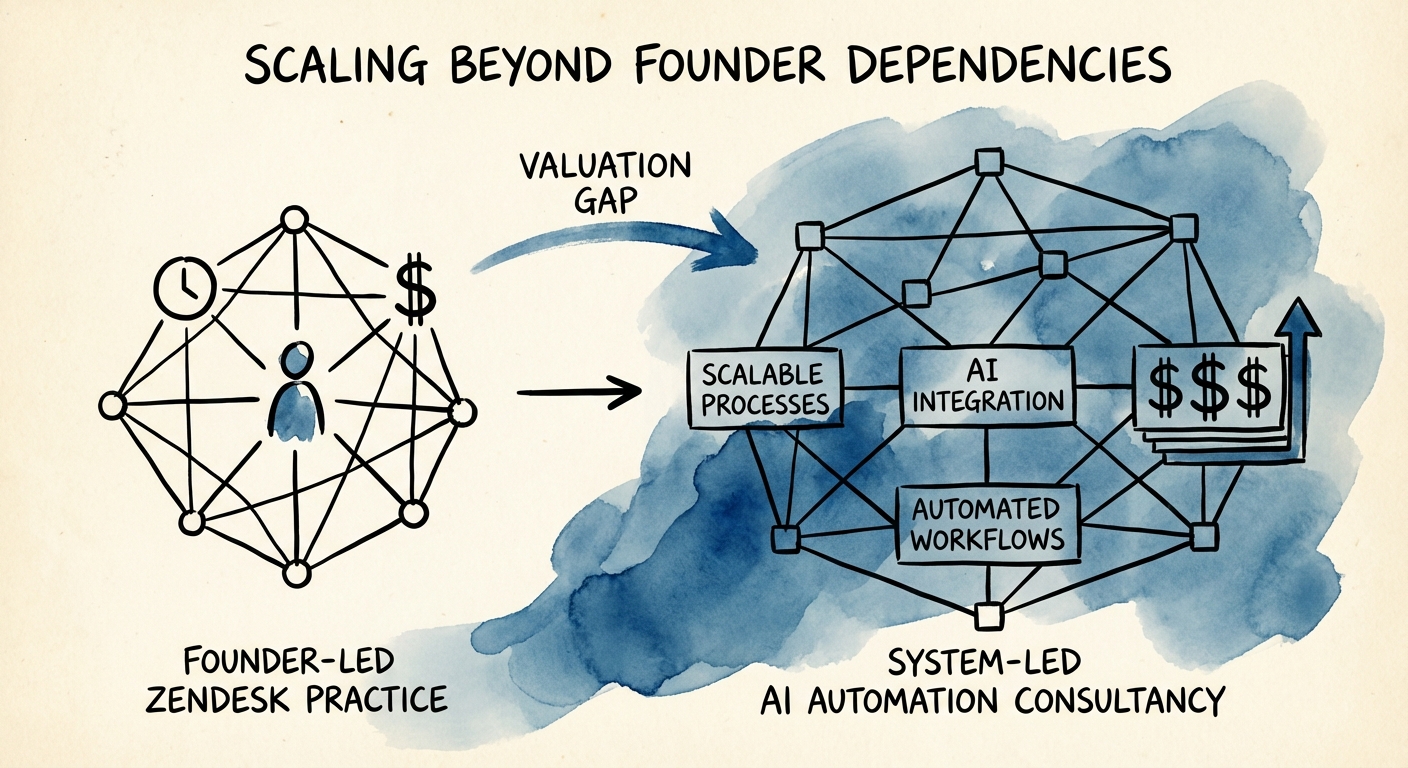
BRIEF · FOUNDER EXTRACTION
The 'Hero Architect' Trap: Why Zendesk Partners Stall at $5M (And How to Fix It)
Why Zendesk partners stall at $5M, the 'Hero Architect' trap, and how to pivot to 'Agentic AI' services to command a 12x exit multiple.
50% Valuation Haircut for Key Person Risk
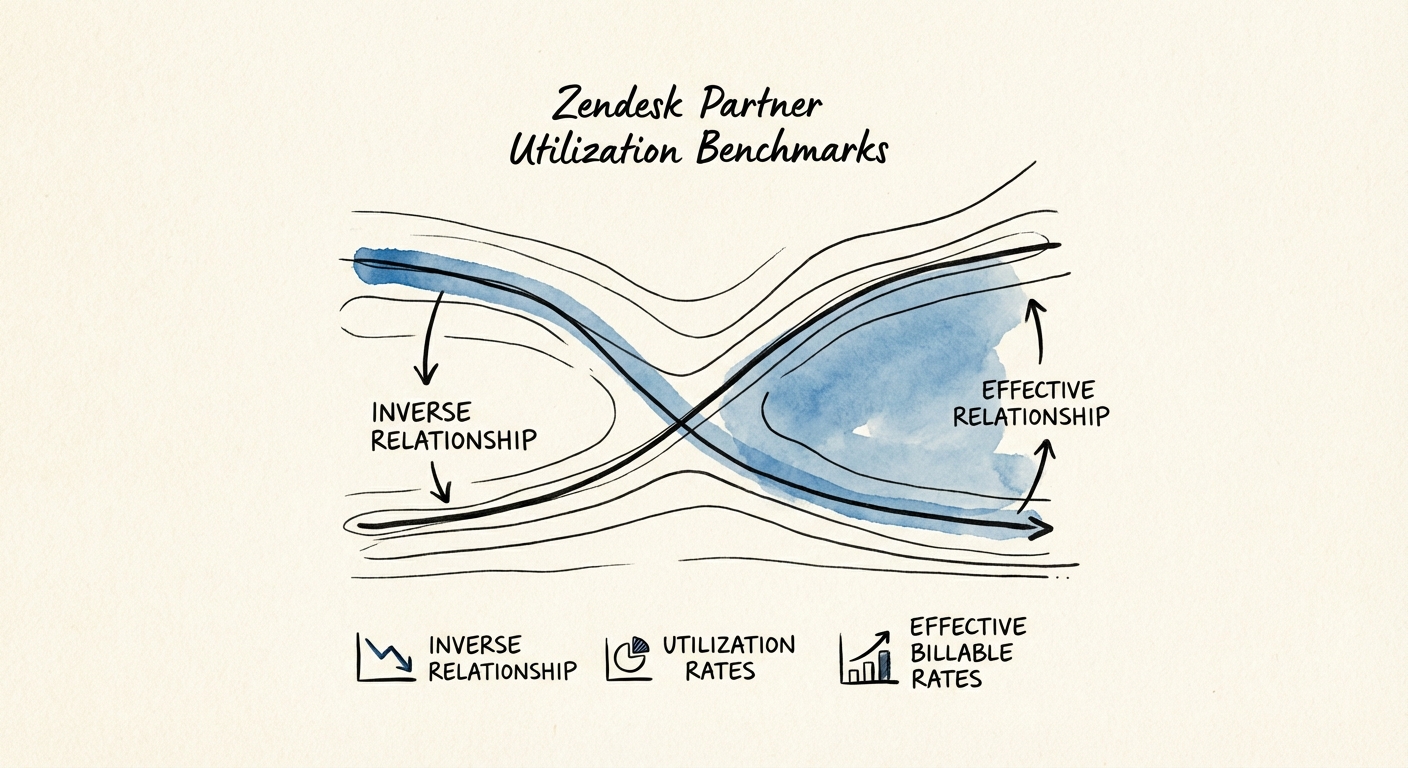
BRIEF · UNIT ECONOMICS
Zendesk Partner Utilization Benchmarks: Why 85% Is a Trap (And the 72% Reality for Premier Partners)
Why 85% utilization kills Zendesk partner margins. New 2026 benchmarks for Premier and Select partners, AI impact on billable hours, and the unit economics of CX consultancies.
72% Optimal Billable Utilization
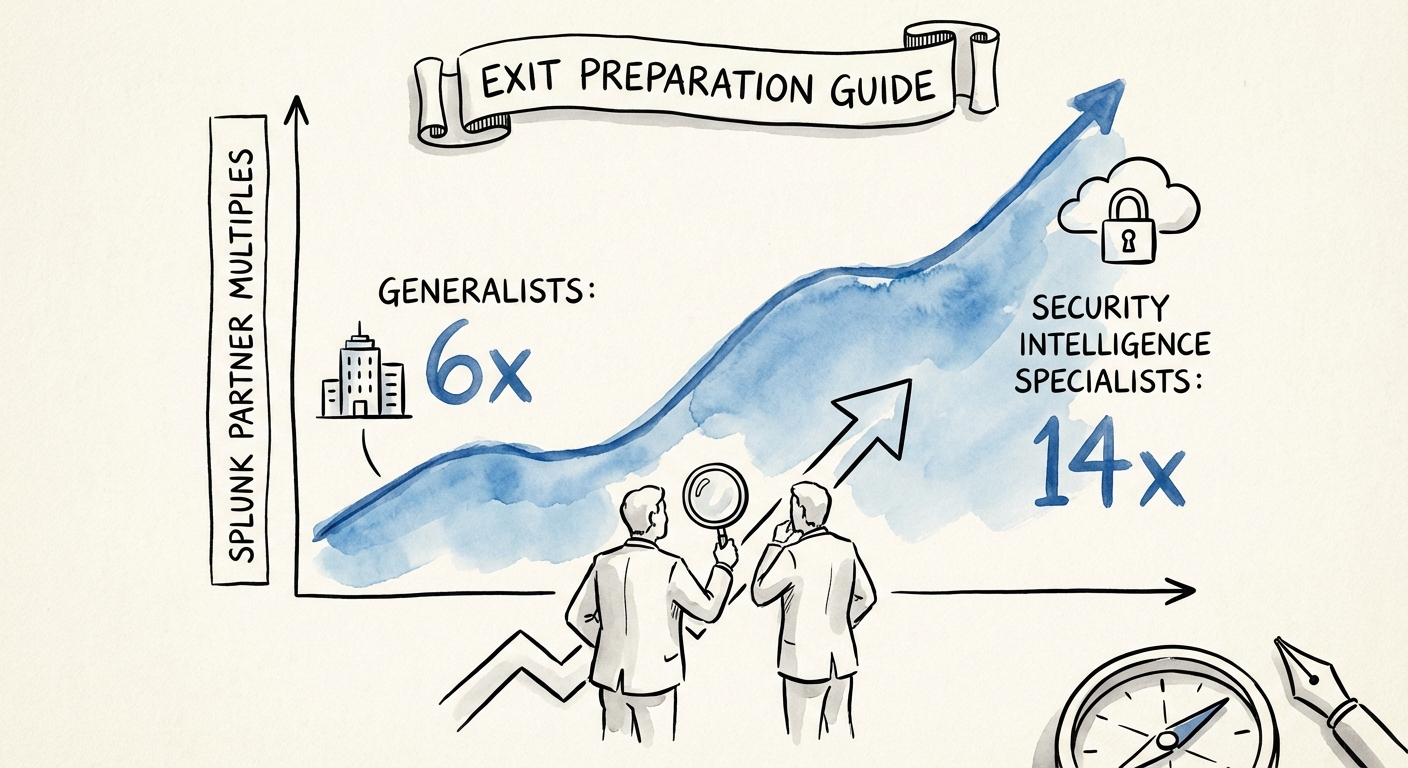
BRIEF · EXIT READINESS
Splunk Partner Exit Preparation: The Gap Between 6x and 14x Multiples (2026 Guide)
In 2026, Splunk partners face a bifurcated market. Learn why 'Log Collectors' stall at 6x EBITDA while 'Security Intelligence' firms command 14x multiples.
14x EBITDA Security Intelligence Premium
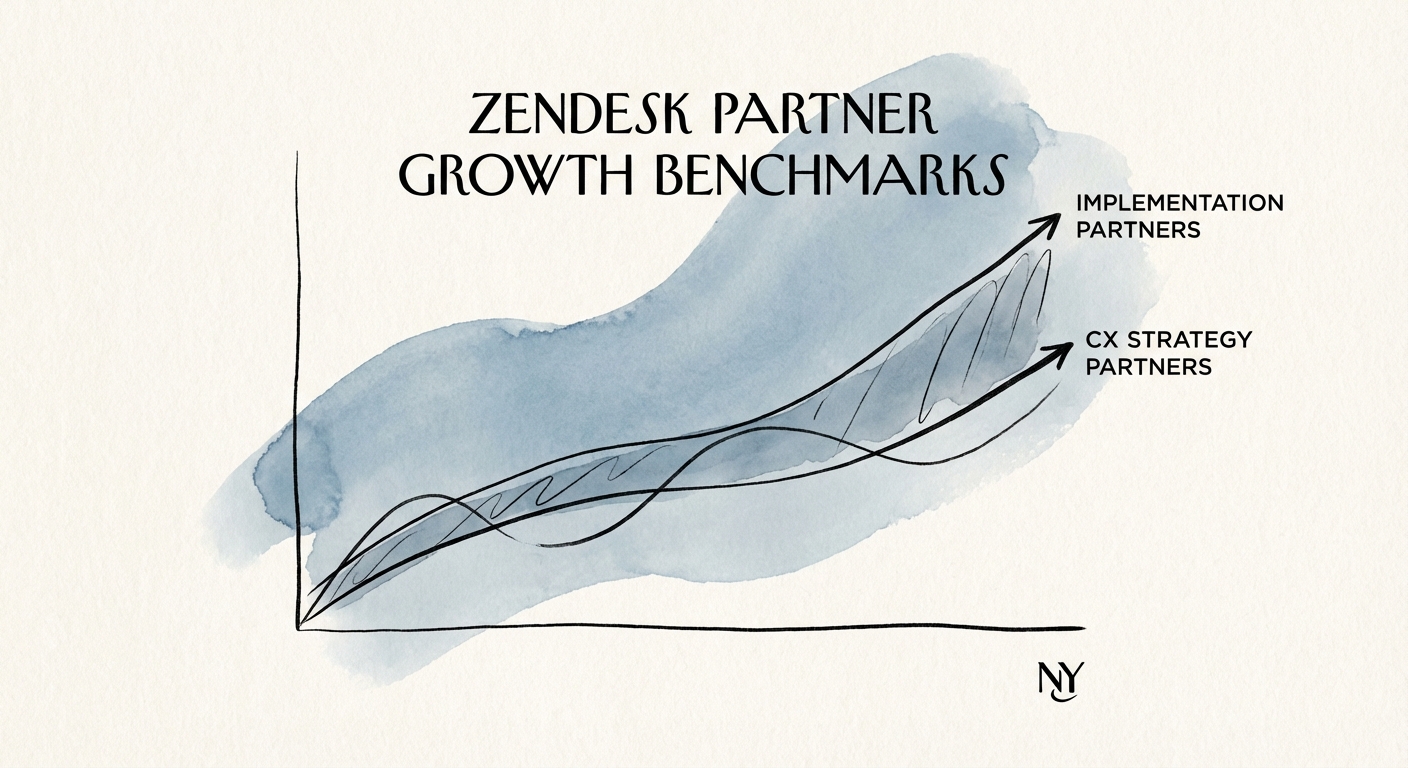
BRIEF · EXIT READINESS
Zendesk Partner Growth Benchmarks: Why "Ticket Shops" Stall at $10M (And CX Strategists Exit at 12x)
Analysis of Zendesk partner growth milestones, valuation multiples, and the 'CX Premium' that drives 12x exits in 2026. A diagnostic for founders.
12x EBITDA Valuation Premium for AI-Enabled CX Partners