BRIEF · GTM EXECUTION
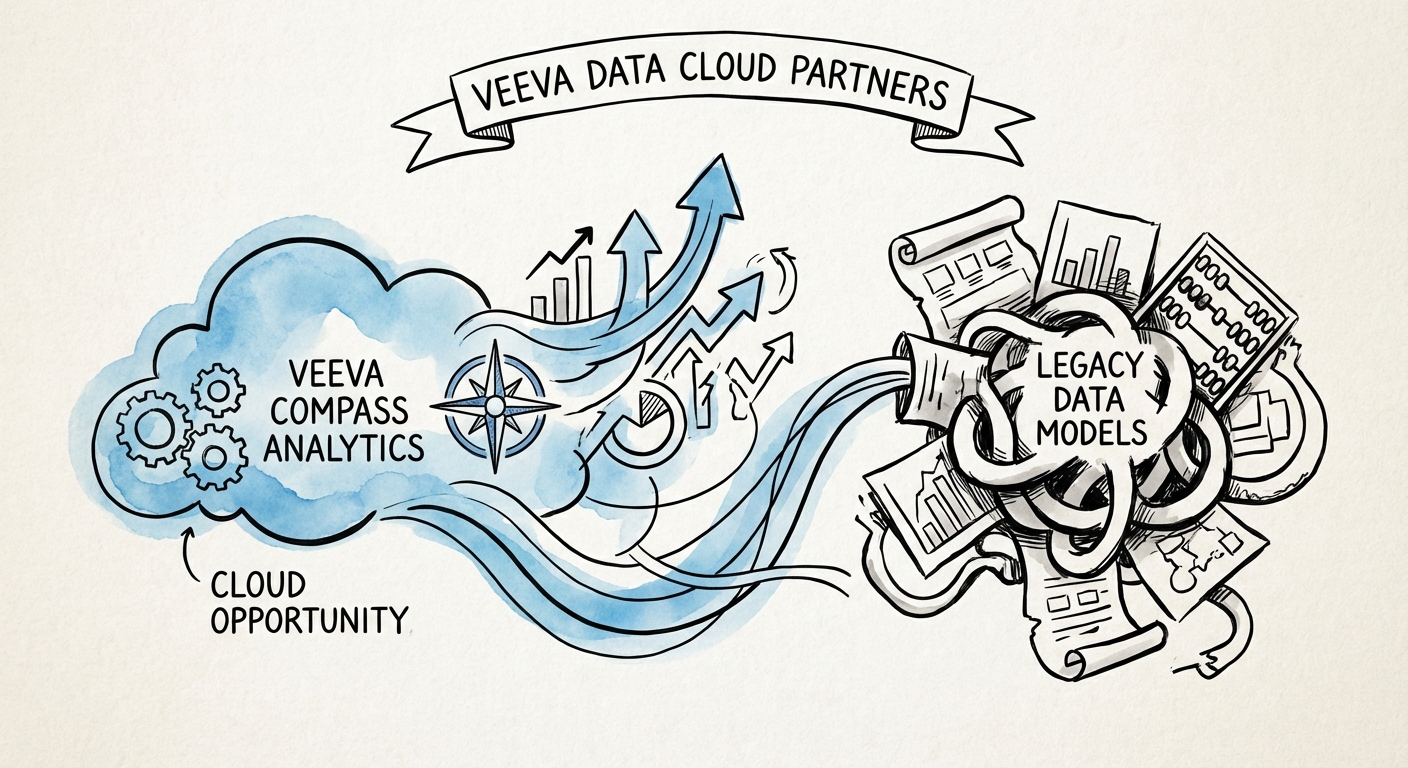
The Commercial Data Pivot: Why Veeva Partners Must Trade 'Vault Migrations' for 'Intelligence IP'
Veeva partners are trapped in the Vault CRM migration. The real exit value lies in Veeva Data Cloud (Link, Compass). Here is the diagnostic and valuation playbook.
14x EBITDA Multiple for Data Services
BRIEF · UNIT ECONOMICS
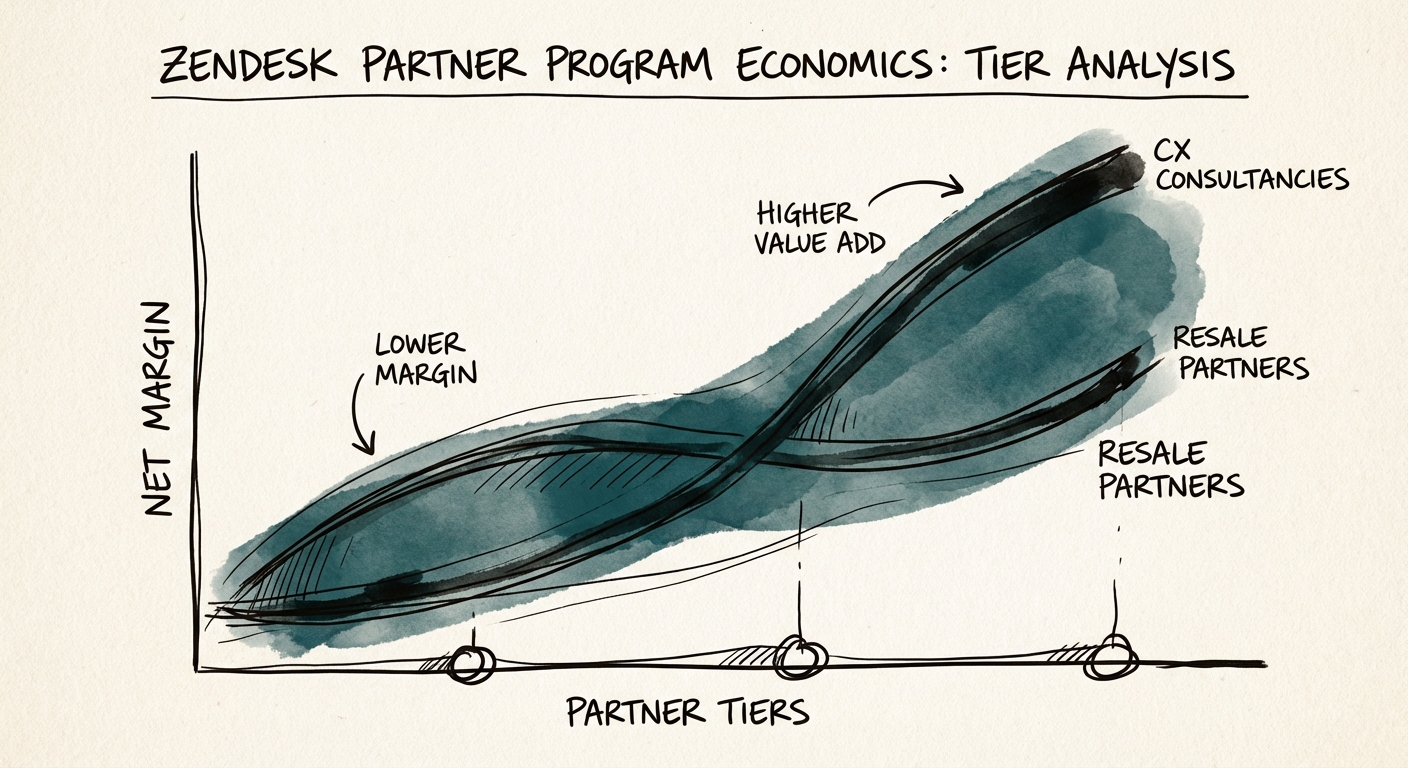
Zendesk Partner Program Economics: Why 'Premier' Status Might Be Killing Your Margins
A diagnostic guide for PE sponsors and founders on Zendesk partner program economics. Analysis of margins, tier requirements, and the valuation gap between resellers and CX consultancies.
4.5x Service Revenue Multiplier
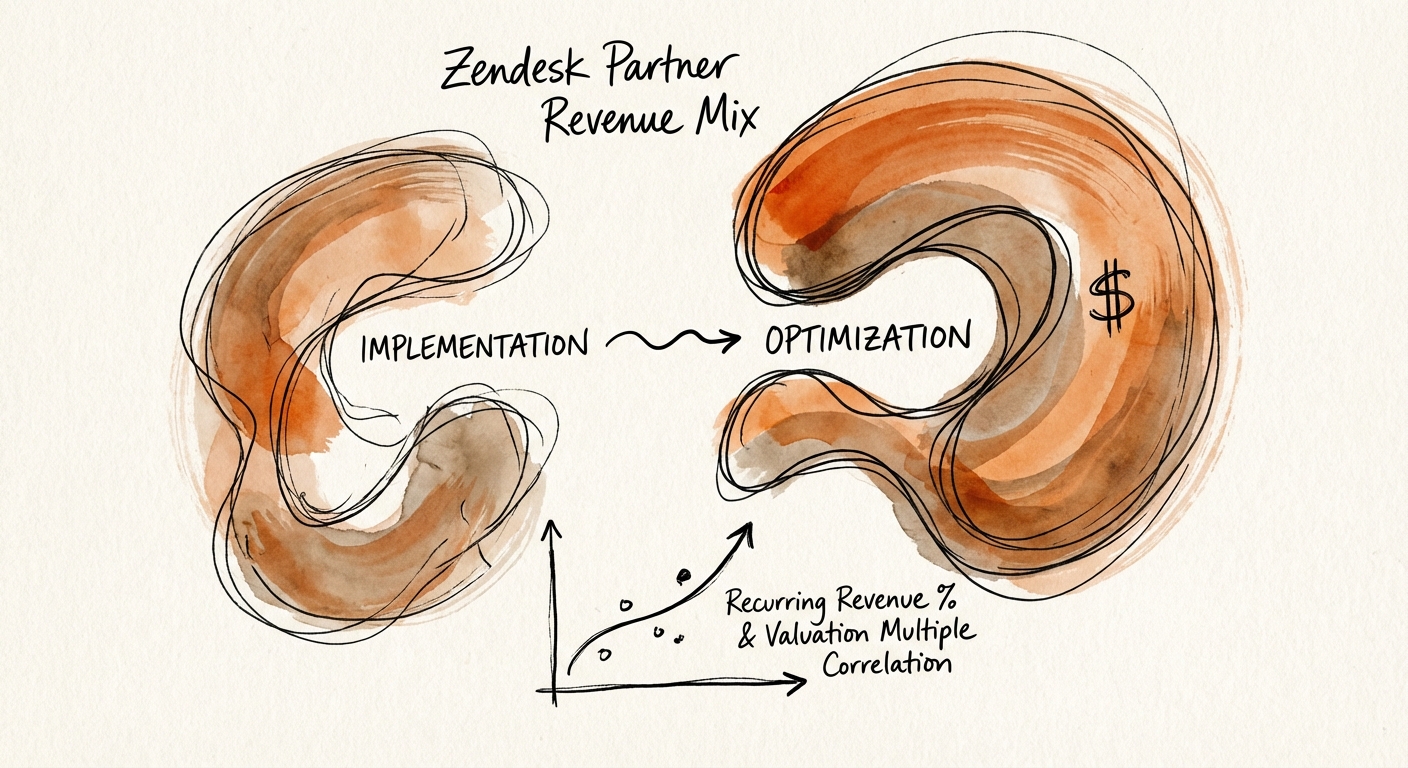
BRIEF · UNIT ECONOMICS
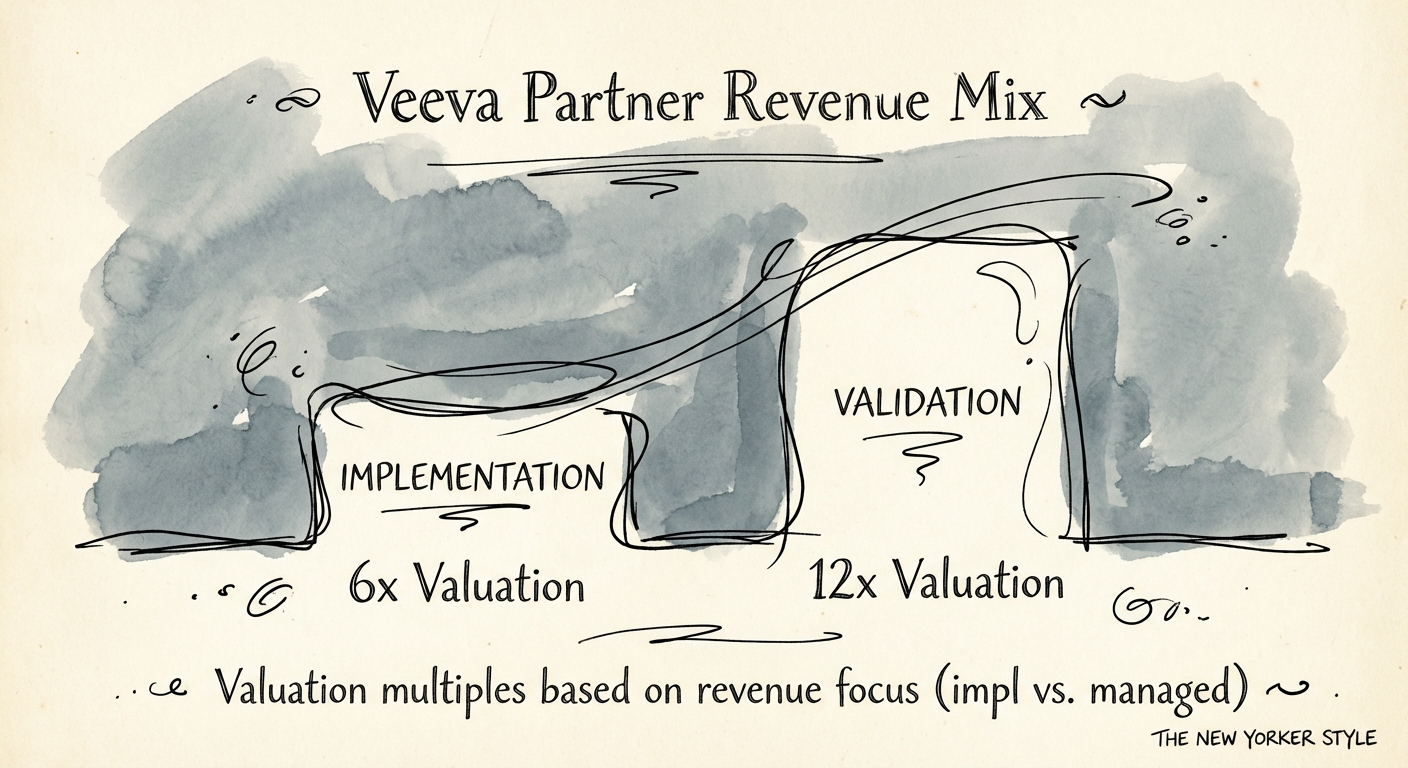
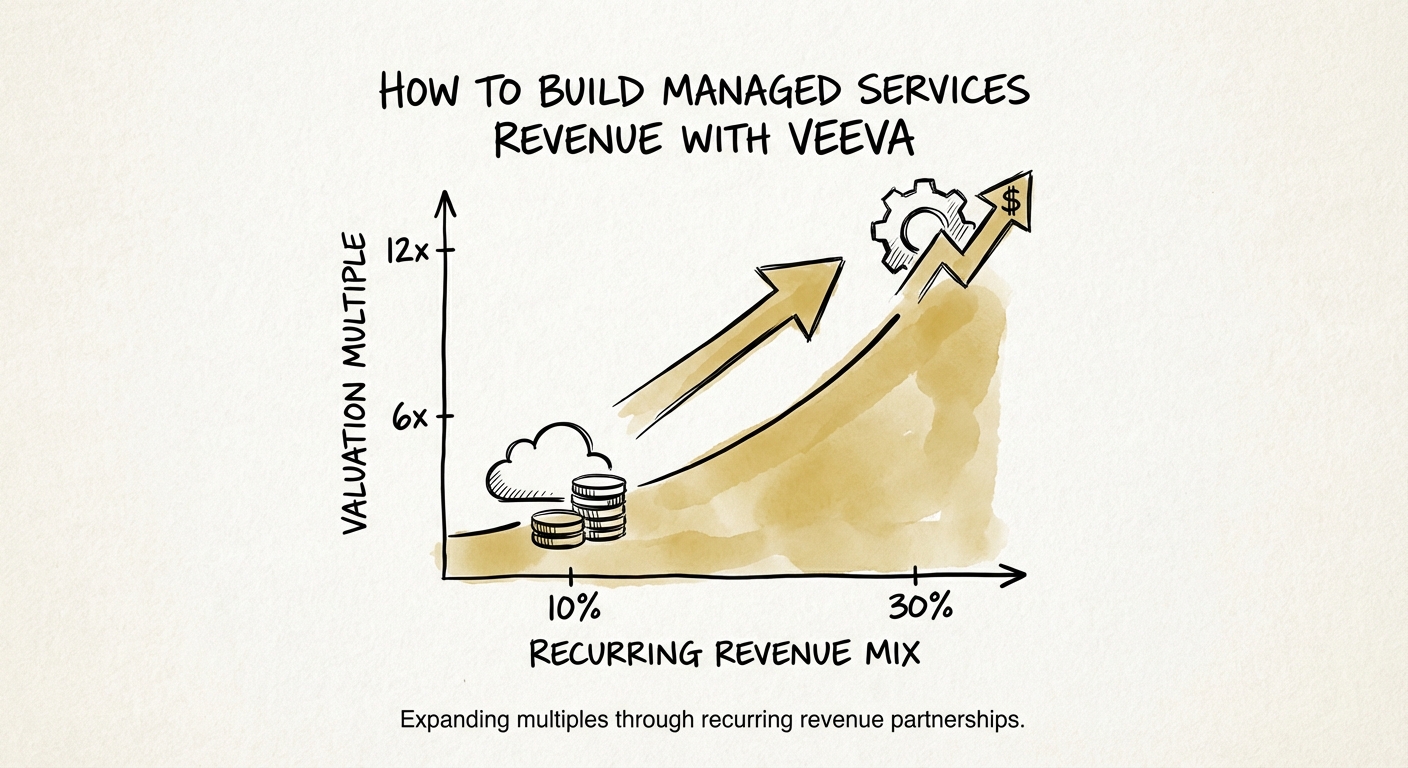
The Veeva Partner Revenue Mix: Why 'Validation' Shops Trade at 6x and 'Commercial Strategists' Command 12x
Why Veeva partners focused on implementation trade at 6x EBITDA while managed validation firms command 12x. A revenue mix diagnostic for PE sponsors.
45% Target Managed Services %
BRIEF · EXIT READINESS
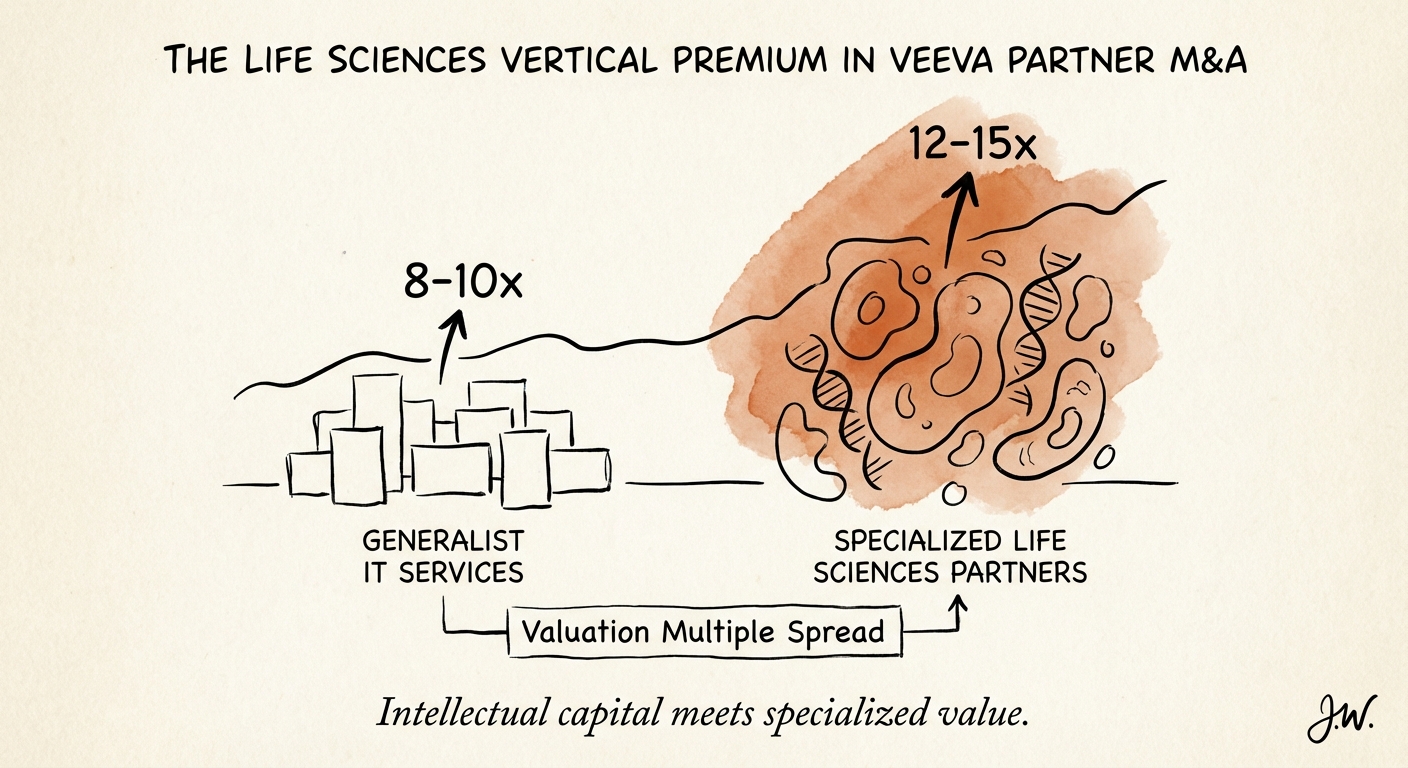
The Life Sciences Vertical Premium: Why Veeva Partners with 'Clinical DNA' Trade at 14x
Generalist IT firms trade at 8x, but Veeva partners with R&D expertise command 14x. Here is the data behind the Life Sciences vertical premium in 2026.
14x EBITDA Multiple for Vault R&D Specialists
BRIEF · REVENUE ARCHITECTURE
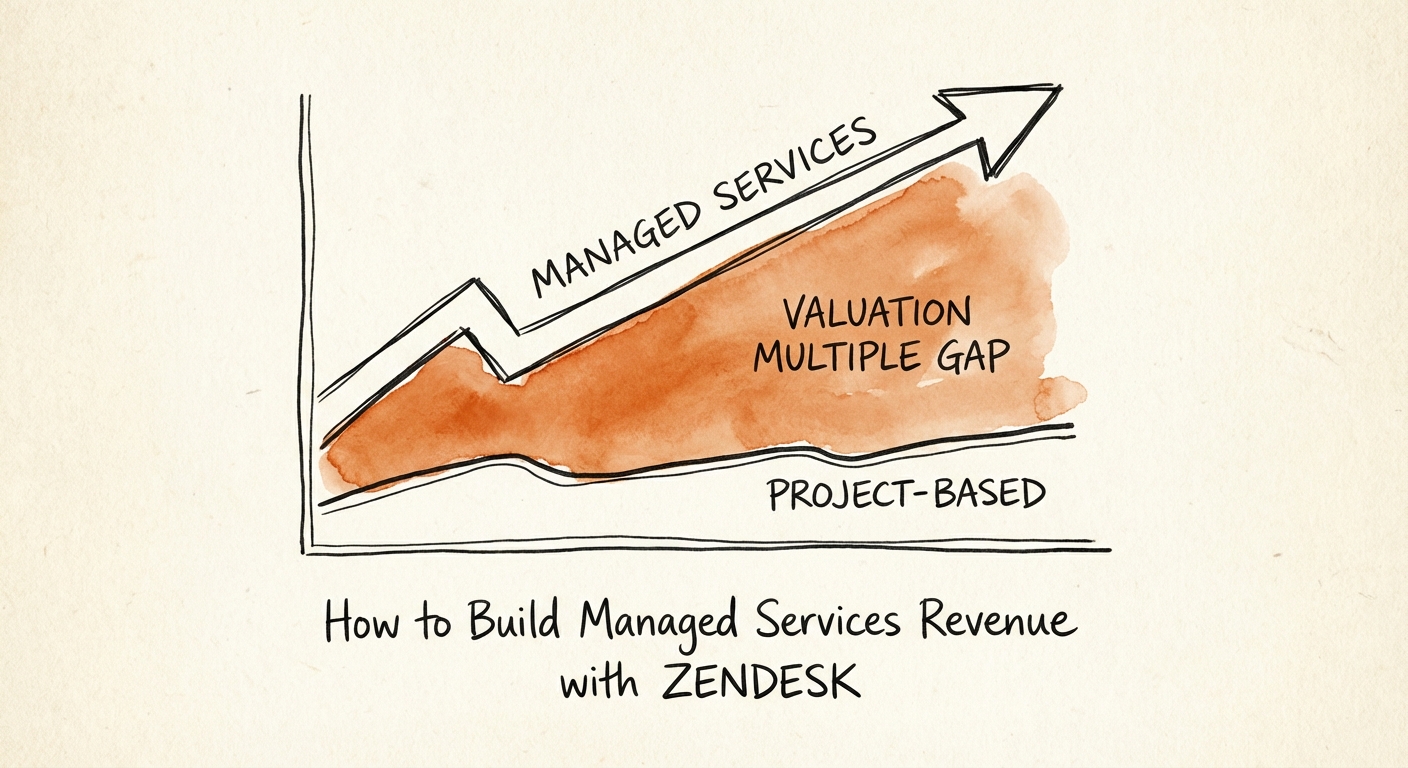
How to Build Managed Services Revenue with Zendesk: The 'CXaaS' Pivot
Zendesk partners are stuck in a 'rapid deployment' trap. Here is the diagnostic guide to pivoting from project-based revenue to high-margin Managed CX services.
8 Weeks Average Zendesk Deployment Time (The Project Revenue Trap)
BRIEF · FOUNDER EXTRACTION
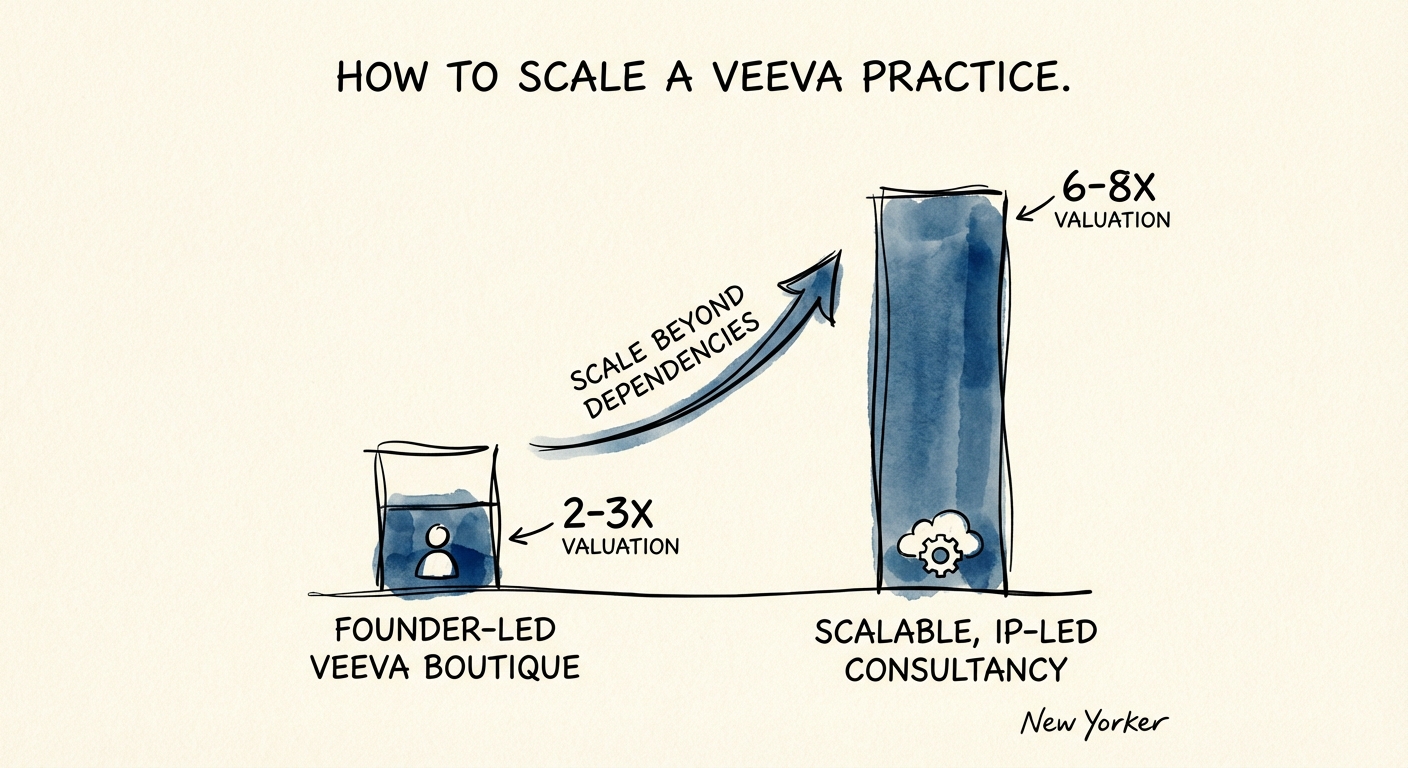
The $10M Ceiling: How to Scale a Veeva Practice Beyond Founder Dependencies
Veeva partners face a $10M ceiling. Learn how to scale beyond founder dependencies, capitalize on the Vault CRM migration, and unlock 12x exit multiples.
12x EBITDA Multiple Target
BRIEF · EXIT READINESS
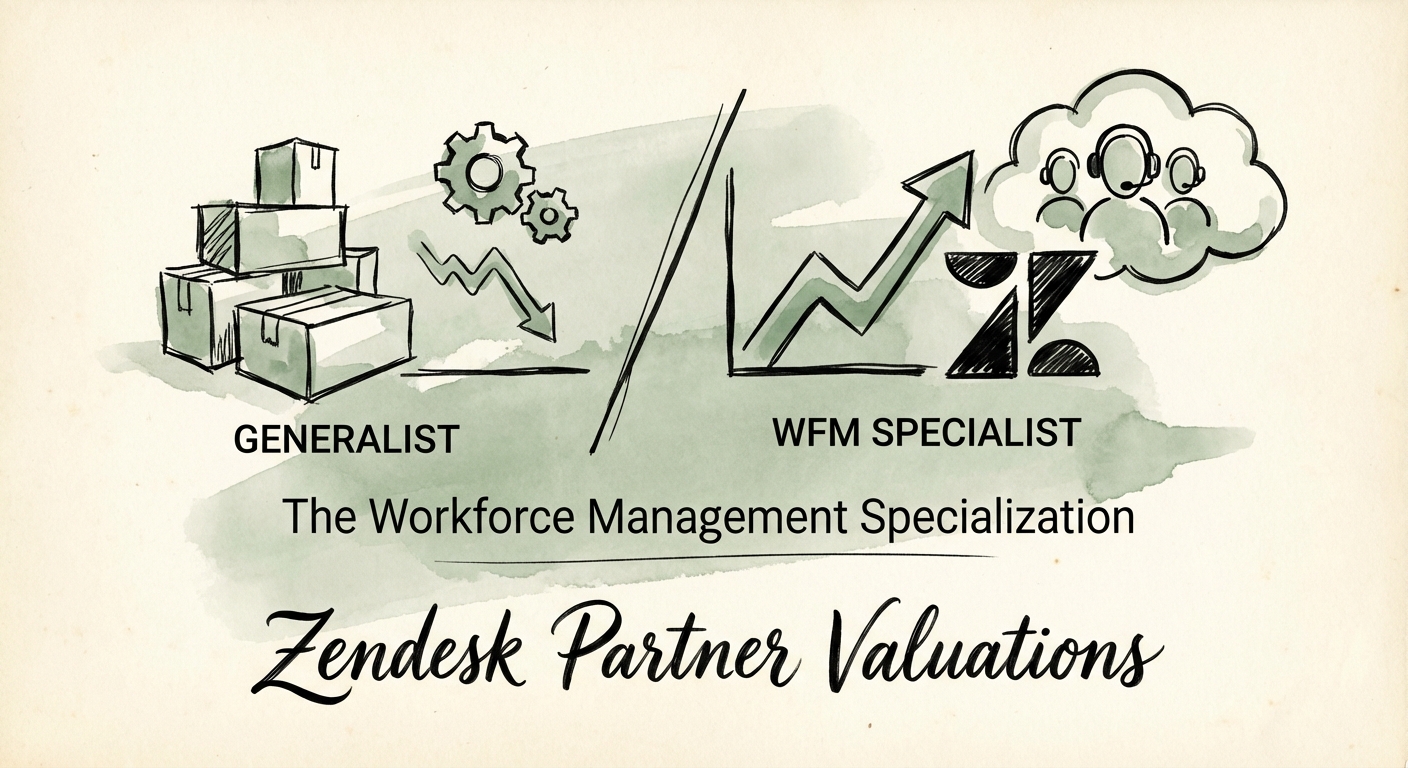
The Workforce Management Premium: Why Zendesk Partners with WFM DNA Trade at 12x (And Generalists Stall at 6x)
Why Zendesk partners with deep Workforce Management (WFM) expertise command 12x EBITDA multiples while generalists stall at 6x. A diagnostic for PE-backed services firms.
12x WFM Specialist EBITDA Multiple
BRIEF · TEAM & HIRING
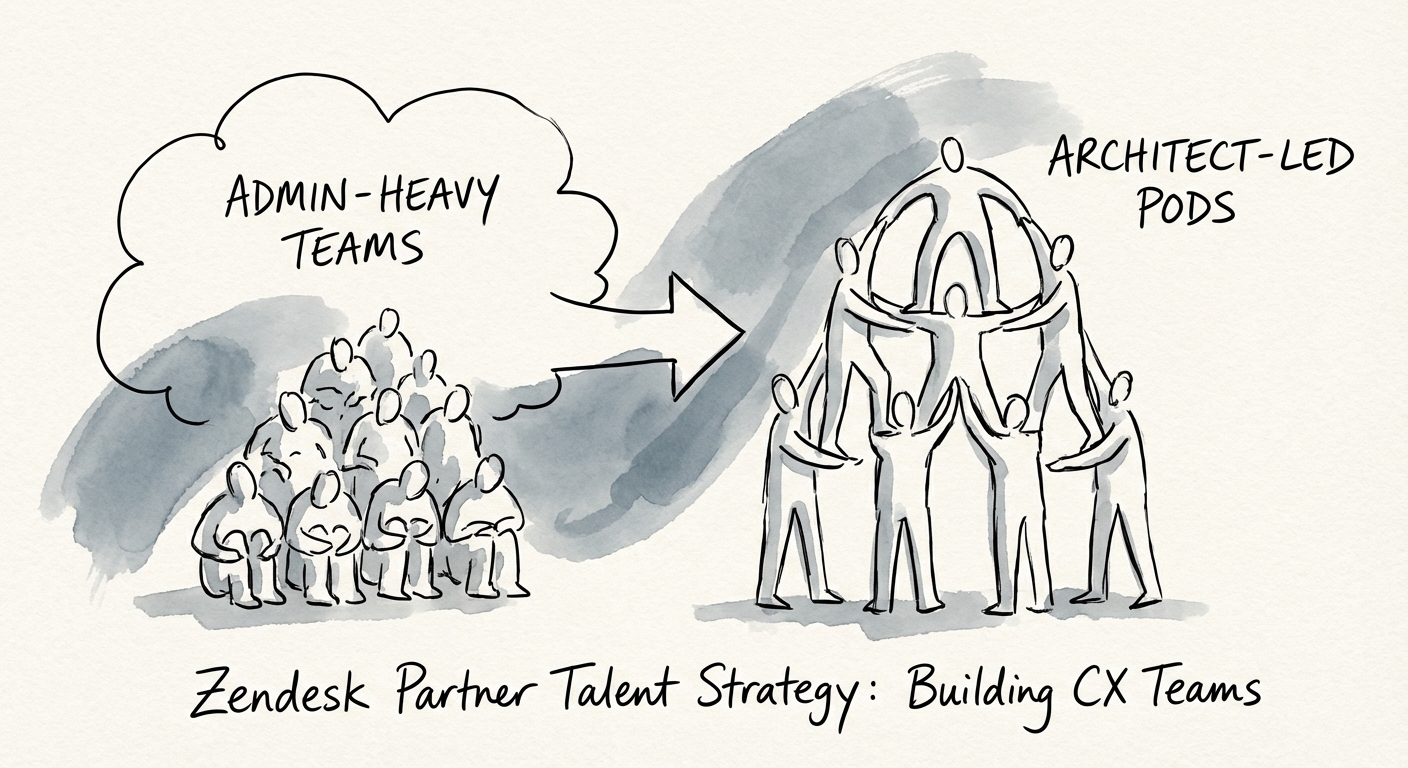
Zendesk Partner Talent Strategy: The 'Support Ticket' Trap That Kills Margins
Stop hiring 'Ticket Takers.' To command premium multiples, Zendesk partners must pivot talent strategy from administration to AI orchestration and CX architecture.
$350/hr Target Billable Rate for CX Architects
BRIEF · EXIT READINESS
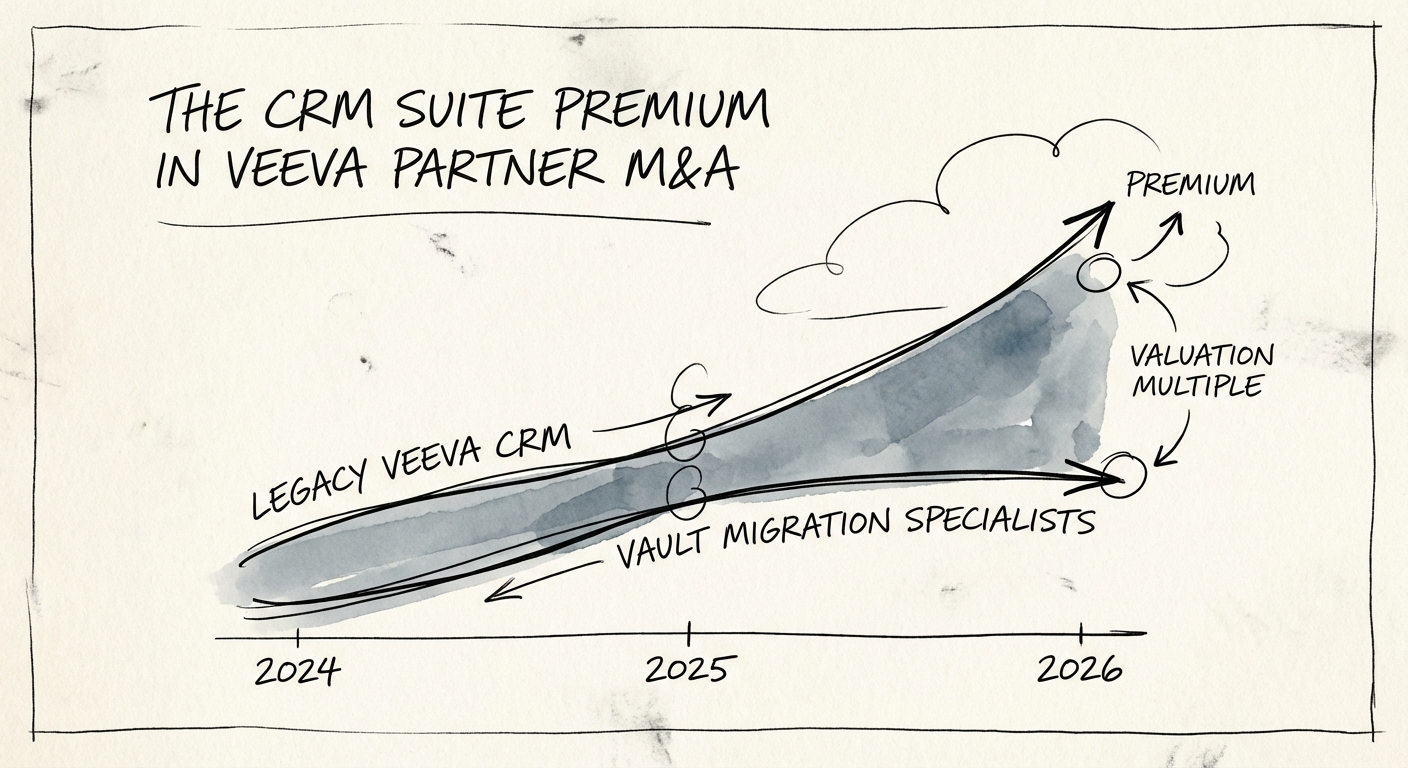
The CRM Suite Premium in Veeva Partner M&A
Veeva partners specializing in Vault CRM migration trade at 14x EBITDA, while legacy Salesforce-based shops stall at 8x. Here is the diagnostic.
14x Specialist Multiple
BRIEF · EXIT READINESS
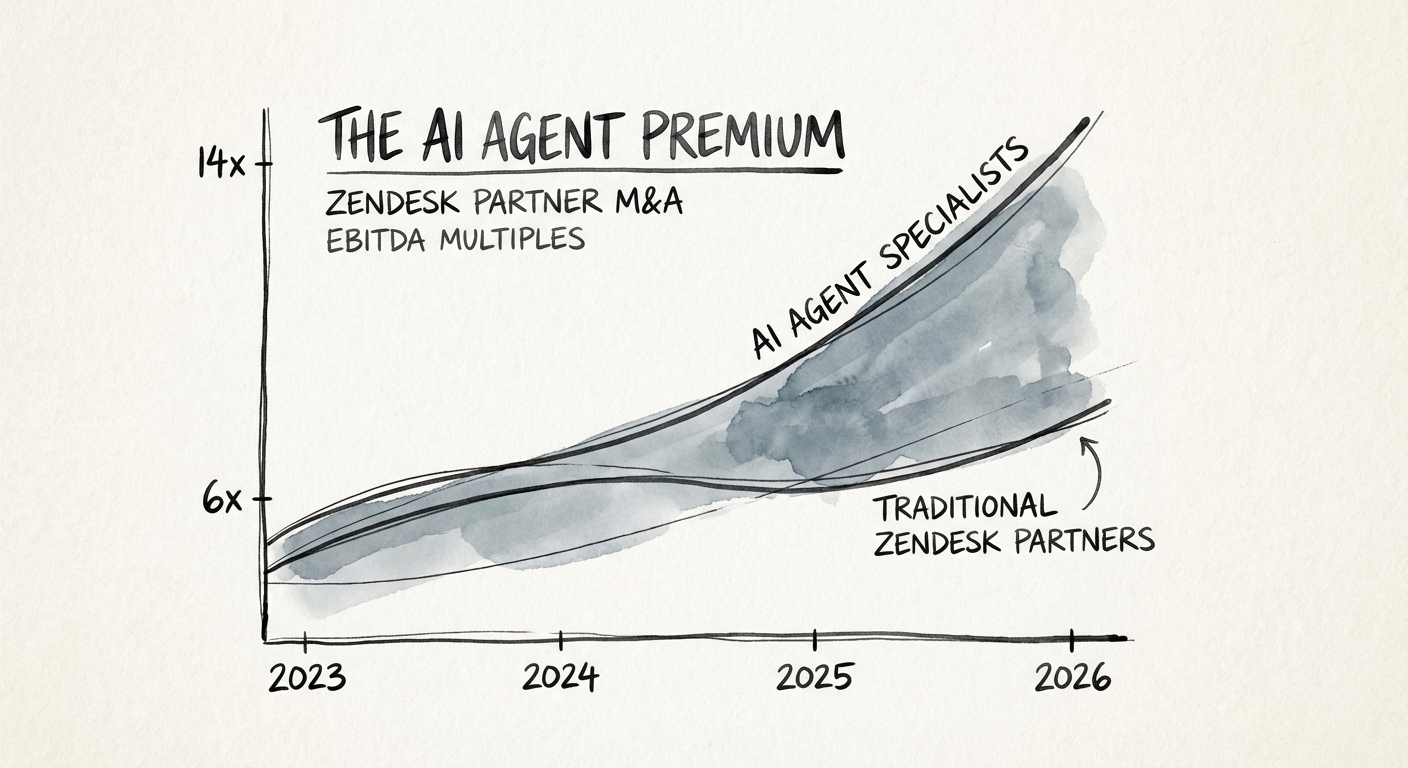
The AI Agent Premium: Why Zendesk Partners Are Bifurcating into 6x 'Implementers' and 14x 'Automators'
Zendesk partners specializing in AI Agents are trading at 14x EBITDA while legacy implementation shops stall at 6x. Here is the diagnostic guide for Portfolio Companies.
14x EBITDA Multiple
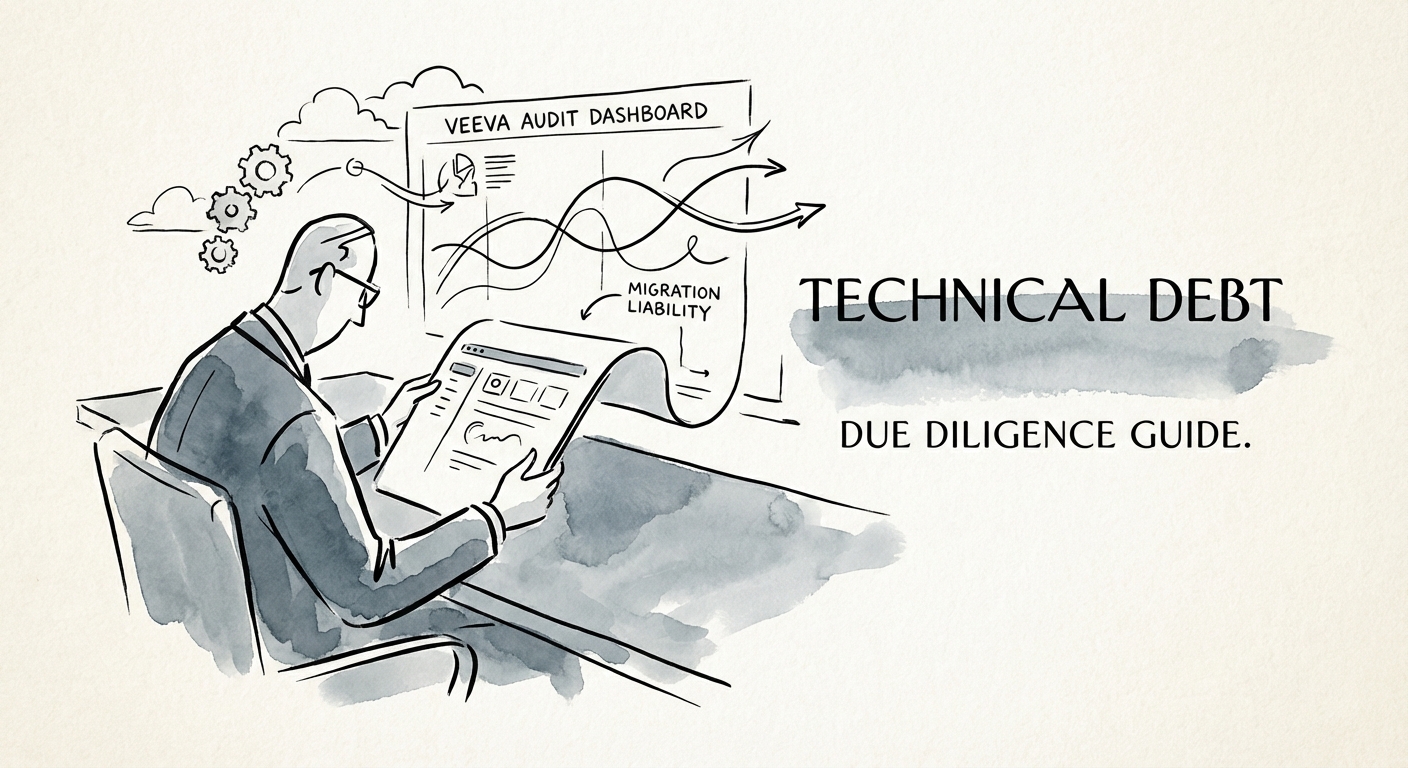
BRIEF · TECHNICAL DEBT
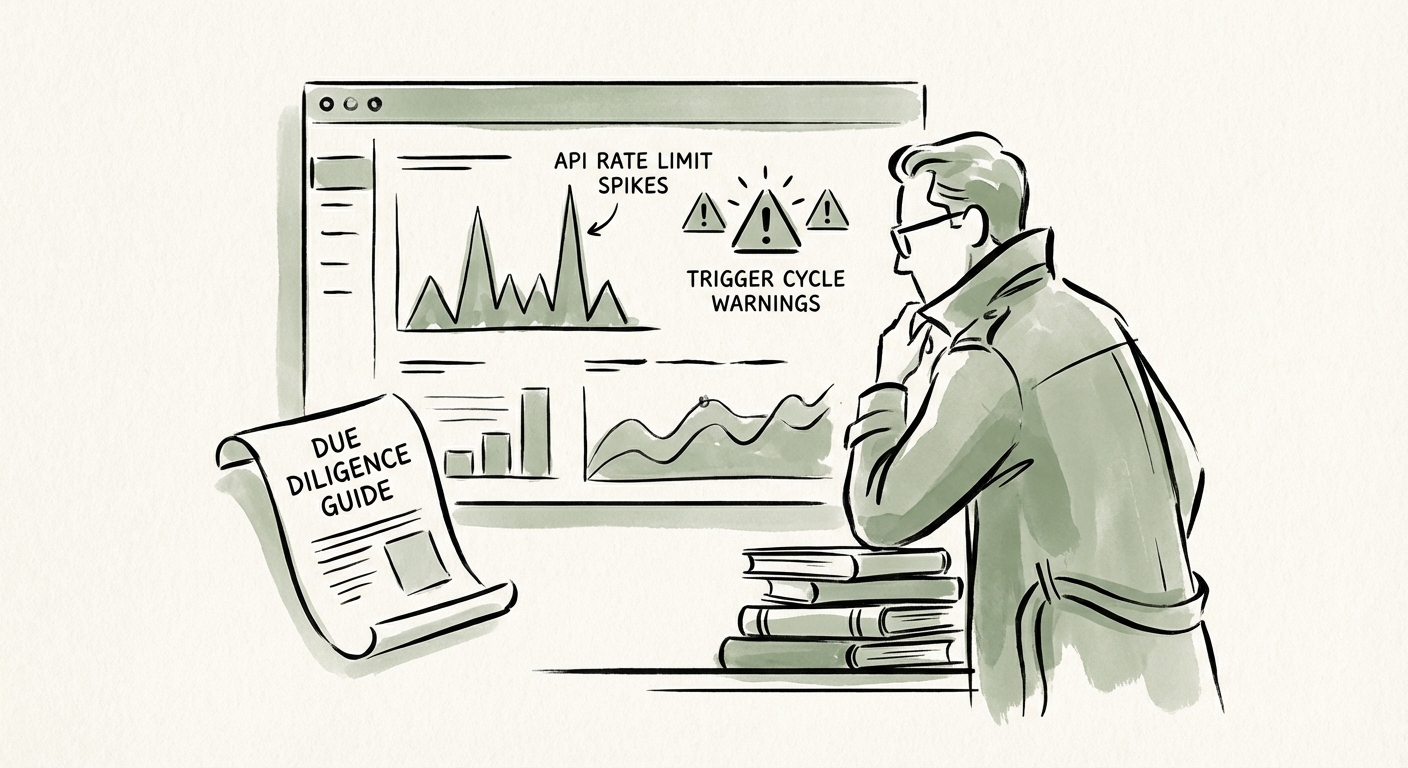
Technical Debt in Zendesk Customizations: The Hidden $1.8M Liability in CX Due Diligence
A highly customized Zendesk instance is a hidden liability. Learn how to audit triggers, private apps, and API debt before you sign the LOI.
$1.8M Avg. Remediation Cost for Series C 'Spaghetti' Instances
BRIEF · UNIT ECONOMICS
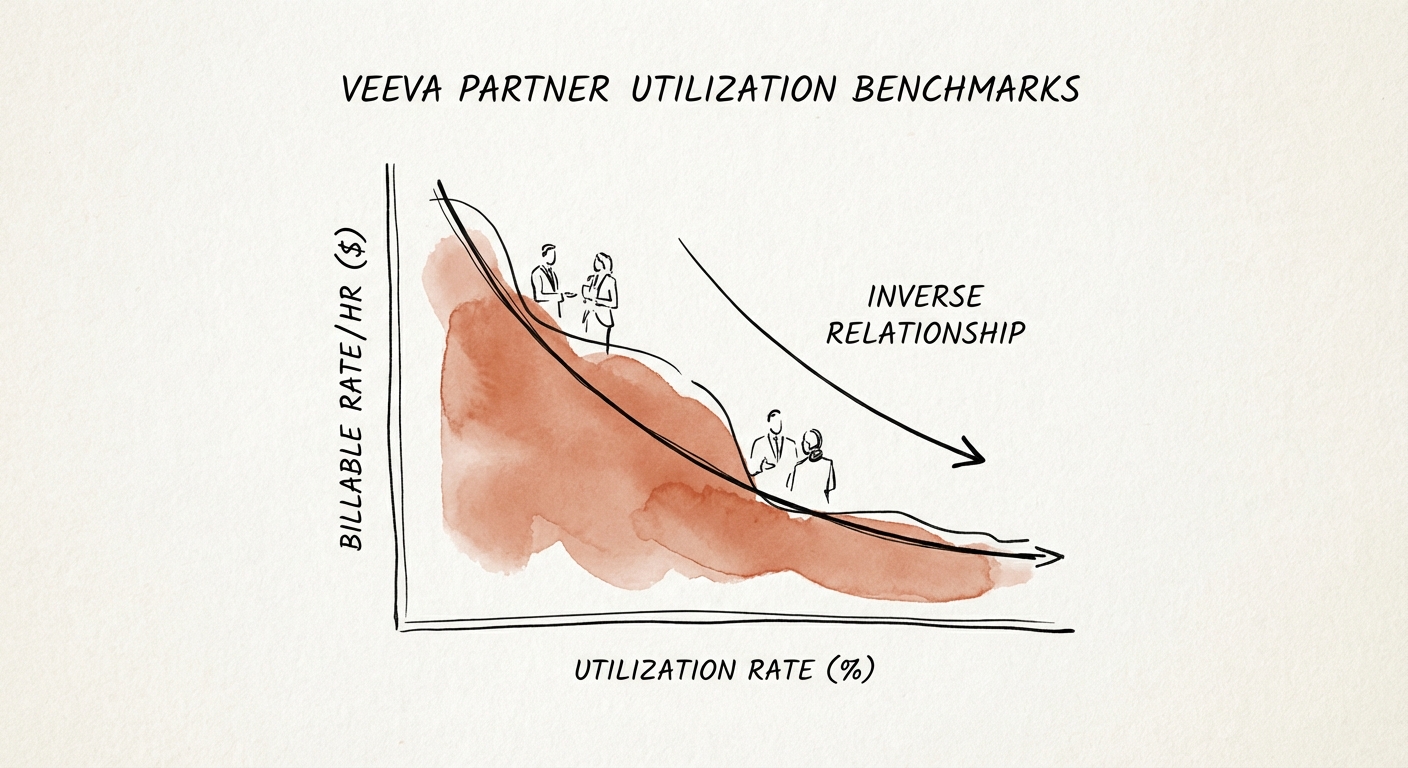
Veeva Partner Utilization Benchmarks: Why 85% Is a Valuation Trap
Why pushing Veeva consultants to 85% utilization destroys value. Benchmarks for Clinical, Quality, and Commercial partners, and the impact of the 3x/year release cycle.
72% Max Sustainable Utilization
BRIEF · REVENUE ARCHITECTURE
The Veeva Release Cycle Is Your Recurring Revenue: A Managed Services Playbook
Veeva ships three releases a year — every one is a recurring billing trigger. How implementation partners turn 25R1/R2/R3 into MSP revenue buyers pay 12x for.
12x EBITDA Valuation Multiple
BRIEF · REVENUE ARCHITECTURE
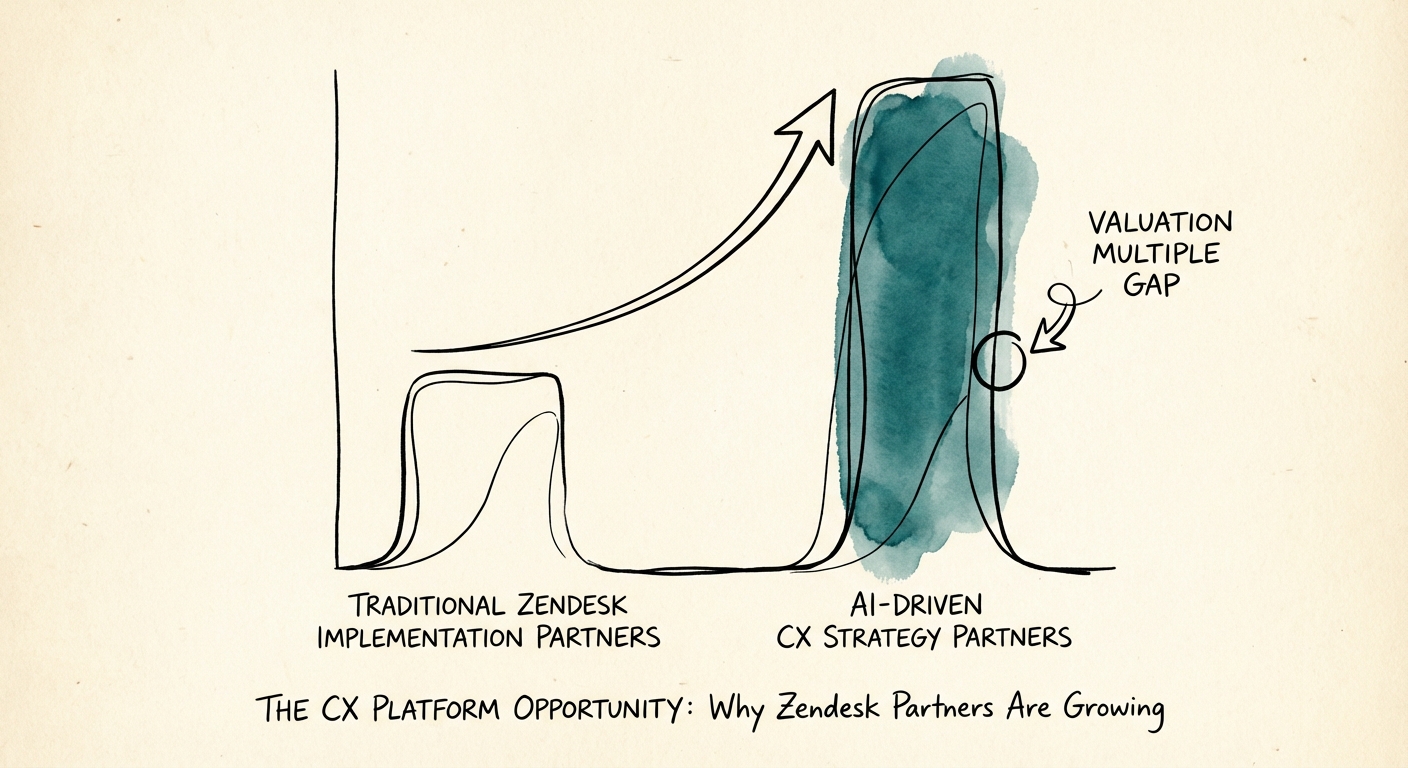
The CX Platform Opportunity: Why Zendesk Partners Are Growing
Zendesk is no longer just a help desk. Discover why specialized CX partners are seeing 12x valuation multiples by pivoting from ticket resolution to AI containment.
$200M Projected AI ARR (2025)
BRIEF · TEAM & HIRING
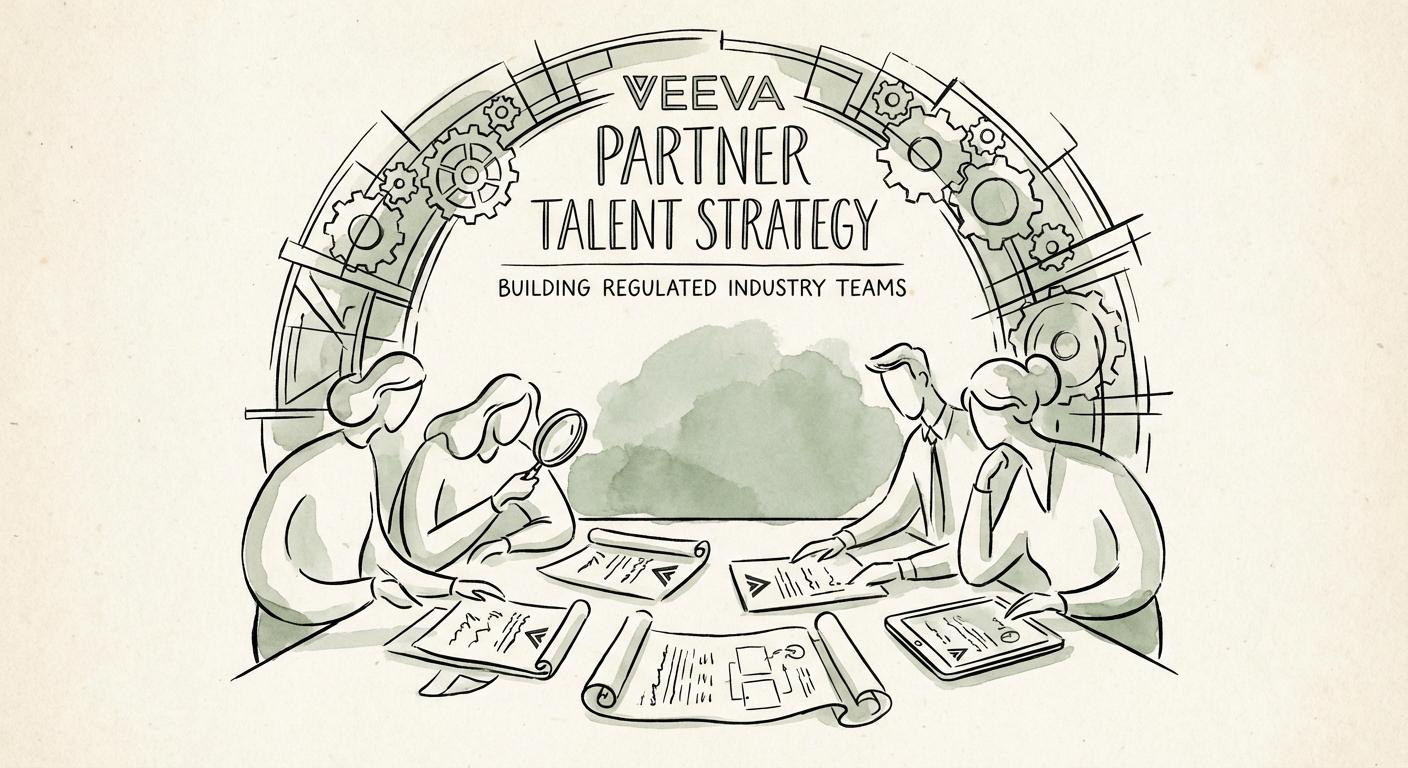
Veeva Partner Talent Strategy: The $250k 'Paper Tiger' Trap in Regulated Industries
Stop hiring 'Paper Tigers'. Learn why generic Salesforce talent fails in Veeva practices and how to build high-valuation teams for regulated industries.
$250,000 Avg. Cost of a 'Paper Tiger' Hire
BRIEF · EXIT READINESS
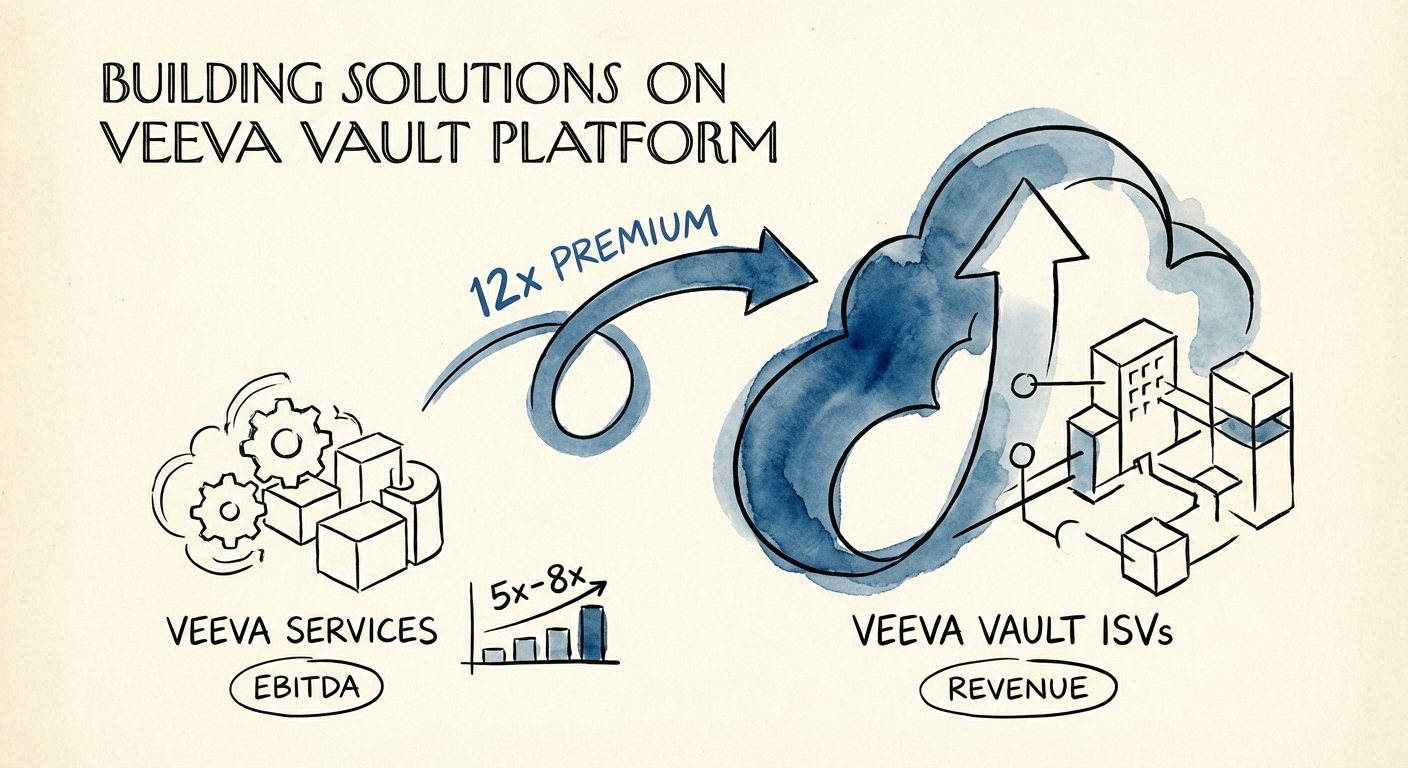
The Veeva Vault ISV Premium: Why 'Certified Solutions' Command 12x Revenue Multiples
Why Veeva Vault ISVs trade at 8x-12x revenue while services firms stall at 10x EBITDA. A strategic guide for founders on the Salesforce-to-Vault migration opportunity.
12x Potential Revenue Multiple
BRIEF · TECHNICAL DEBT
The Veeva Migration Cliff: How a 2030 Deadline Turns a "Clean SaaS" Target Into a Diligence Trap
Veeva is retiring Salesforce-based CRM for Vault CRM by 2030. Here's how to audit a life sciences target's Apex debt and price the migration into your LOI.
$3.2M Hidden Migration Liability
BRIEF · UNIT ECONOMICS
Why Your Zendesk Practice Is Worth Half What You Think
Zendesk's AI Resolution Platform gutted the value of setup work. Partners earning recurring tuning revenue trade near 12x; setup shops stall near 5x. Here's the math.
12x Valuation Multiple (Optimization)
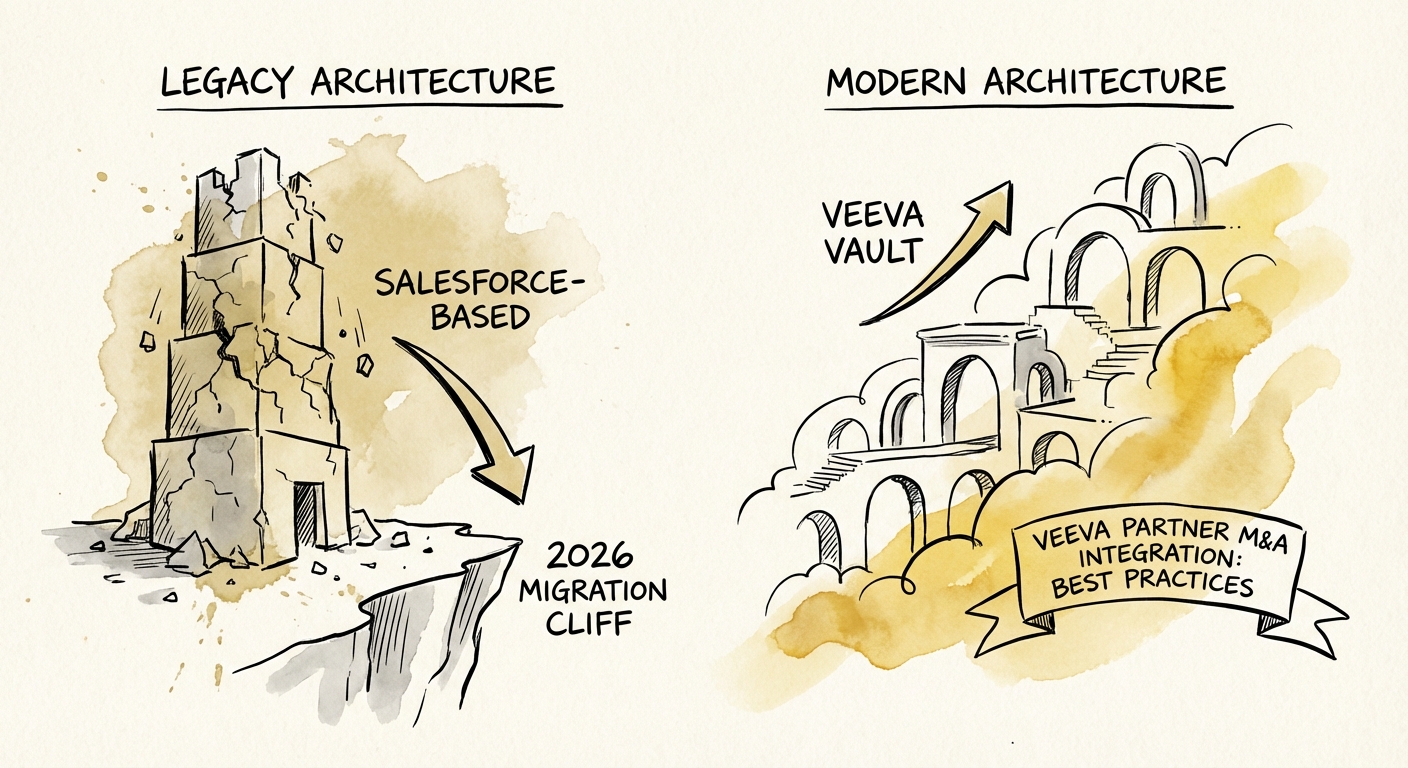
BRIEF · MIGRATION & INTEGRATION
The Vault CRM Cliff: Why Veeva Partner Integrations Fail in 2026
The 2026 guide to Veeva partner M&A integration. Avoid the Vault CRM migration cliff, retain specialized talent, and protect 14x valuations.
47% Year 1 Talent Attrition Risk
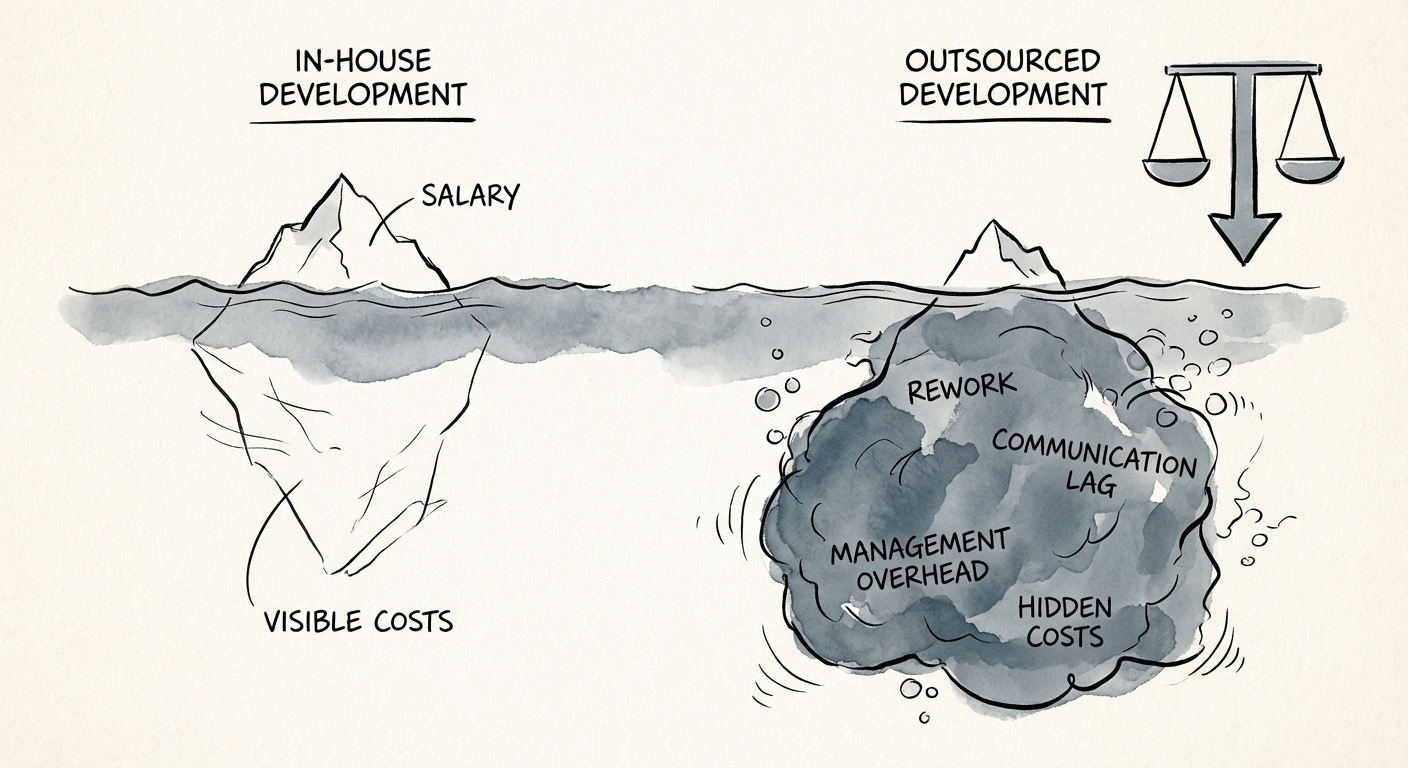
BRIEF · TECHNICAL DEBT
In-House vs. Outsourced Development: The TCO Reality Check for Series B Scale-Ups
Stop comparing hourly rates. Our 2026 TCO analysis reveals the true cost of in-house vs. outsourced development, including the $306k/year technical debt risk.
$306,000 Annual Technical Debt Cost per 1M Lines of Code

BRIEF · GTM EXECUTION
The Zendesk AI Premium: Why "Automation Architects" Trade at 12x (And Ticket Configurers Stall at 6x)
Zendesk's pivot to AI agents creates a massive opportunity for partners. Learn why 'Automation Architects' trade at 12x while generalists stall.
80% Potential Deflection Rate
BRIEF · EXIT READINESS
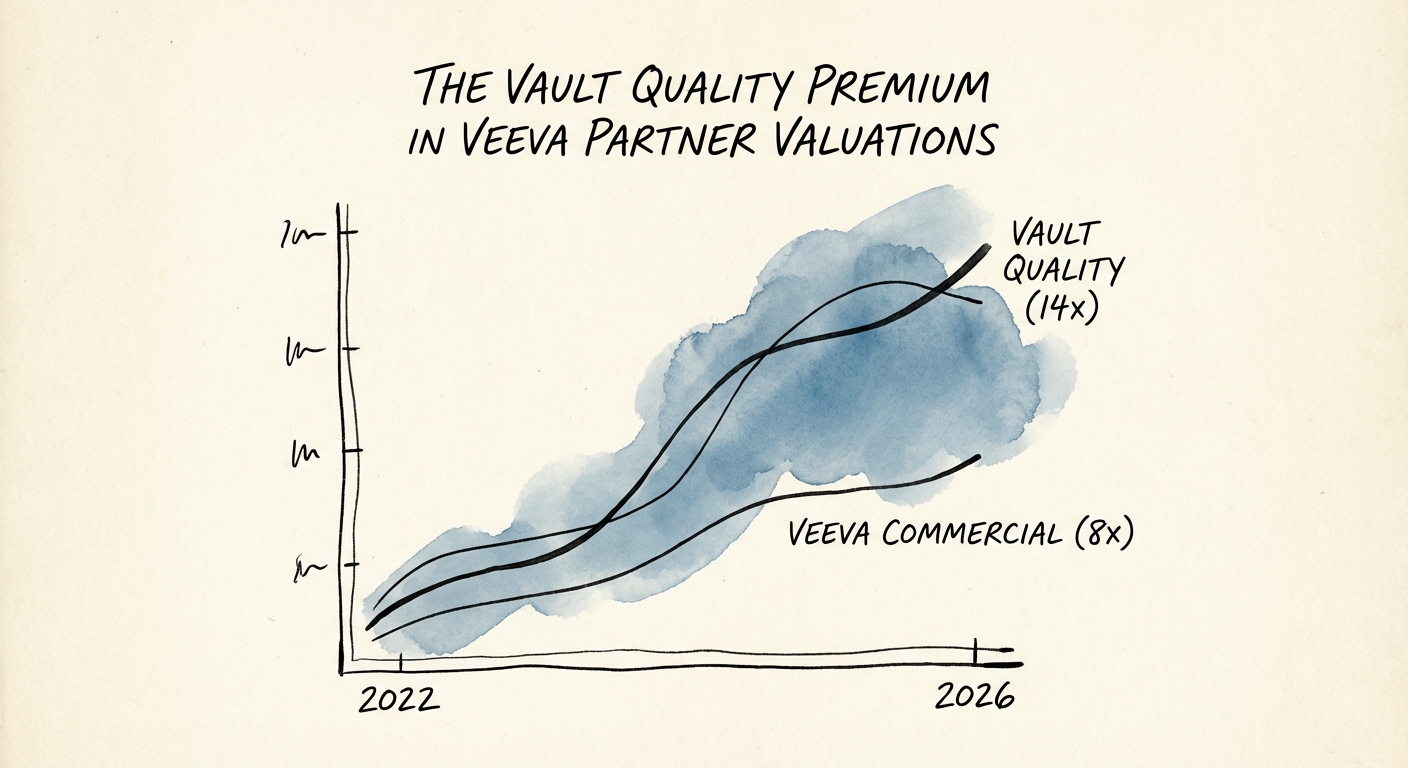
The Vault Quality Premium: Why Specialized Veeva Partners Trade at 14x
Veeva Commercial partners stall at 8x while Vault Quality specialists command 14x. Discover the 'Quality Premium' in Life Sciences IT M&A.
14x EBITDA Multiple
BRIEF · FOUNDER EXTRACTION
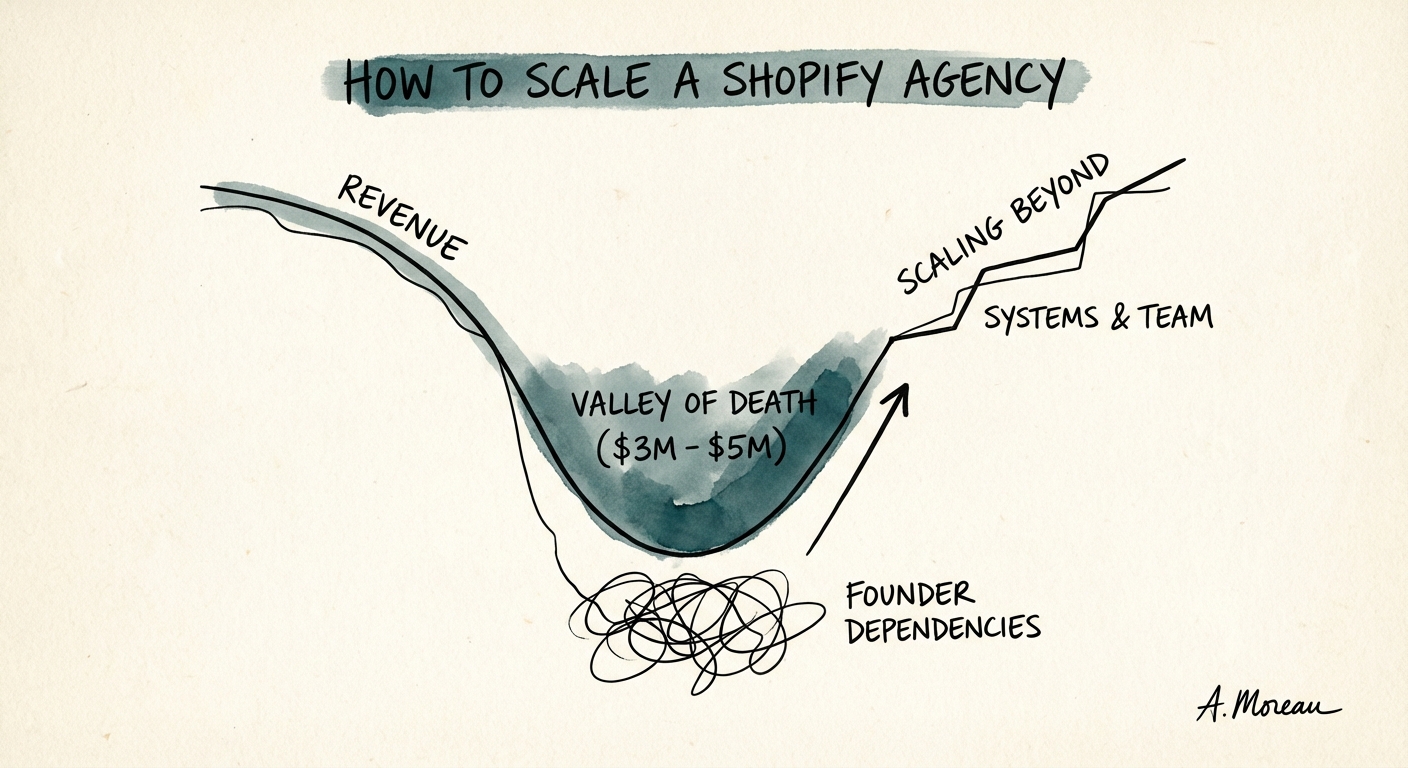
The $10M Ceiling: How to Scale Your Shopify Agency Beyond Founder 'Heroics'
Why Shopify agencies stall at $3M revenue. A diagnostic playbook for extracting the founder from sales and delivery to unlock 12x valuation multiples.
30% Valuation Haircut for Founder Dependency
BRIEF · UNIT ECONOMICS
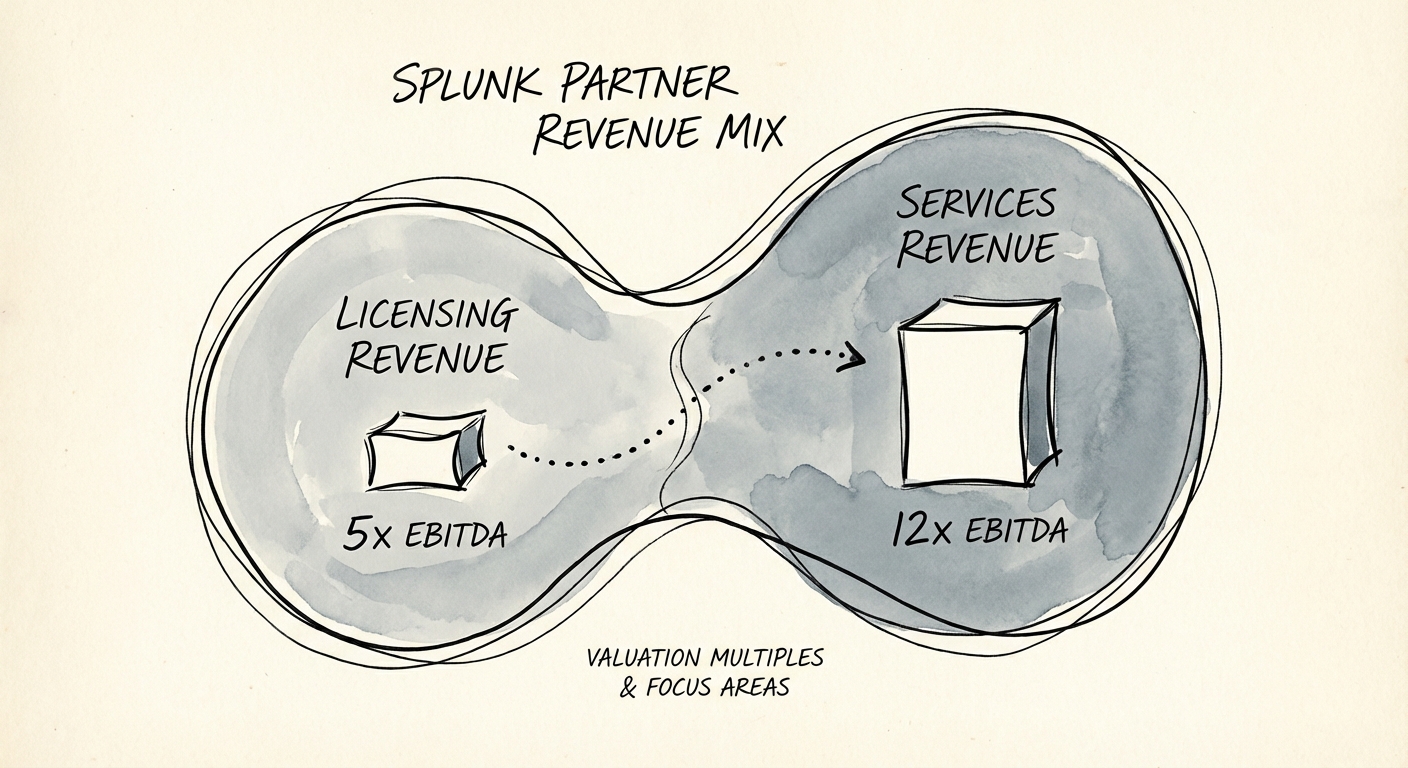
The Splunk Revenue Trap: Why Resale-Heavy Partners Trade at a 50% Discount
Are you a Splunk partner relying on licensing resale? Learn why resale-heavy firms trade at a 50% discount and how to pivot to high-margin managed services.
50% Valuation Discount