BRIEF · TEAM & HIRING
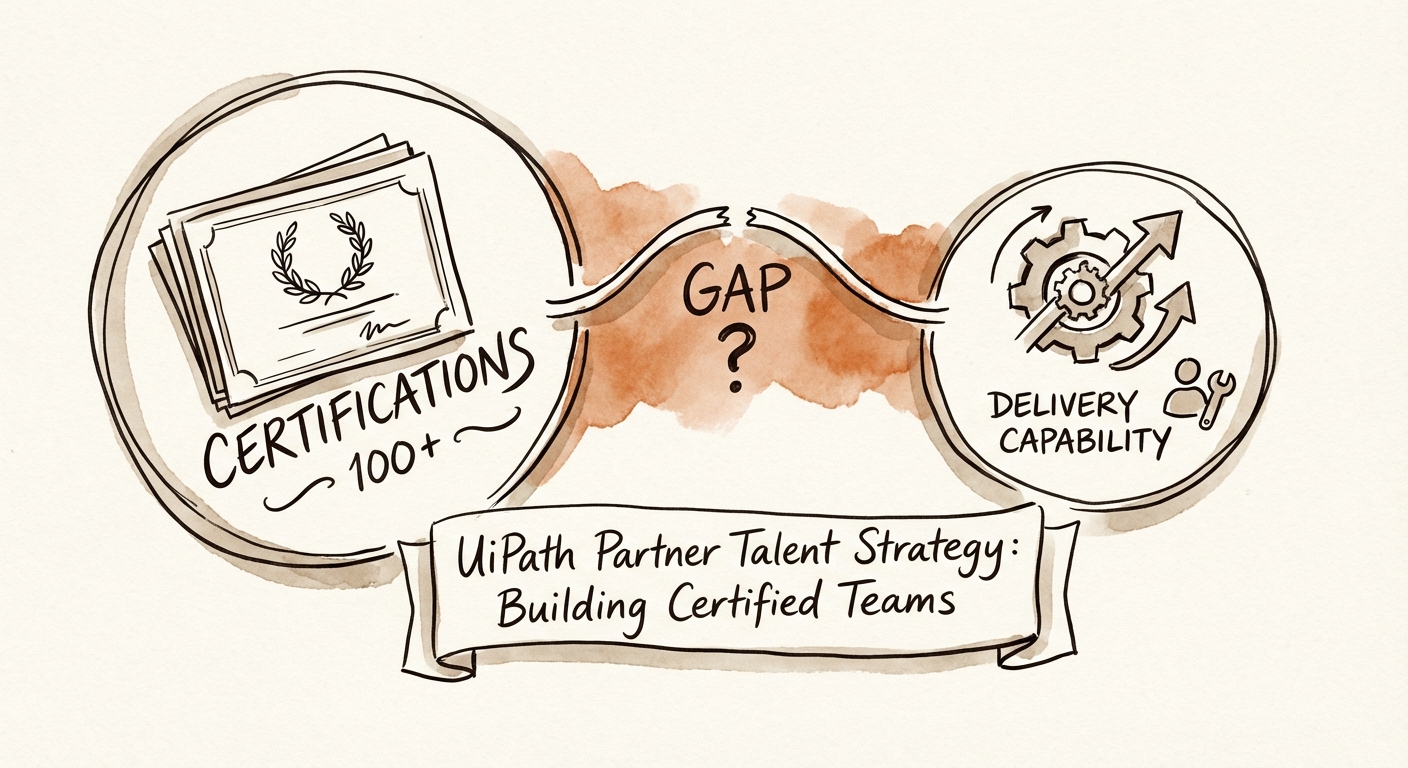
UiPath Partner Talent Strategy: The $250k 'Notebook Engineer' Trap
Stop hiring "Paper Tigers." Learn the 2026 UiPath talent benchmarks, USN requirements, and why "certified" doesn't always mean "billable."
$250,000 Revenue Risk Per 'Paper Tiger' Lead
BRIEF · EXIT READINESS
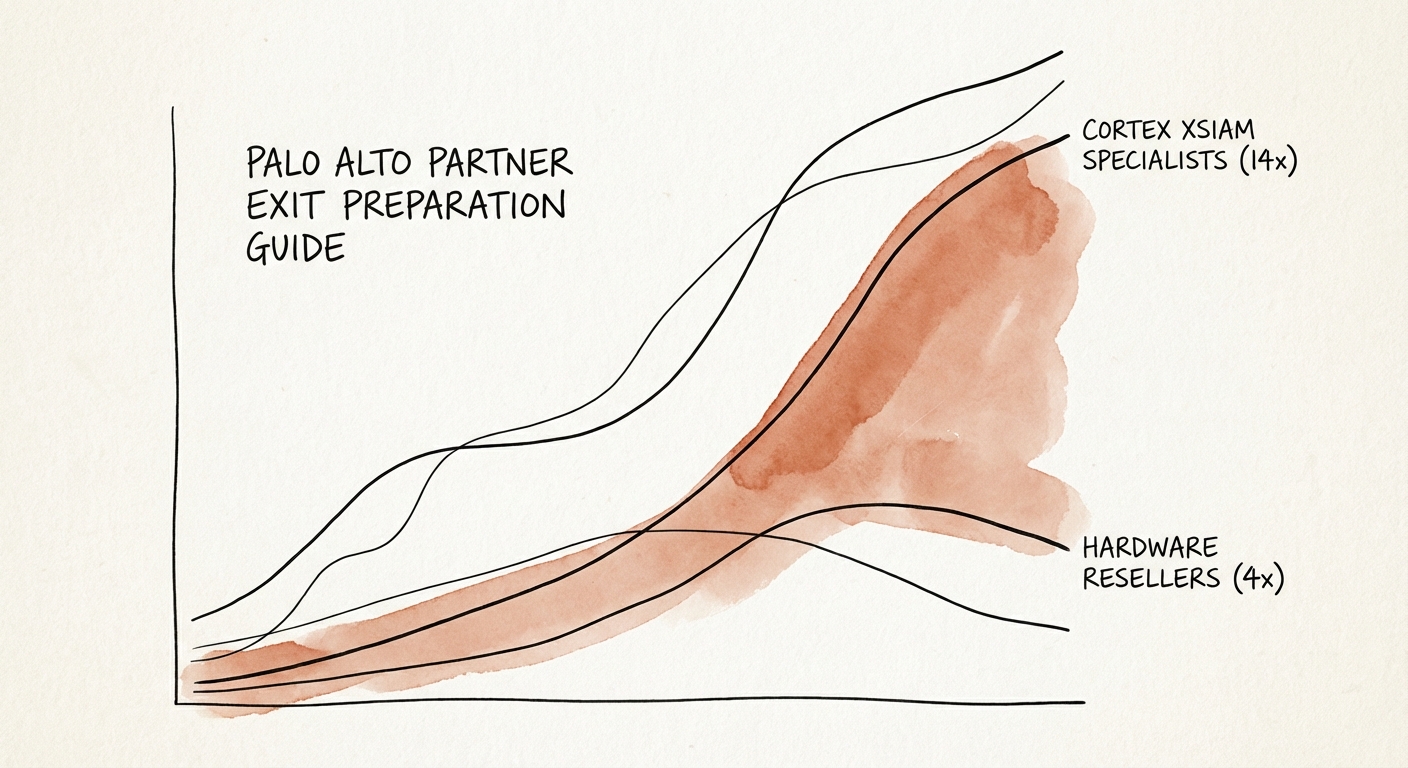
Palo Alto Partner Exit Preparation: The Gap Between 4x Resellers and 14x Platform Partners
Why generic Palo Alto Networks resellers trade at 4x EBITDA while Cortex and Prisma specialists command 14x. An exit readiness guide for NextWave partners.
14x EBITDA multiple for Cortex-specialized partners
BRIEF · EXIT READINESS
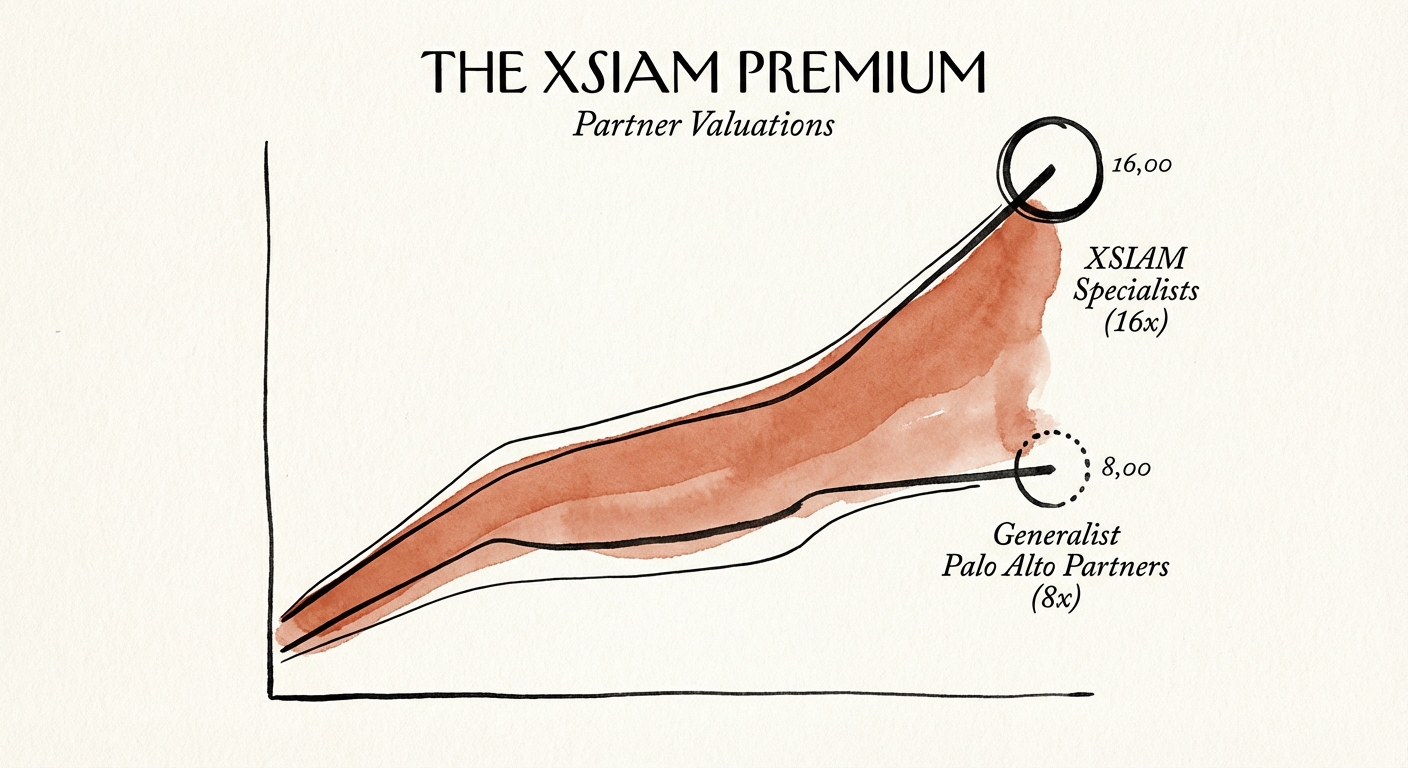
The XSIAM Premium: Why Specialized Palo Alto Partners Trade at 16x
Generalist Palo Alto partners trade at 8x EBITDA. XSIAM specialists command 16x. Here is the diagnostic framework for valuing Cortex practices in 2026.
16x EBITDA Multiple for XSIAM Specialists
BRIEF · EXIT READINESS
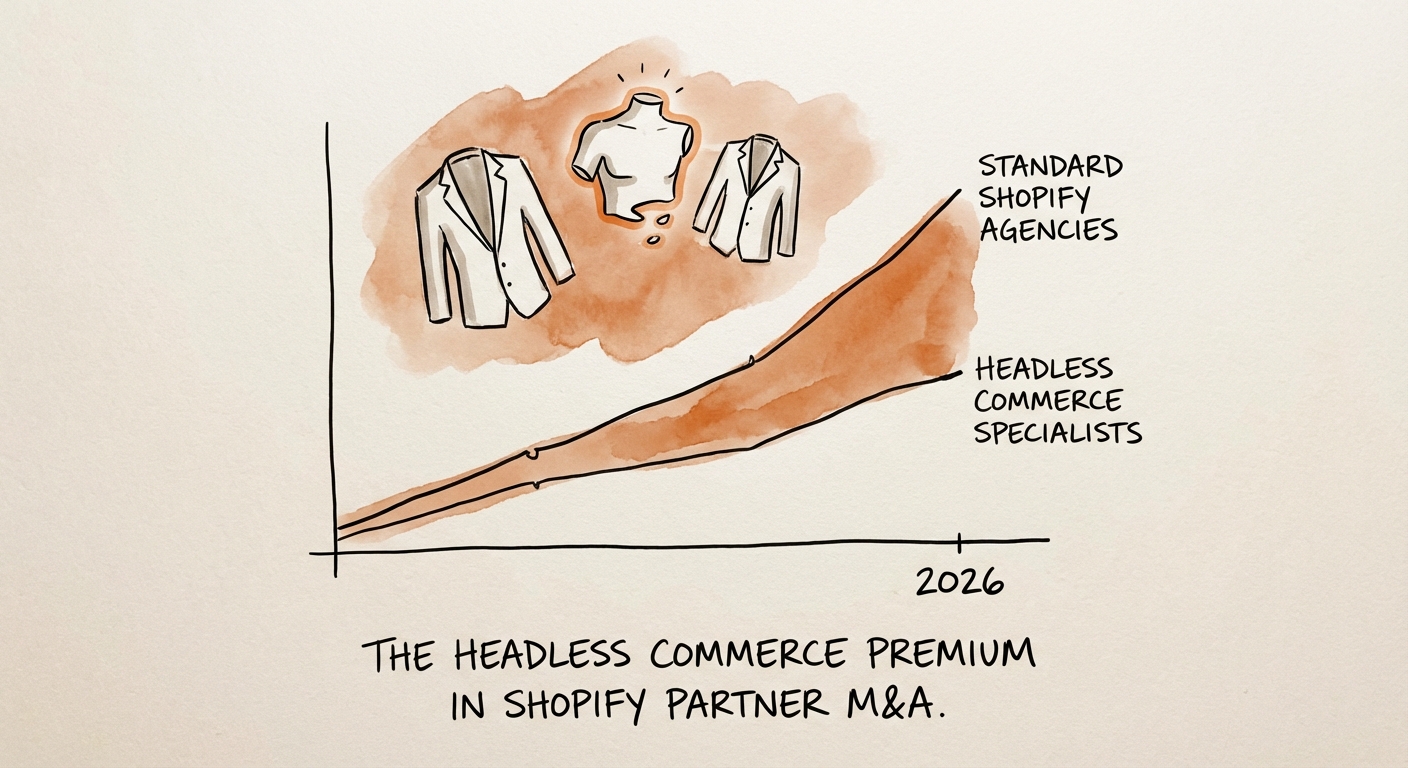
The Headless Commerce Premium: Why Hydrogen Experts Trade at 12x
Why Shopify Hydrogen specialists command 12.4x EBITDA multiples while standard agencies stall at 6x. A diagnostic guide for PE sponsors and founders.
12.4x EBITDA Multiple for Headless Specialists
BRIEF · EXIT READINESS
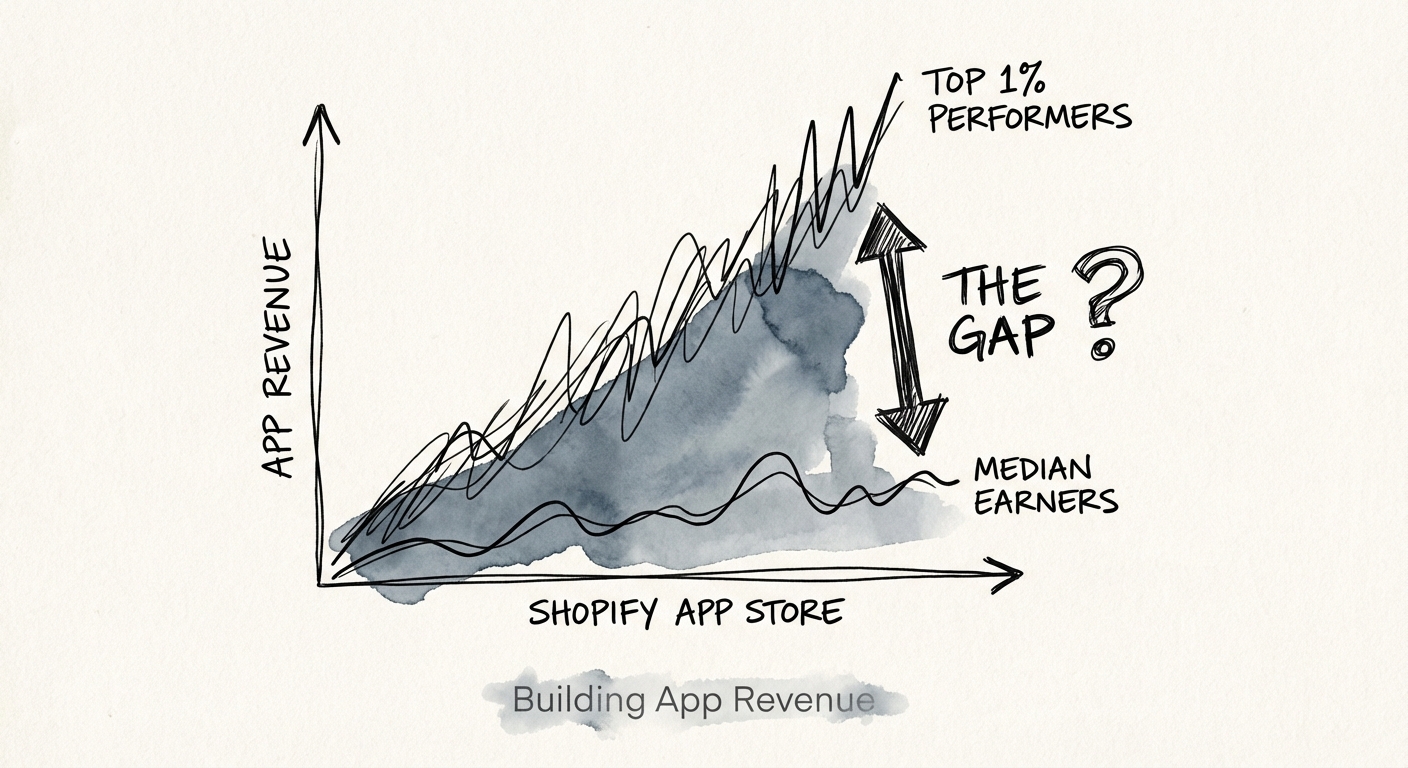
The Shopify Partner Valuation Gap: Why "Features" Trade at 2x and "Platforms" Trade at 10x
Stop building $10 apps. Learn why Shopify ISVs targeting 'Plus' merchants command 10x multiples while generalist tools stall at 2x.
$725 vs $83,000 Monthly Revenue Gap (Median vs. Top 1%)
BRIEF · COMPLIANCE & SECURITY
The Federal Fortress Premium: Why PANW Gov Partners Trade at 15x
Why Palo Alto Networks partners with Federal specializations trade at 15x EBITDA while generalists stall at 8x. The CMMC and FedRAMP valuation playbook.
15x EBITDA Multiple for Fed-Specialized Partners
BRIEF · MIGRATION & INTEGRATION
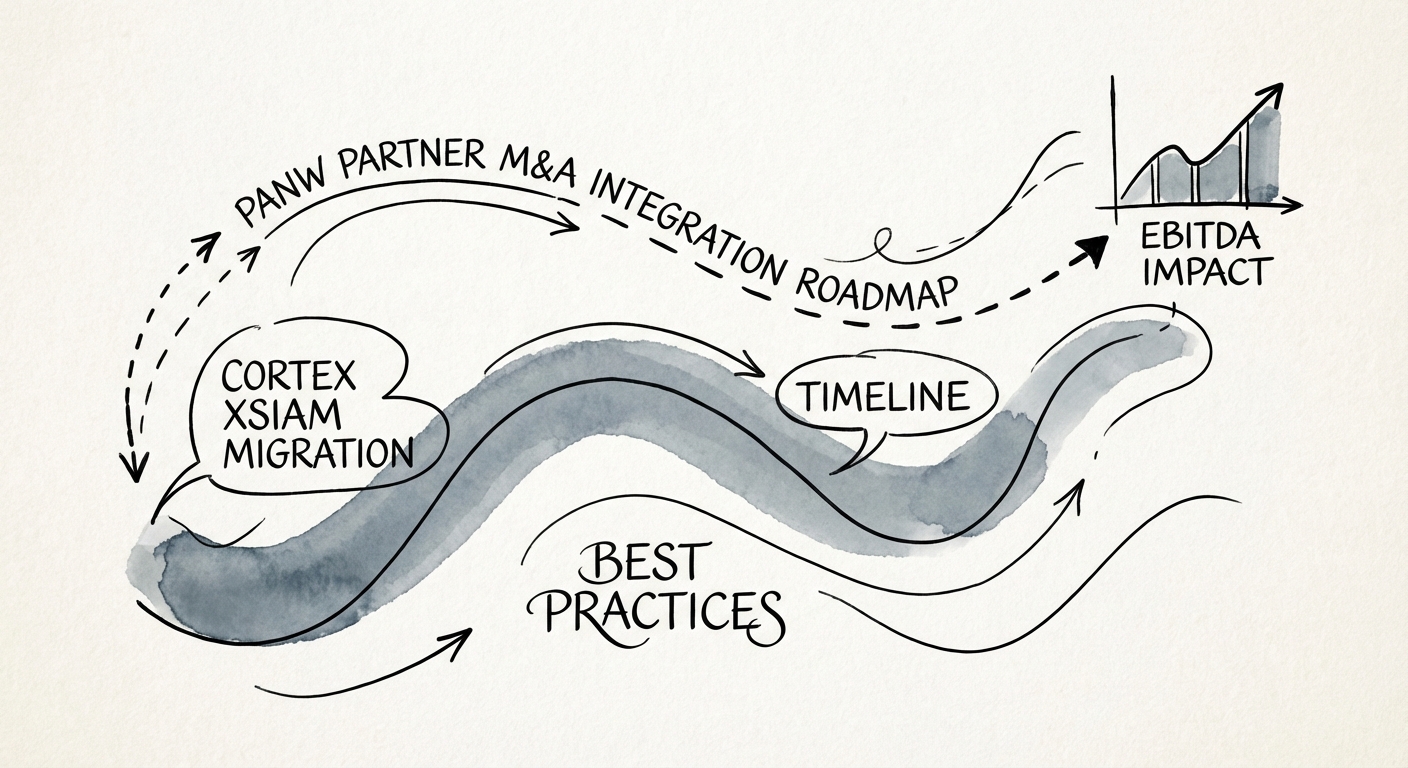
The Cortex Consolidation Playbook: Preventing the 30% Valuation Leak in PANW Partner M&A
Post-merger integration playbook for Palo Alto Networks partners. How to consolidate SOC stacks, protect Diamond status, and avoid the 22% EBITDA leak in MSSP roll-ups.
22% EBITDA Leakage from Dual-Stack Operations
BRIEF · FOUNDER EXTRACTION
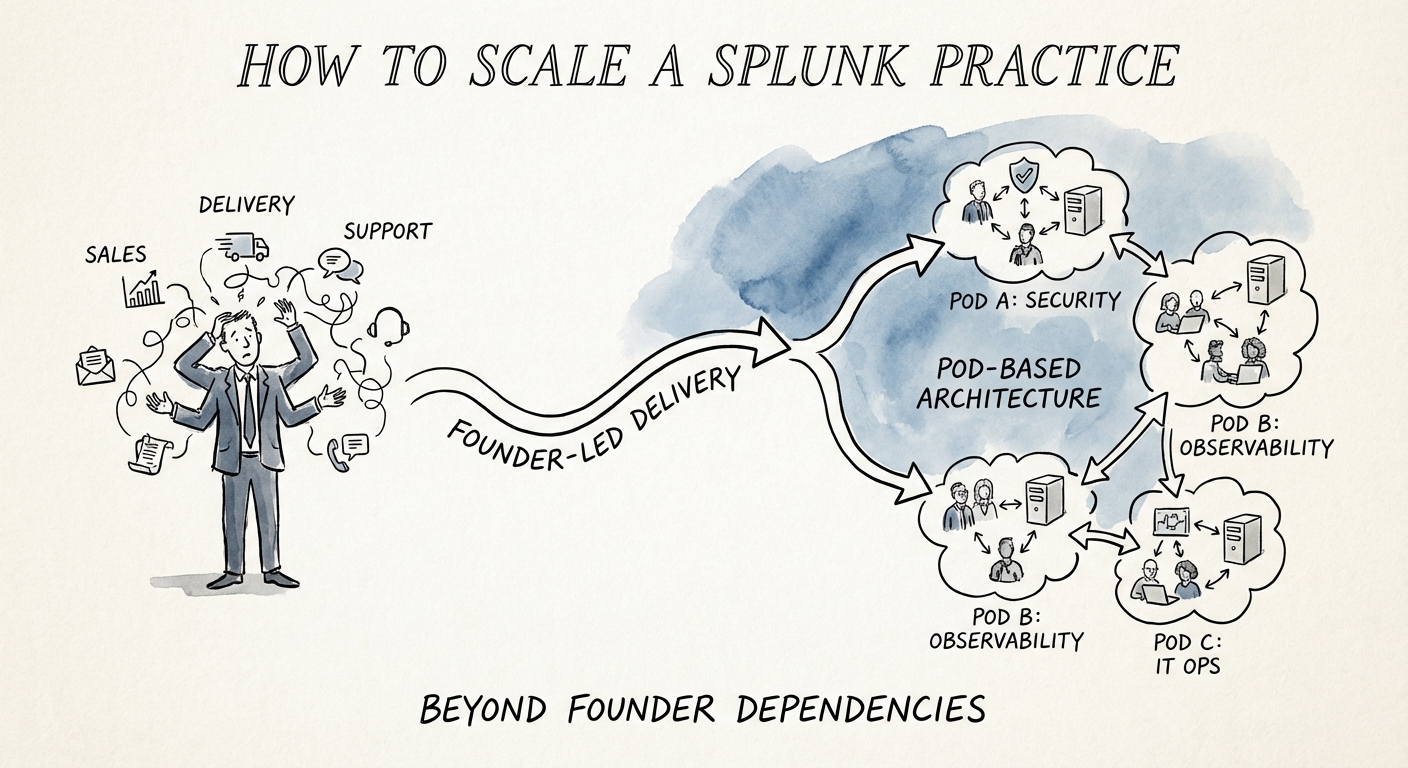
The $15M Splunk Ceiling: How to Scale Your Practice Beyond Founder 'Heroics'
A playbook for Splunk partners hitting the $15M ceiling. Learn how to extract the founder from delivery, navigate the Cisco 360 integration, and build a valuation-ready practice.
30% Valuation Haircut for Key Person Risk
BRIEF · EXIT READINESS
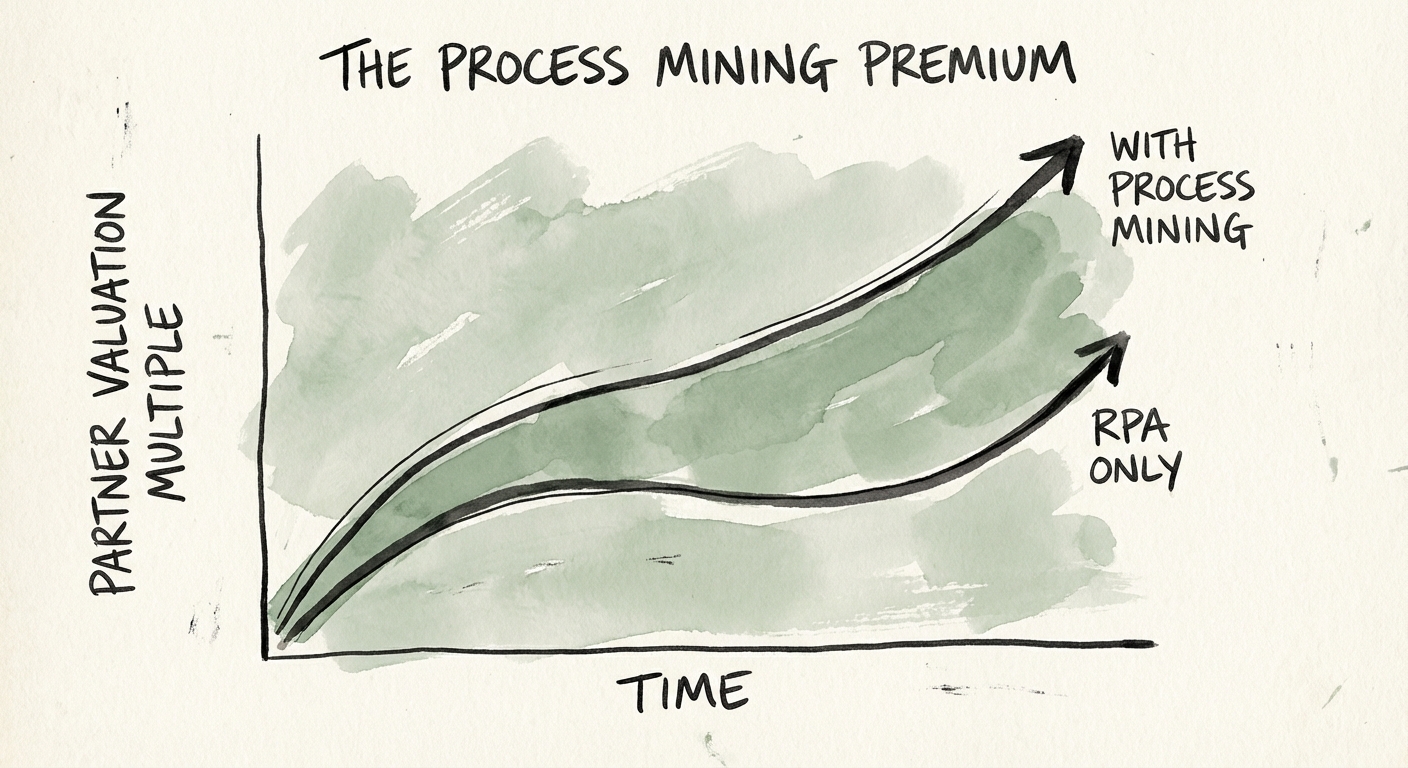
The Process Mining Premium: Why UiPath Partners with 'Discovery' DNA Trade at 14x
Why UiPath partners with Process Mining capabilities trade at 14x EBITDA while pure RPA shops stall at 6x. A diagnostic for PE sponsors and founders.
14x Potential EBITDA Multiple
BRIEF · EXIT READINESS
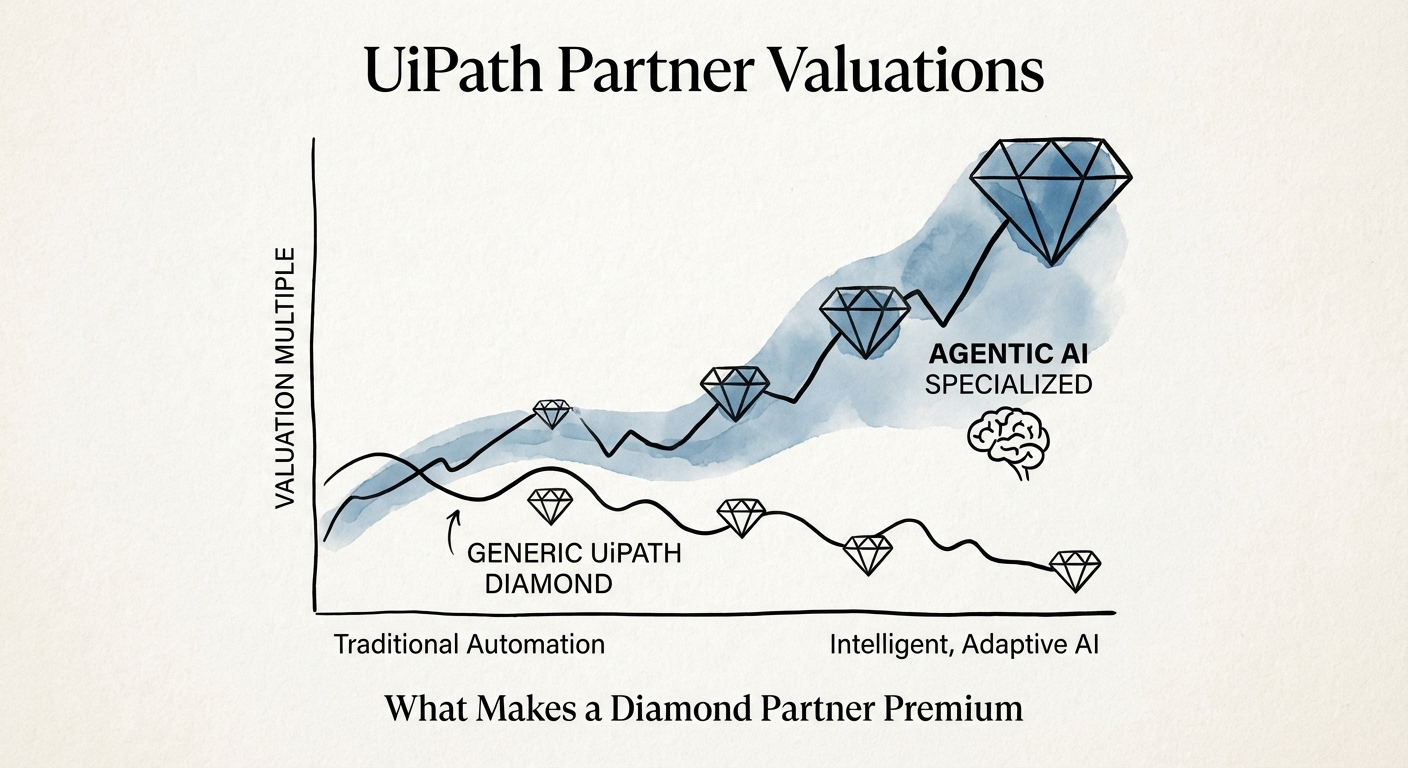
UiPath Partner Valuations: Why 'Diamond' Status Is Just the Baseline (And What Actually Drives 14x Multiples)
Why UiPath Diamond partners trade at 6x EBITDA while specialized 'Agentic' automation firms command 14x. A 2026 diagnostic for founders and PE sponsors.
14x Potential EBITDA Multiple for Agentic IP-Led Partners
BRIEF · EXIT READINESS
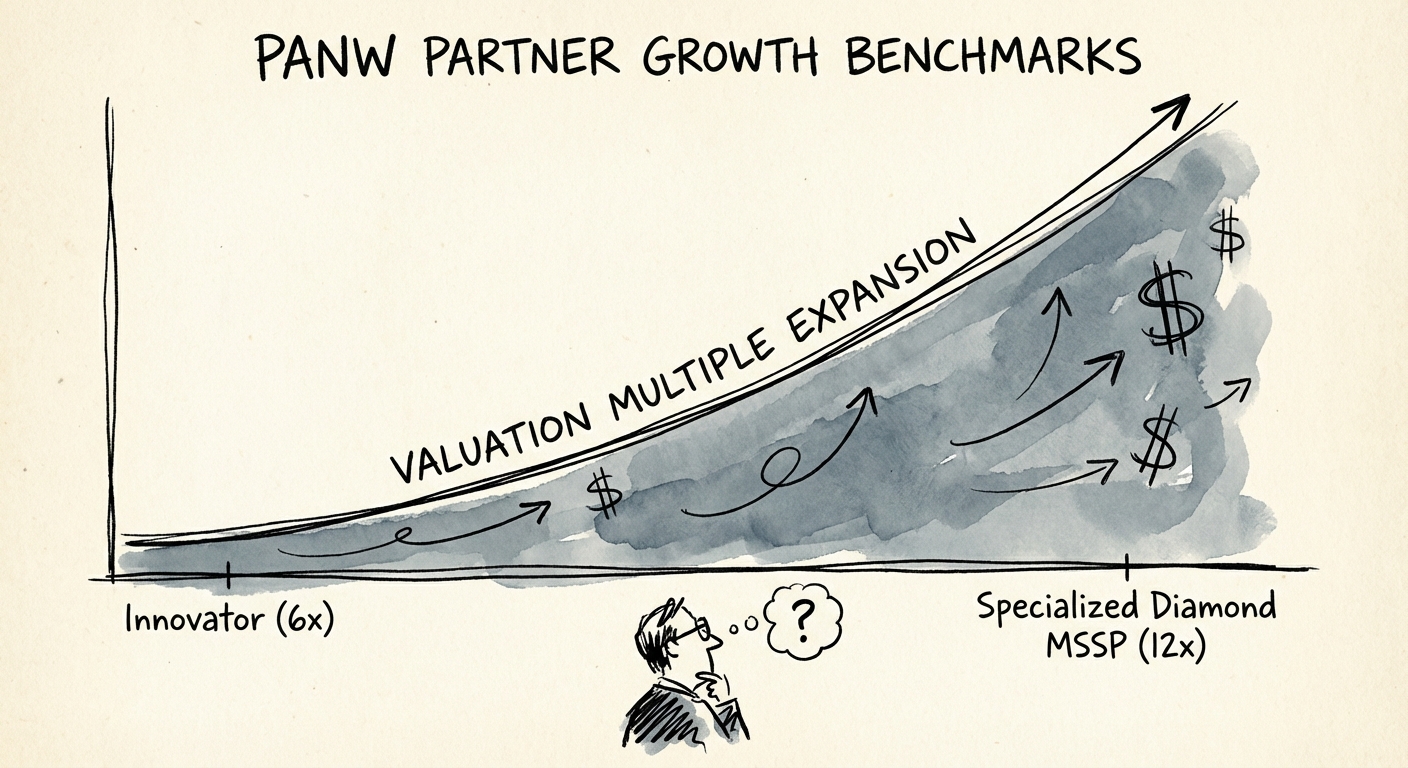
Palo Alto Networks Partner Growth Benchmarks: The Gap Between "Innovator" Resale and "Diamond" Exits
Analysis of Palo Alto Networks partner valuation multiples. Why 'Diamond' MSSPs trade at 12x EBITDA while 'Innovator' resellers stall at 6x.
12x EBITDA Multiple for Diamond MSSPs
BRIEF · TEAM & HIRING
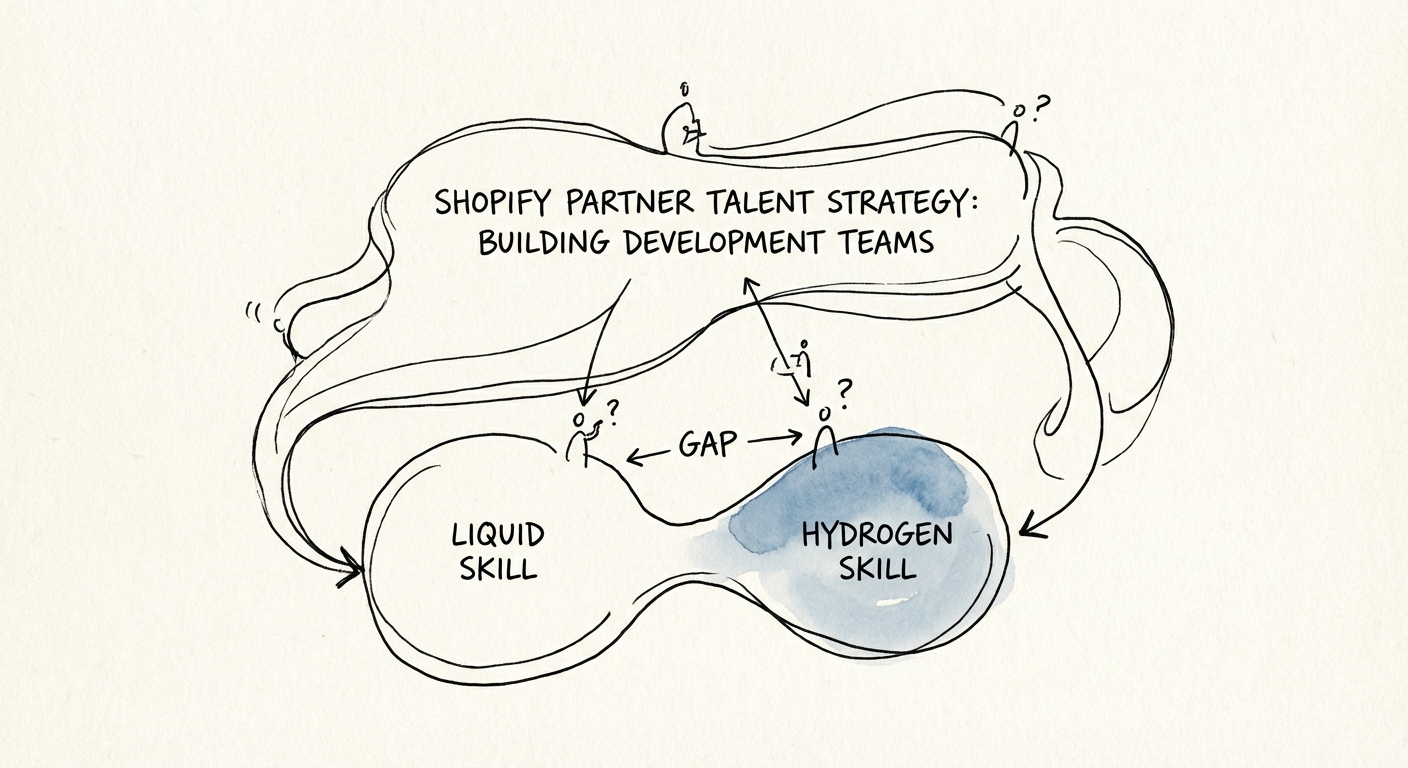
The Hydrogen Gap: Why Your 'Certified' Shopify Team Can't Scale
Stop hiring 'theme tweakers.' To scale a Shopify Plus practice in 2026, you need a Hydrogen-ready engineering team. Here are the salary benchmarks, bill rates, and hiring ratios that drive 12x exits.
$225/hr Target Bill Rate for Hydrogen Engineers
BRIEF · EXIT READINESS
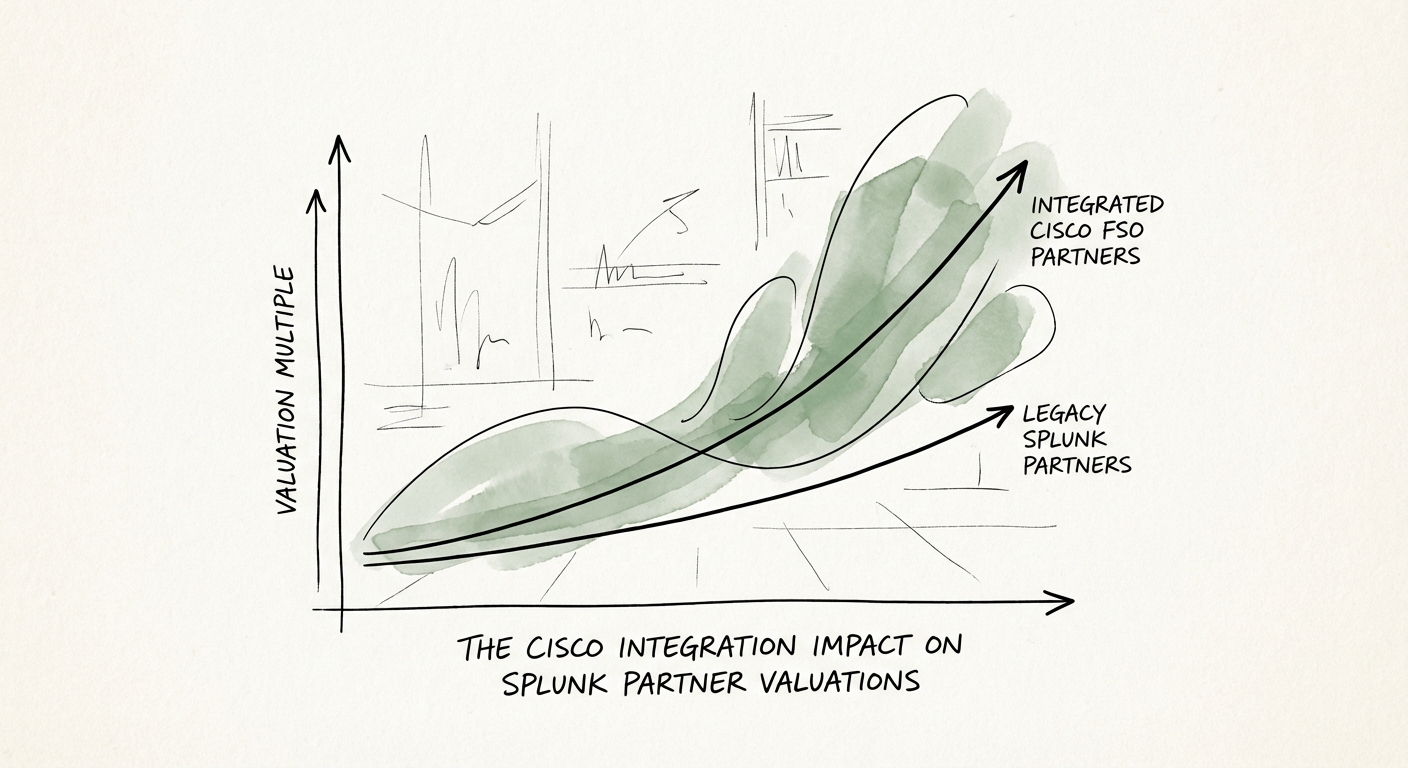
The Cisco Integration Impact on Splunk Partner Valuations: The Gap Between 'Log Management' and 'Security Intelligence'
The Cisco-Splunk integration is creating a valuation gap for partners. Why integrated 'Observability' shops trade at 14x while legacy Splunk partners stall at 8x.
14x EBITDA Multiple for FSO Partners
BRIEF · EXIT READINESS
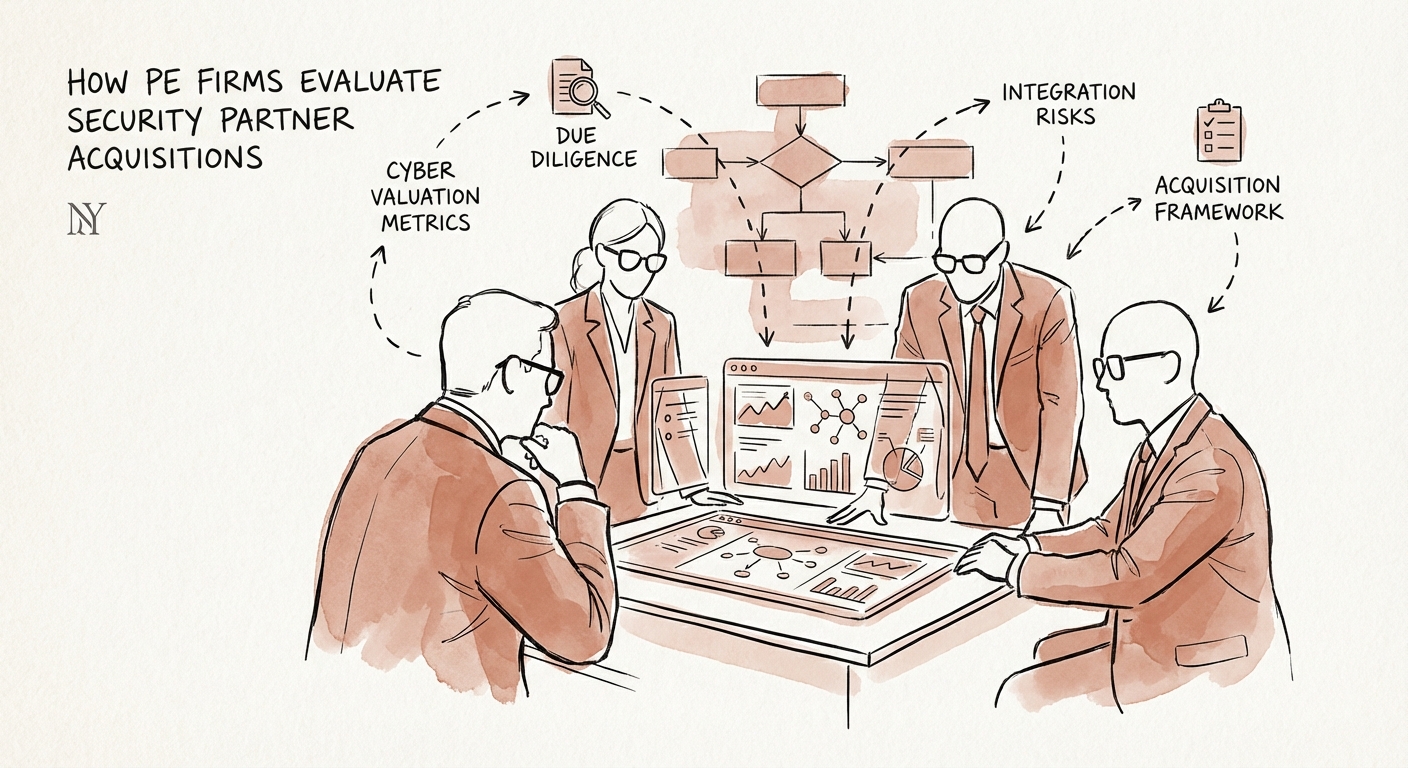
How PE Firms Evaluate Security Partner Acquisitions: The 2026 Diagnostic
Private Equity firms are paying 13.6x EBITDA for elite security partners while generalist VARs stall at 5x. Here is the 2026 due diligence framework for MSSP valuation.
13.6x Elite MSSP EBITDA Multiple
BRIEF · MIGRATION & INTEGRATION
The "Bot Rot" Discount: Why UiPath Partner Integrations Fail (And How to Fix Them)
Prevent the 30% value leak in RPA acquisitions. A diagnostic playbook for PE sponsors integrating UiPath partners, focusing on talent retention, IP audits, and the pivot to Agentic AI.
45% Avg. Bot Failure Rate in Legacy RPA Shops
BRIEF · UNIT ECONOMICS
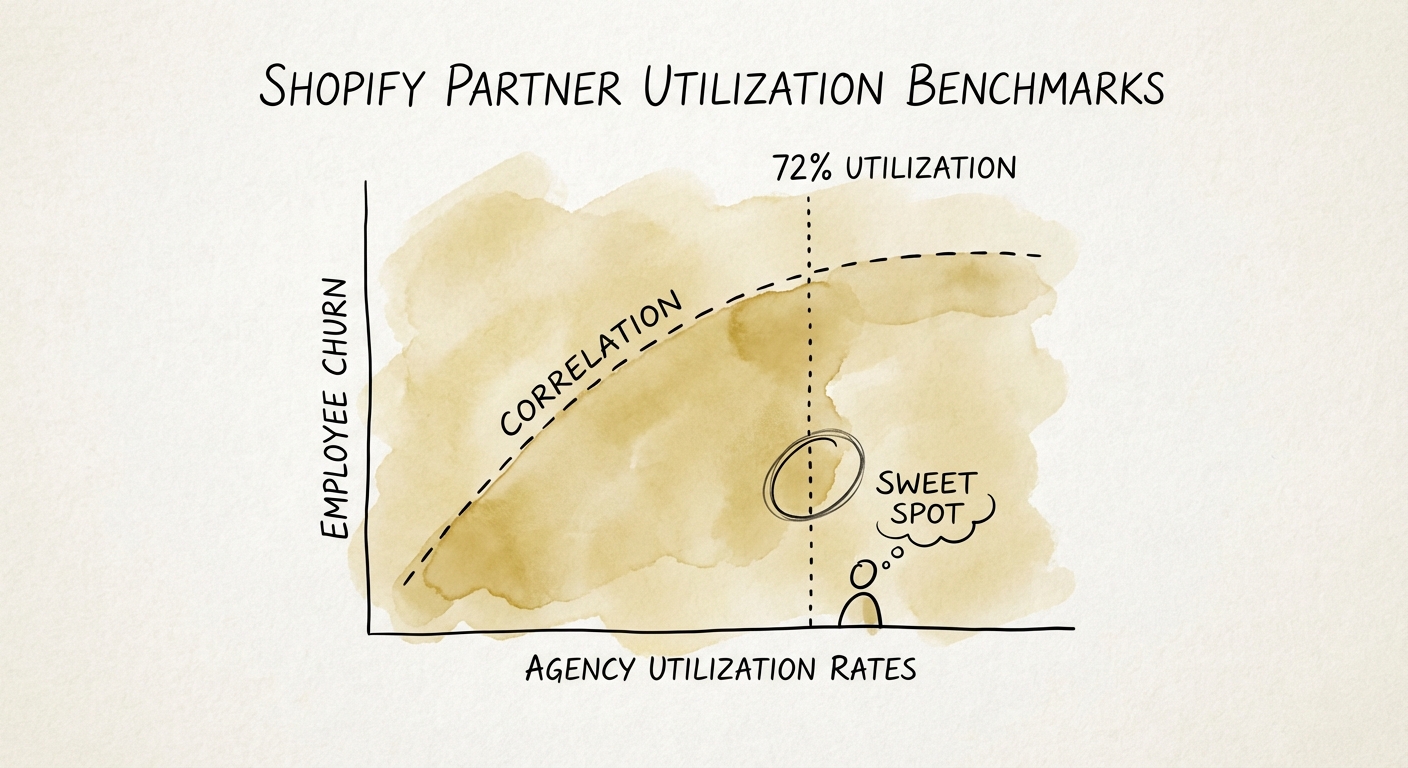
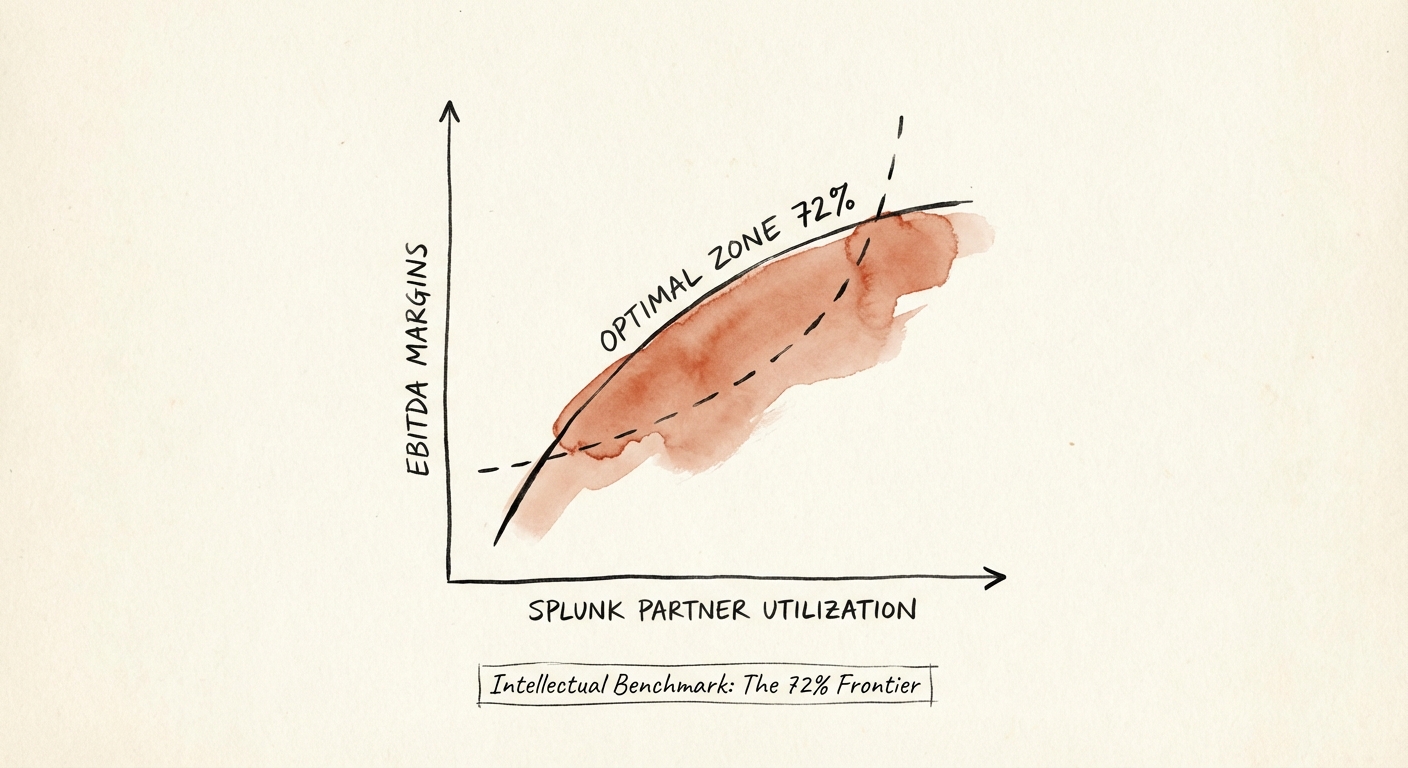
Shopify Partner Utilization Benchmarks: Why 85% Is a Trap
New 2025 data reveals why targeting 85% utilization destroys agency EBITDA. Discover the new 72% 'Sweet Spot' for Shopify Plus partners and how to optimize for exit.
72% Optimal Billable Utilization
BRIEF · UNIT ECONOMICS
Splunk Partner Utilization Benchmarks: Why 85% Is a Trap (And 72% Is the Goal)
Why 85% utilization is a trap for Splunk partners. 2026 benchmarks for Elite vs. Premier tiers, and the 'Goldilocks Zone' that drives 12x valuation multiples.
72% Optimal Splunk Architect Utilization
BRIEF · EXIT READINESS
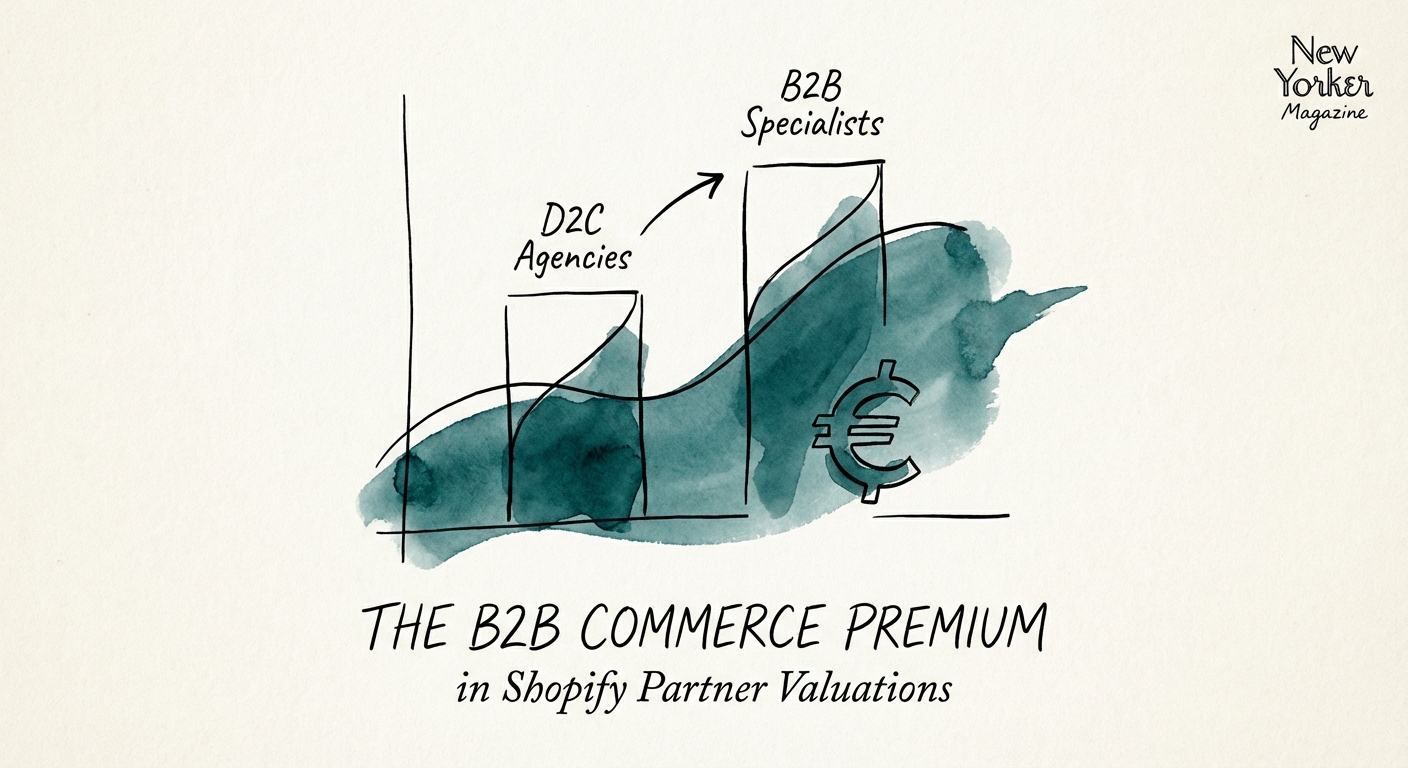
The B2B Commerce Premium: Why Wholesale Specialists Command 14x Multiples in Shopify Partner M&A
Why specialized B2B Shopify partners trade at 14x EBITDA while D2C agencies stall at 6x. A diagnostic for PE sponsors and founders.
14x EBITDA Multiple
BRIEF · REVENUE ARCHITECTURE
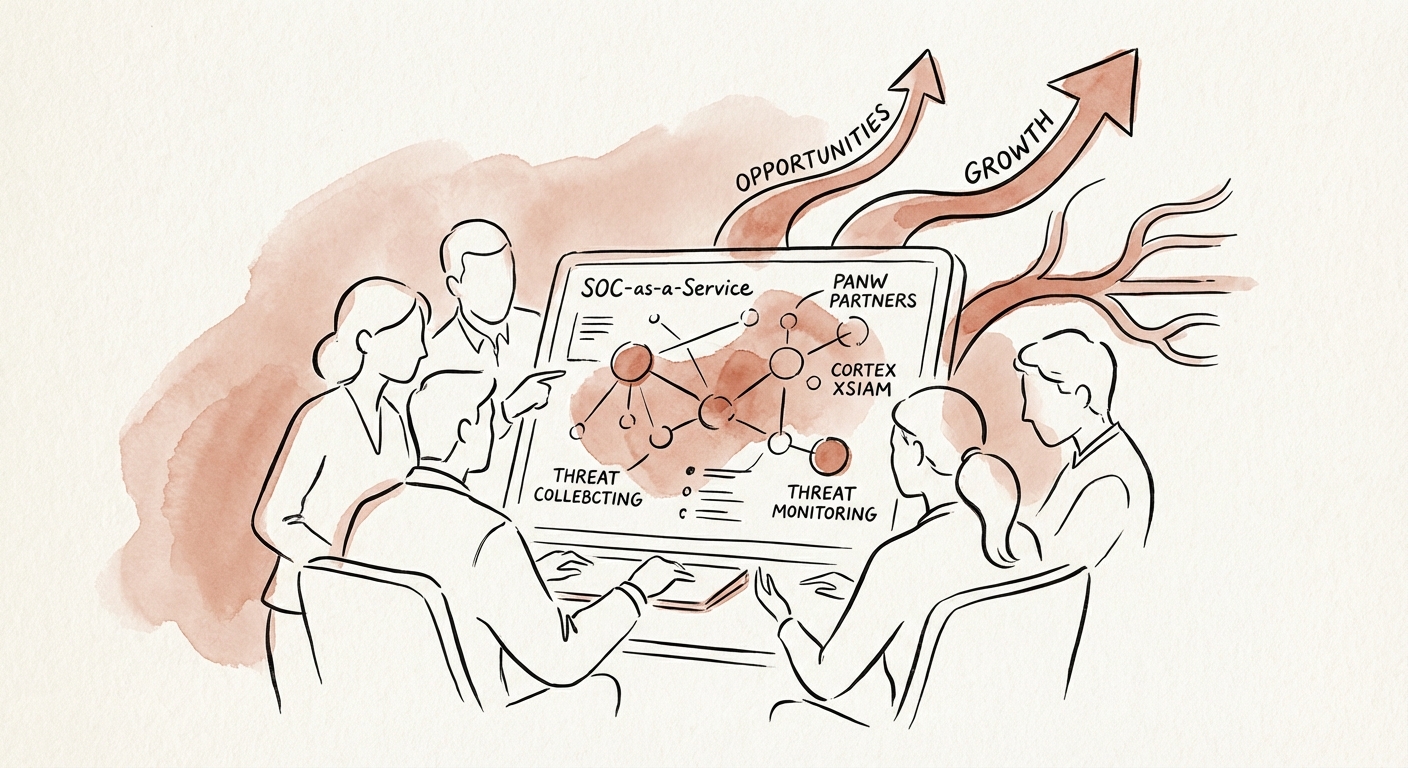
The SOC-as-a-Service Opportunity: How PANW Partners Pivot from 5x to 14x
Palo Alto Networks partners are trading 5x hardware multiples for 14x SOC-as-a-Service valuations. Here is the playbook for pivoting to Cortex XSIAM managed services.
14x EBITDA Multiple for Elite MSSPs
BRIEF · PROCESS DOCUMENTATION
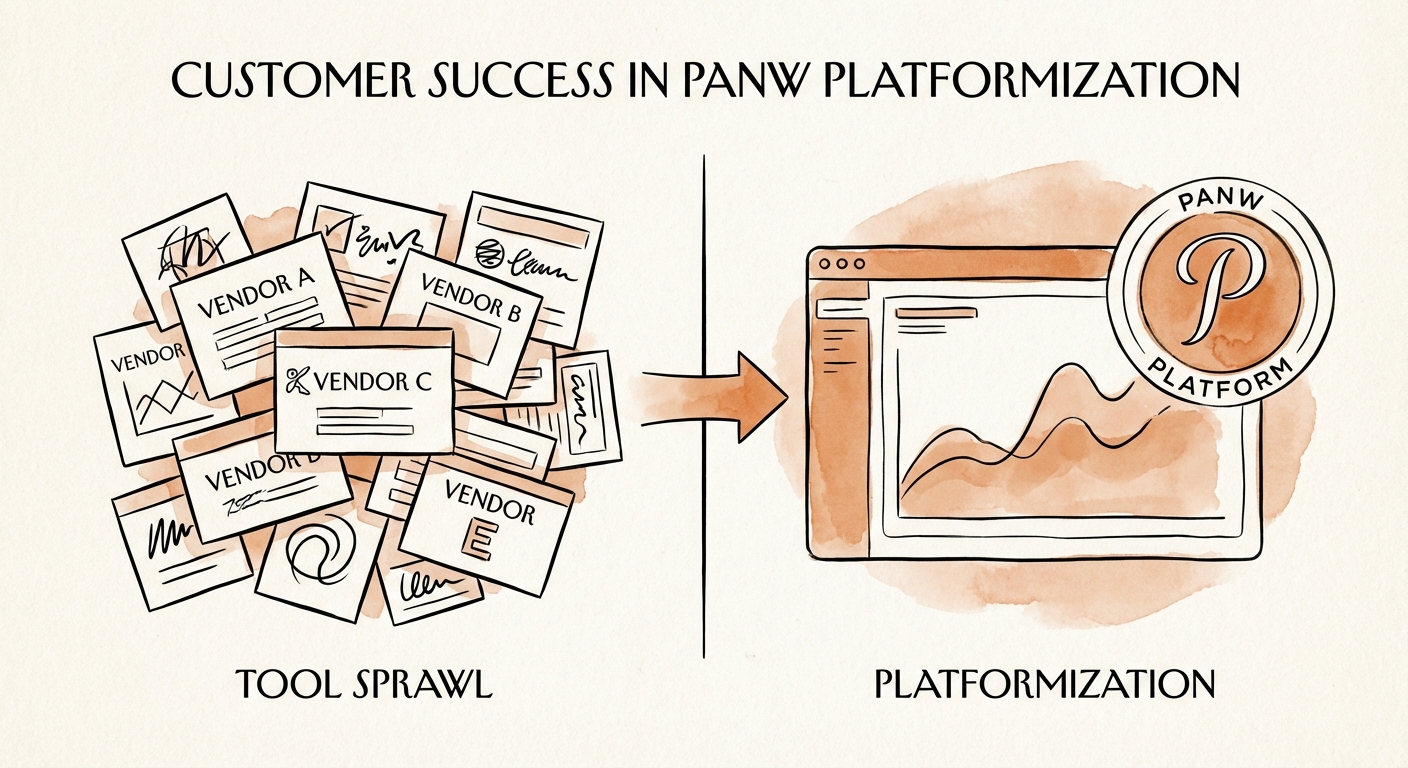
The Platformization Trap: Why Your Palo Alto Networks Consolidation Is Bleeding EBITDA
51% Firms Increasing Vendor Count Despite 'Consolidation' Goals
BRIEF · MIGRATION & INTEGRATION
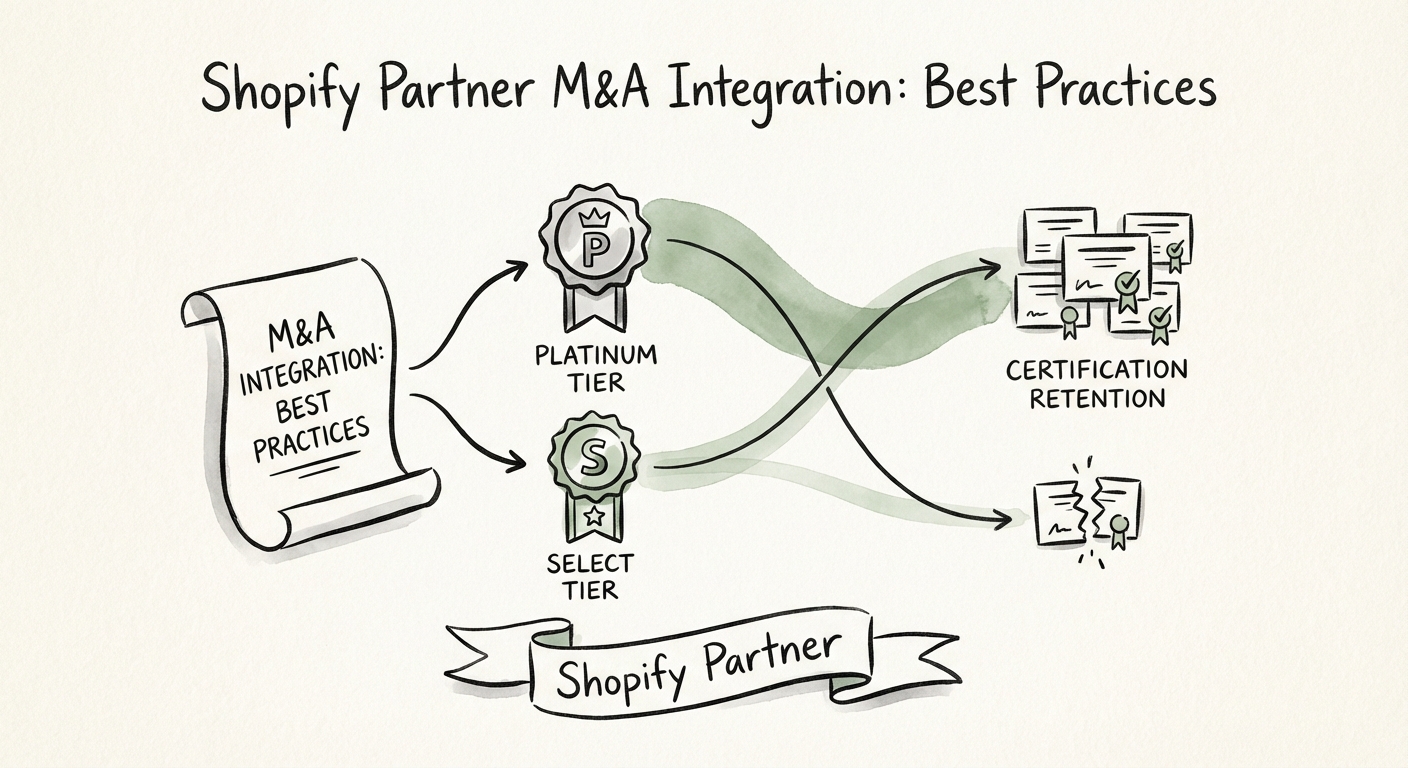
Shopify Partner M&A Integration: The Playbook for Preserving 'Platinum' Value
A post-merger integration playbook for Shopify Partners. How to preserve 'Platinum' status, prevent the 35% churn cliff, and unlock 12x valuation multiples.
35% Potential Deal Value Erosion
BRIEF · EXIT READINESS
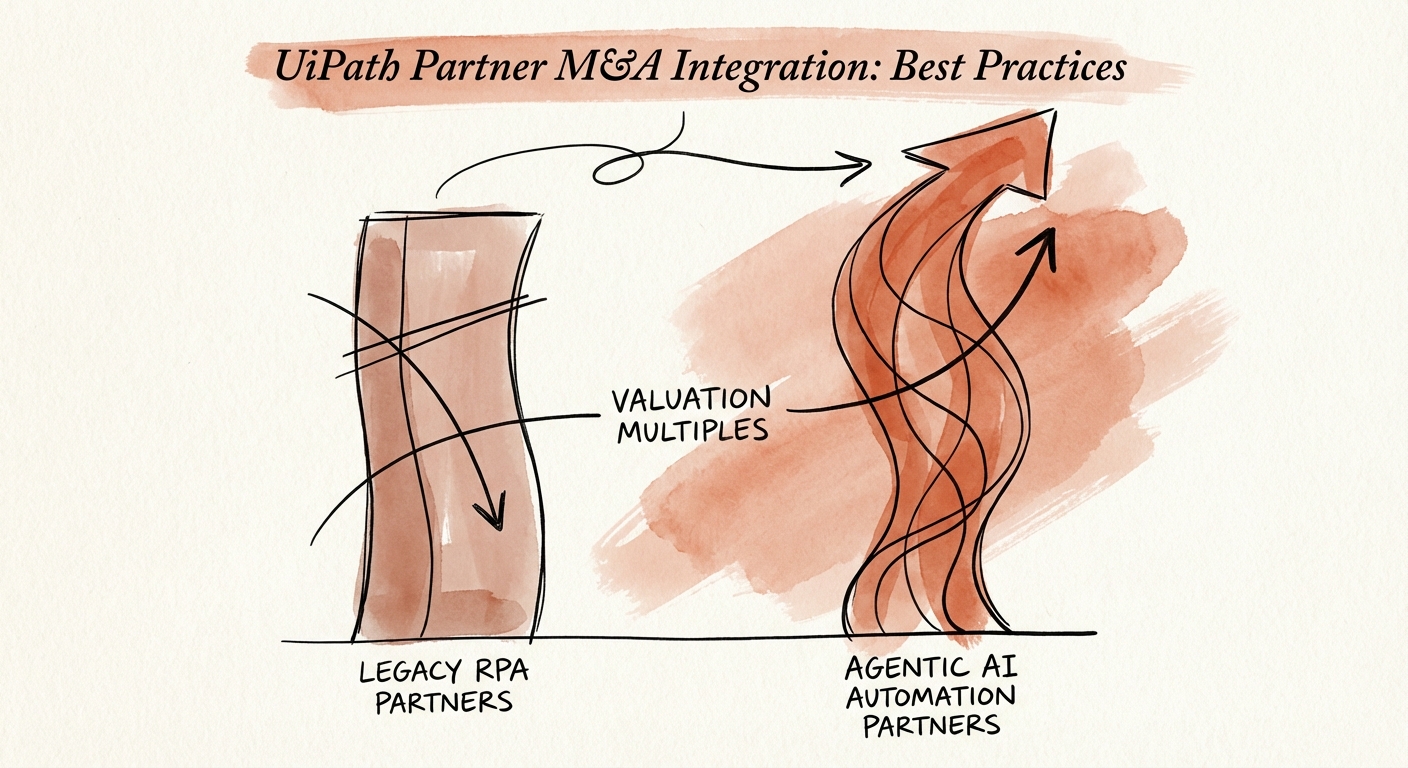
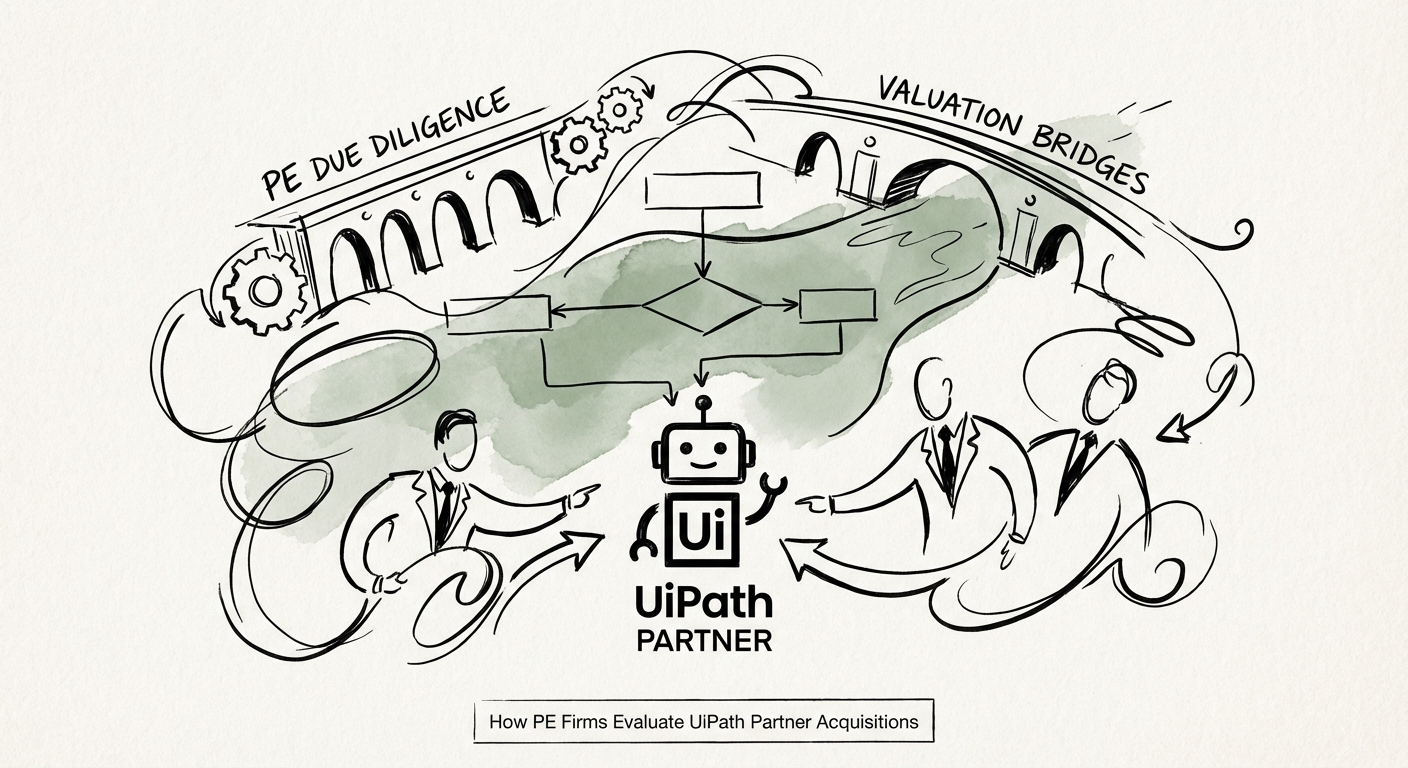
How PE Firms Evaluate UiPath Partner Acquisitions: The 2026 Diagnostic
A guide for UiPath partners on how Private Equity buyers evaluate automation practices in 2026. Covers valuation multiples, technical debt in 'inactive bots', and the Agentic AI premium.
14x Valuation Multiple for 'Agentic' Partners
BRIEF · EXIT READINESS
Building Apps on Splunkbase: The ISV Valuation Playbook
Building a Splunk app can shift your valuation from 1.5x to 8x revenue. Discover the ISV strategy, Cisco acquisition impact, and 2026 benchmarks for Splunkbase success.
8x Revenue Multiple for Top ISVs
BRIEF · UNIT ECONOMICS
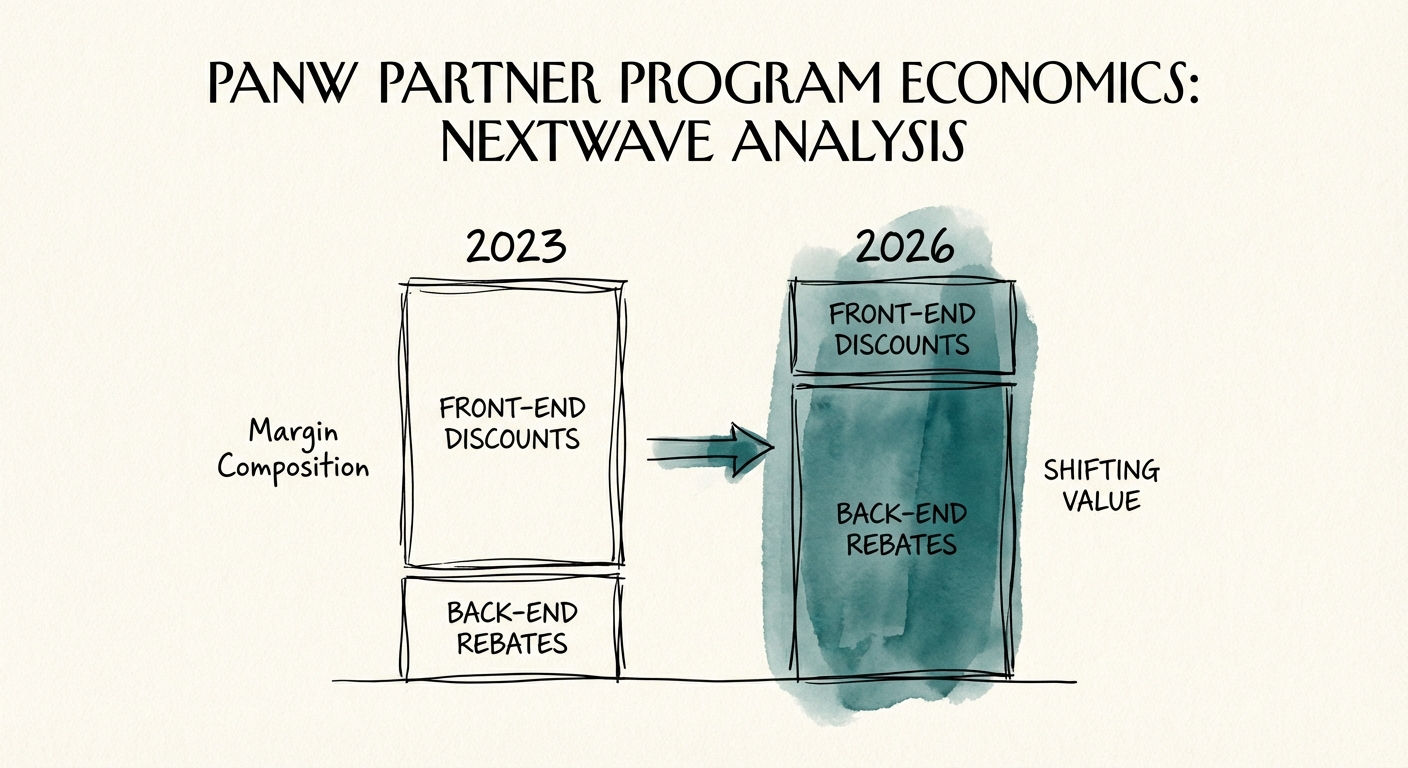
PANW Partner Program Economics: NextWave Analysis (2026)
Analysis of Palo Alto Networks NextWave program economics for 2026. Benchmarks for partner margins, rebate structures, and the ROI of Diamond Innovator status.
22% Net Margin Potential (Diamond vs. Innovator)