BRIEF · REVENUE ARCHITECTURE
The Palo Alto Networks MSSP Playbook: Transforming from 'Firewall Reseller' to 'Platform Guardian'
Transform your Palo Alto Networks practice from a firewall reseller to a high-margin MSSP. Learn the unit economics, service architecture, and valuation drivers of a Cortex-led security practice.
12x EBITDA Valuation Multiple
BRIEF · PROCESS DOCUMENTATION
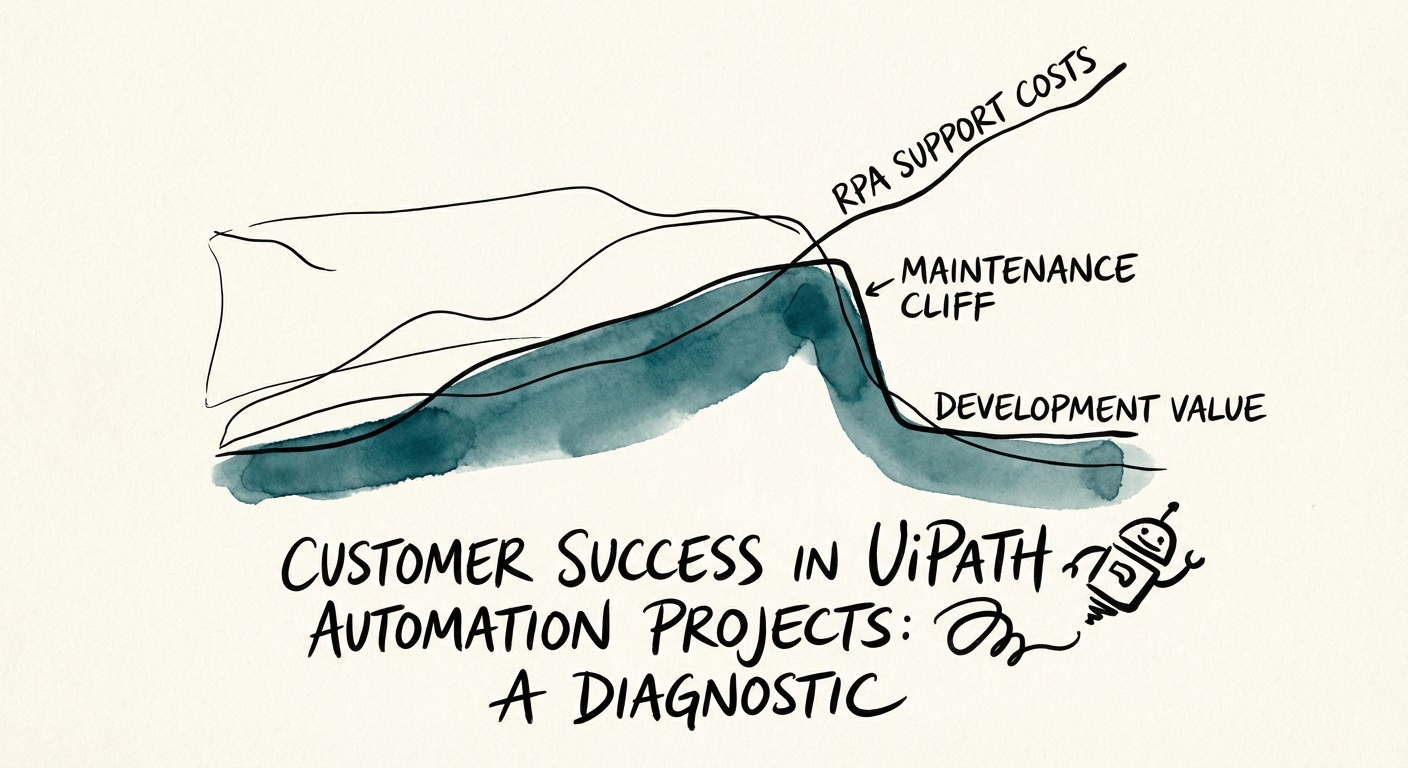
The 'Fragile Bot' Diagnostic: Why 50% of UiPath Projects Stall at Pilot
Why 50% of UiPath projects fail to scale. A diagnostic guide for COOs on the 'Maintenance Cliff', process documentation, and selecting the right automation partner.
50% Project Failure Rate
BRIEF · TEAM & HIRING
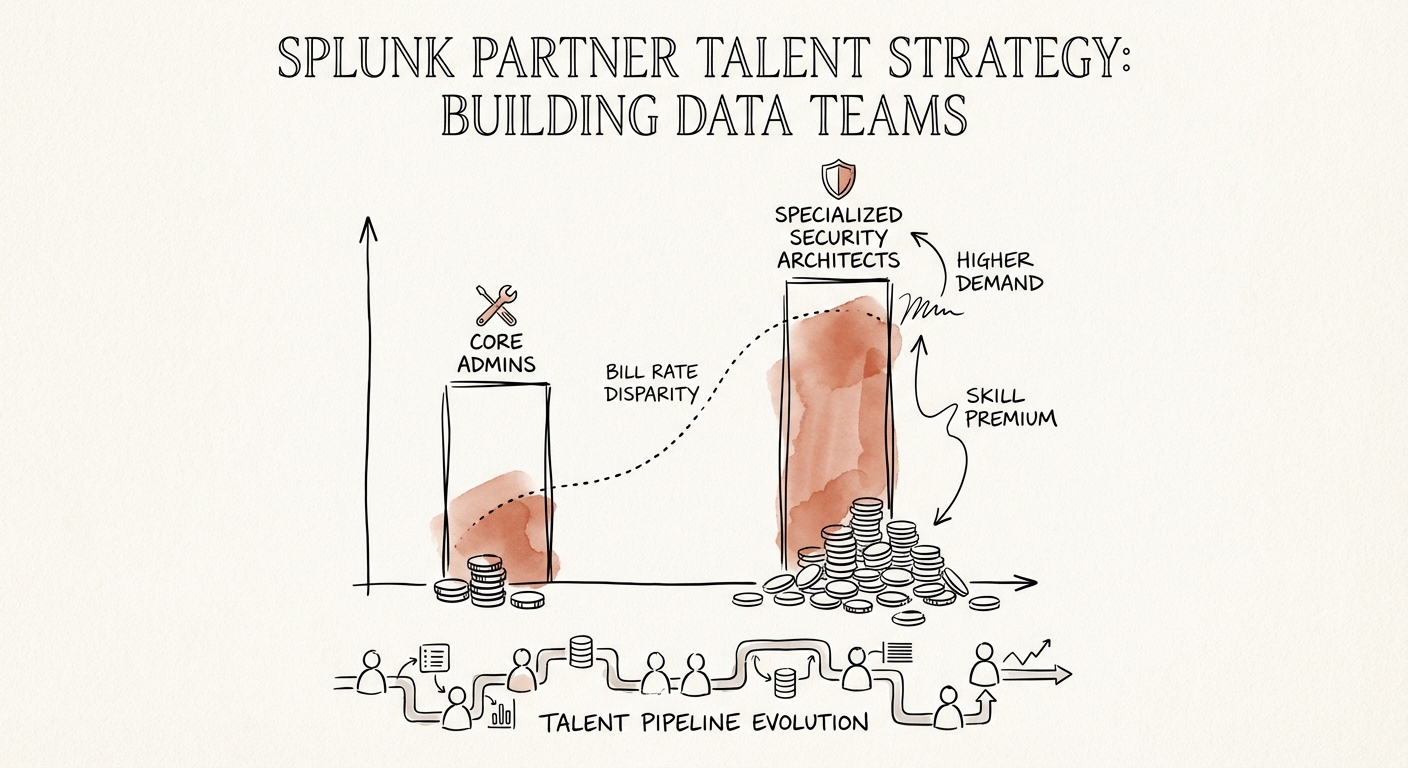
Splunk Partner Talent Strategy: The 'Badge Trap' That Kills Margins
Stop hiring generic Splunk Admins. Discover why 'Resilience Architects' drive 2.8x higher bill rates and how to pivot your talent strategy for the Cisco 360 era.
2.8x Revenue Multiplier
BRIEF · UNIT ECONOMICS
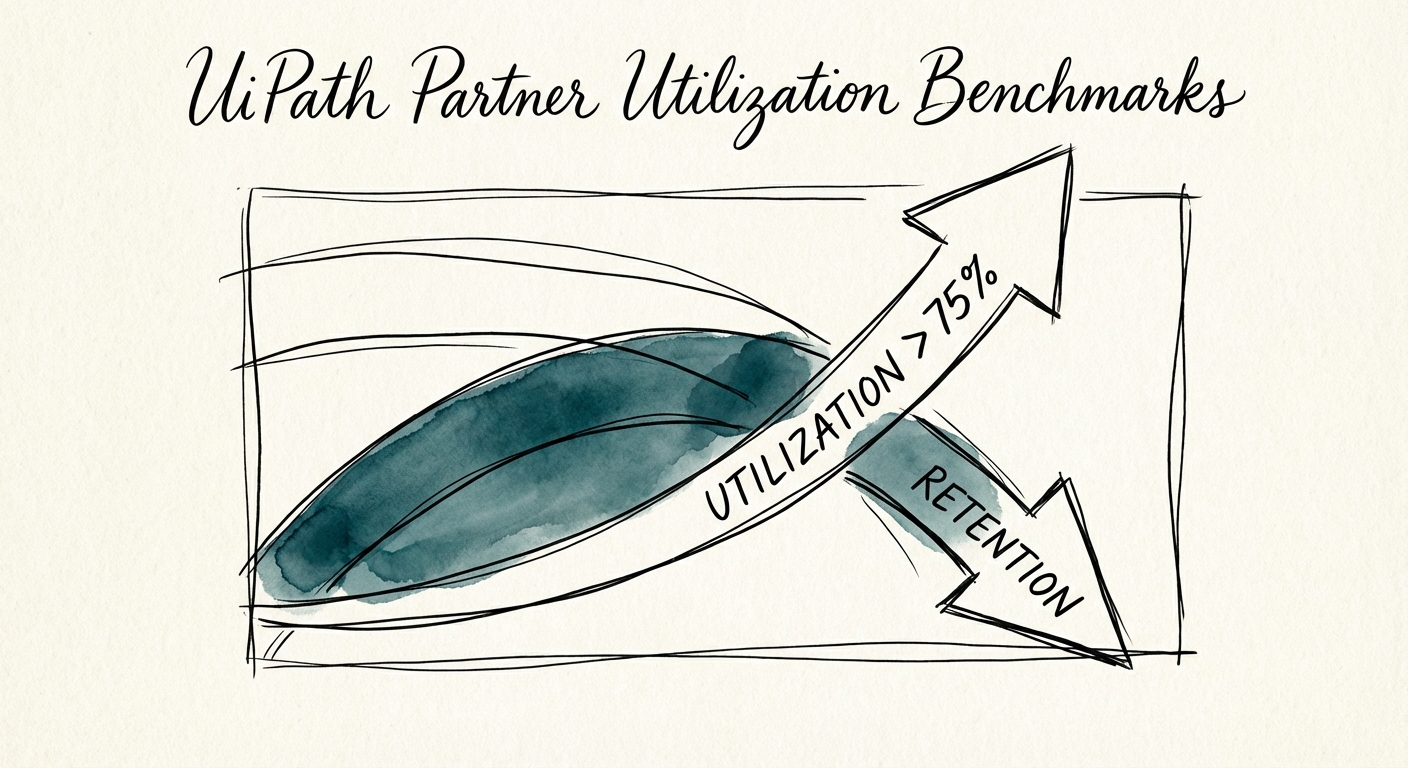
UiPath Partner Utilization Benchmarks: Why 85% Is a Trap (And the 72% Reality for USN Status)
Why 85% utilization is a red flag for UiPath partners. Discover the 2026 benchmarks for USN (UiPath Services Network) eligibility, margin impacts, and the Agentic AI pivot.
72% Optimal Billable Utilization
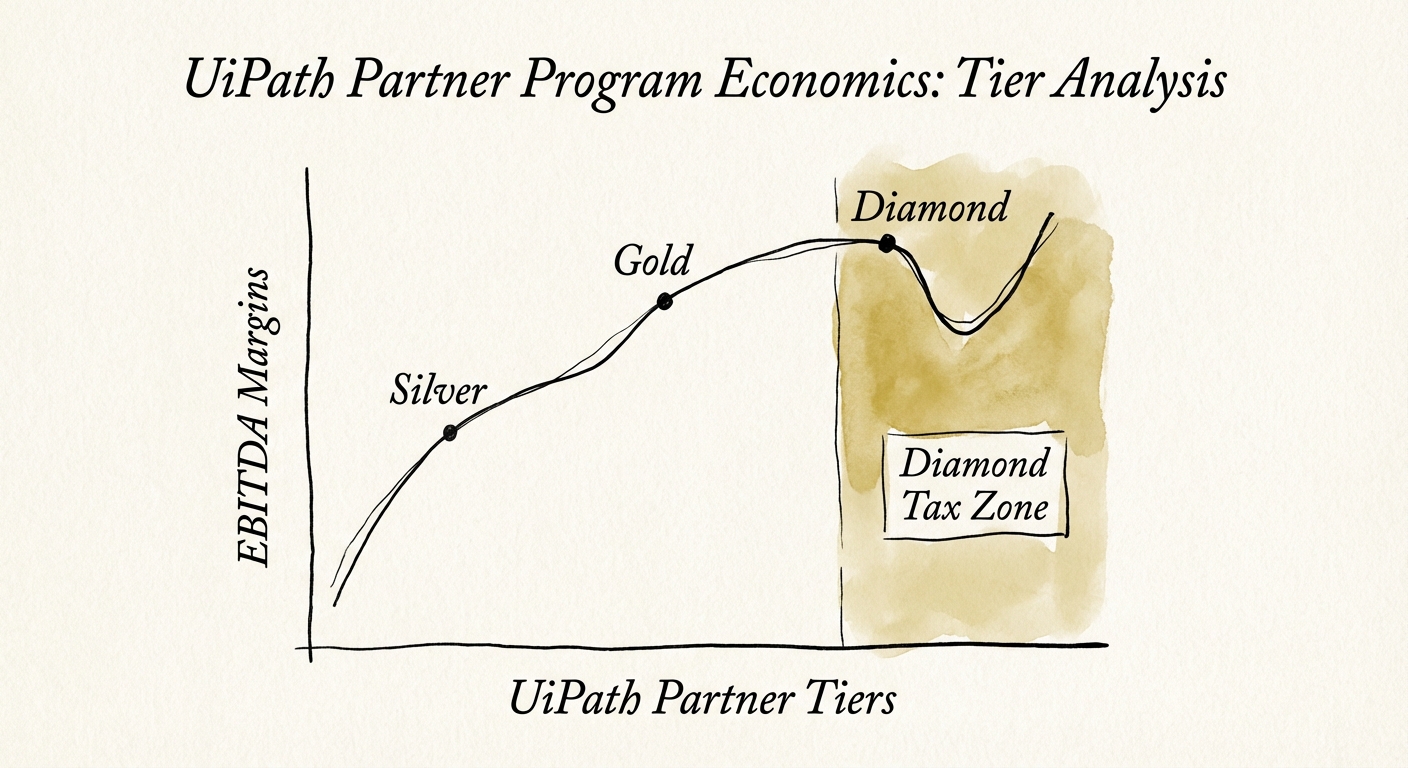
BRIEF · UNIT ECONOMICS
The UiPath Diamond Tax: Why Your Best Badge Can Wreck Your EBITDA
Why UiPath Diamond status can cost a services firm $1M in lost billable capacity, and why USN certification and a 5:1 service attach ratio actually move your multiple.
5:1 Service-to-License Multiplier
BRIEF · EXIT READINESS
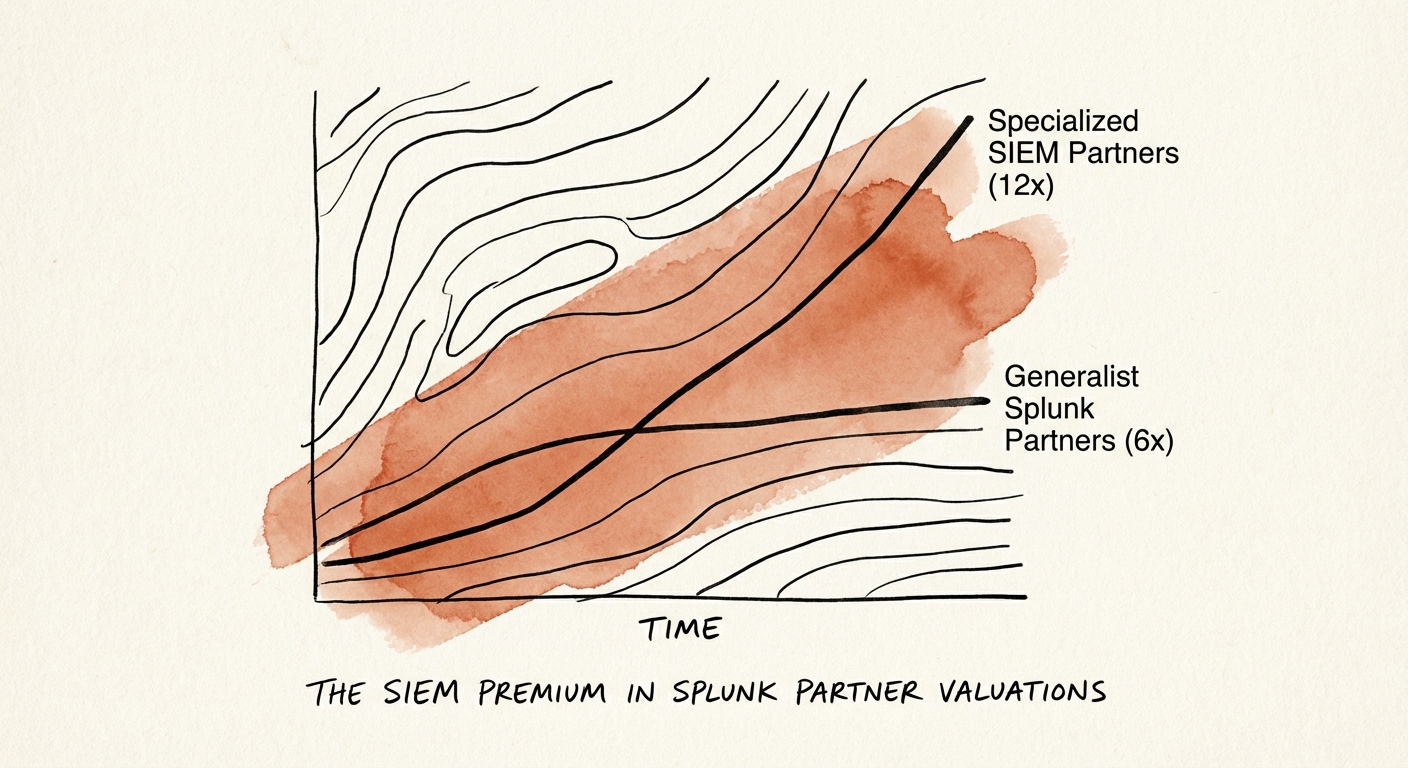
The SIEM Premium: Why 'Security' Shops Trade at 12x and 'Log Managers' Stall at 6x
Why Splunk partners with specialized SIEM and SOC capabilities trade at 12x EBITDA while generalist observability shops stall at 6x. M&A benchmarks and exit readiness guide.
12x EBITDA Multiple for Specialized SIEM Partners
BRIEF · EXIT READINESS
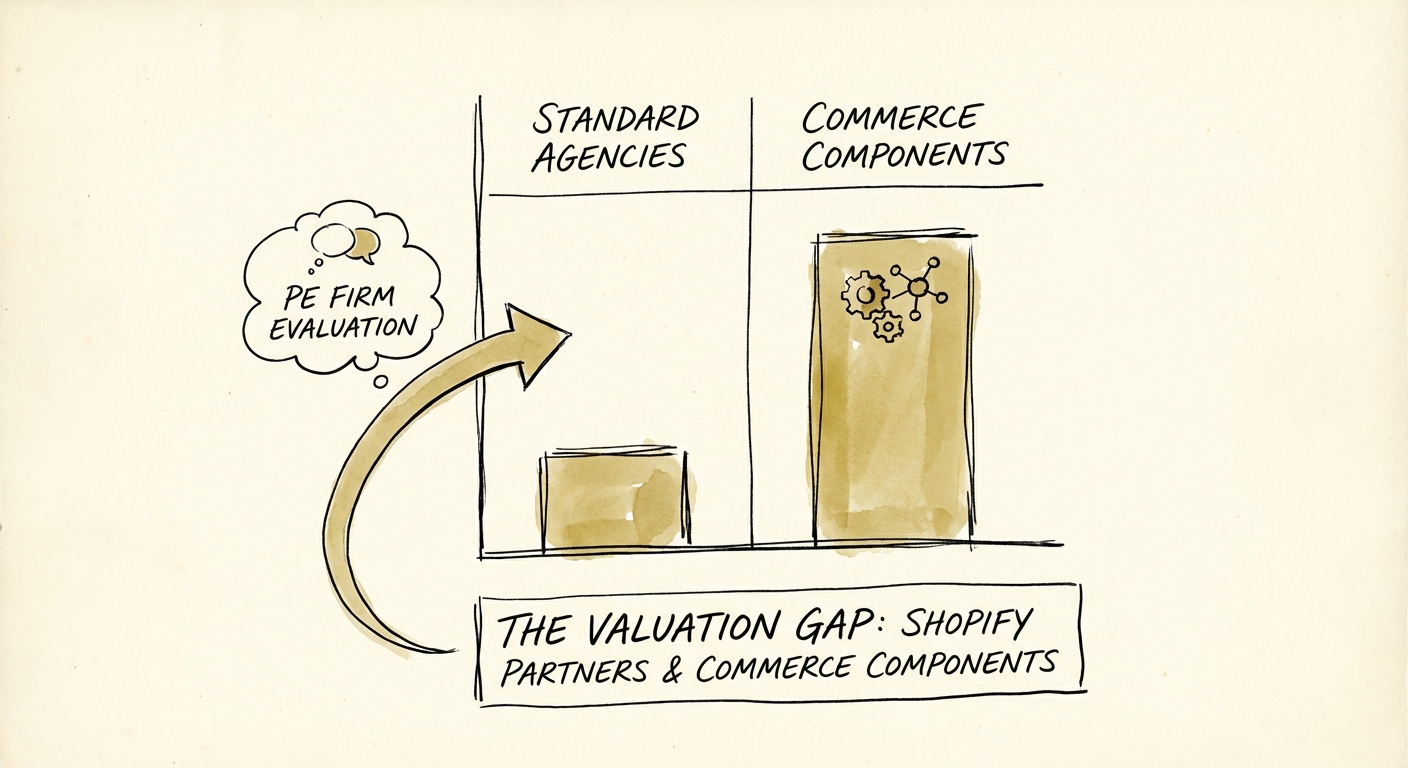
How PE Firms Evaluate Shopify Partner Acquisitions: The 2026 Diagnostic
A private equity due diligence framework for valuing Shopify agencies and apps. Analysis of the valuation gap between 'Theme Flippers' (5x) and 'Commerce Product Studios' (12x).
12x Valuation Ceiling for Elite Partners
BRIEF · EXIT READINESS
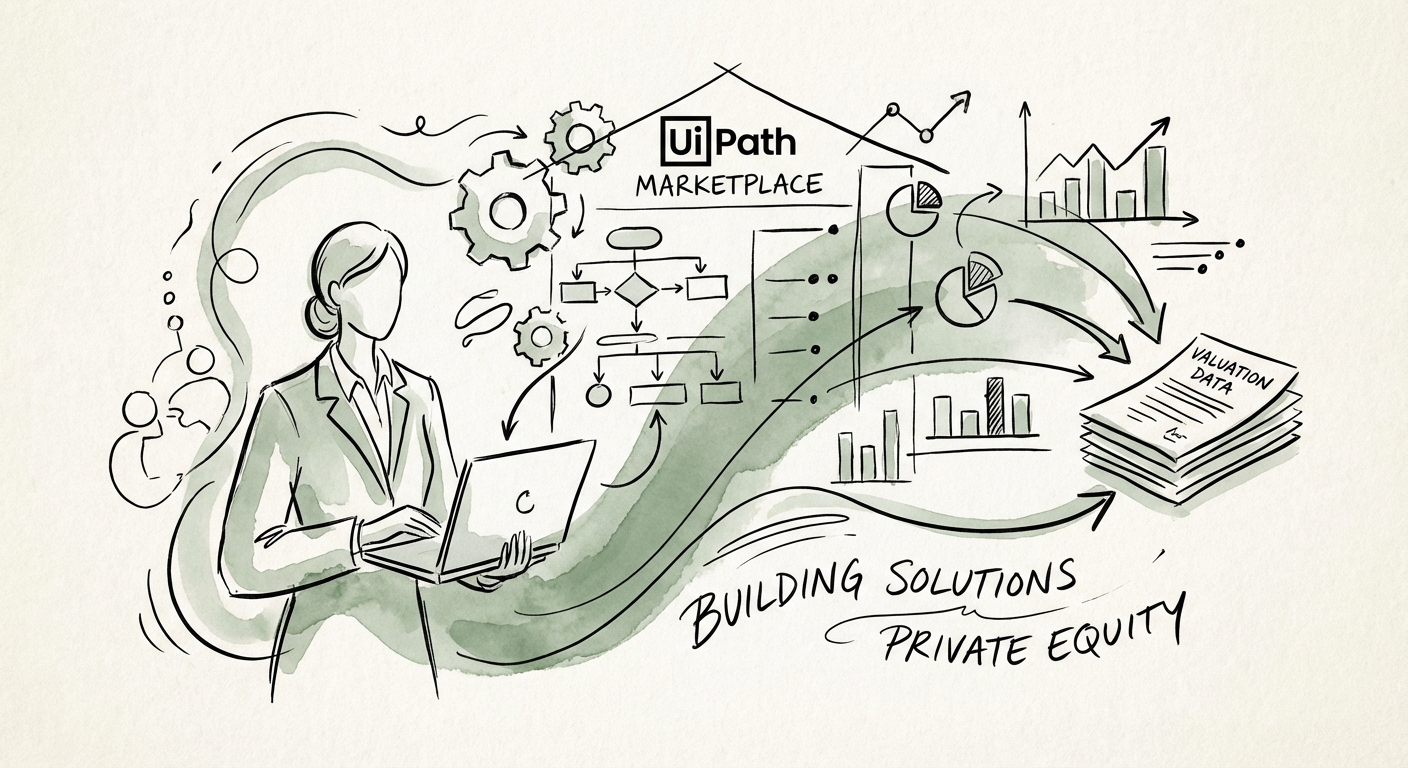
The UiPath Marketplace Multiplier: Transforming "RPA Services" into "Automation IP"
How UiPath partners can double their exit multiples by pivoting from pure services to Marketplace-led IP strategies. Valuation benchmarks and ISV playbooks.
14x Potential EBITDA Multiple for IP-Led Partners
BRIEF · TECHNICAL DEBT
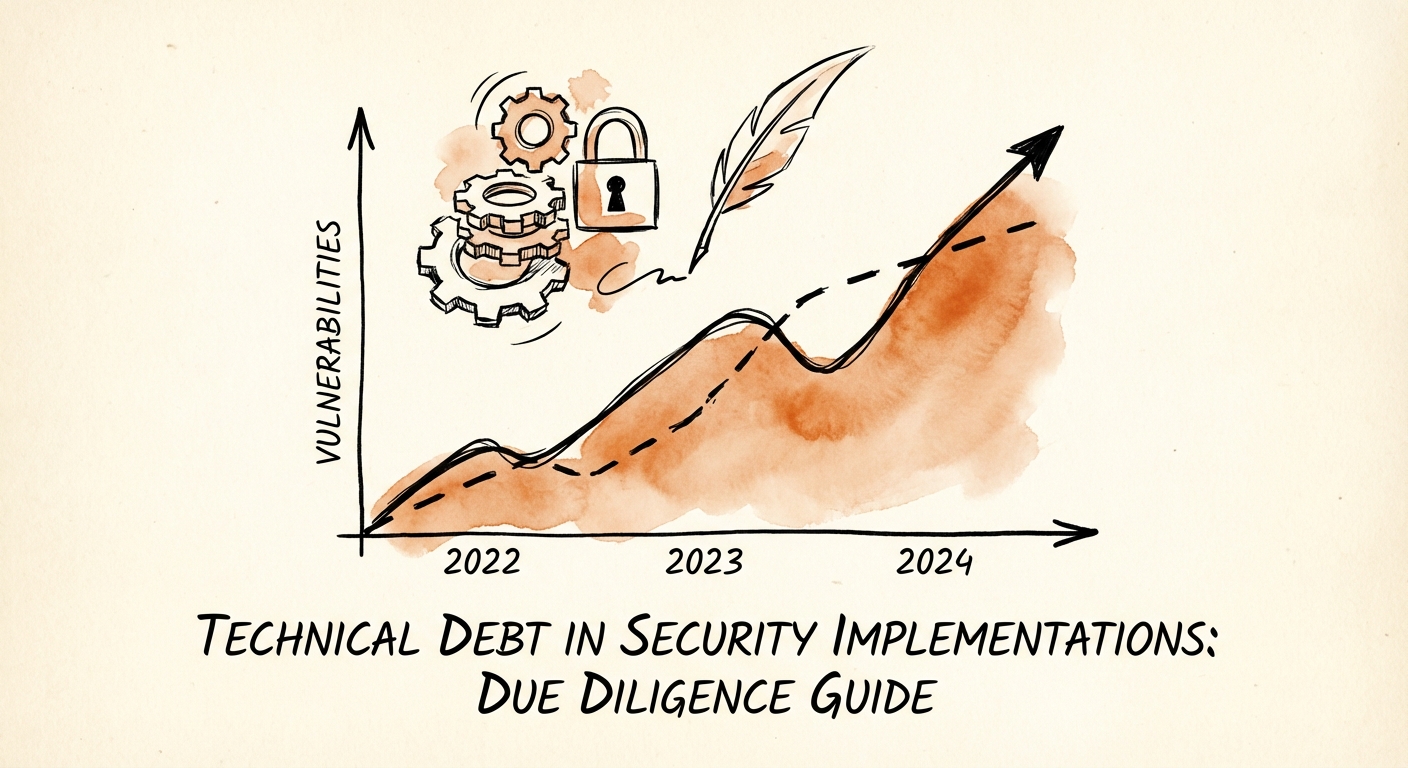
Security Technical Debt in M&A: The Diligence Line Nobody Prices
74% of codebases now carry high-risk vulnerabilities. Here's how to find security technical debt during diligence and turn it into a purchase-price adjustment.
74% Codebases with High-Risk Vulnerabilities
BRIEF · TECHNICAL DEBT
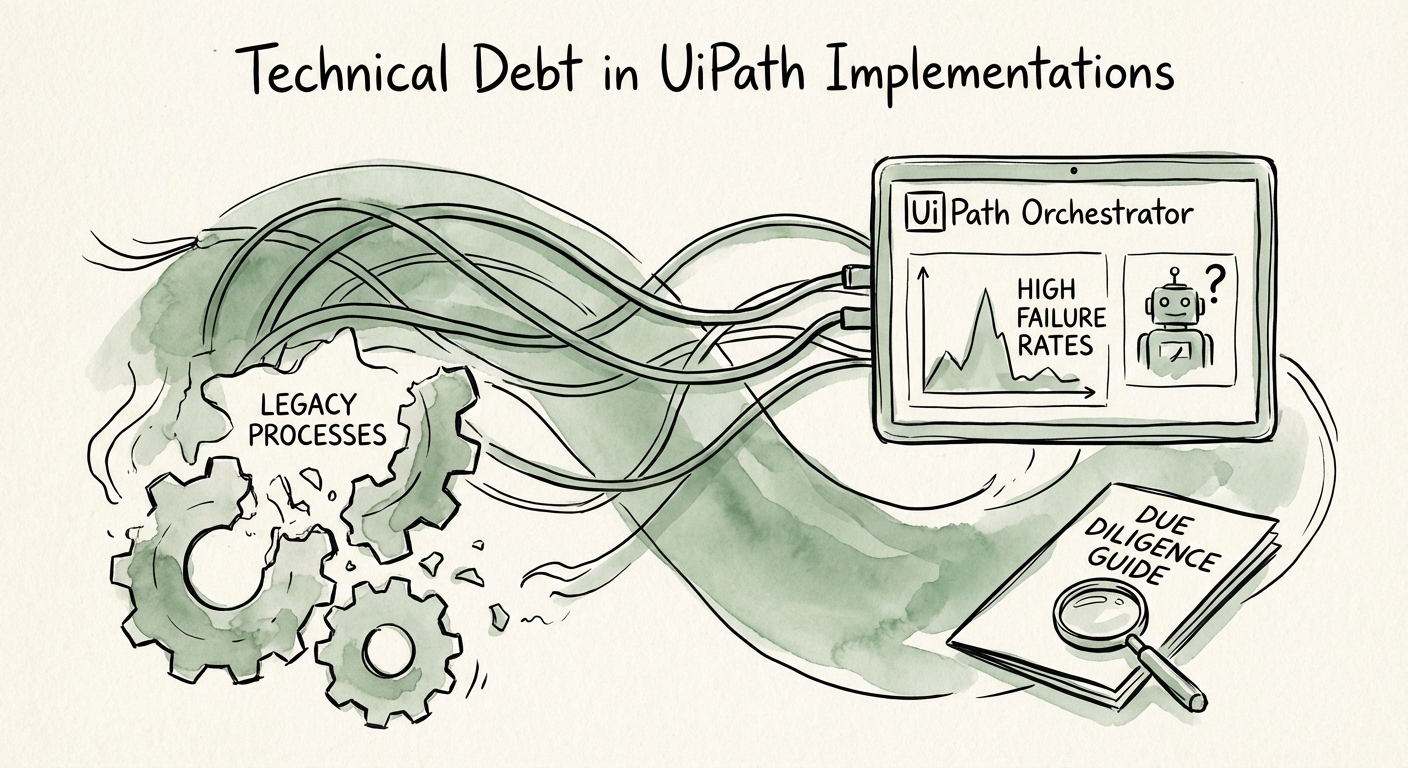
The RPA 'Black Box': Auditing UiPath Technical Debt in Due Diligence
Legacy UiPath bots and 'citizen developer' sprawl can hide $2M+ in technical debt. Here's how to audit RPA implementations before you sign the LOI.
$15,000 Annual Maintenance Liability Per 'Brittle' Bot
BRIEF · EXIT READINESS
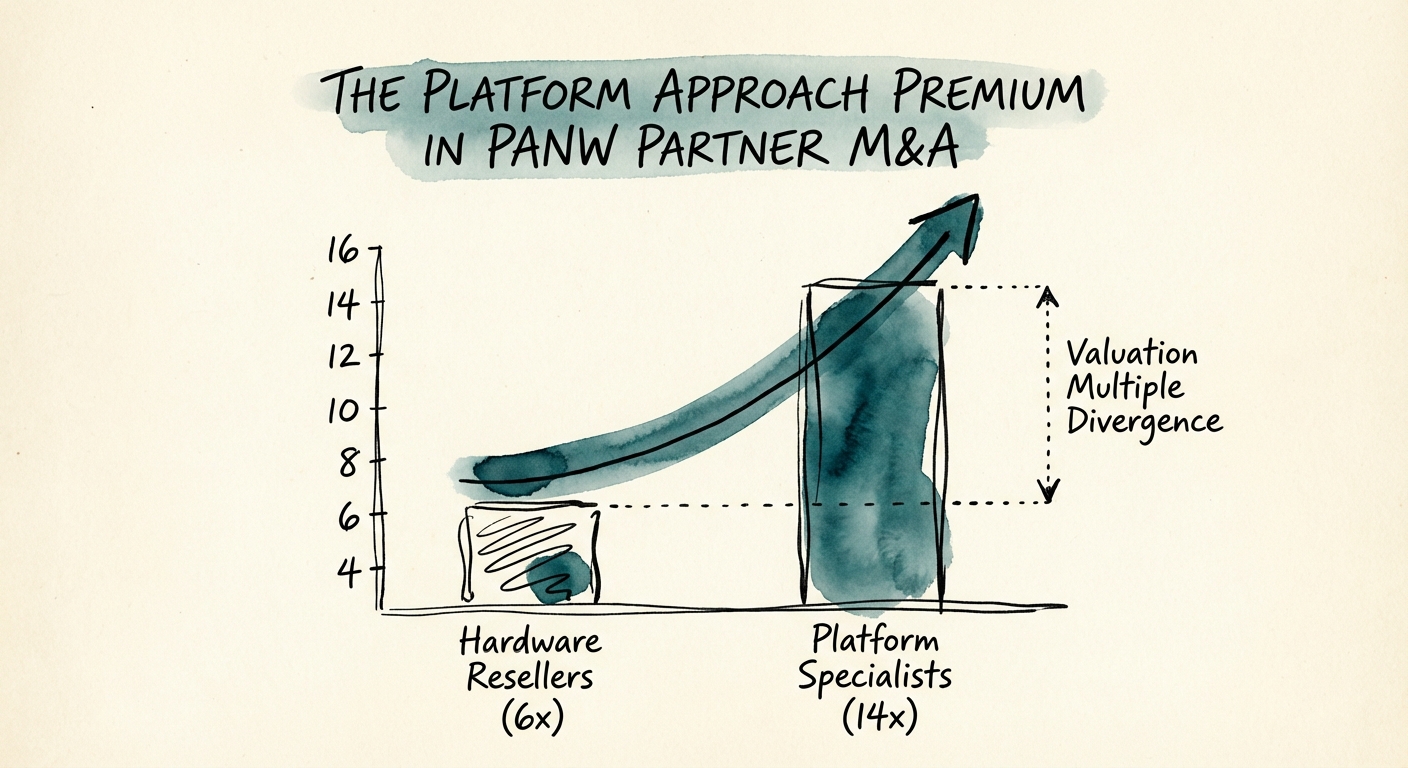
The Platform Approach Premium: Why PANW Partners with 'Cortex' DNA Trade at 14x
Why Palo Alto Networks partners specializing in Cortex and Prisma trade at 14x EBITDA while firewall resellers stall at 6x. A diagnostic for PE sponsors.
8-Turn Gap Valuation Spread (Reseller vs. Platform Partner)
BRIEF · MIGRATION & INTEGRATION
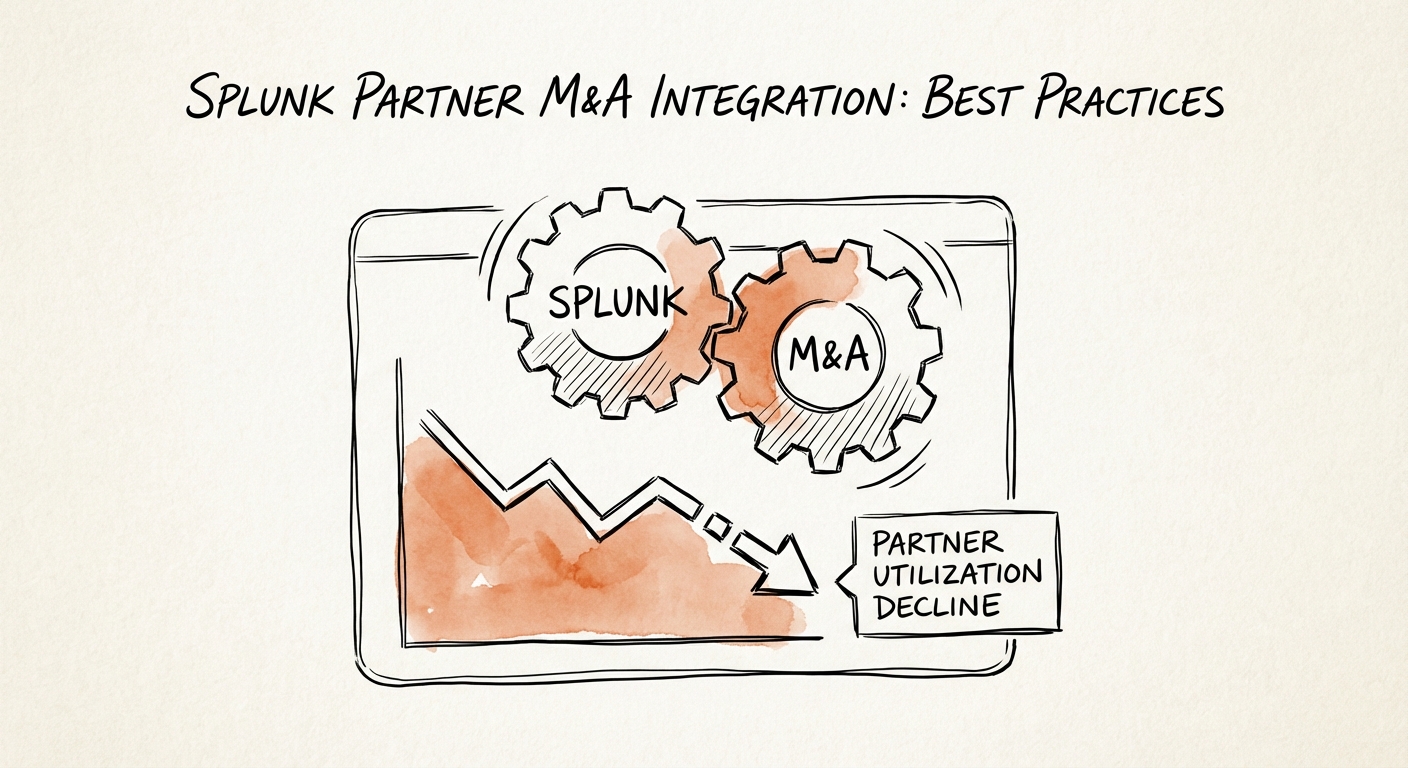
Splunk Partner M&A Integration: The Playbook for Preventing 'Brain Drain' and Protecting EBITDA
The Cisco acquisition of Splunk has created an integration minefield for PE-backed service firms. Here is the playbook for preventing the 35% talent churn that destroys deal value.
35% Avg. Talent Churn Post-Close
BRIEF · GTM EXECUTION
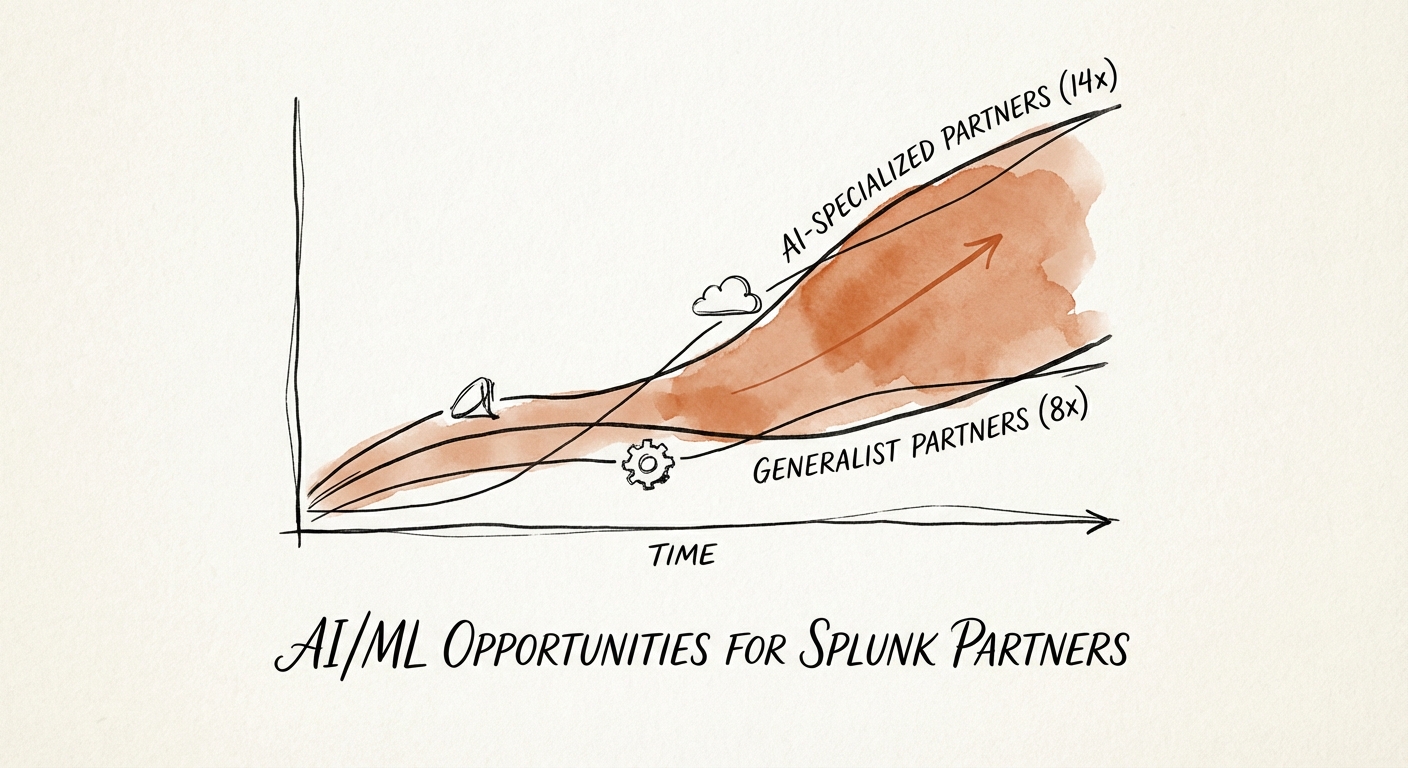
The Splunk AI Premium: Why 'Predictive' Partners Trade at 14x While 'Ingest' Shops Stall at 8x
Generalist Splunk partners trade at 8x EBITDA. AI-specialized firms commanding 'Agentic Observability' trade at 14x. Here is the diagnostic.
14x EBITDA Multiple
BRIEF · EXIT READINESS
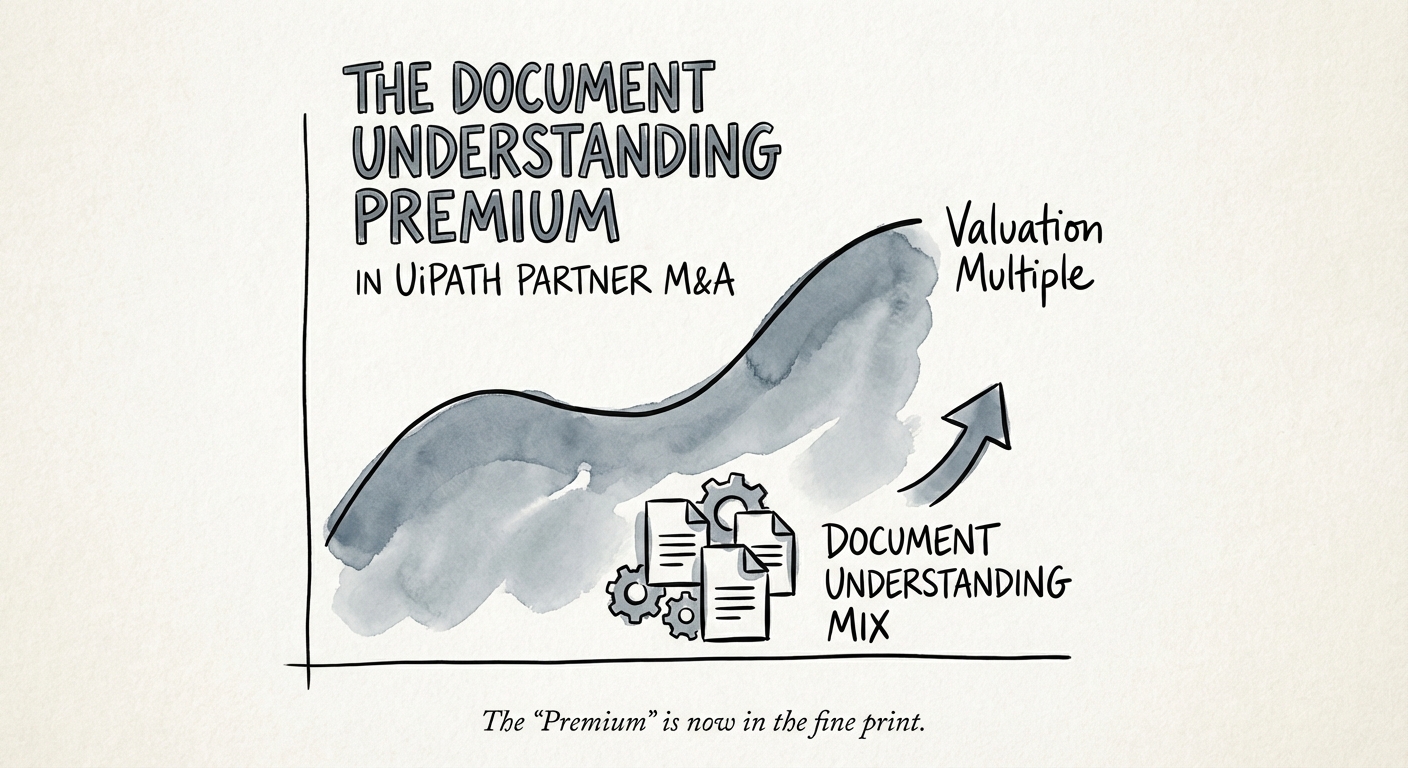
Two UiPath Shops, Same Revenue, Double the Multiple: What Document Understanding Does to a Valuation
A 40-person UiPath shop billing T&M trades at 6.5x. The same firm with a custom DU model and 85% STP trades at 13.5x. Here's the diligence that separates them.
13.5x IDP Specialist EBITDA Multiple
BRIEF · EXIT READINESS
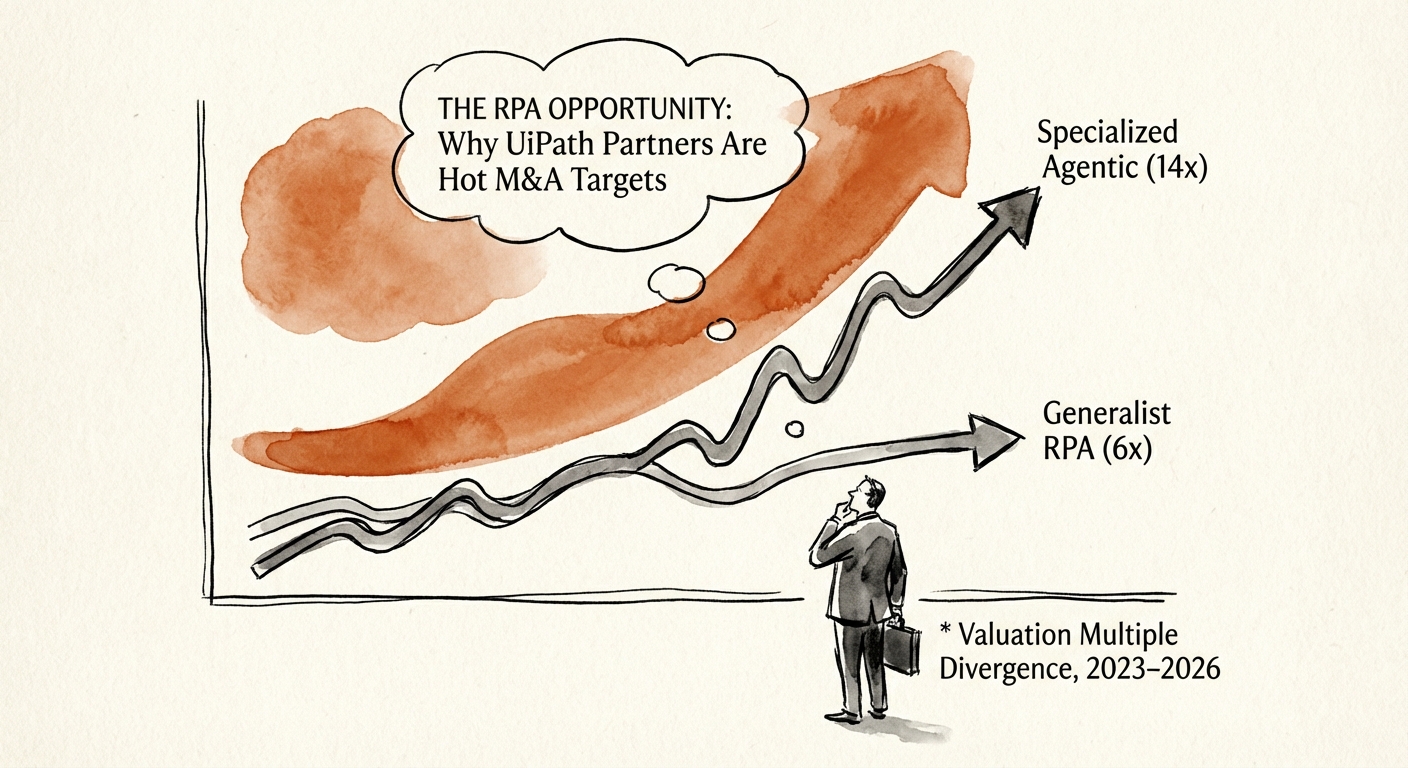
Why a UiPath Shop With 200 Bots Can Be Worth Less Than One With 20 Agents
Two UiPath partners, same revenue. One sells at 6x, the other at 14x. The difference isn't bot count — it's who owns the exception logic. Here's the diligence test.
14x EBITDA Multiple for Agentic RPA Shops
BRIEF · EXIT READINESS
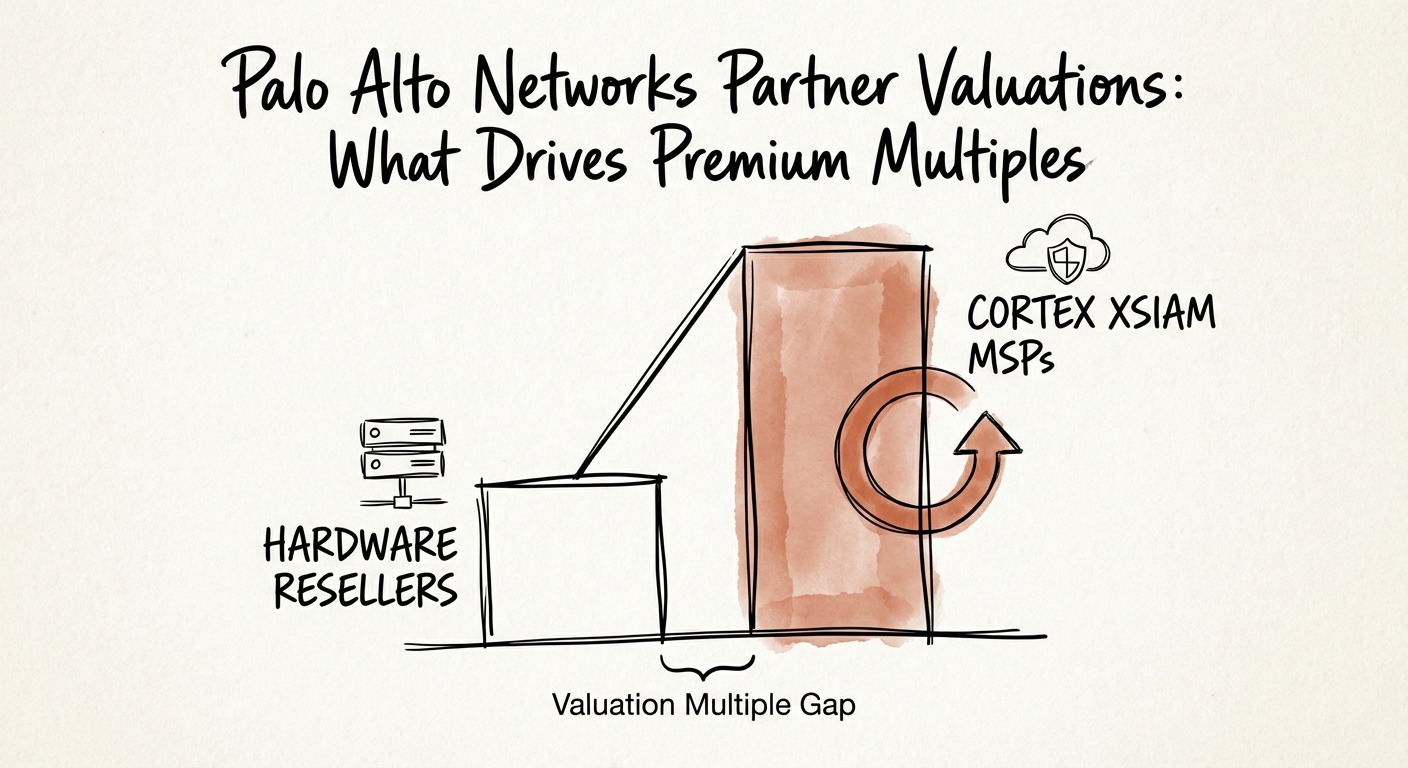
Palo Alto Networks Partner Valuations: The Gap Between 'Box Movers' and 'Platform Specialists'
Palo Alto Networks partner valuations are bifurcating. Why Cortex XSIAM and Prisma Cloud specialists trade at 14x EBITDA while firewall resellers stall at 5x.
14x vs 5x Valuation Spread (EBITDA)
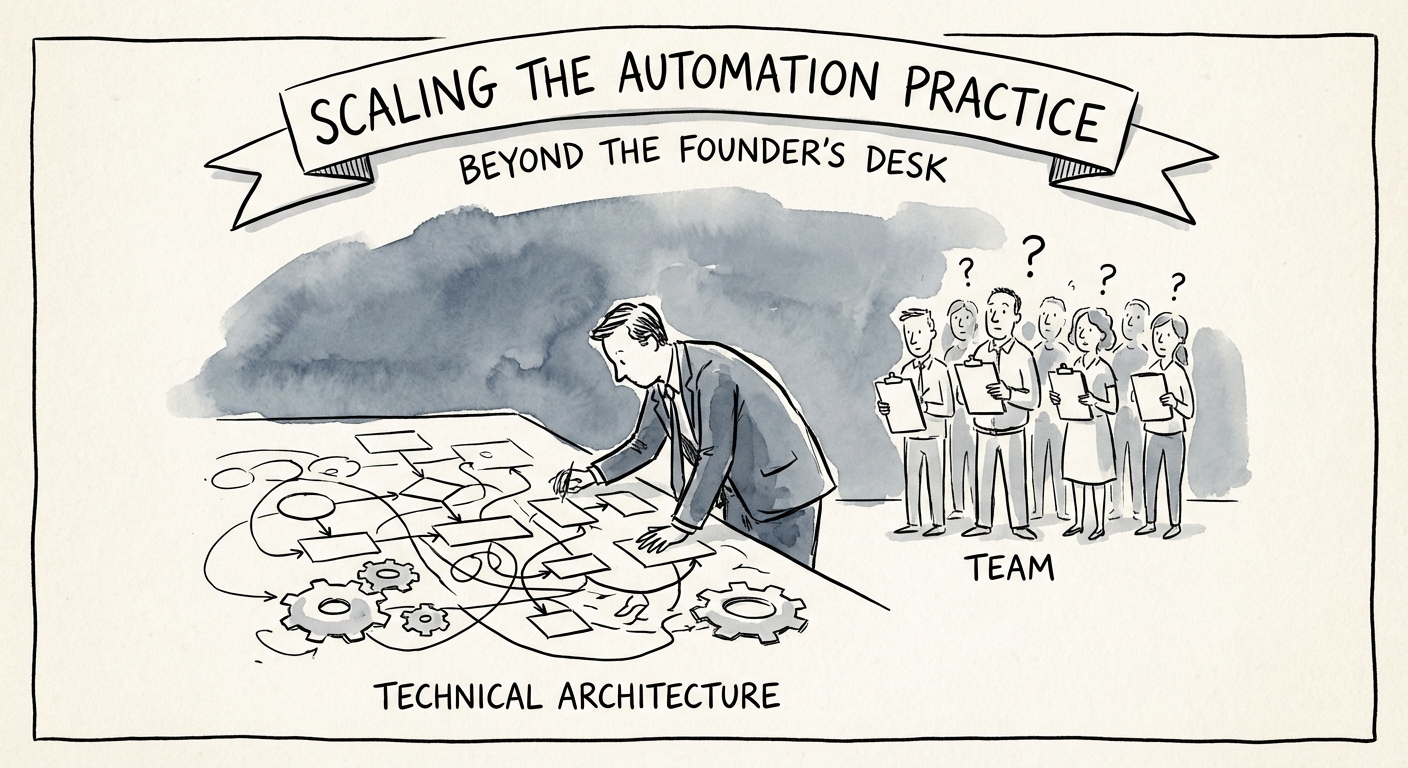
BRIEF · FOUNDER EXTRACTION
The $10M UiPath Ceiling: How to Scale Your Practice Beyond Founder 'Heroics'
Why UiPath practices stall at $10M. A diagnostic guide for founders to extract themselves from delivery, build transferable Agentic IP, and unlock 12x exit multiples.
40% Valuation Haircut for Key Person Dependency
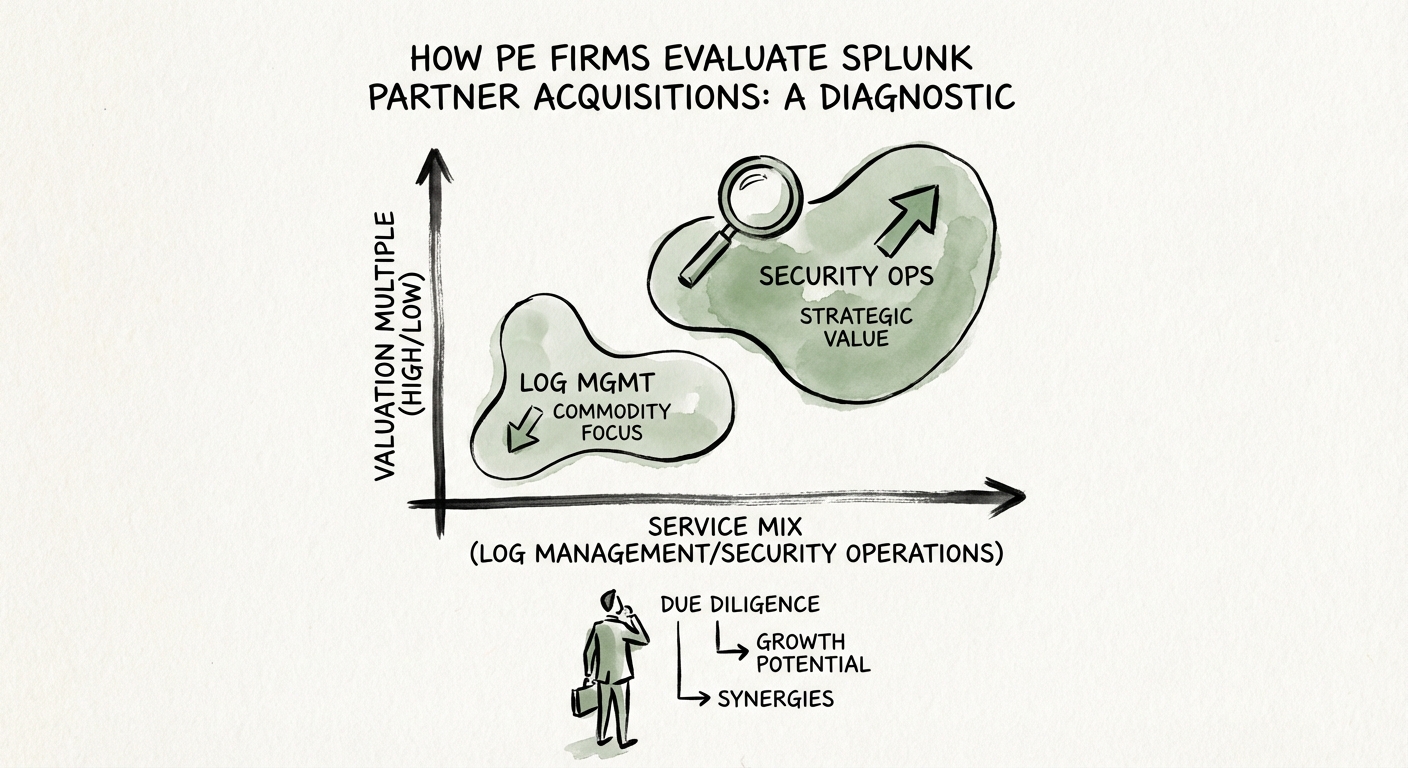
BRIEF · EXIT READINESS
How PE Firms Evaluate Splunk Partner Acquisitions: The 2026 Diagnostic
A diagnostic guide for PE firms evaluating Splunk partners. Discover why SecOps specialists trade at 12x while generalists stall at 6x.
12x Valuation Cap
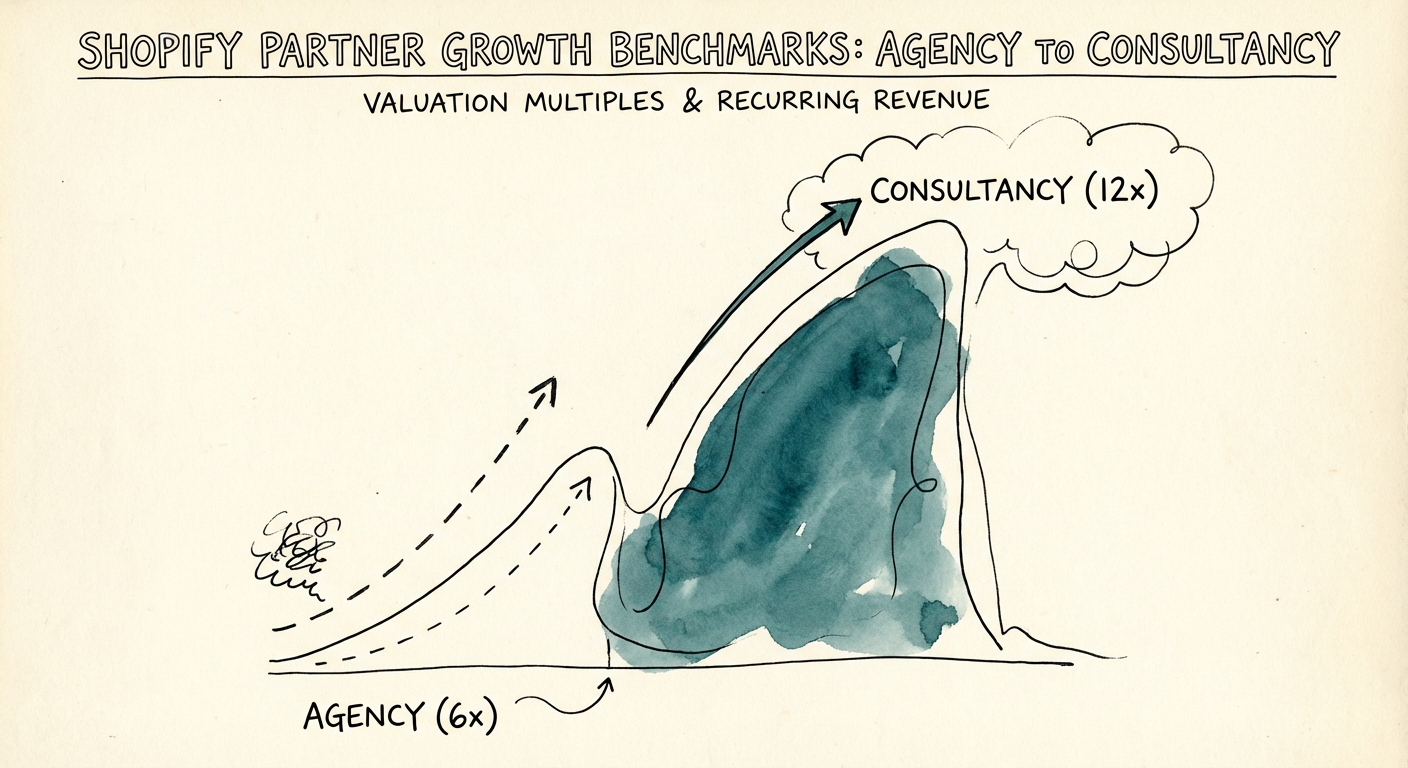
BRIEF · EXIT READINESS
Shopify Partner Growth Benchmarks: Agency to Consultancy
Shopify partners can move from agency work to consultancy value by owning commerce architecture, recurring optimization, data quality, and integration outcomes.
Recurring advisory Target Business Model Shift
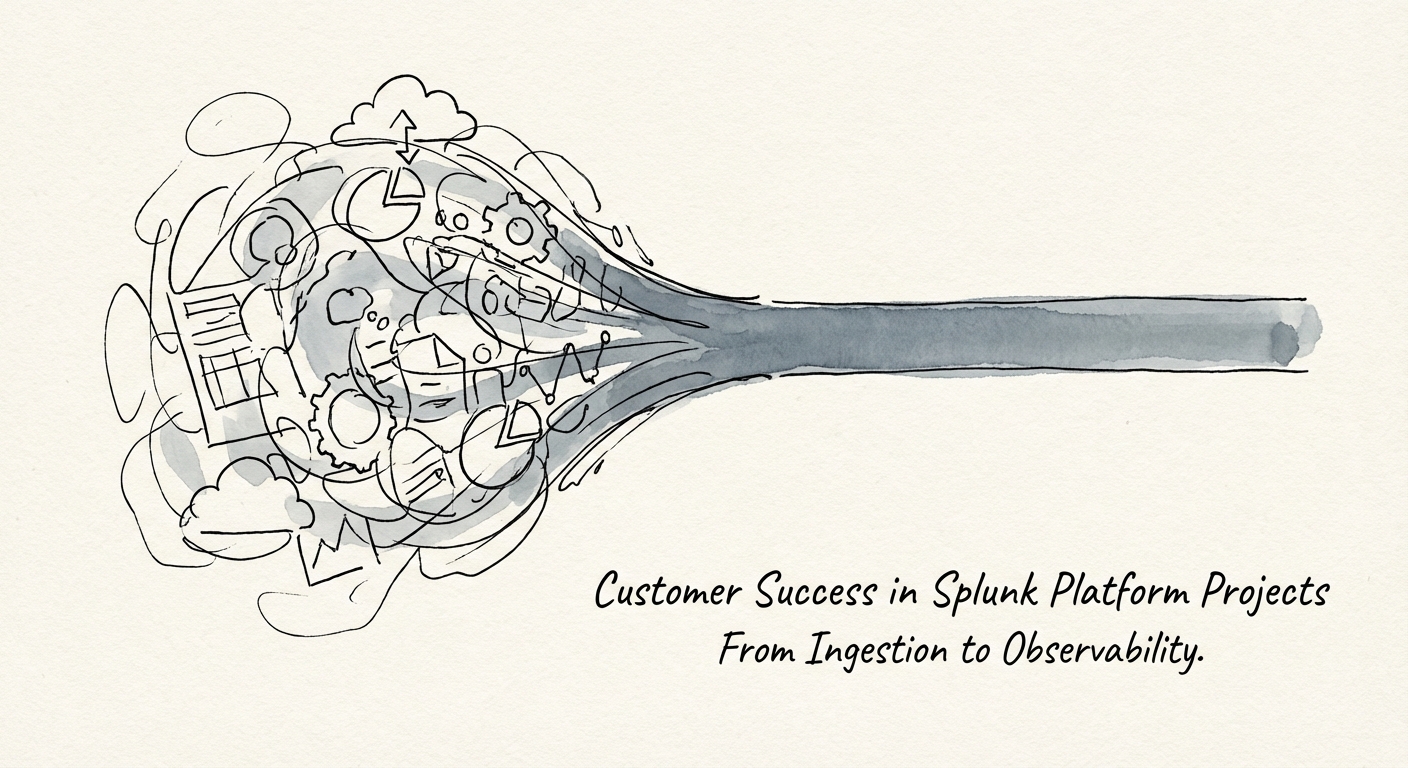
BRIEF · PROCESS DOCUMENTATION
Customer Success in Splunk Platform Projects: The 'Ingestion Trap' Diagnostic
Why 78% of Splunk implementations fail to deliver ROI despite successful 'go-lives.' A diagnostic guide for PE operating partners and scaling COOs on fixing the 'Ingestion Trap.'
22% Data-to-Insight Success Rate
BRIEF · GTM EXECUTION
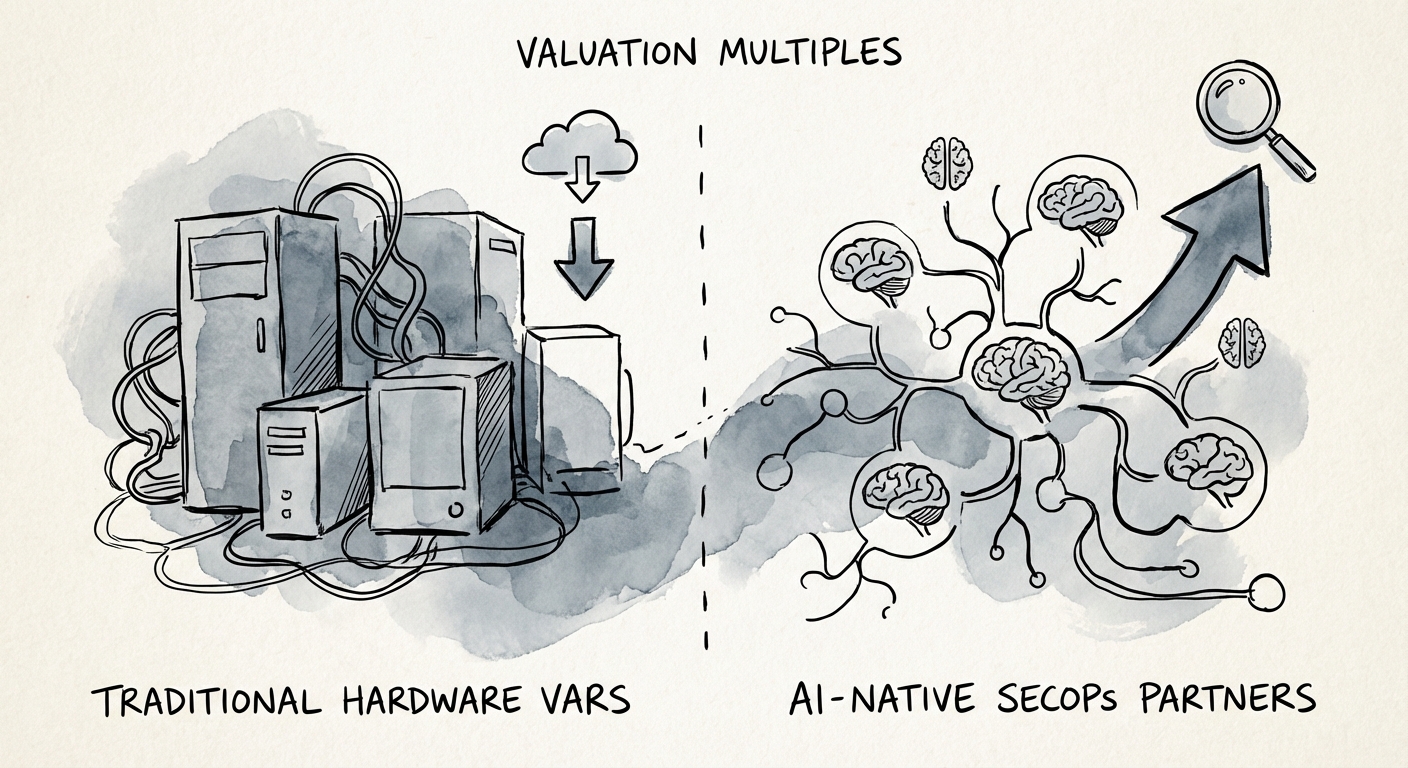
PANW Partners: Why Your XSIAM Practice Is Worth Double Your Firewall Book
A PANW partner with 40% hardware revenue trades at 6x EBITDA. One running Cortex XSIAM-driven MDR trades at 14x. Here is exactly where the gap comes from.
14x EBITDA Multiple for AI-Native SecOps Partners
BRIEF · GTM EXECUTION
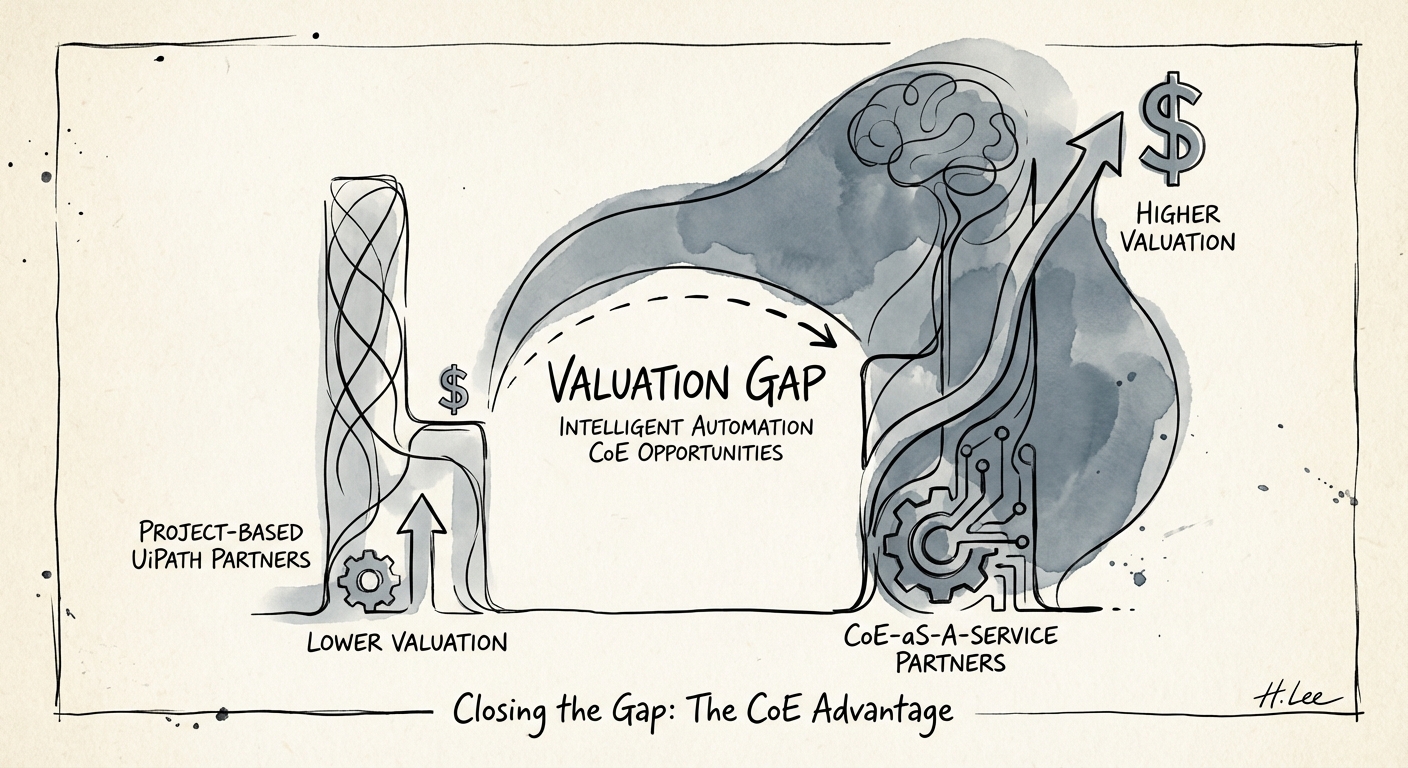
The 'Governance Premium': Why UiPath Partners with CoE Models Trade at 12x (And Bot Builders Stall at 6x)
UiPath partners stuck in 'bot building' trade at 6x EBITDA. Those with Intelligent Automation CoEs command 12x. Here is the diagnostic to pivot your model.
12x EBITDA Multiple for CoE-Led Firms
BRIEF · GTM EXECUTION
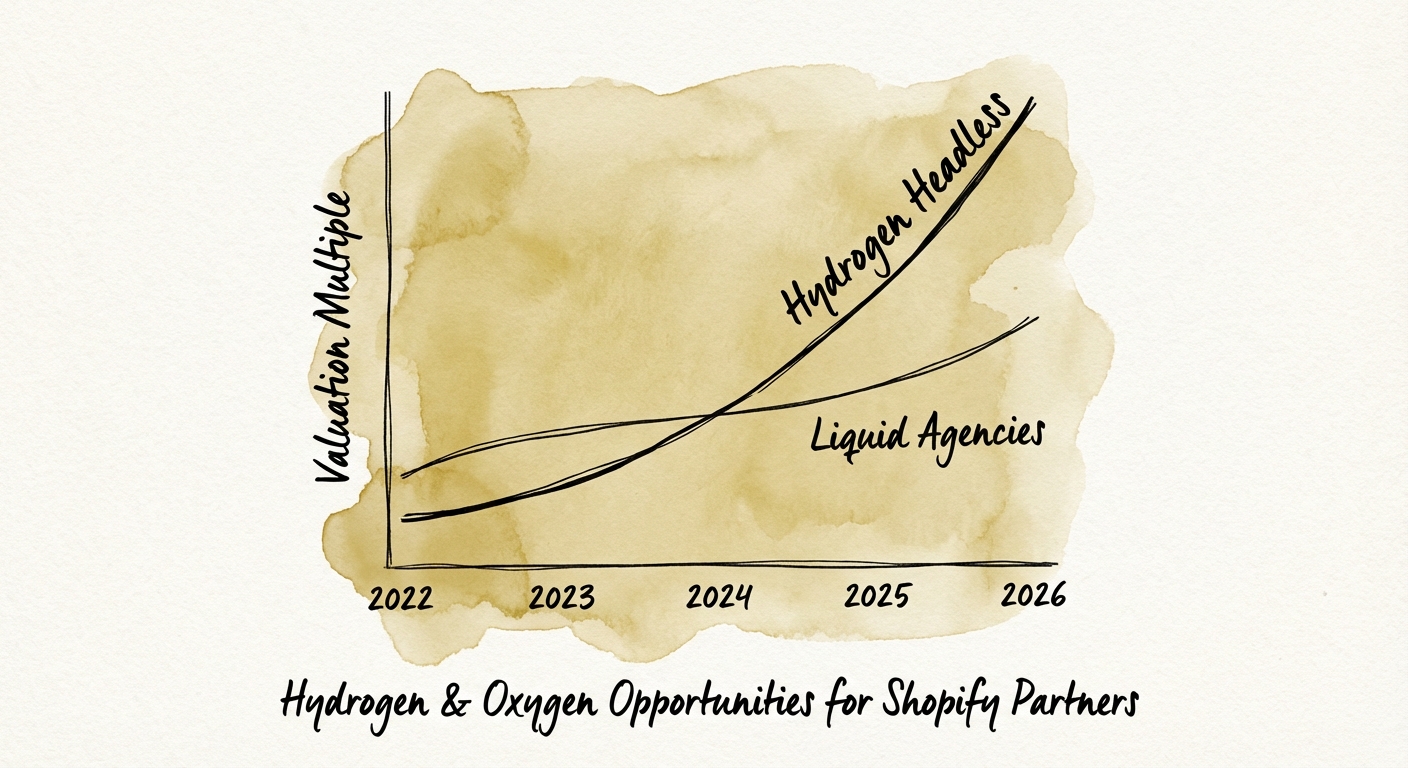
The Hydrogen Premium: Why Headless Shopify Shops Trade at 12x (And Liquid Agencies Stall at 5x)
Shopify's Hydrogen stack isn't just a technical upgrade—it's a valuation multiplier. Learn why headless practices trade at 12x while Liquid shops stall at 5x.
12x Valuation Multiple
BRIEF · TEAM & HIRING
PANW Partner Talent Strategy: The $240k 'Paper Tiger' Trap
Benchmarks for hiring and retaining Palo Alto Networks talent. Why PCNSE certification-only hires cost $240k and how to build elite Strata, Prisma, and Cortex teams.
$240,000 Replacement Cost for a Senior Prisma Architect