BRIEF · EXIT READINESS
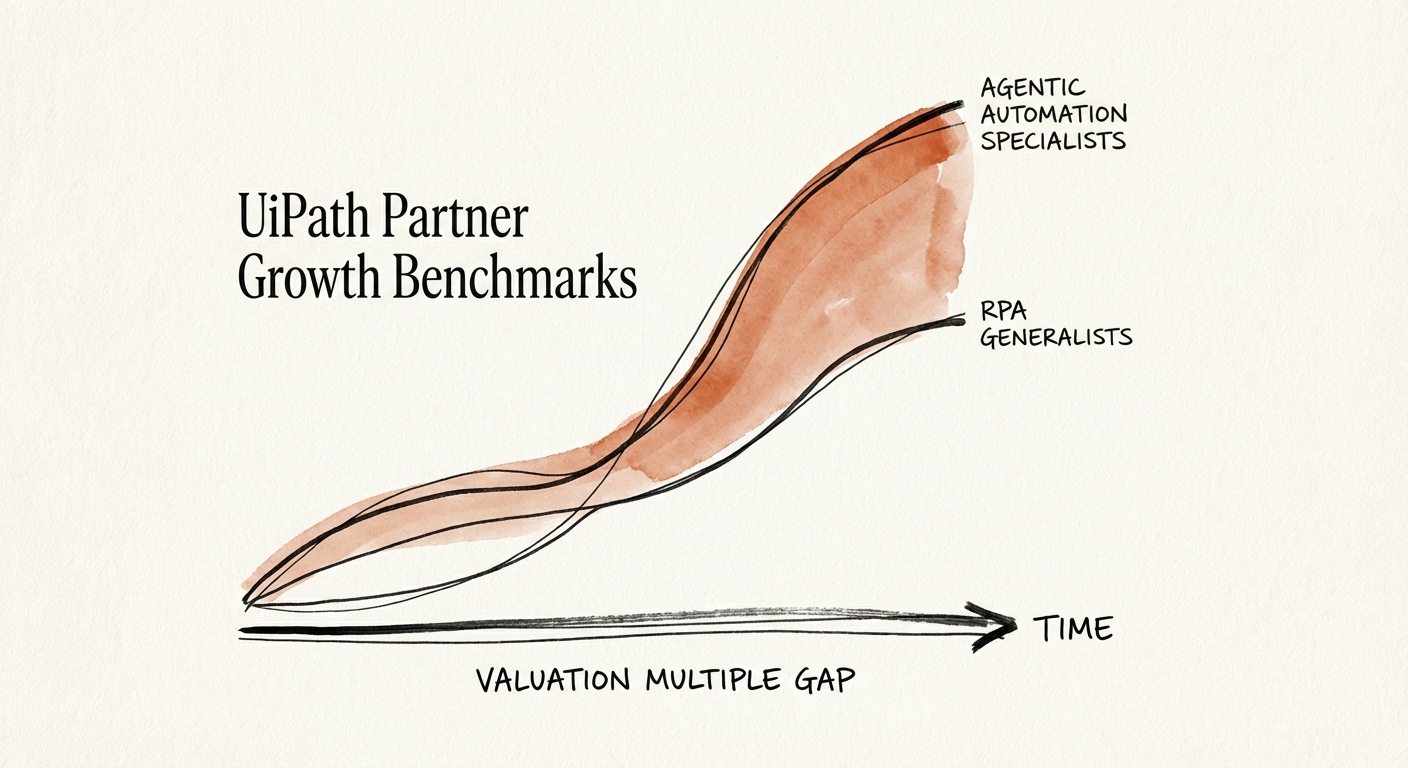
UiPath Partner Growth Benchmarks: The Gap Between "RPA Body Shops" and "Agentic Strategy" Firms
Data-driven guide for UiPath partners: Revenue benchmarks, valuation multiples (6x vs 12x), and the shift from RPA implementation to Agentic Automation.
13.6x Potential EBITDA Multiple for Specialized AI Automation Partners
BRIEF · UNIT ECONOMICS
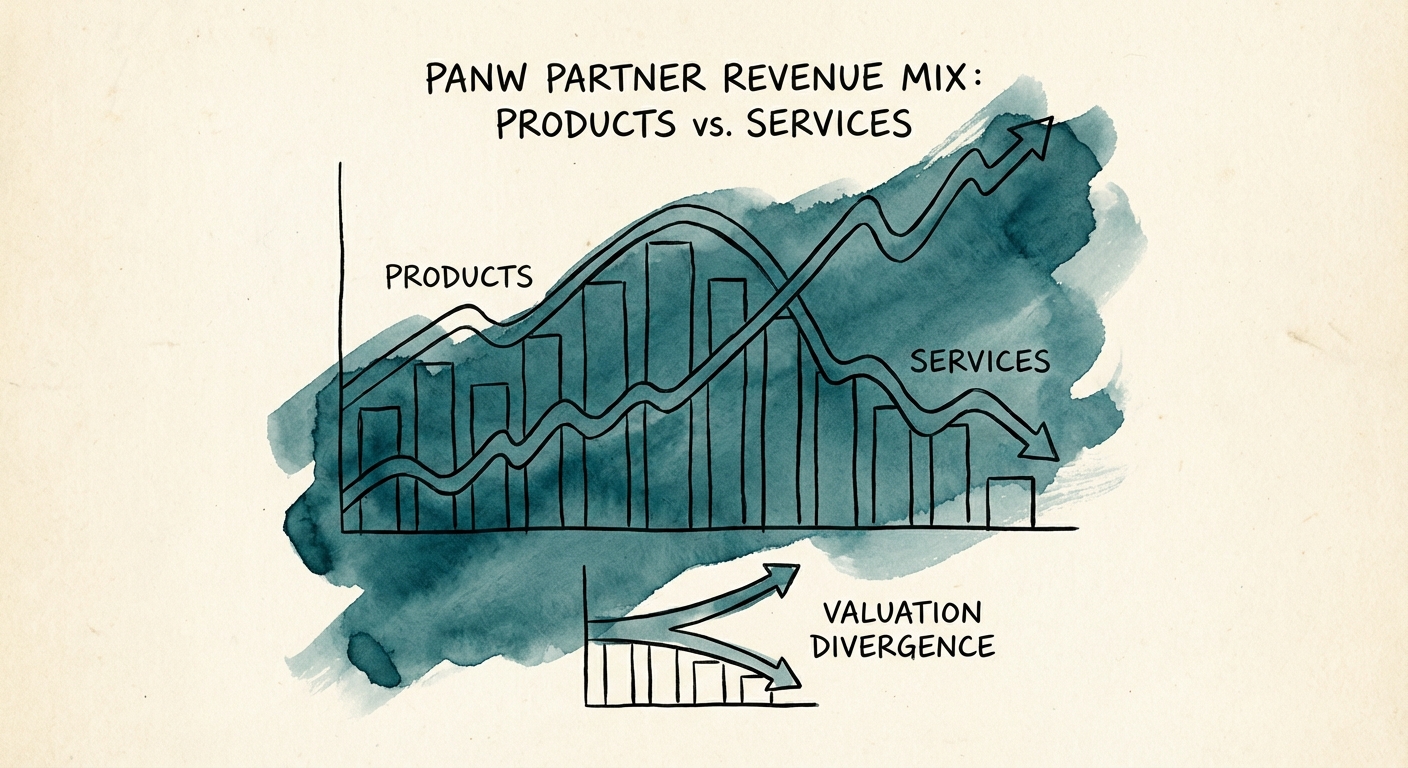
The Resale Trap: Why Your $50M Palo Alto Networks Practice Is Worth Less Than You Think
Is your Palo Alto Networks practice valued as a reseller or a strategic partner? We diagnose the valuation gap between product-heavy and services-led firms.
4x Valuation Multiple Gap
BRIEF · UNIT ECONOMICS
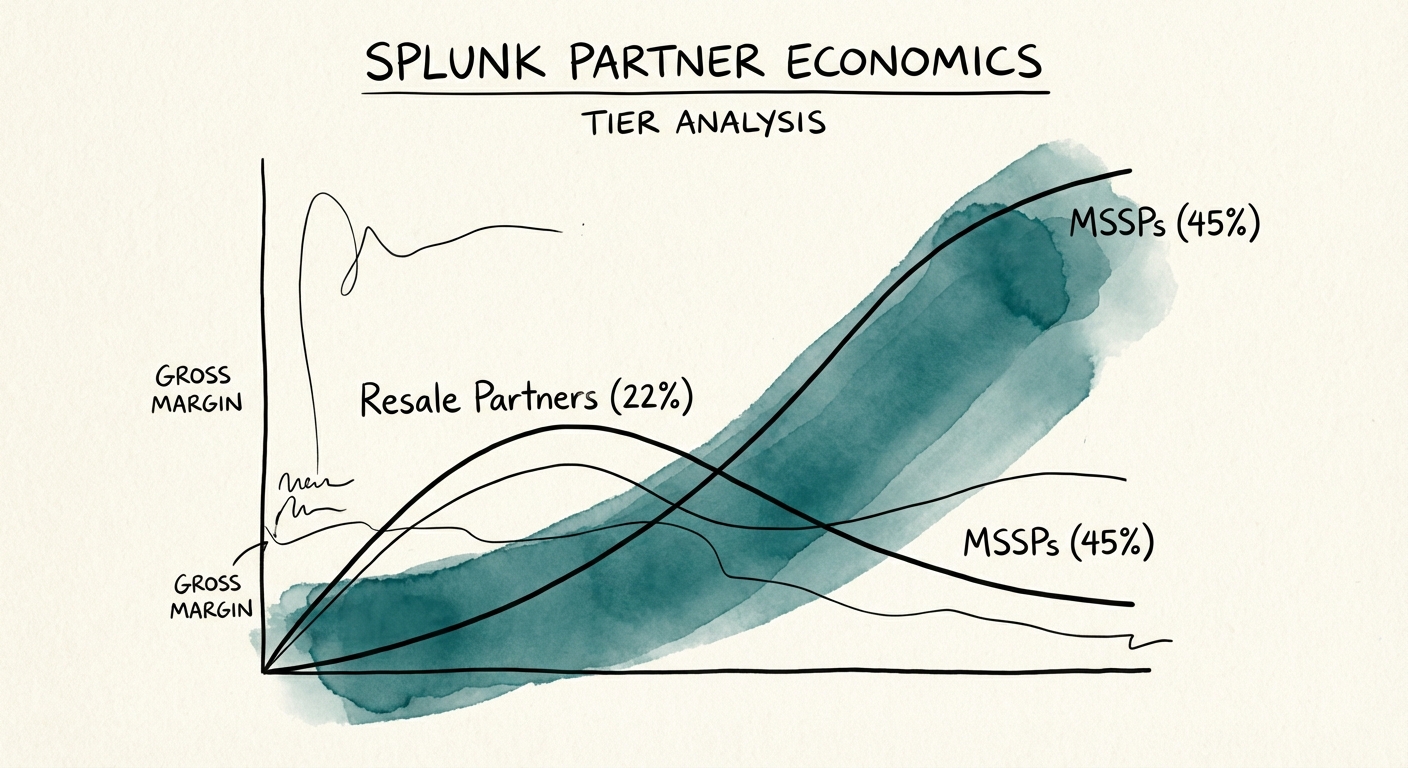
Splunk Partner Economics: The Gap Between 'Premier' Status and 'Elite' Value in the Cisco Era
A diagnostic guide for Splunk partners navigating the Cisco 360 transition. Analysis of Partnerverse tiers, unit economics, and the valuation gap between resale and managed services.
45% Gross Margin Target (Managed Services)
BRIEF · EXIT READINESS
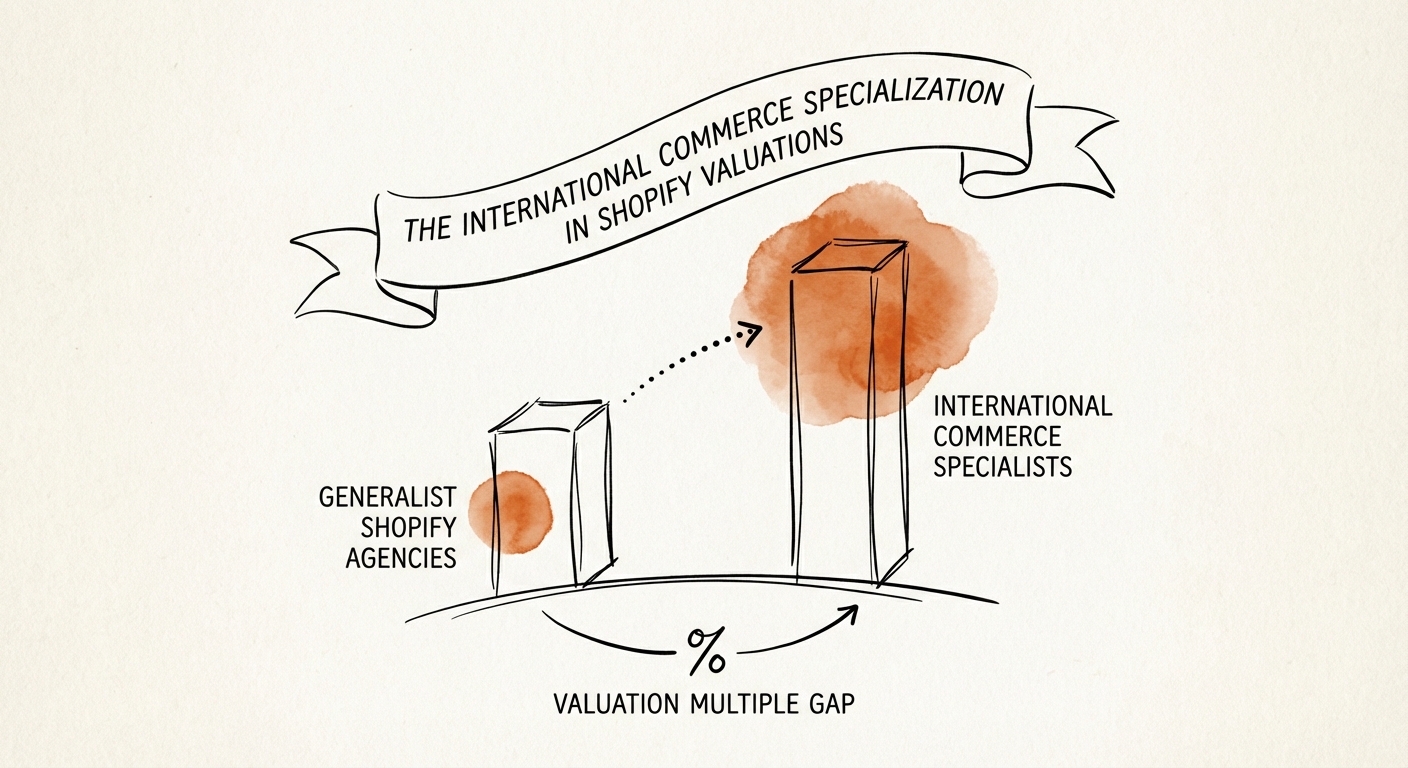
The Cross-Border Premium: Why International Commerce Specialists Trade at 12x While Generalists Stall at 6x
Generalist Shopify agencies trade at 6x. International commerce specialists trade at 12x. Here is the diagnostic to pivot your practice toward the cross-border premium.
12x Specialist EBITDA Multiple
BRIEF · REVENUE ARCHITECTURE
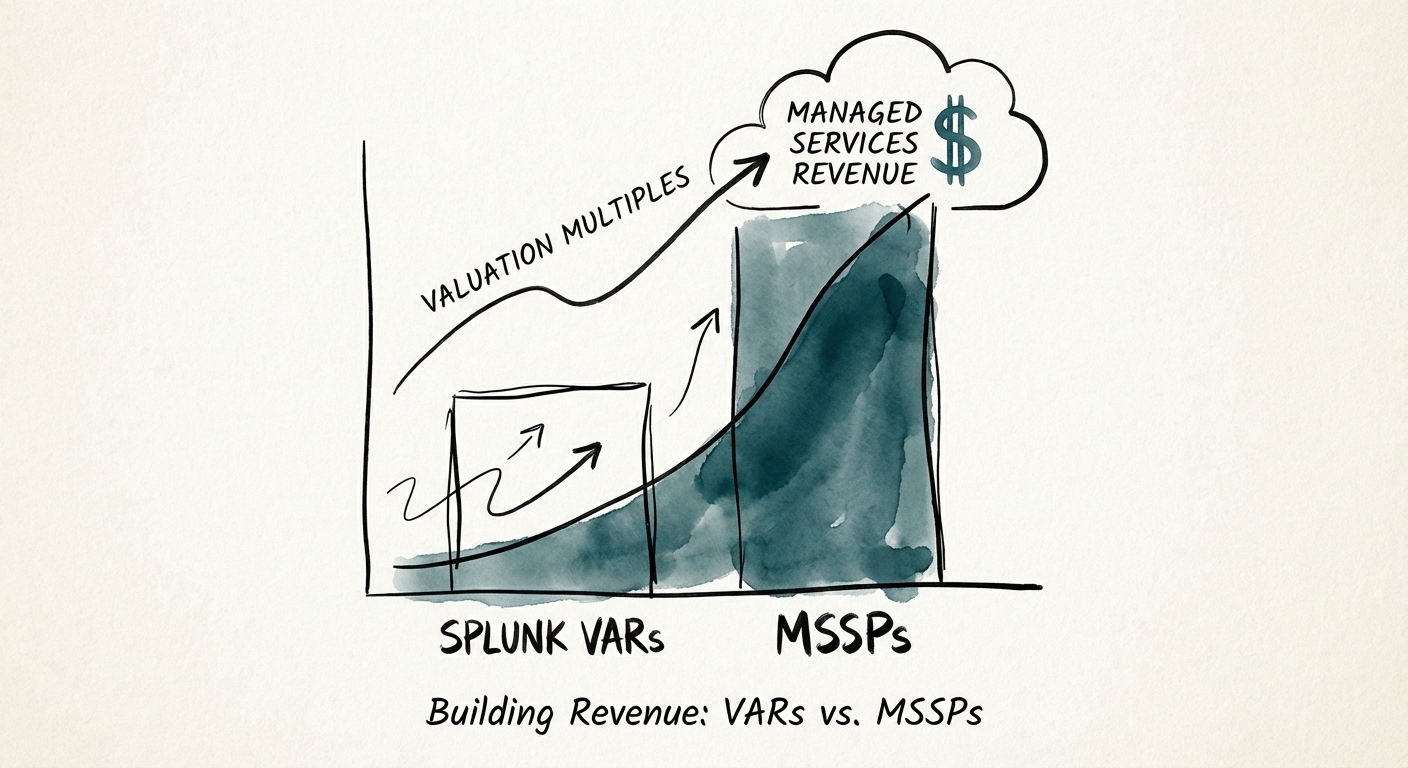
How to Build Managed Services Revenue with Splunk: The 'Ingest Trap' vs. The MDR Premium
Stop reselling Splunk licenses and start selling outcomes. Learn how to pivot from a 5x EBITDA VAR to a 14x EBITDA MSSP by building a Managed Detection and Response (MDR) practice.
14x EBITDA Valuation for MSSPs
BRIEF · FOUNDER EXTRACTION
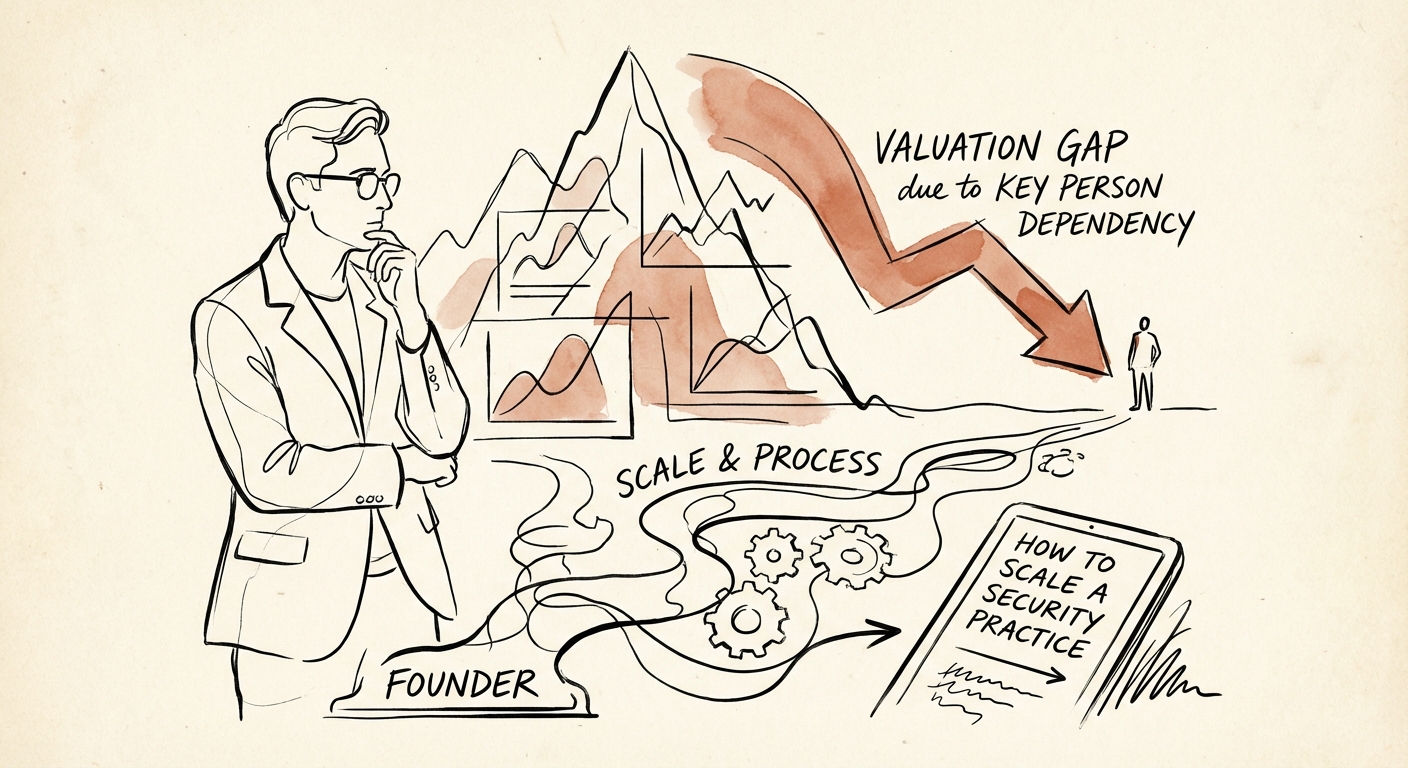
How to Scale a Security Practice Beyond Founder Dependencies
Founder-led security practices face a 30-50% valuation discount. Learn how to extract yourself from the 'Hero CISO' role, scale operations, and unlock premium exit multiples.
50% Valuation Discount for Founder Dependency
BRIEF · EXIT READINESS
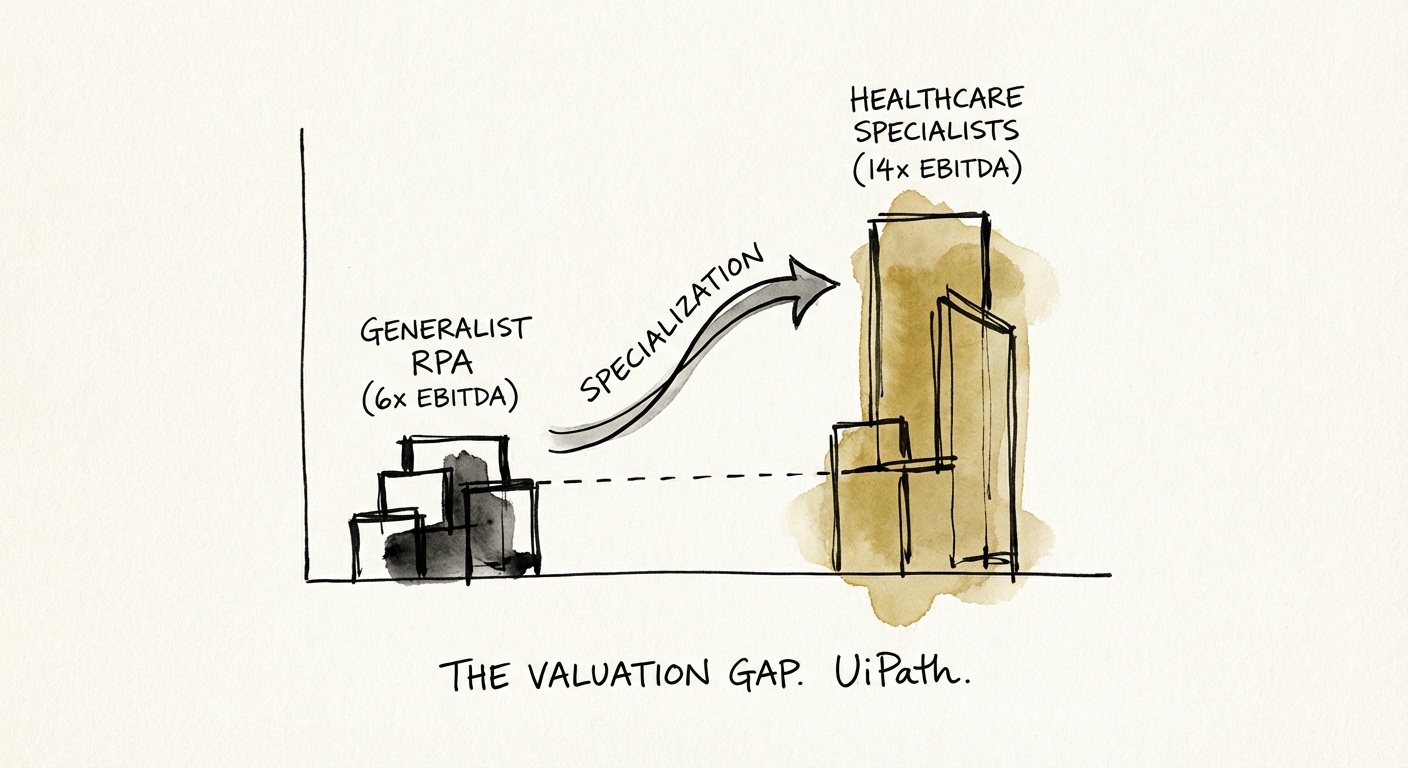
The Healthcare Automation Premium: Why Specialized UiPath Partners Trade at 14x EBITDA
Generalist RPA firms are stalling at 6x EBITDA while healthcare automation specialists command 14x. Here is the valuation gap analysis for 2026.
14x EBITDA Multiple
BRIEF · TECHNICAL DEBT
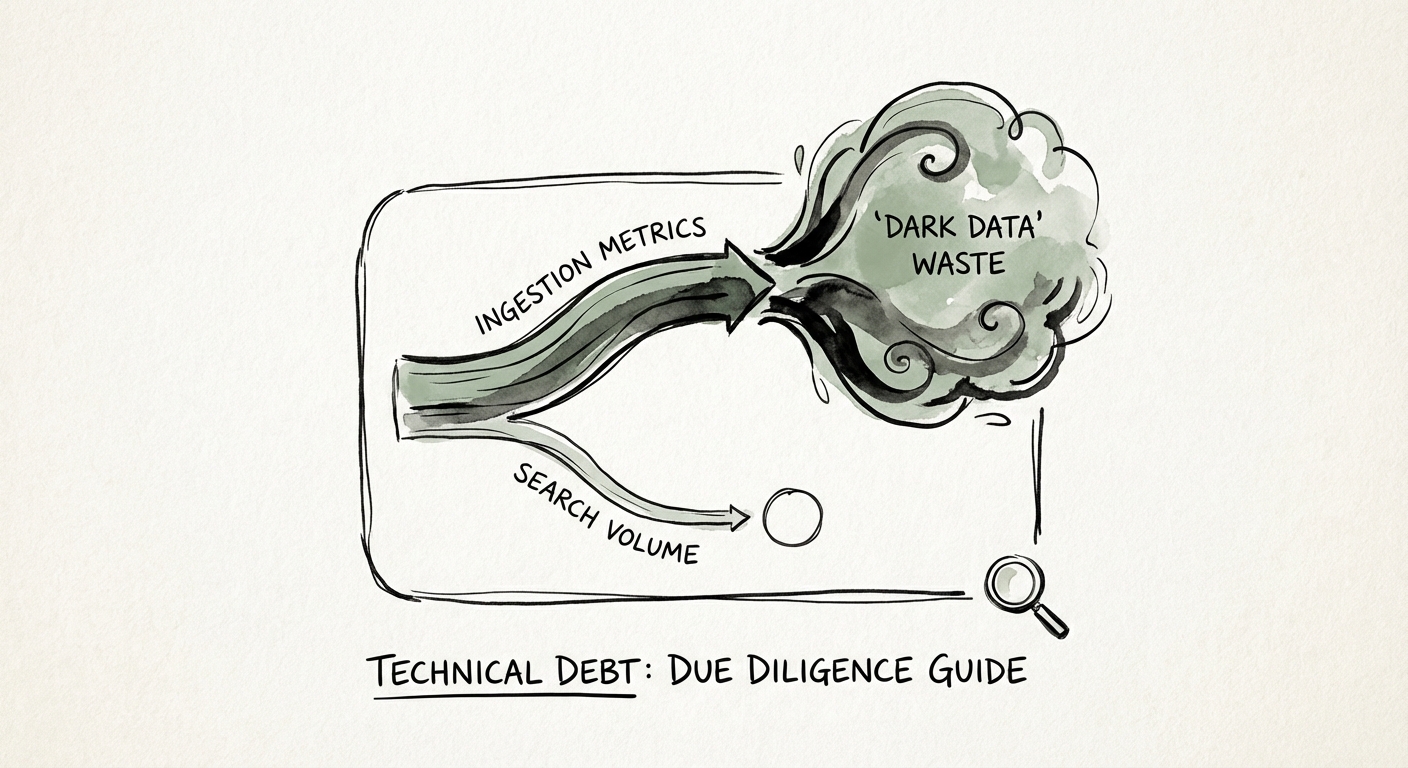
The 'Splunk Tax': Why Your Target's Log Strategy Is a $2M Liability
Splunk implementations often hide $2M+ in technical debt. Learn how to audit ingestion waste, inefficient SPL, and the 'Cisco Tax' before you sign the LOI.
55% of ingested data is 'Dark Data' (never searched)
BRIEF · EXIT READINESS
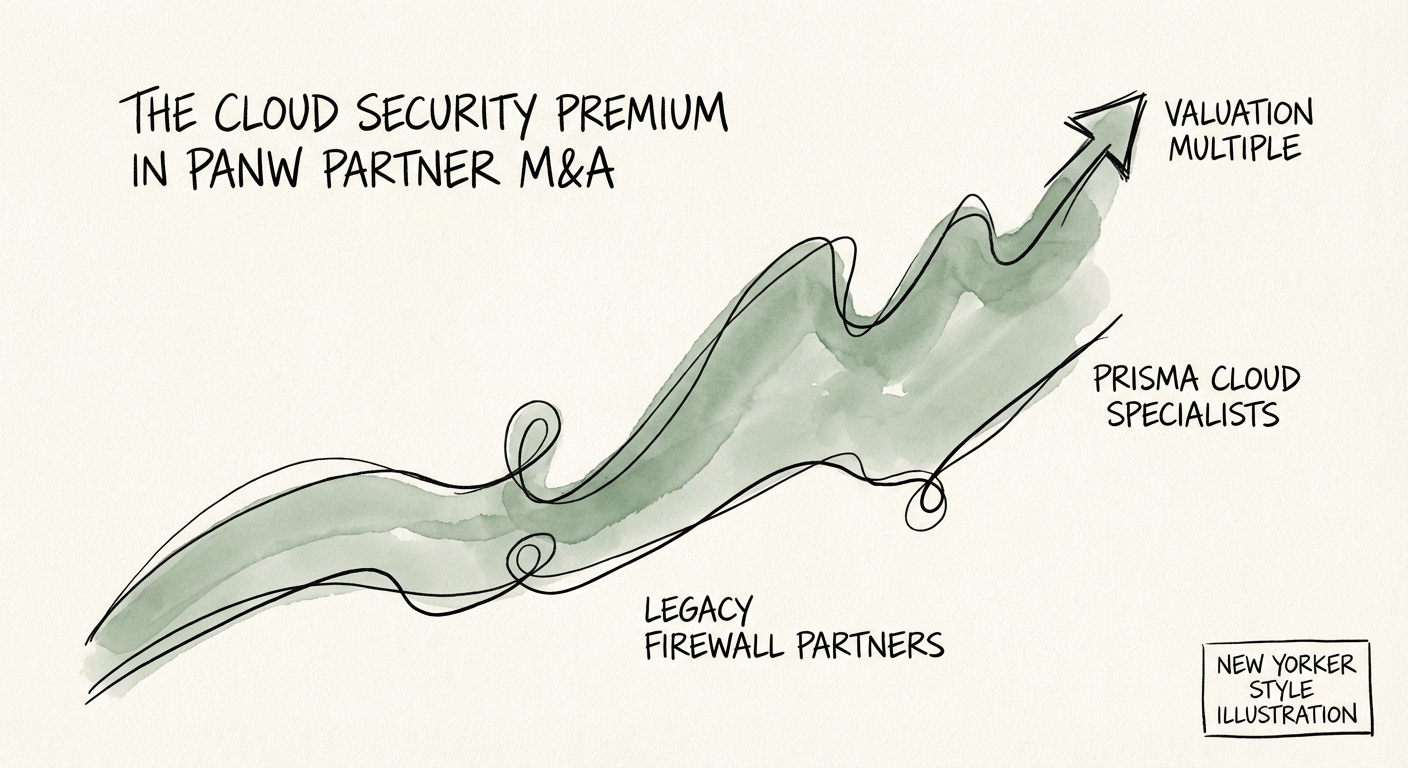
The Cloud Security Premium: Why Prisma Specialists Trade at 14x (And Firewall Shops Stall at 6x)
New data reveals a massive valuation gap in the Palo Alto Networks partner ecosystem. Why Prisma Cloud specialists trade at 14x while firewall generalists stall at 6x.
14.3x Revenue Multiple (Cloud Security)
BRIEF · EXIT READINESS
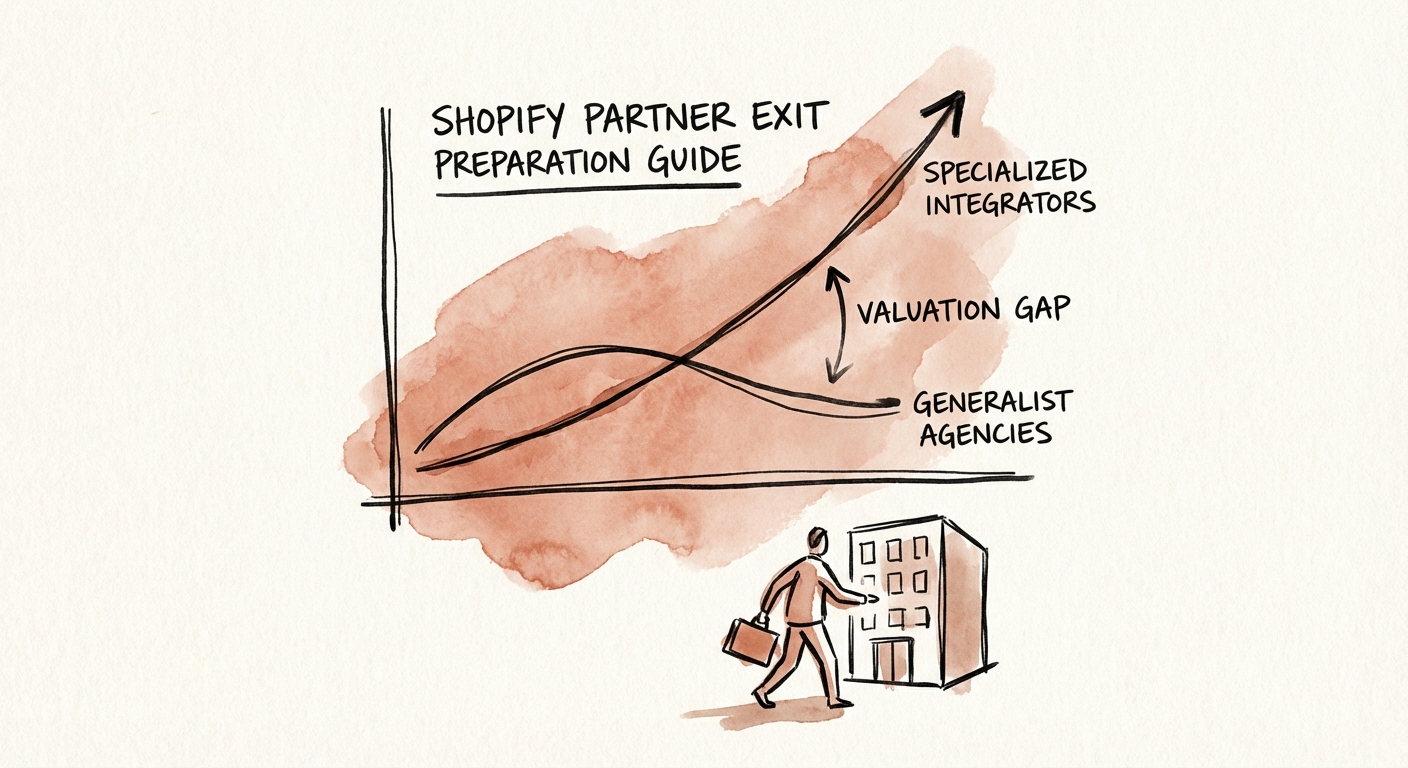
The Shopify Partner Exit Guide: From "Theme Shop" to 12x System Integrator
Shopify Partner exit guide for 2026. Why agencies trade at 5x while commerce system integrators command 12x. Benchmarks for NRR, recurring revenue, and technical IP.
12x Potential EBITDA Multiple
BRIEF · EXIT READINESS
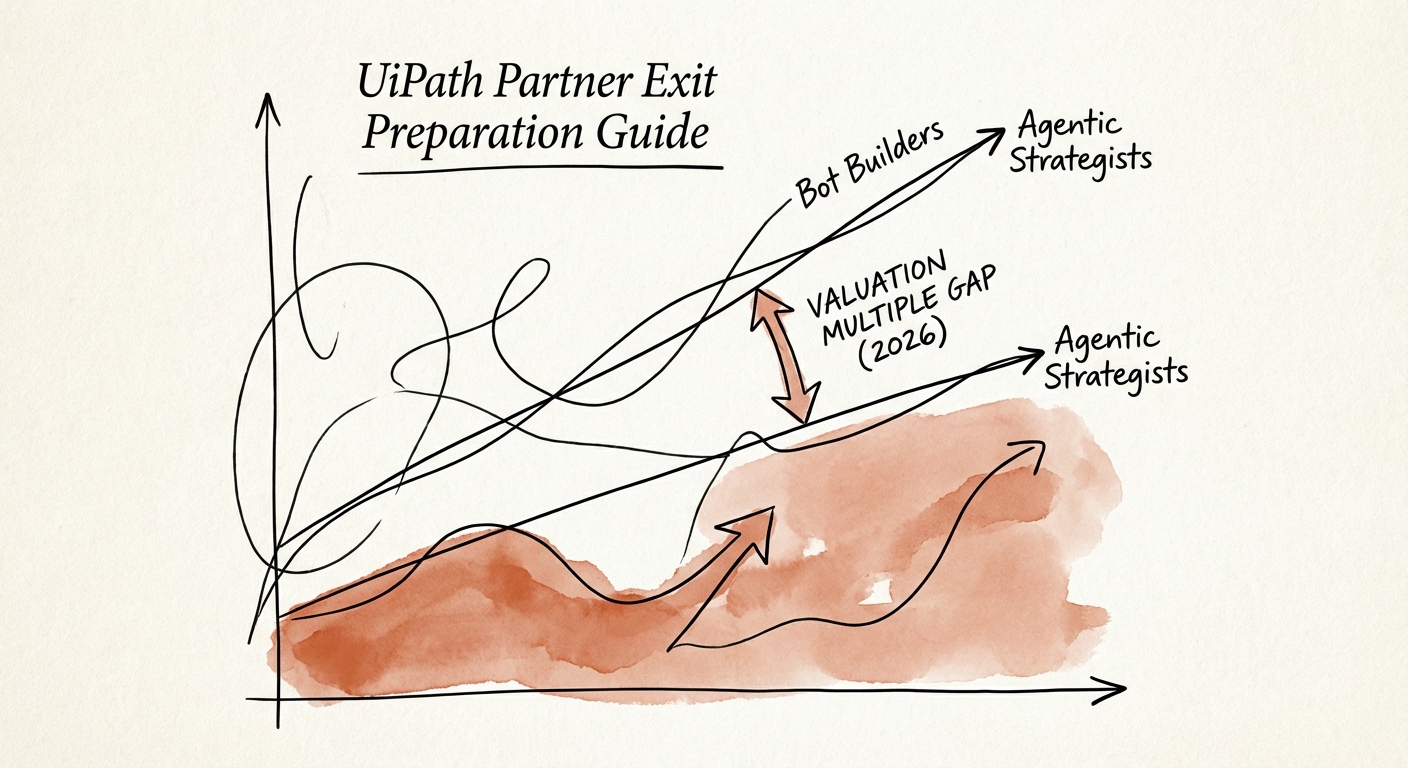
UiPath Partner Exit Readiness: The Gap Between 'Bot Builders' (6x) and 'Agentic Strategists' (14x)
For UiPath partners, the gap between 6x and 14x valuation multiples lies in the pivot from 'RPA Implementation' to 'Agentic AI Strategy.' Here is the 2026 exit roadmap.
14x Potential EBITDA Multiple for Agentic AI Specialists
BRIEF · GTM EXECUTION
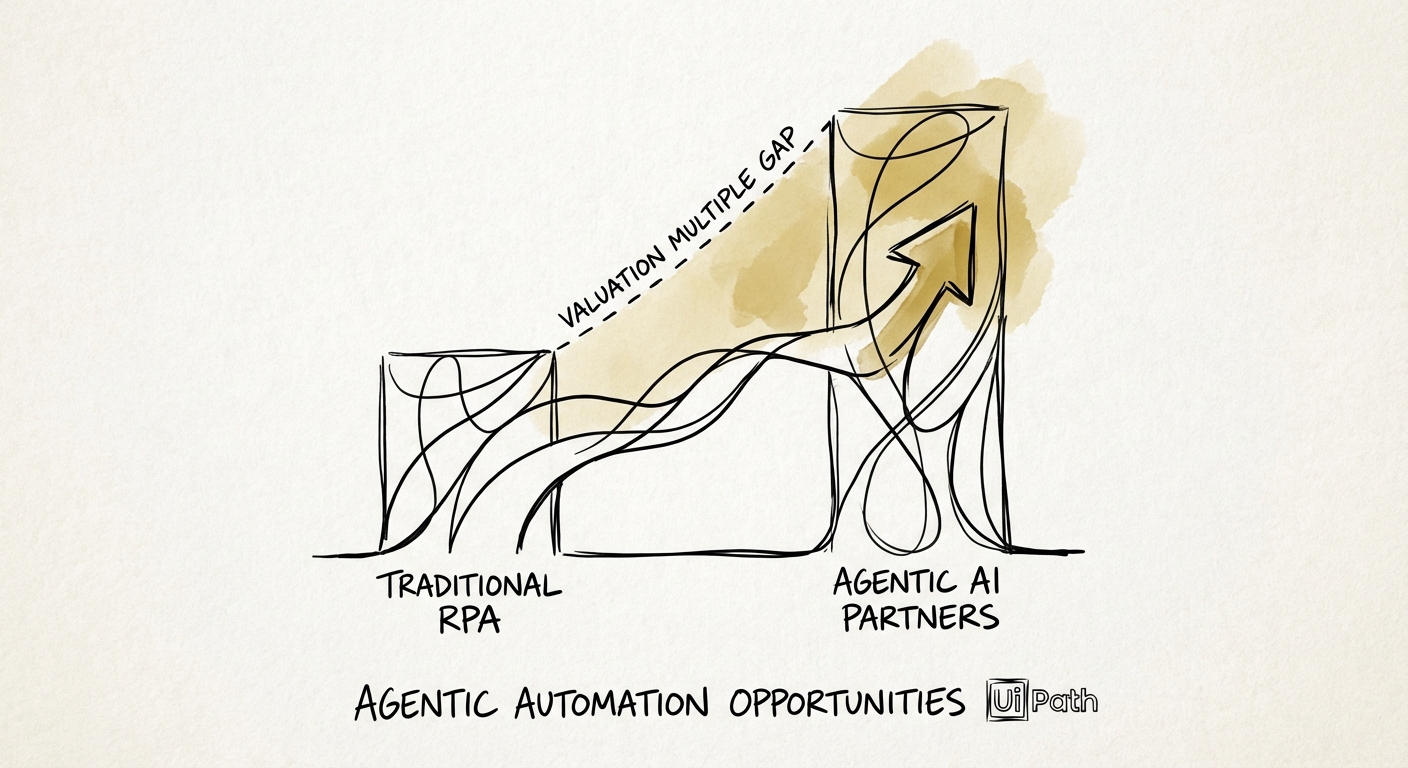
The Agentic Pivot: Why UiPath Partners Must Trade "Task Bots" for "Decision Agents" to Unlock 12x Multiples
RPA is becoming a commodity. Discover how UiPath partners can pivot to Agentic Automation, unlock new revenue streams, and command 12x exit multiples in 2026.
12x Target EBITDA Multiple
BRIEF · UNIT ECONOMICS
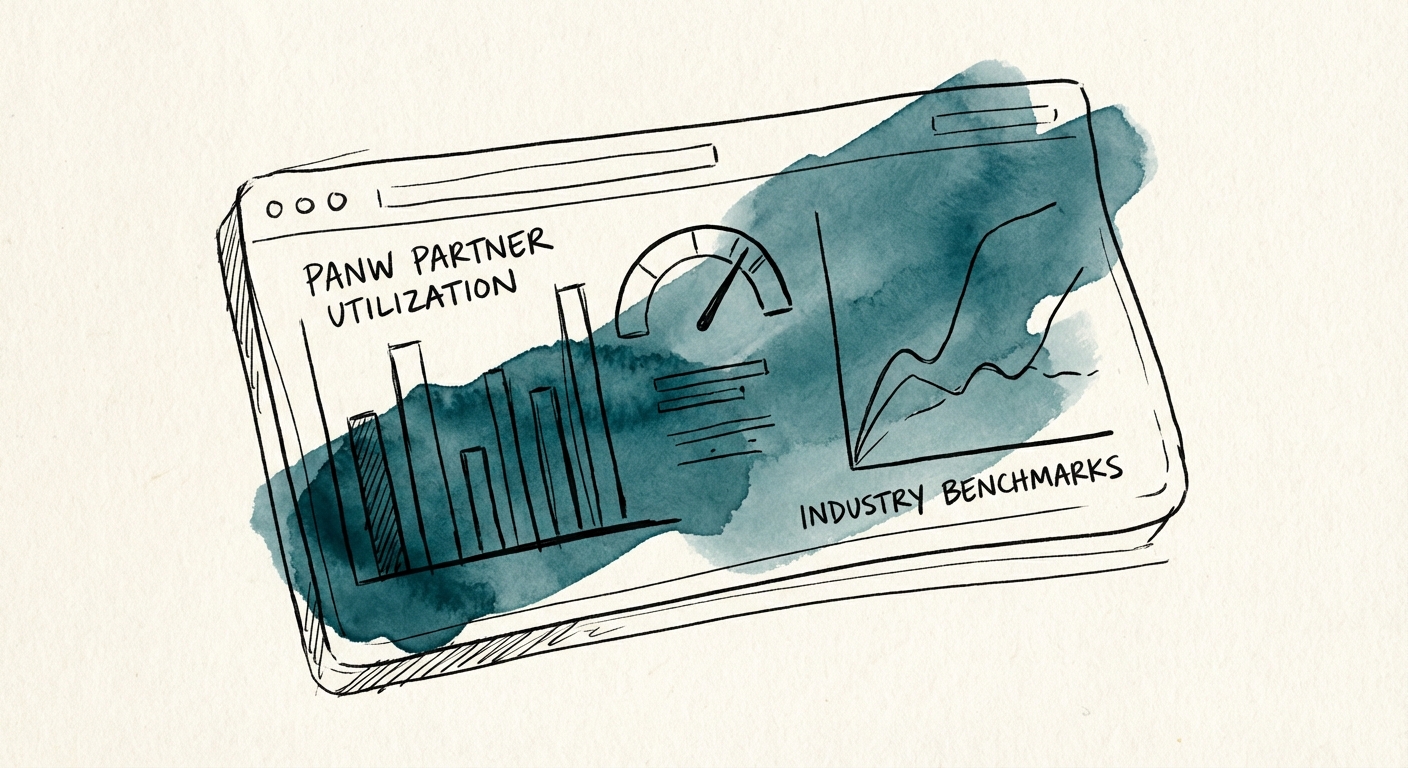
The PANW Partner Utilization Trap: Why 'Diamond Innovator' Status Requires a New Operating Model
Why chasing 85% utilization kills Palo Alto Networks (PANW) practices. New benchmarks for NextWave Diamond Innovators, Prisma SASE, and Cortex delivery teams.
72% Effective Utilization Target
BRIEF · GTM EXECUTION
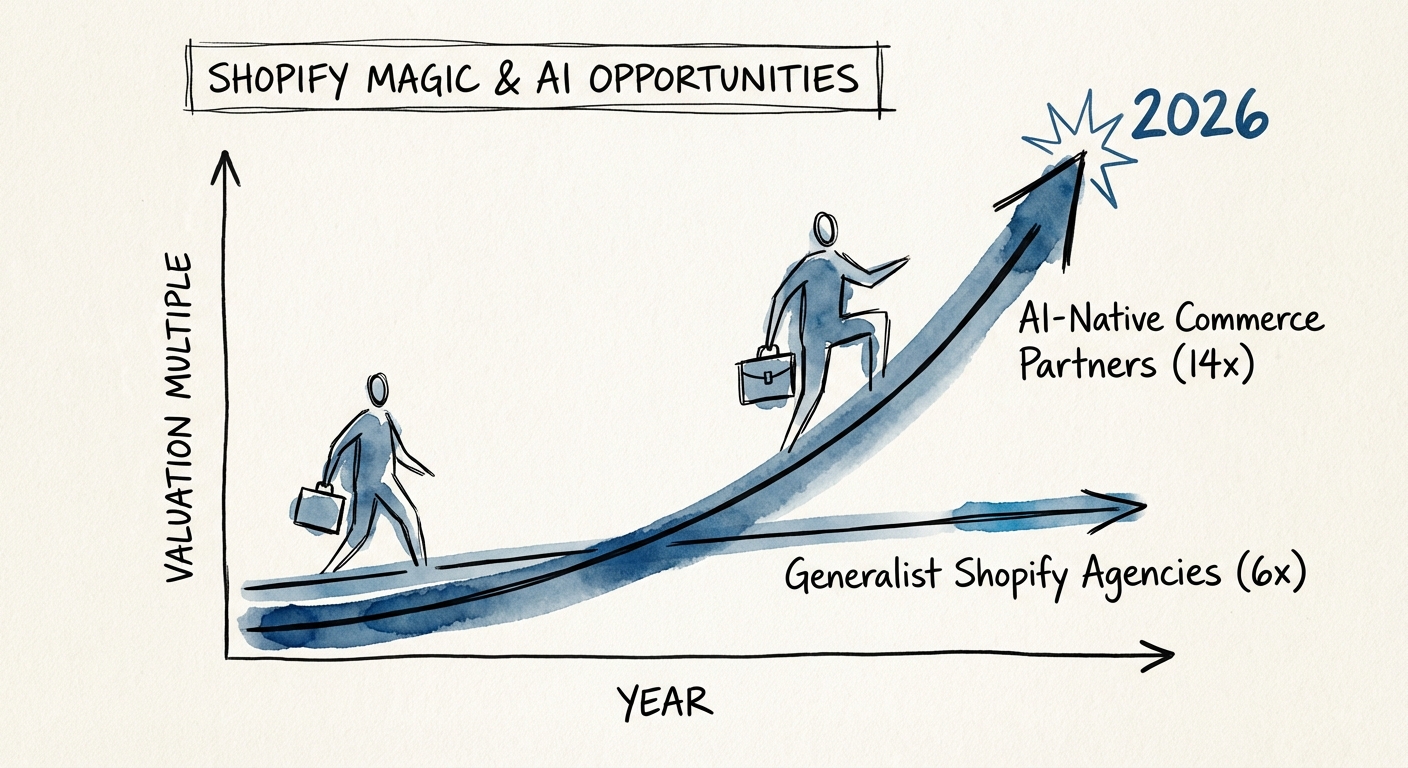
Shopify Magic and Sidekick Partner Opportunities
Shopify Magic and Sidekick change partner work from theme-only delivery toward data readiness, workflow automation, human review, and recurring commerce intelligence services.
AI readiness Partner Opportunity
BRIEF · EXIT READINESS
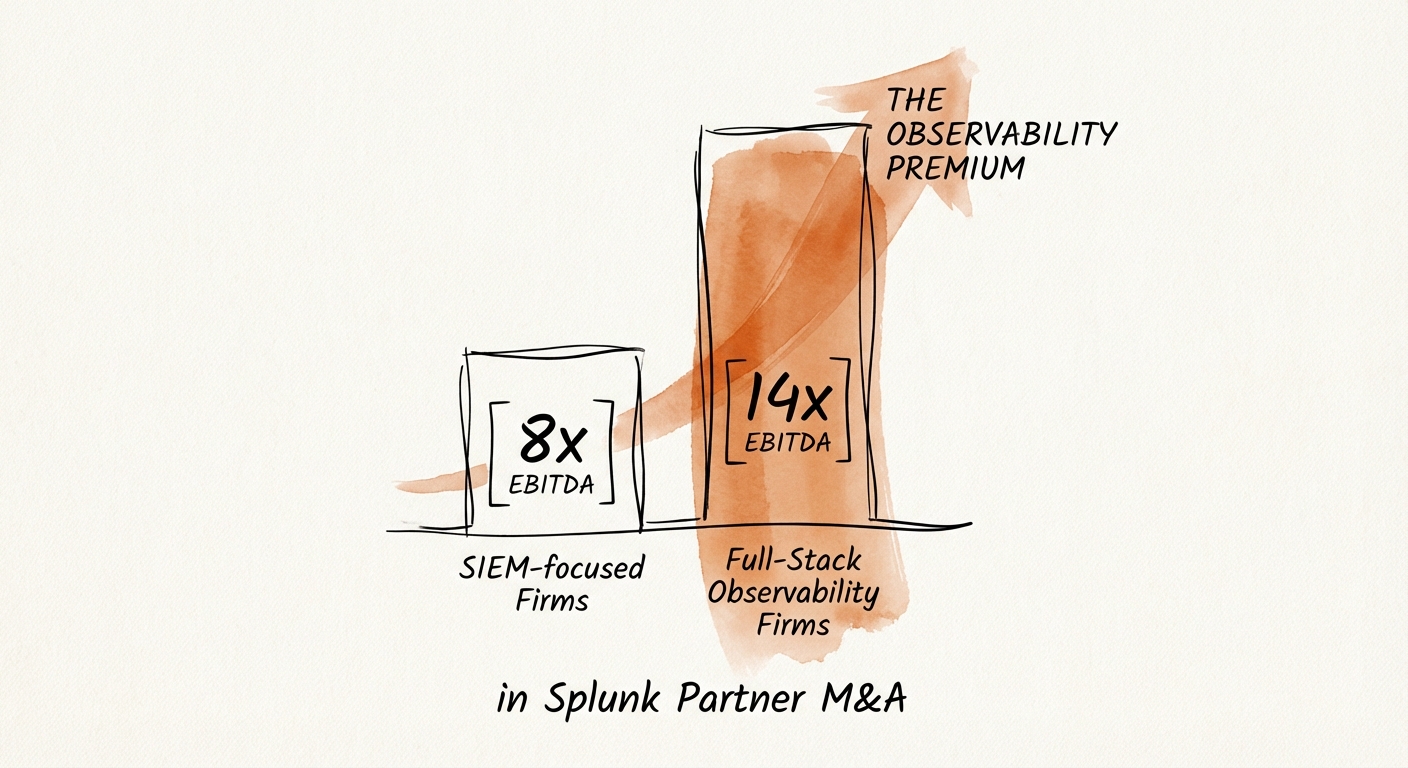
The Splunk Partner Trap: Why Renewal Revenue Caps You at 8x and OTel Gets You to 14x
Post-Cisco, Splunk partners split into two valuation lanes. Here's the revenue-mix and OpenTelemetry test buyers run to decide if you're an 8x or a 14x.
14x EBITDA Multiple for O11y Leaders
BRIEF · EXIT READINESS
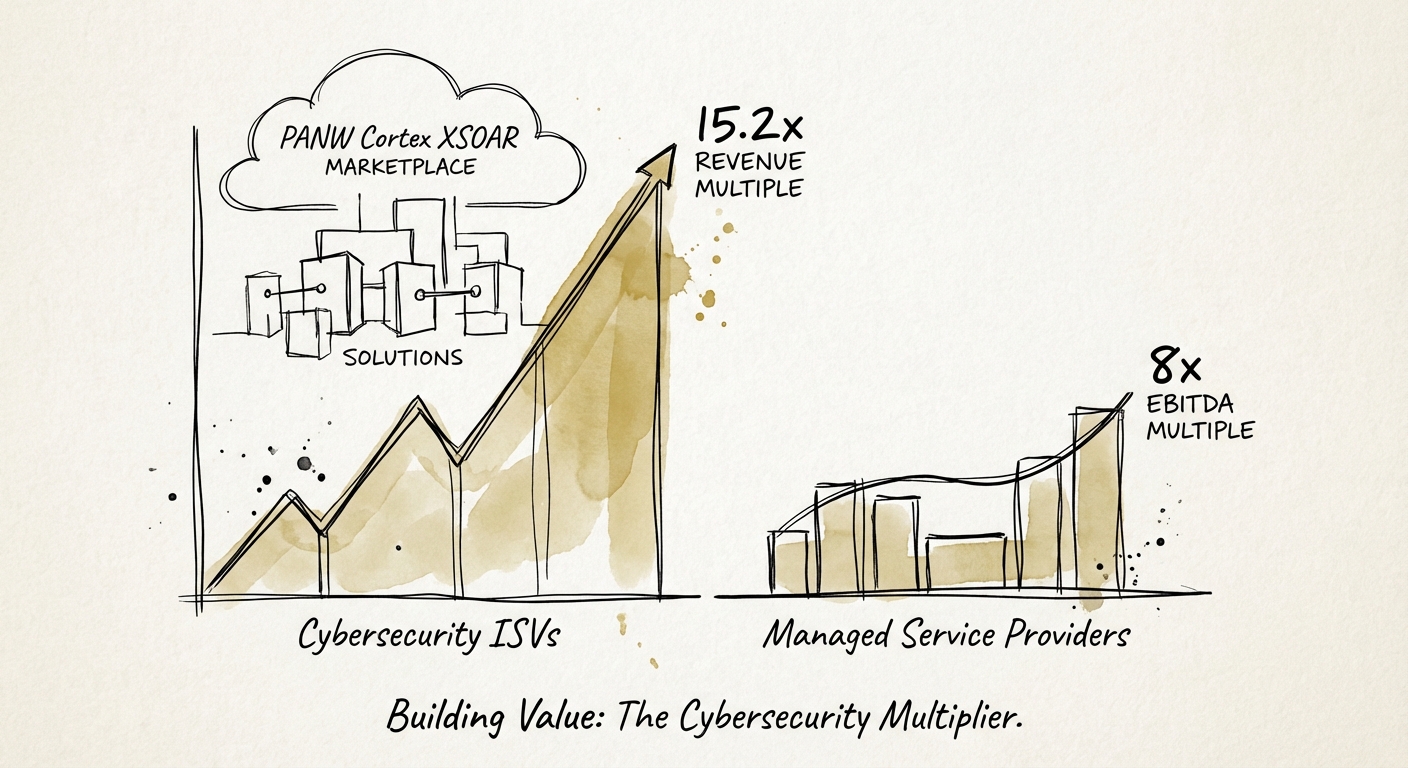
The Cortex XSOAR Multiplier: Why 'Content Pack' ISVs Trade at 15x Revenue (While Service Shops Stall at 8x EBITDA)
Why building on Cortex XSOAR transitions your firm from 8x EBITDA to 15x Revenue. A guide for founders to unlock the 'Integration Premium' in 2026.
15.2x Revenue Multiple (Private Cyber ISV)
BRIEF · EXIT READINESS
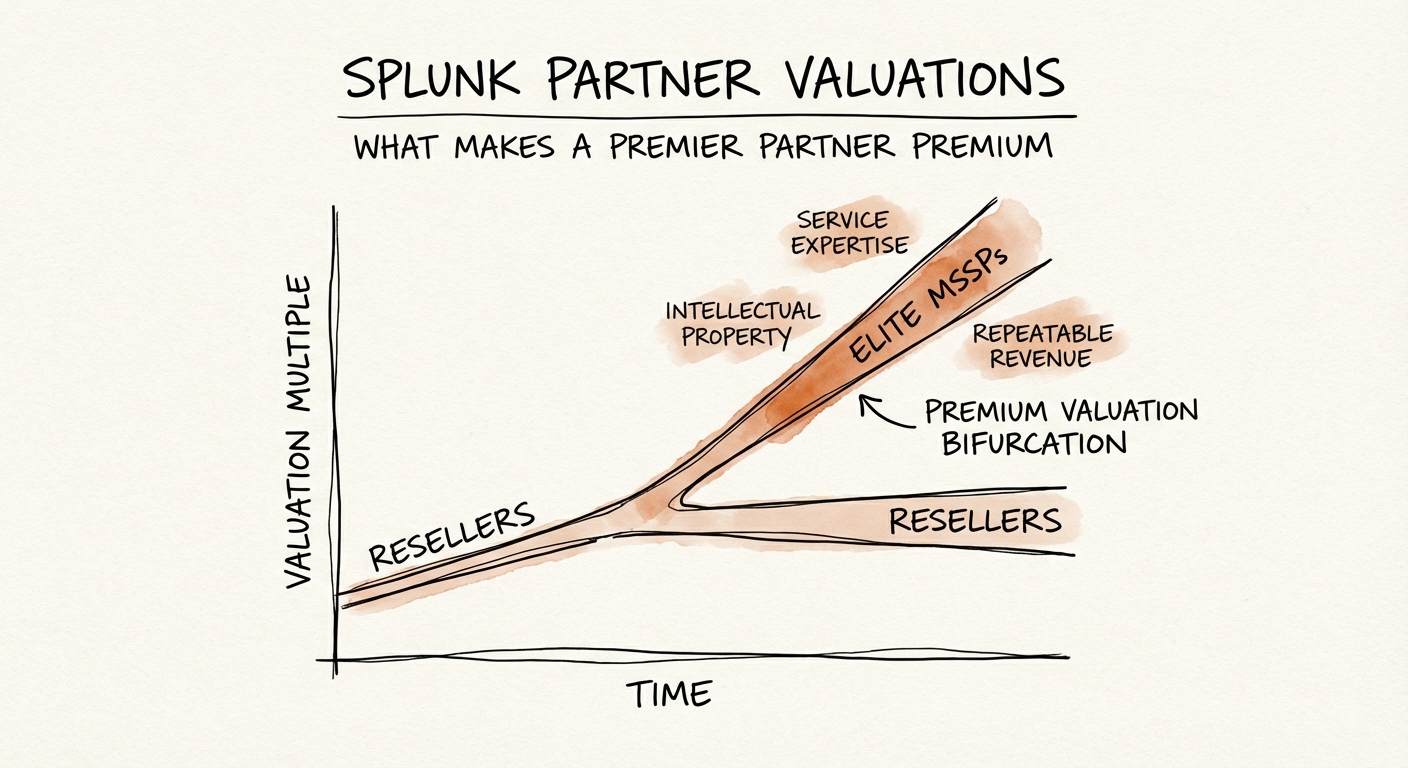
Splunk Partner Valuations: The Gap Between "Log Collectors" and Security Intelligence
Splunk partner valuations are bifurcating. Why 'Elite' security partners trade at 14x EBITDA while generalist resellers stall at 6x in the Cisco era.
14x Elite Partner EBITDA Multiple
BRIEF · REVENUE ARCHITECTURE
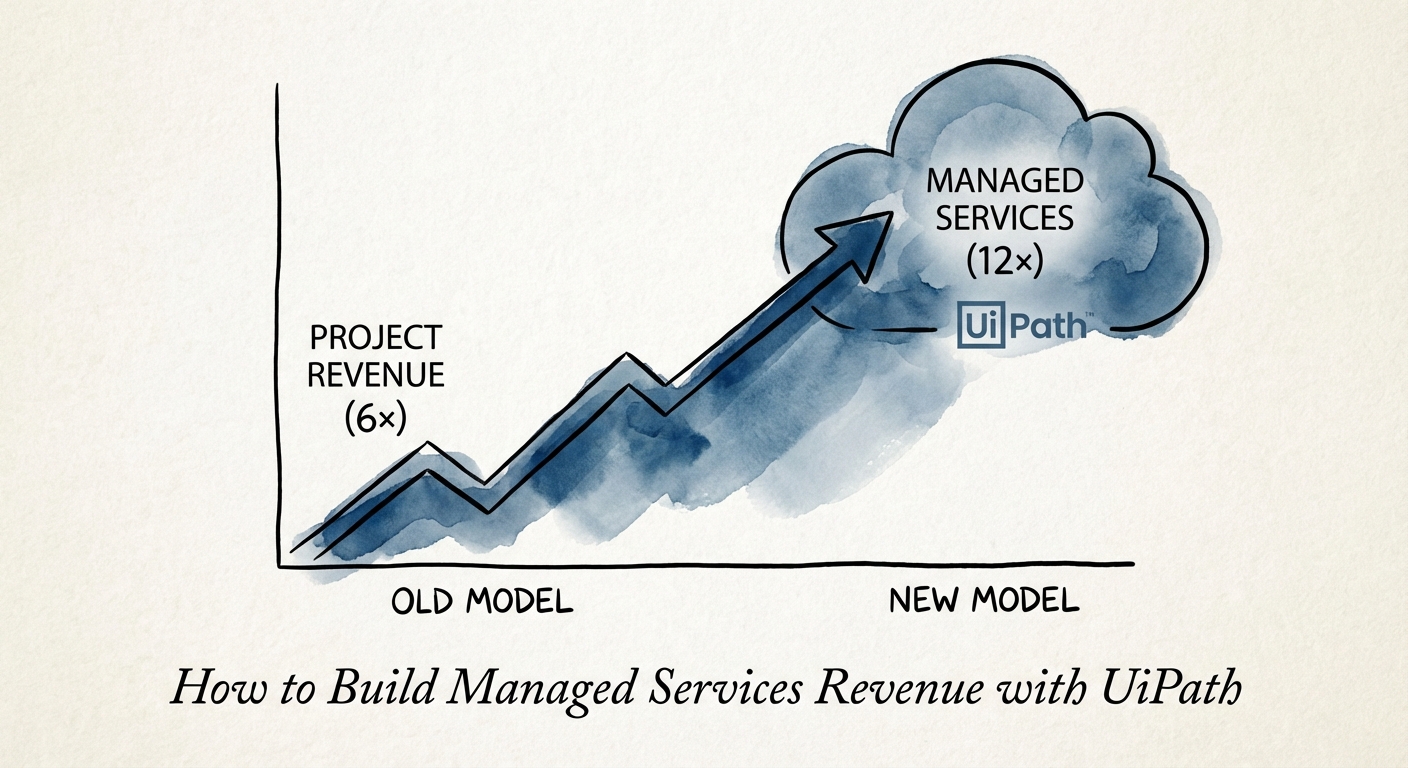
How to Build Managed Services Revenue with UiPath: The 'Agentic' Pivot
Stop trading at 1.5x revenue. A diagnostic guide for UiPath partners to pivot from implementation projects to high-margin Agentic Managed Services.
12x Potential EBITDA Multiple
BRIEF · UNIT ECONOMICS
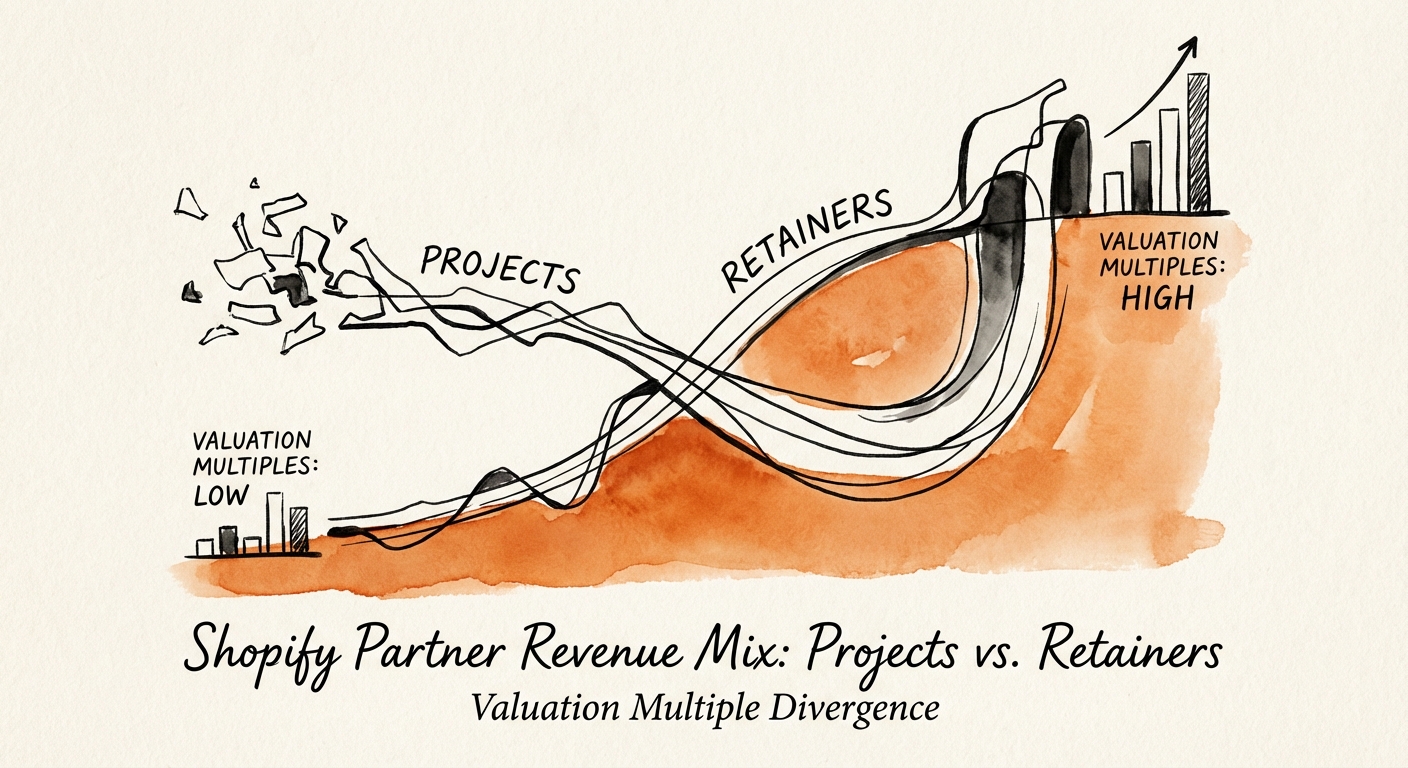
Shopify Partner Revenue Mix: Projects vs. Retainers
Why Shopify Plus agencies with 60%+ retainer revenue command 12x multiples while project-based "Launch Factories" stall at 5x. A CEO's guide to revenue mix strategy.
2.5x Valuation Multiple Premium
BRIEF · UNIT ECONOMICS
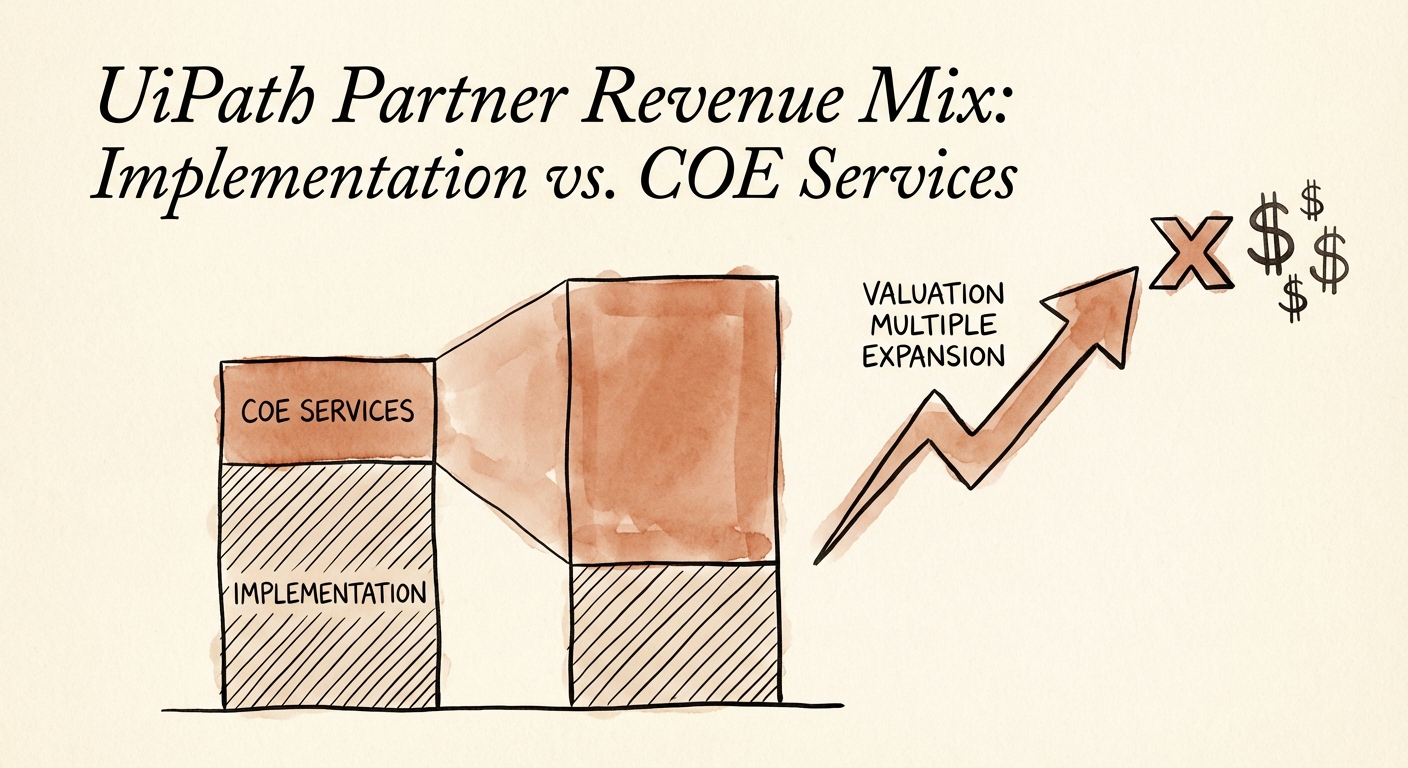
The UiPath Valuation Gap: Why Implementation Shops Stall at 6x While COE Partners Command 14x
Why UiPath implementation partners trade at 6x EBITDA while Managed COE firms command 14x. A diagnostic guide for scaling RPA consultancies.
14x EBITDA Multiple for COE-Led Firms
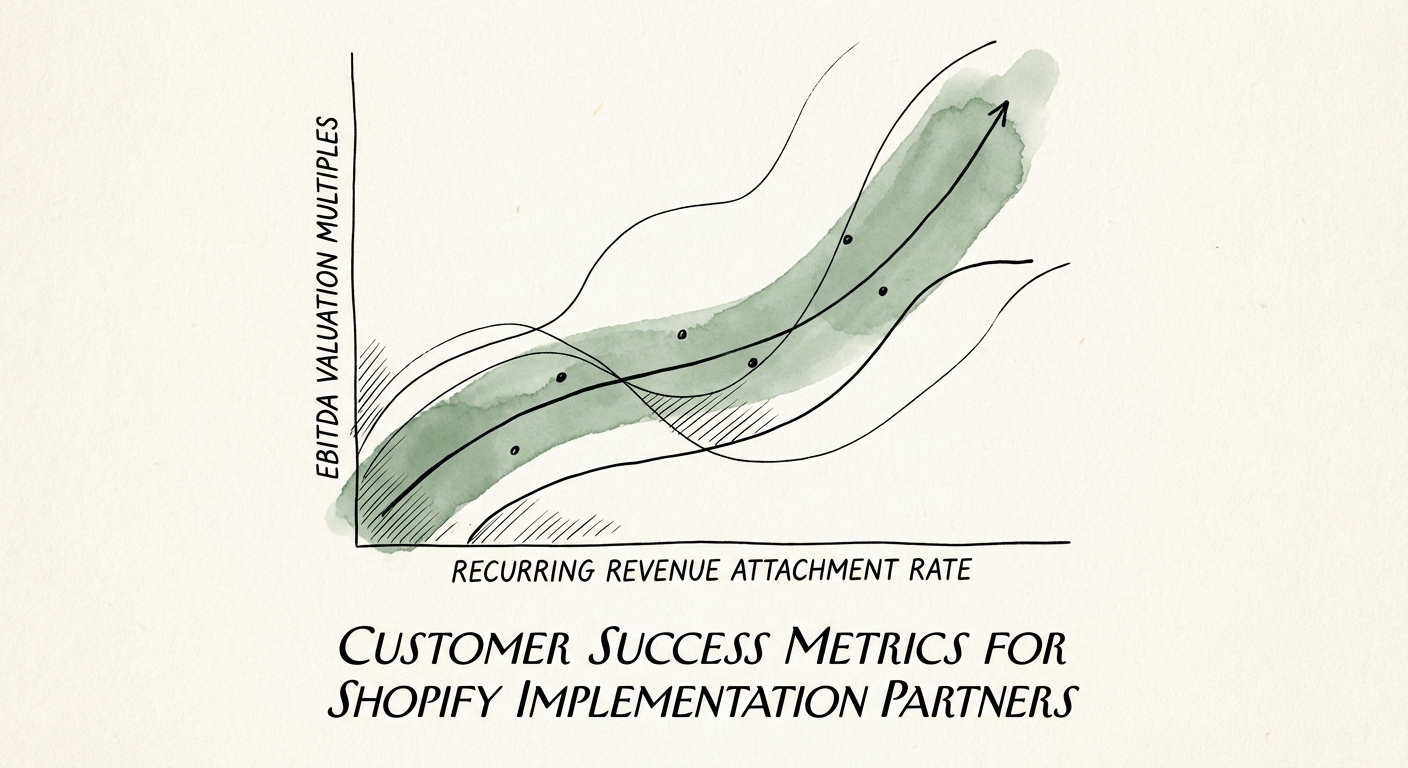
BRIEF · REVENUE ARCHITECTURE
Customer Success Metrics for Shopify Implementation Partners: The 'Launch Trap' Diagnostic
Stop measuring 'Go-Live'. Discover the 3 customer success metrics that improve retention quality for Shopify Plus partners and how to fix your NRR.
35% Min. Recurring Attachment Rate
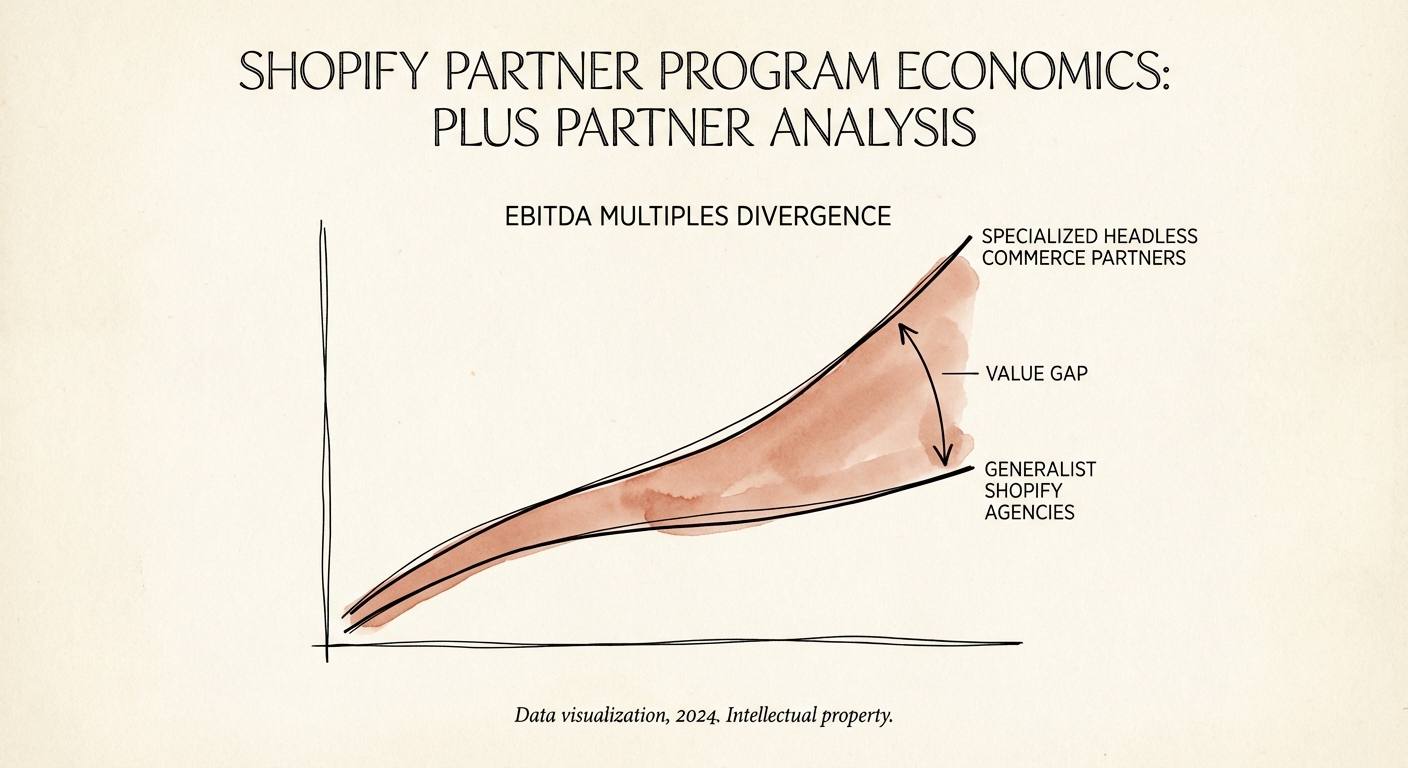
BRIEF · UNIT ECONOMICS
Shopify Plus Partner Economics: The "Badge Tax" vs. The 12x Exit
Analysis of Shopify Plus Partner program economics, valuation impacts, and the 'commercial impact' trap. Why the Plus badge costs more than you think.
15% Sales-Assisted Launch Commission
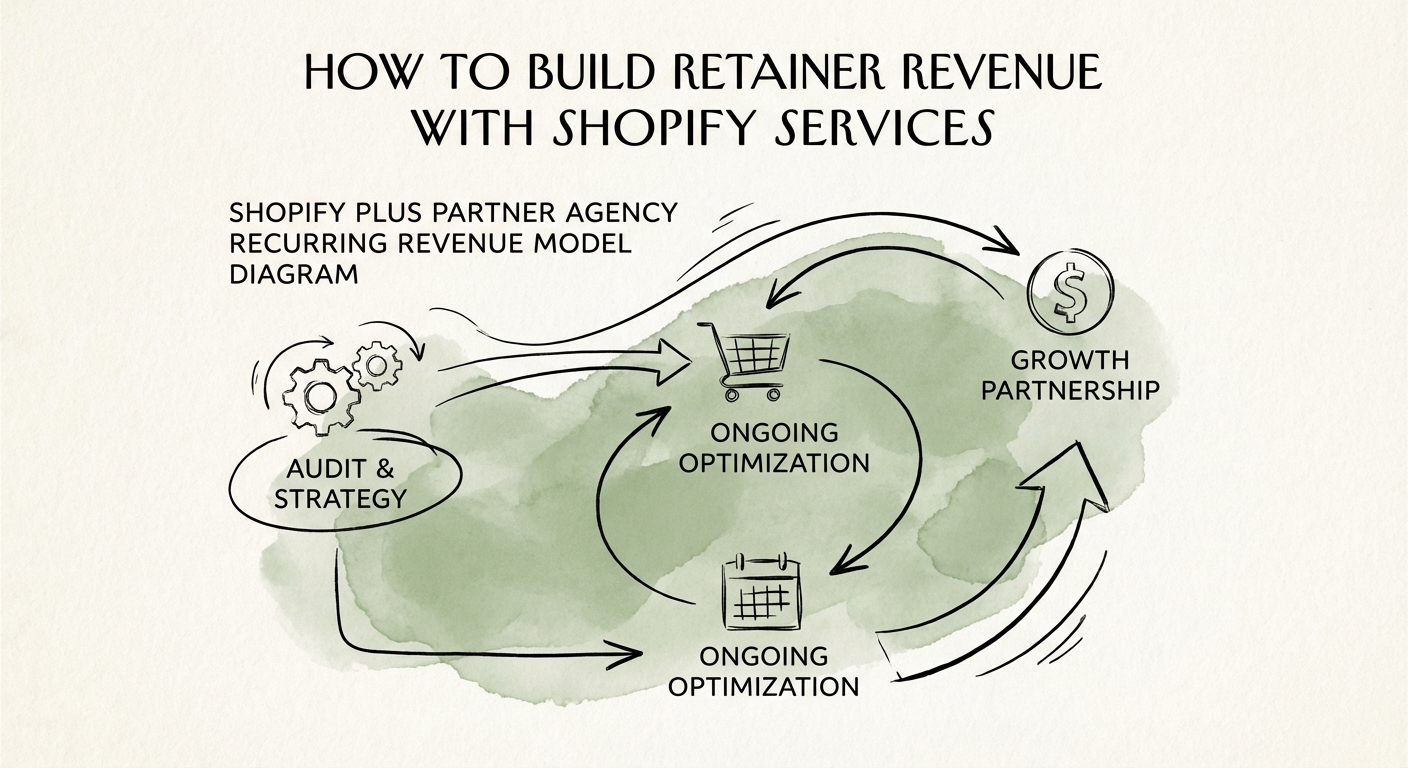
BRIEF · REVENUE ARCHITECTURE
How to Build Retainer Revenue with Shopify Services
Transform your Shopify agency from a project-based 'build shop' into a recurring revenue engine. Benchmarks, retainer models, and valuation impacts.
12x Potential Valuation Multiple for Recurring Revenue
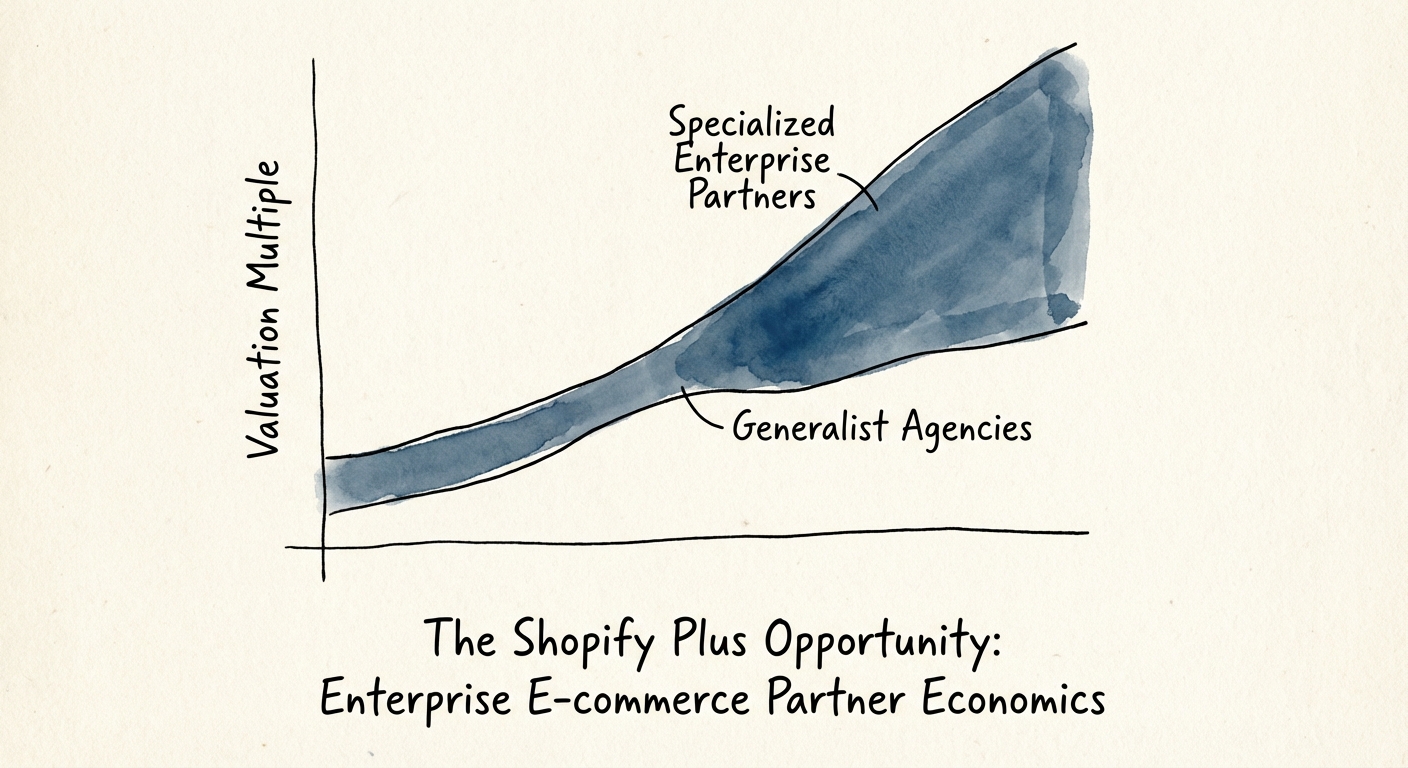
BRIEF · REVENUE ARCHITECTURE
The Shopify Plus Opportunity: Why 'Enterprise' Commerce Partners Trade at 12x
Why Shopify Plus partners with B2B expertise trade at 12x EBITDA while generalist agencies stall at 5x. 2026 benchmarks for retainers, margins, and growth.
140% Y/Y B2B GMV Growth on Shopify