BRIEF · TECHNICAL DEBT
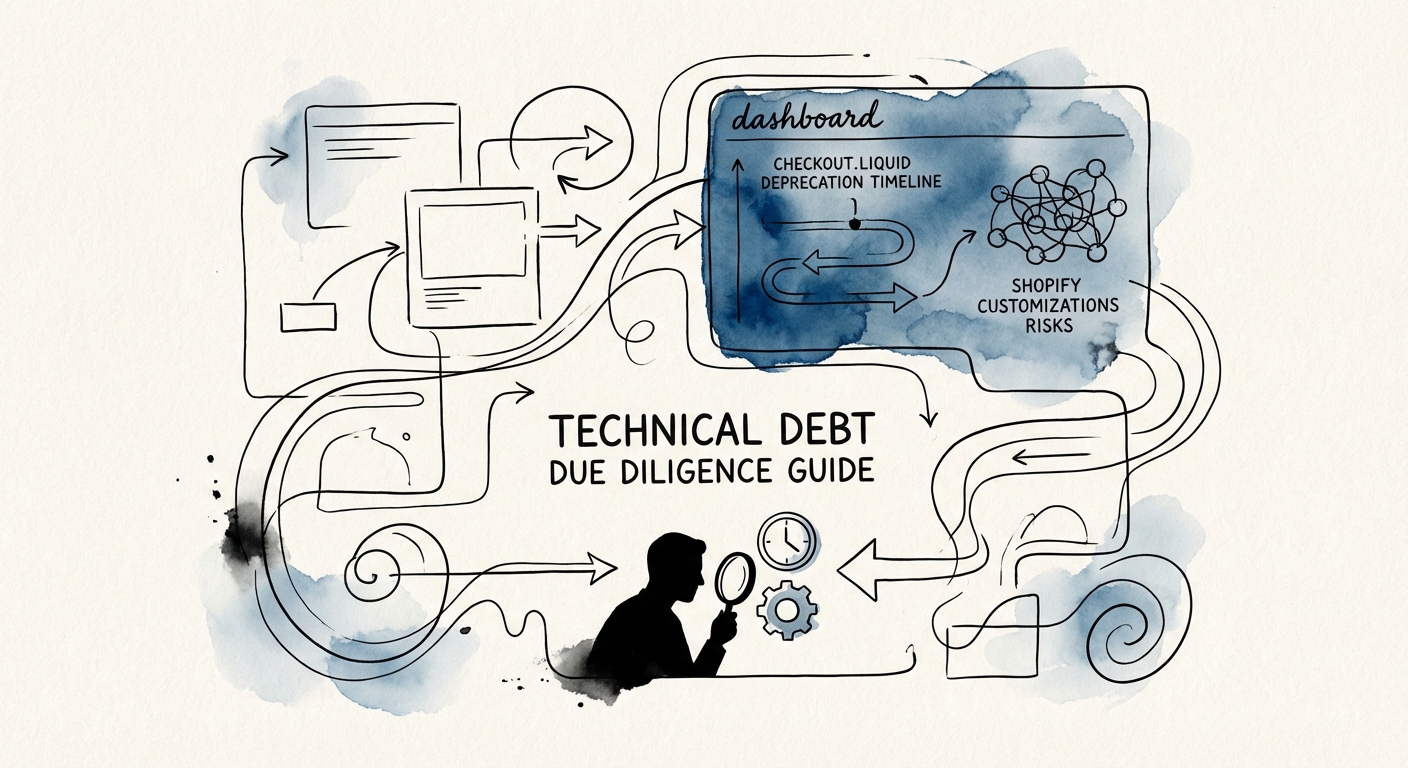
The $1.5M Customization Trap: Auditing Shopify Technical Debt
Shopify isn't always 'low code.' Discover why legacy 'checkout.liquid' files and headless architectures create $1.5M in hidden technical debt for PE buyers.
$150,000 Annual 'Headless Tax' on EBITDA
BRIEF · EXIT READINESS
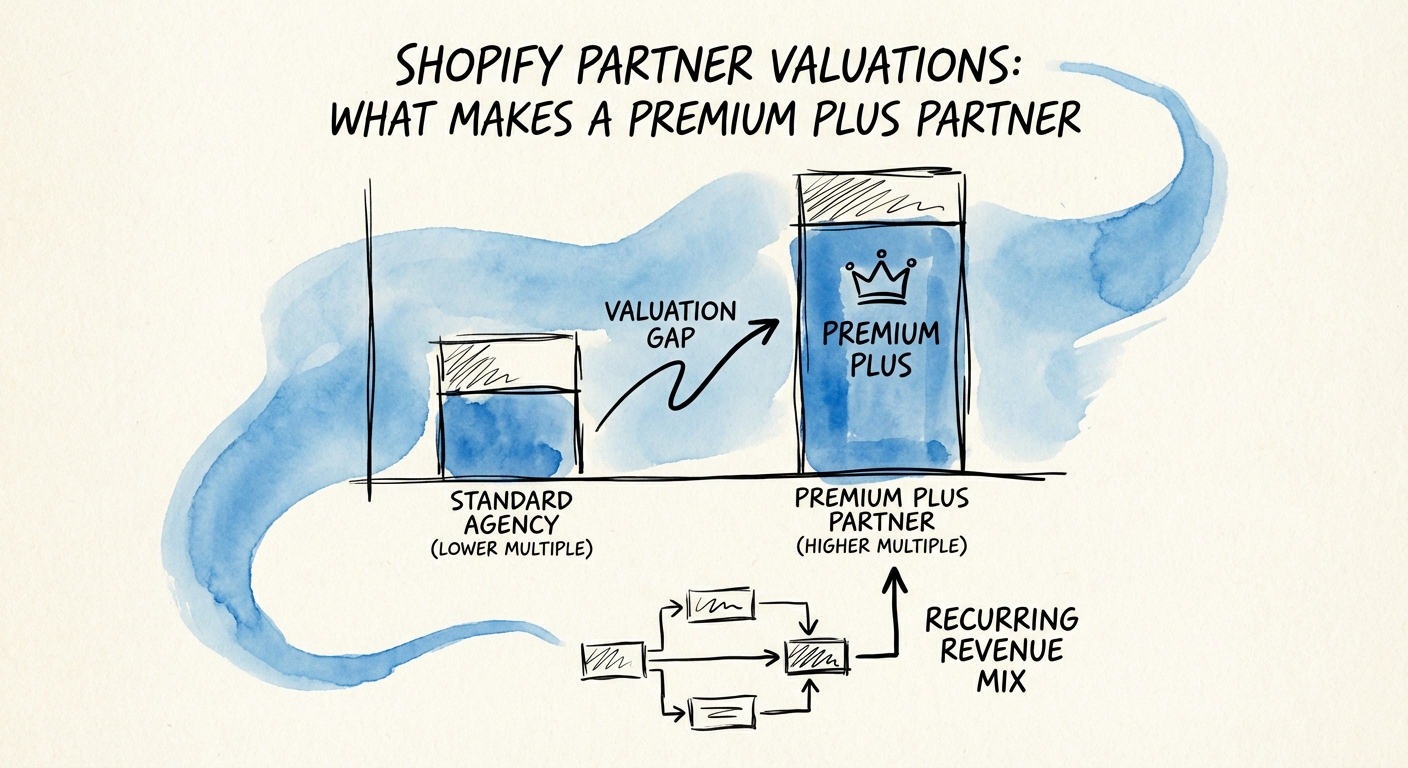
Shopify Partner Valuations: What Makes a 'Premium Plus' Partner
Shopify Partner valuation benchmarks for 2026. Why 'Plus' status, recurring revenue, and proprietary IP drive agency multiples from 4x to 12x EBITDA.
12x Premium EBITDA Multiple
BRIEF · GTM EXECUTION
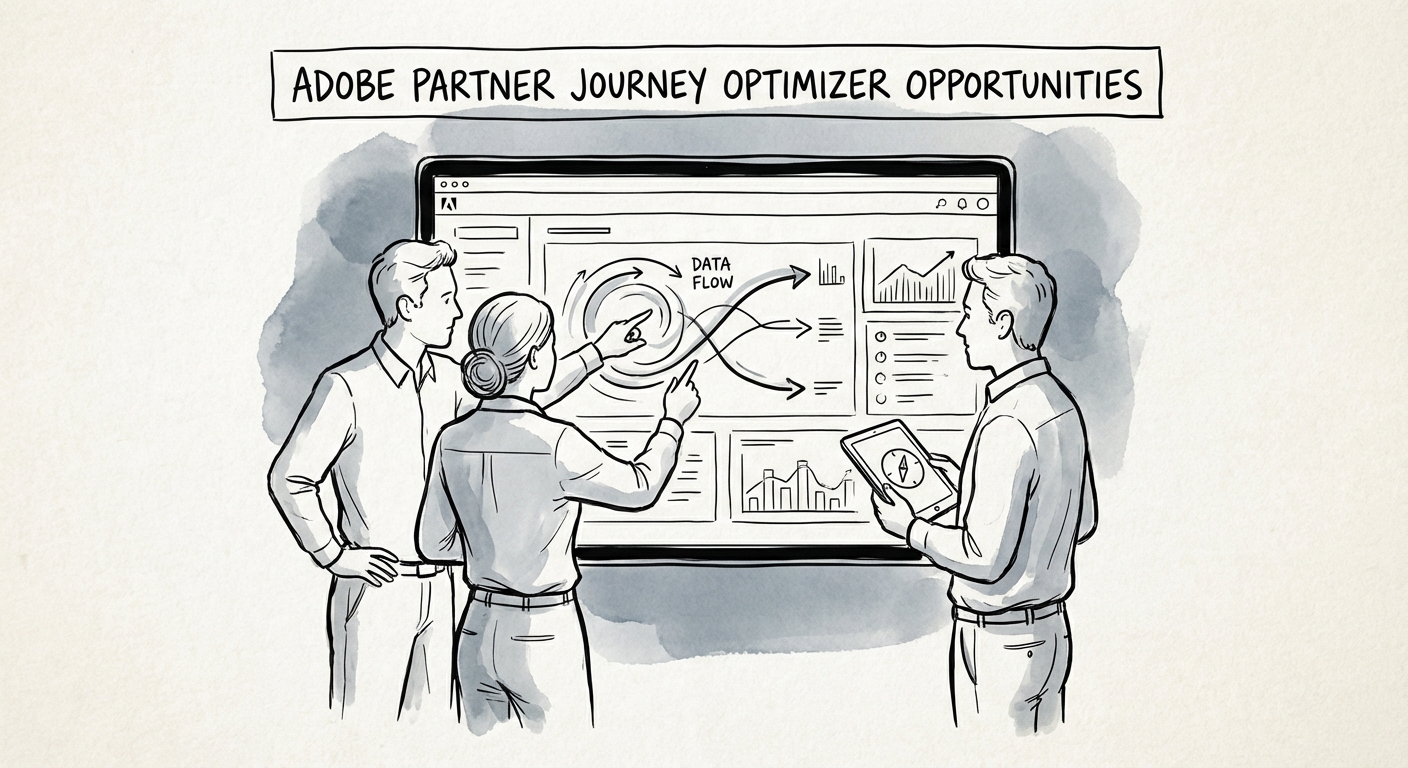
The Adobe Journey Optimizer Opportunity: Why 'Real-Time' Orchestration Commands a 14x Multiple
Generalist Adobe agencies trade at 6x EBITDA. Journey Optimizer (AJO) specialists command 14x. Here is the diagnostic guide to pivoting your practice.
14x EBITDA Multiple for AJO Specialists
BRIEF · EXIT READINESS
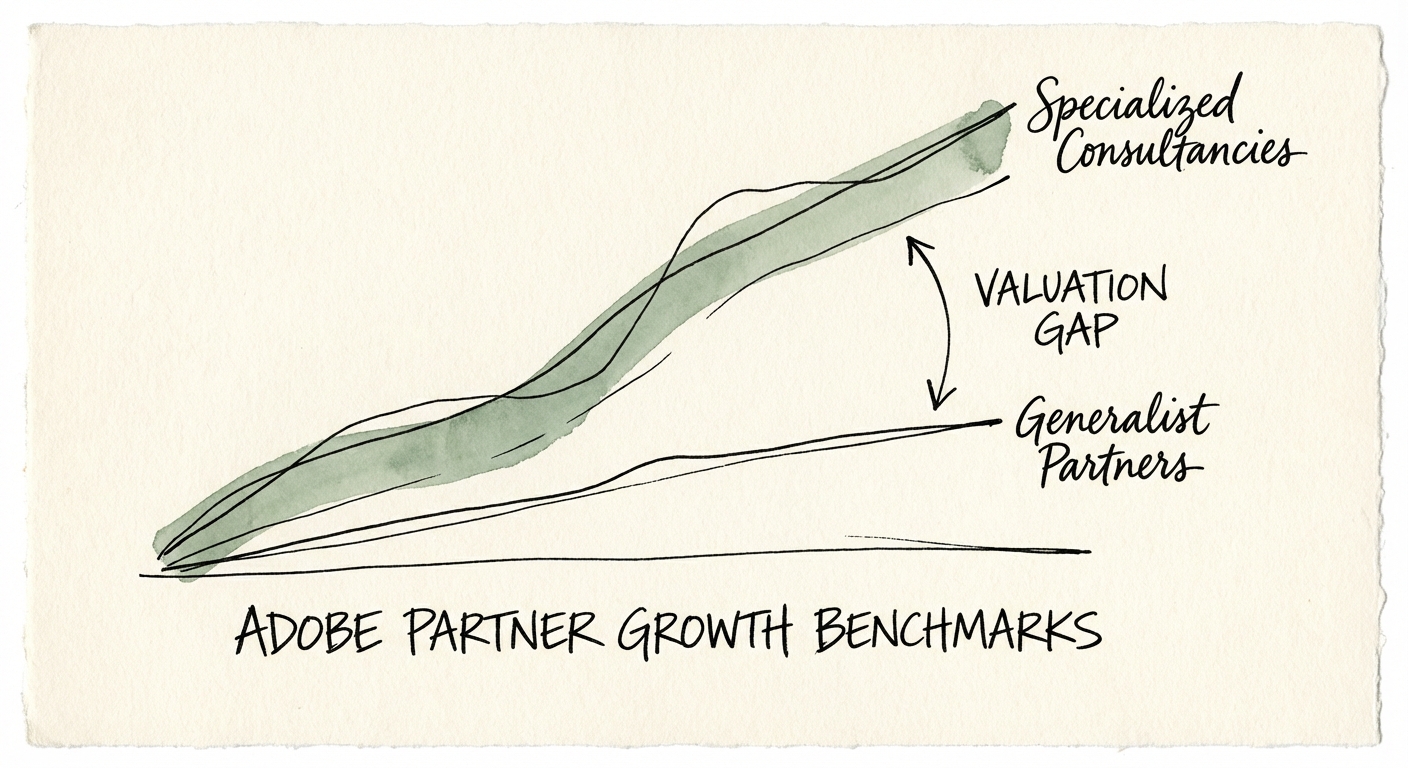
Adobe Partner Growth Benchmarks: The Gap Between $10M Stalls and $100M Exits
Why Adobe Experience Cloud partners stall at $10M and how to scale to $50M. Valuation multiples, utilization benchmarks, and the shift to managed services.
14x EBITDA Valuation for Specialized Partners
BRIEF · EXIT READINESS
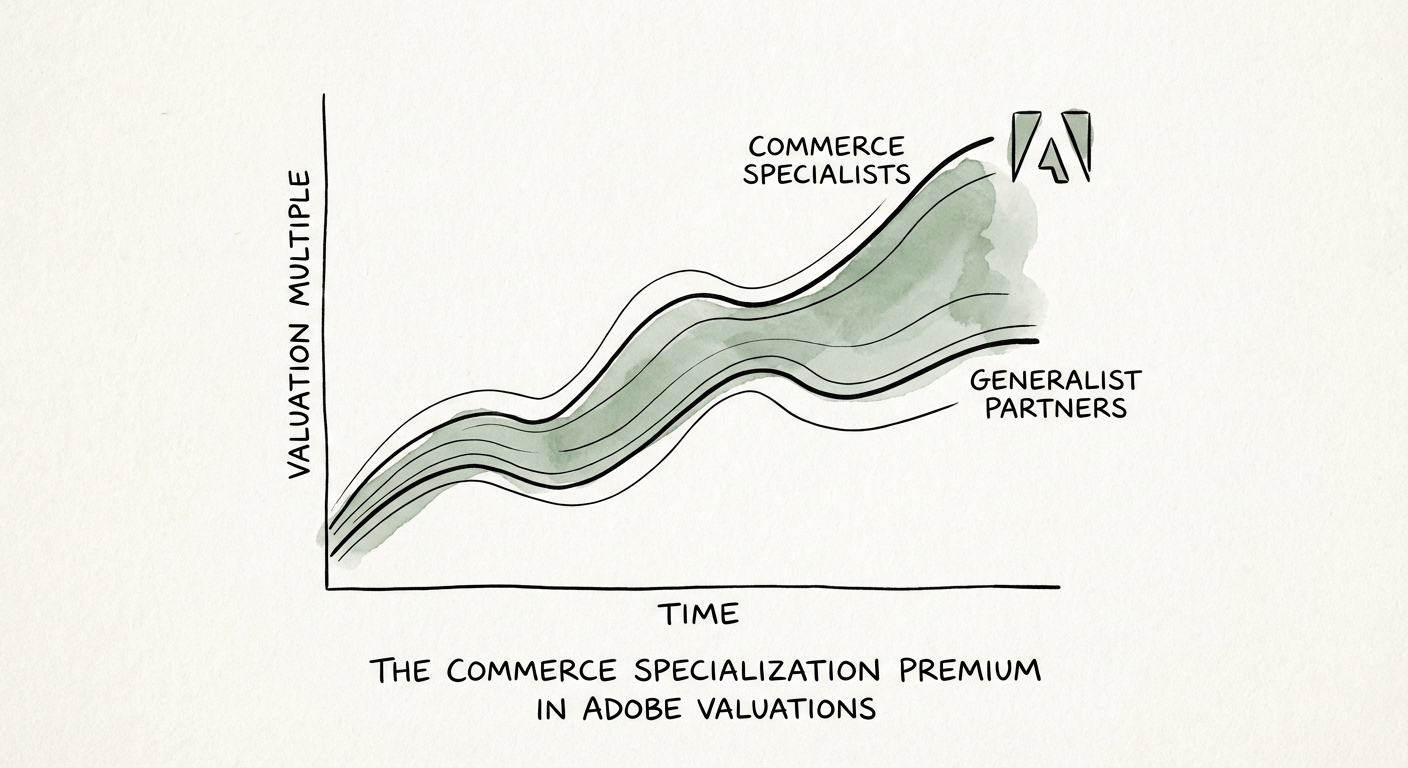
The Commerce Specialization Premium in Adobe Valuations
Why Adobe Commerce specialists trade at 12x EBITDA while generalist partners stall at 6x. A diagnostic guide for PE sponsors on maximizing exit value.
12x Specialist EBITDA Multiple
BRIEF · EXIT READINESS
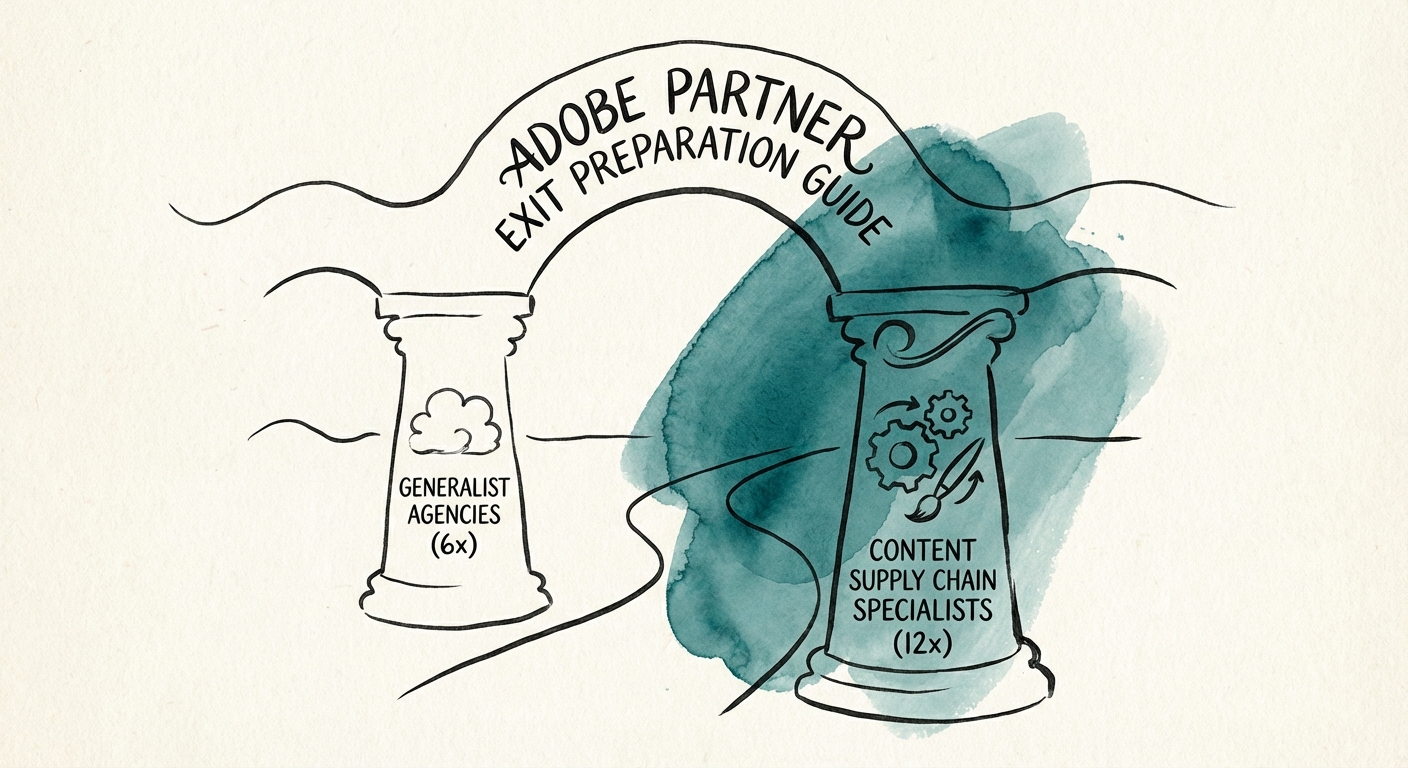
The Adobe Partner Exit: Why 'Specialized' Shops Command a 12x Multiple (And Generalists Stall at 6x)
The Adobe Partner ecosystem is bifurcating. Why 'Content Supply Chain' specialists command 12x EBITDA multiples while generalist AEM shops stall at 6x. A 2026 exit roadmap.
12x EBITDA Multiple for Specialized Partners
BRIEF · GTM EXECUTION
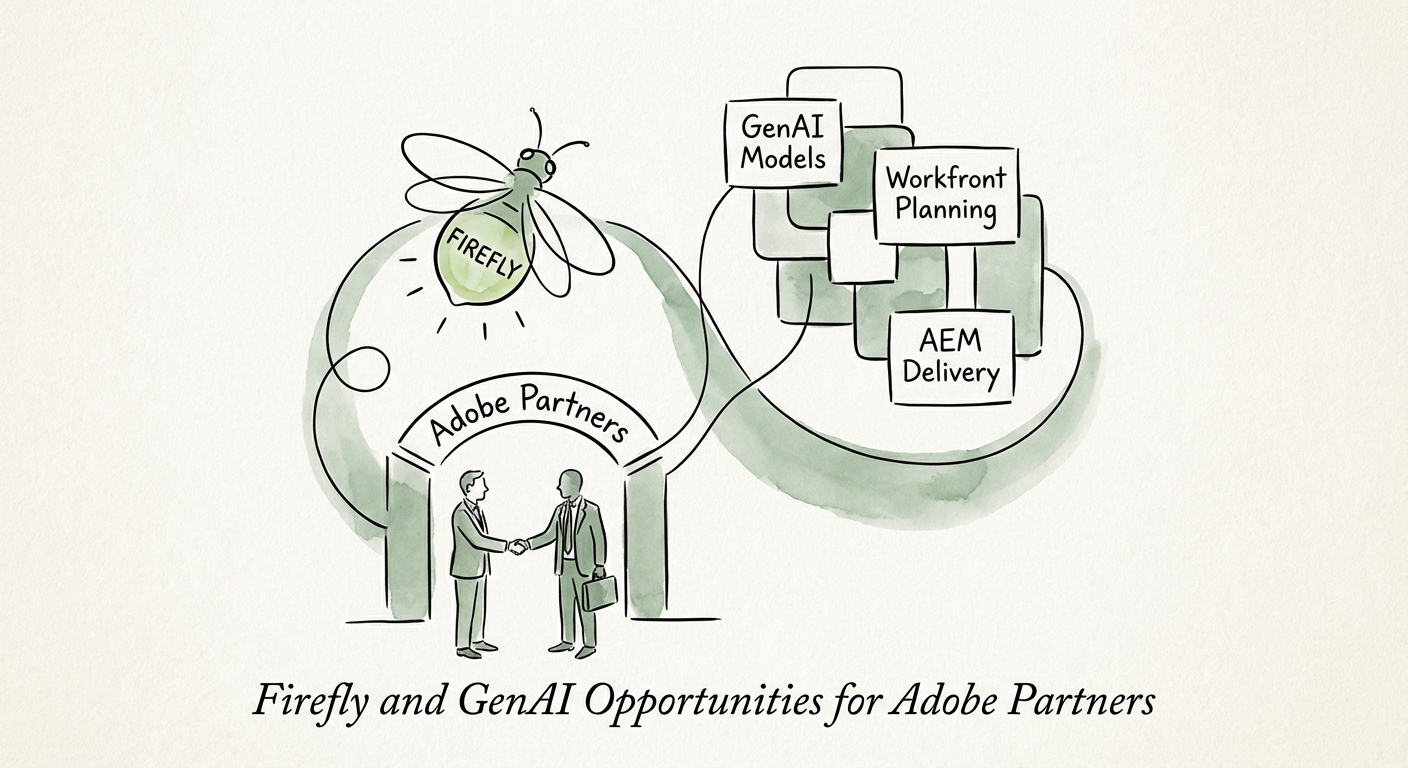
The Firefly Multiplier: Why Adobe Partners Must Pivot to 'Content Supply Chains' to Unlock 12x Exits
Why Adobe Partners must pivot from creative services to 'Content Supply Chains' using Firefly. Valuation impact, efficiency metrics, and the 12x exit strategy.
500% Projected Content Demand Growth
BRIEF · UNIT ECONOMICS
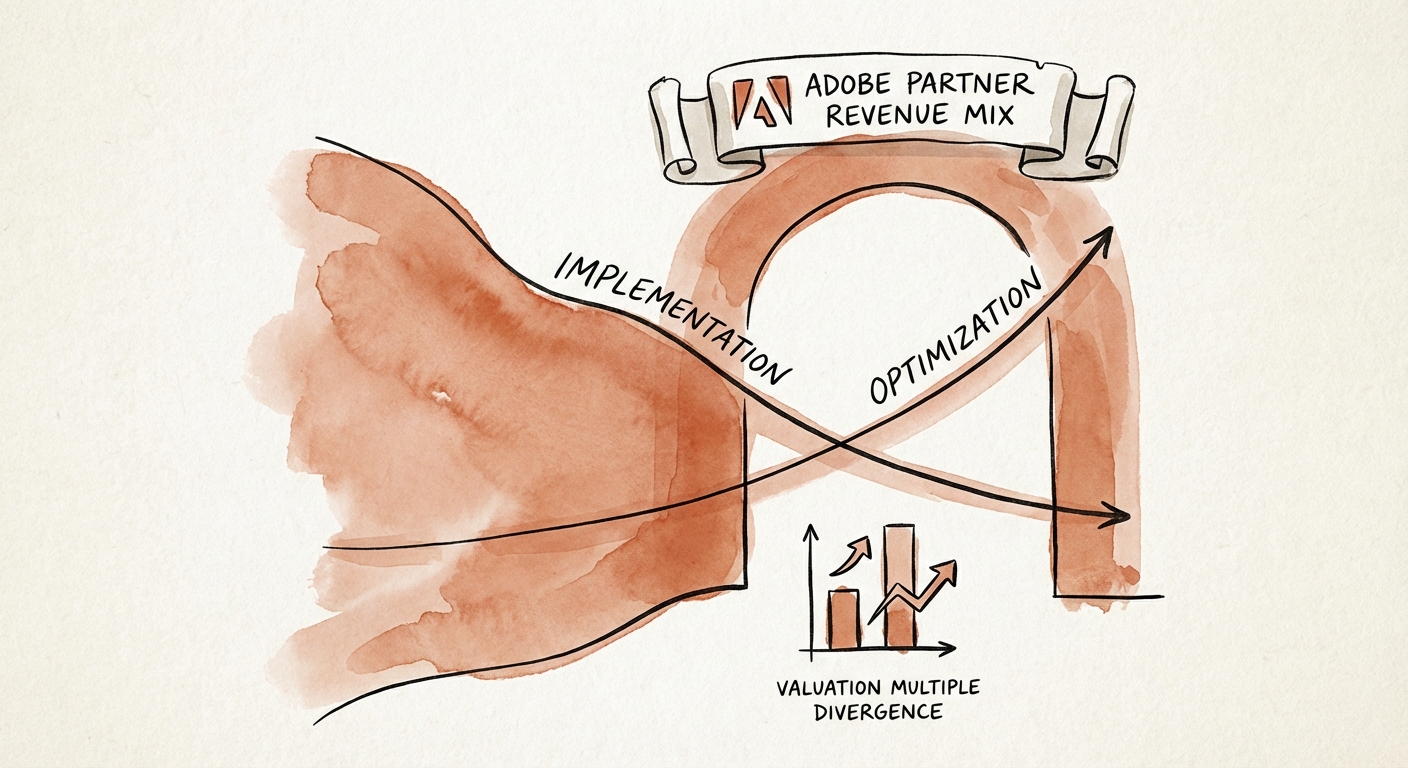
Two Adobe Partners, Same Revenue, Triple the Valuation: What the AEM Implementation Shops Are Getting Wrong
Two $30M Adobe partners. One sells 8x EBITDA, one sells 13x. The difference isn't size or Platinum status — it's what your AEP retainer actually does.
12x EBITDA Multiple for Optimization-First Partners
BRIEF · FOUNDER EXTRACTION
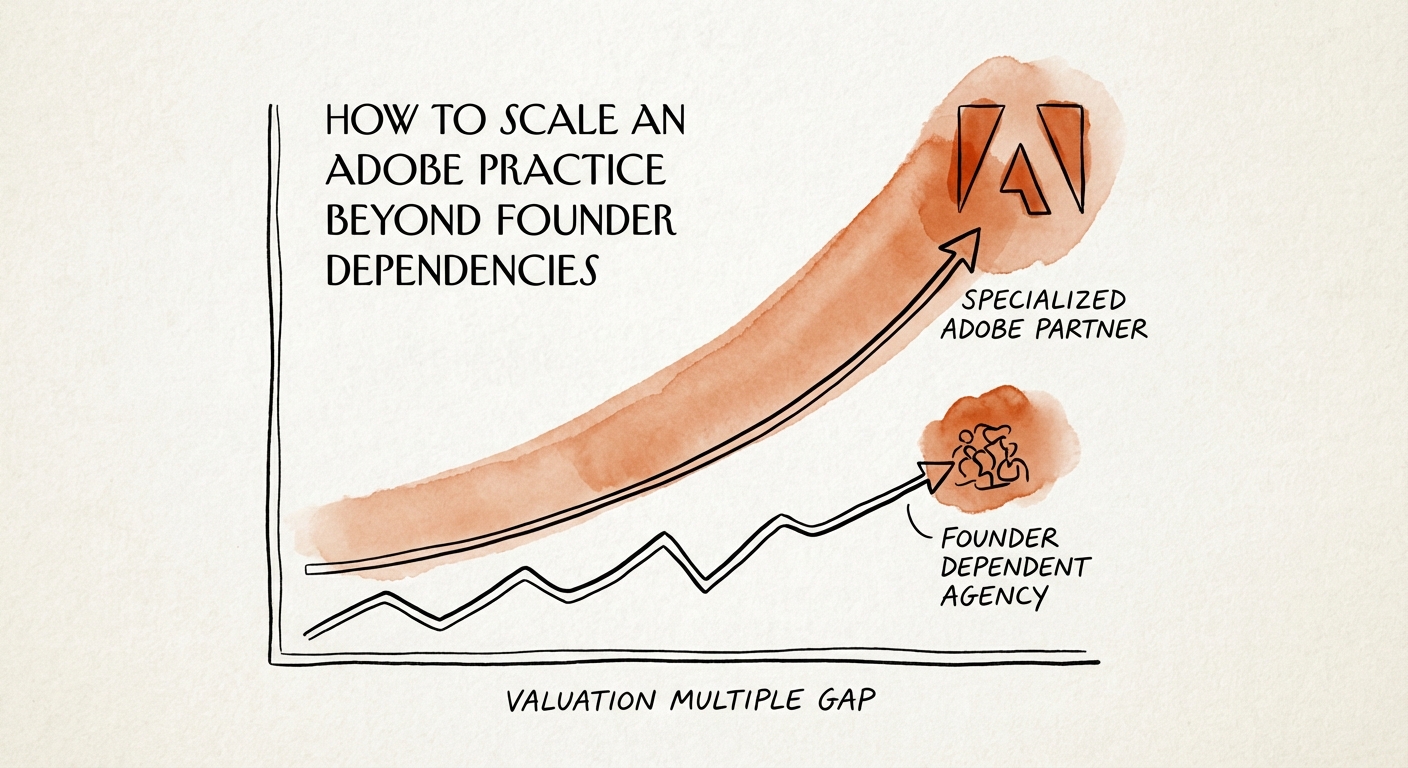
The $10M Adobe Ceiling: How to Scale Your Practice Beyond Founder Dependency
Why Adobe partners stall at $10M revenue. A diagnostic guide to founder extraction, valuation benchmarks, and the 2026 Unified Partner Program changes.
30% Valuation Haircut for Founder-Dependent Firms
BRIEF · EXIT READINESS
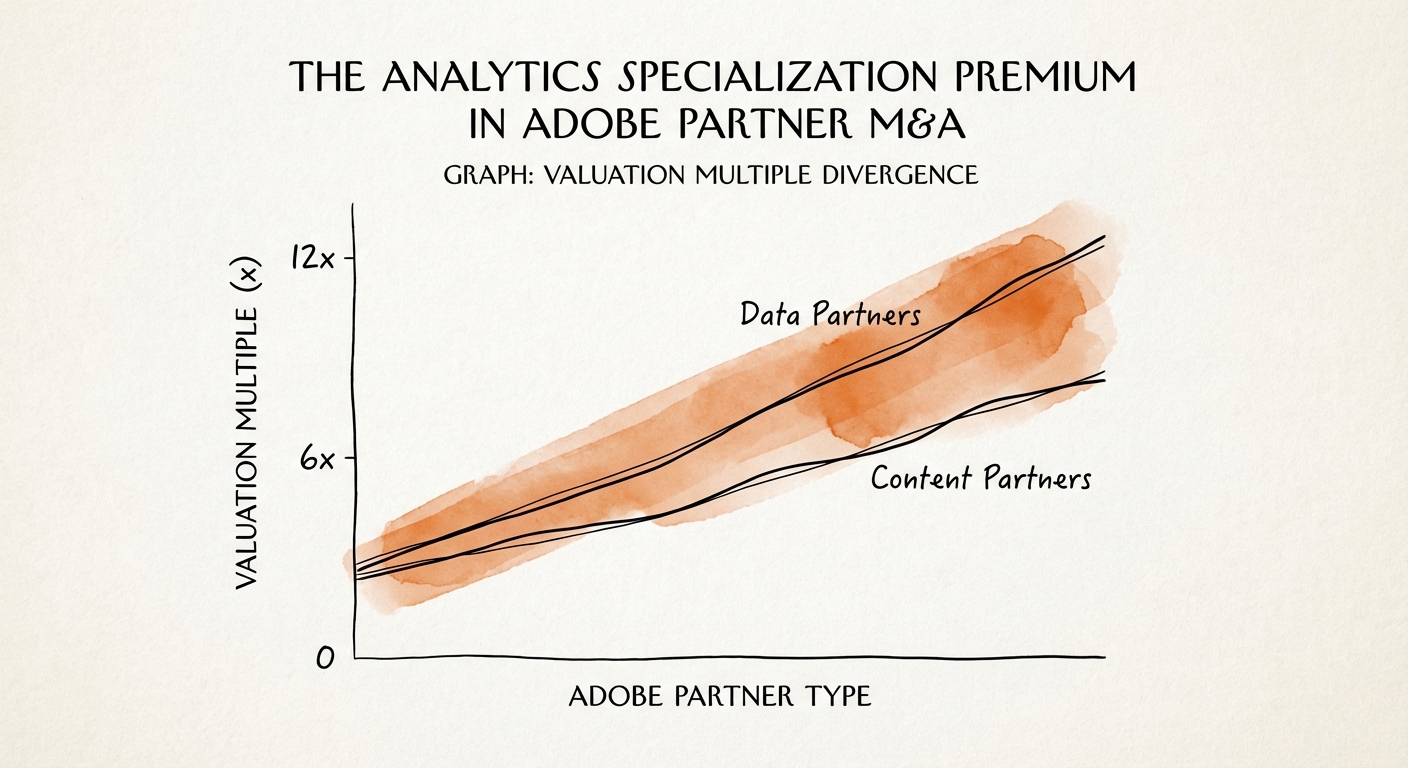
The Analytics Specialization Premium in Adobe Partner M&A
Why Adobe Analytics and AEP specialists trade at 12x EBITDA while AEM generalists stall at 6.5x. A guide for PE sponsors on maximizing Adobe partner exits.
5.5x Valuation Gap (Turns of EBITDA)
BRIEF · UNIT ECONOMICS
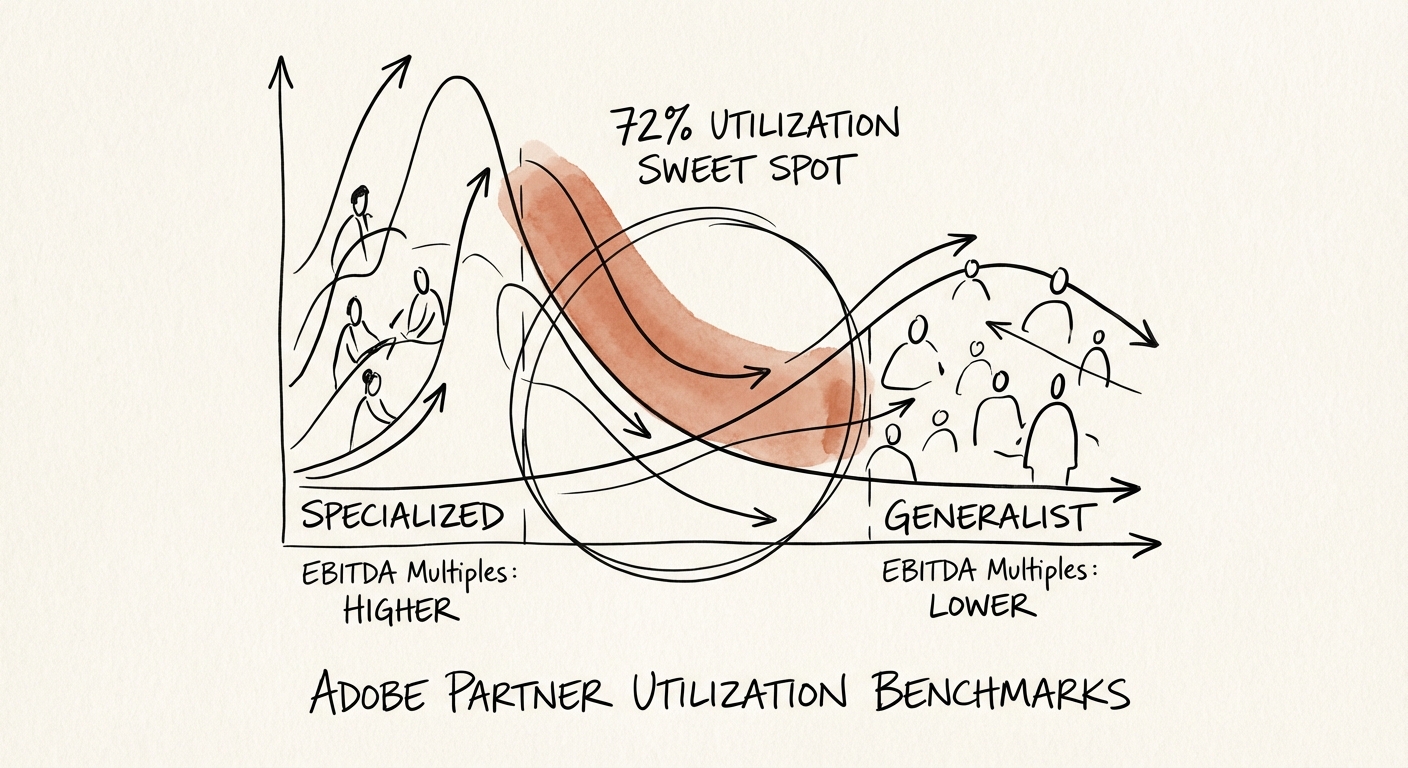
Adobe Partner Utilization Benchmarks: Why 85% Is a Trap (And the 72% Reality for Platinum Status)
Why chasing 85% utilization destroys Adobe Partner valuations. 2026 benchmarks for AEM, Commerce, and Marketo practices to maintain Platinum Specializations.
72% Optimal Utilization Rate for Specialized Partners
BRIEF · EXIT READINESS
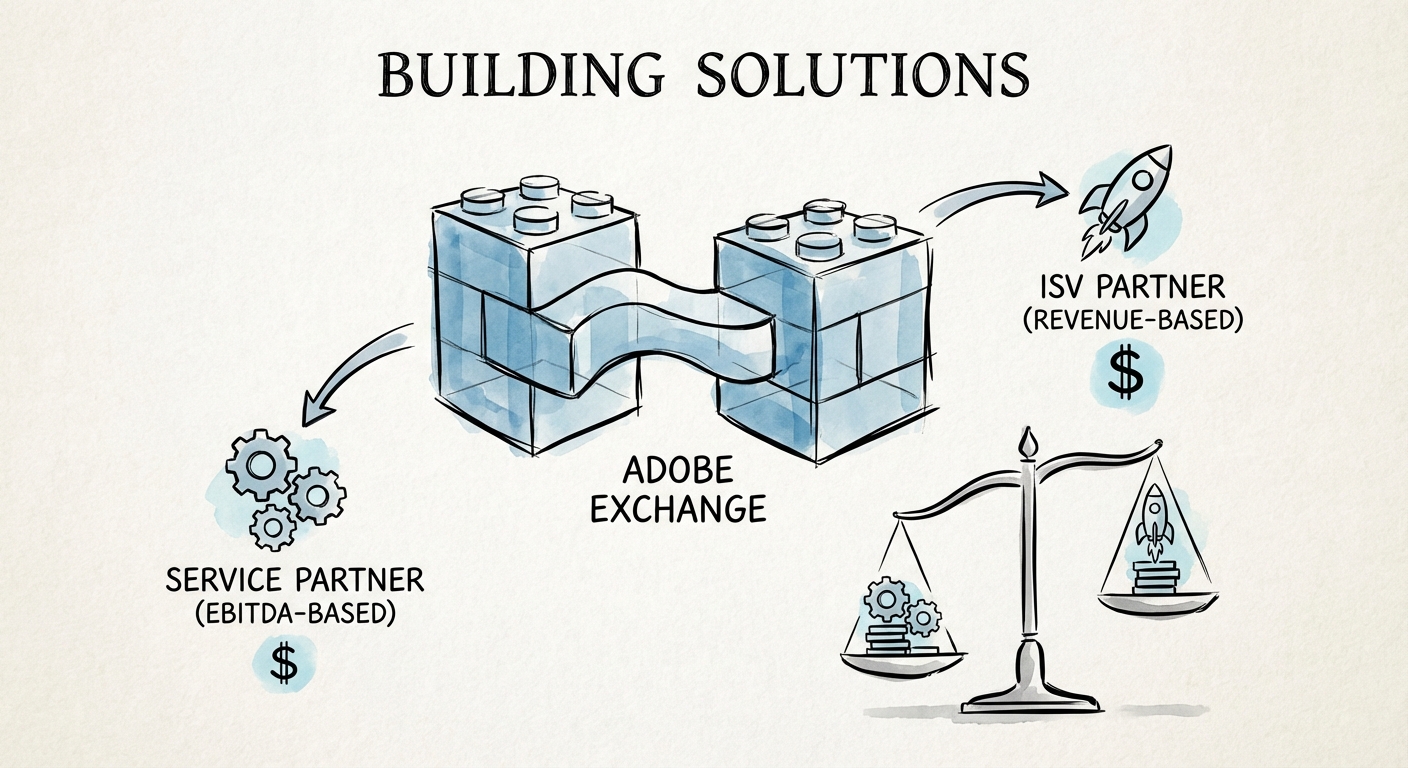
The Adobe Exchange Valuation Gap: Why 'Apps' Trade at 8x Revenue and 'Agencies' Stall at 8x EBITDA
Building on Adobe Exchange? Discover why ISVs trade at 8x revenue while service partners stall at 8x EBITDA. A strategic diagnostic for Adobe partners.
6x-10x Target Revenue Multiple
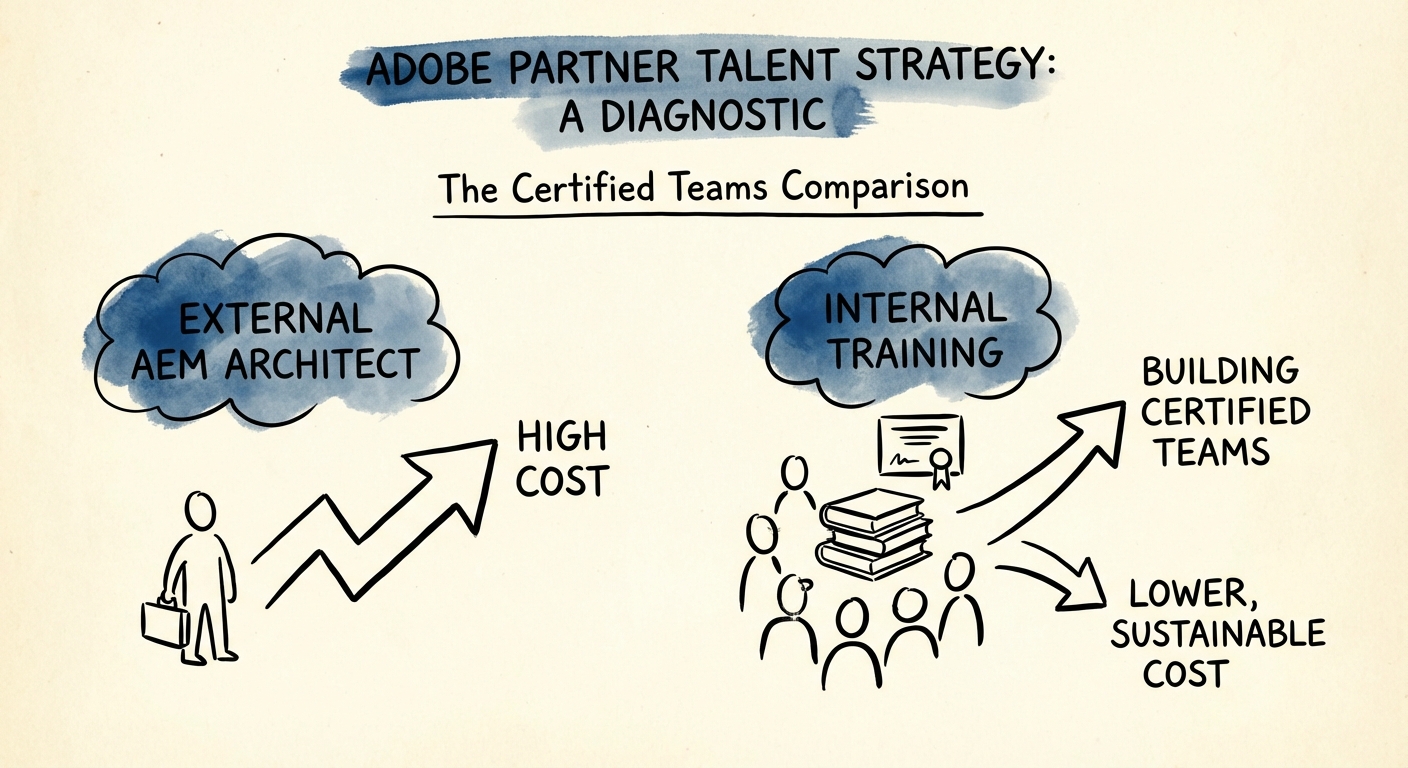
BRIEF · TEAM & HIRING
The Adobe Platinum Trap: Why Your AEM Architects Are Sitting in Pre-Sales Instead of Billing
Adobe's tier ladder rewards certified headcount, not margin. How partners stop overpaying for AEM Architects, spot the exam-dump 'Paper Tiger,' and build a bench that bills.
$287,500 True First-Year Cost of a Mis-Hired AEM Architect
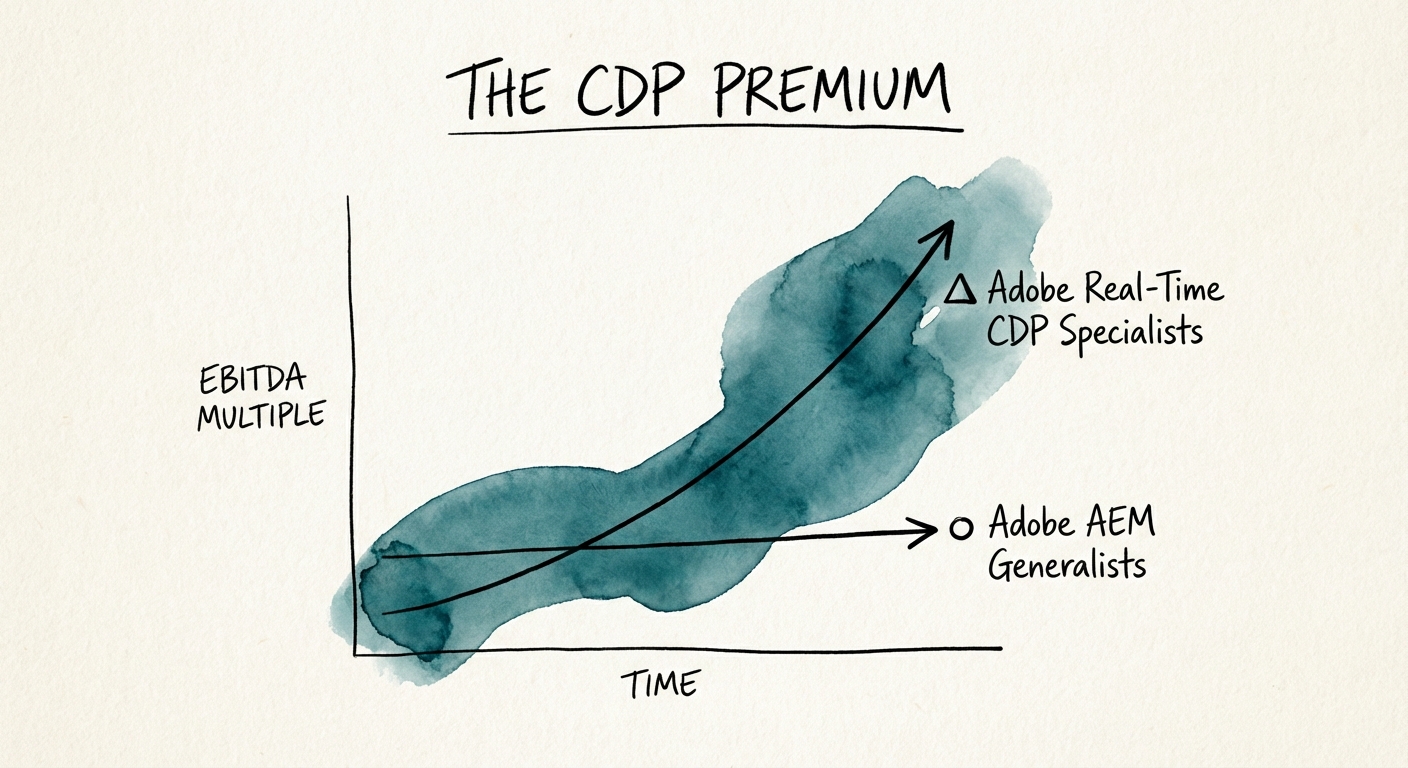
BRIEF · EXIT READINESS
The CDP Premium in Adobe Partner Valuations: The Gap Between 8x and 14x
Why Adobe Real-Time CDP specialists command 14x EBITDA multiples while AEM generalists stall at 8x. M&A benchmarks for Adobe partners in 2026.
14x EBITDA Multiple for CDP Specialists
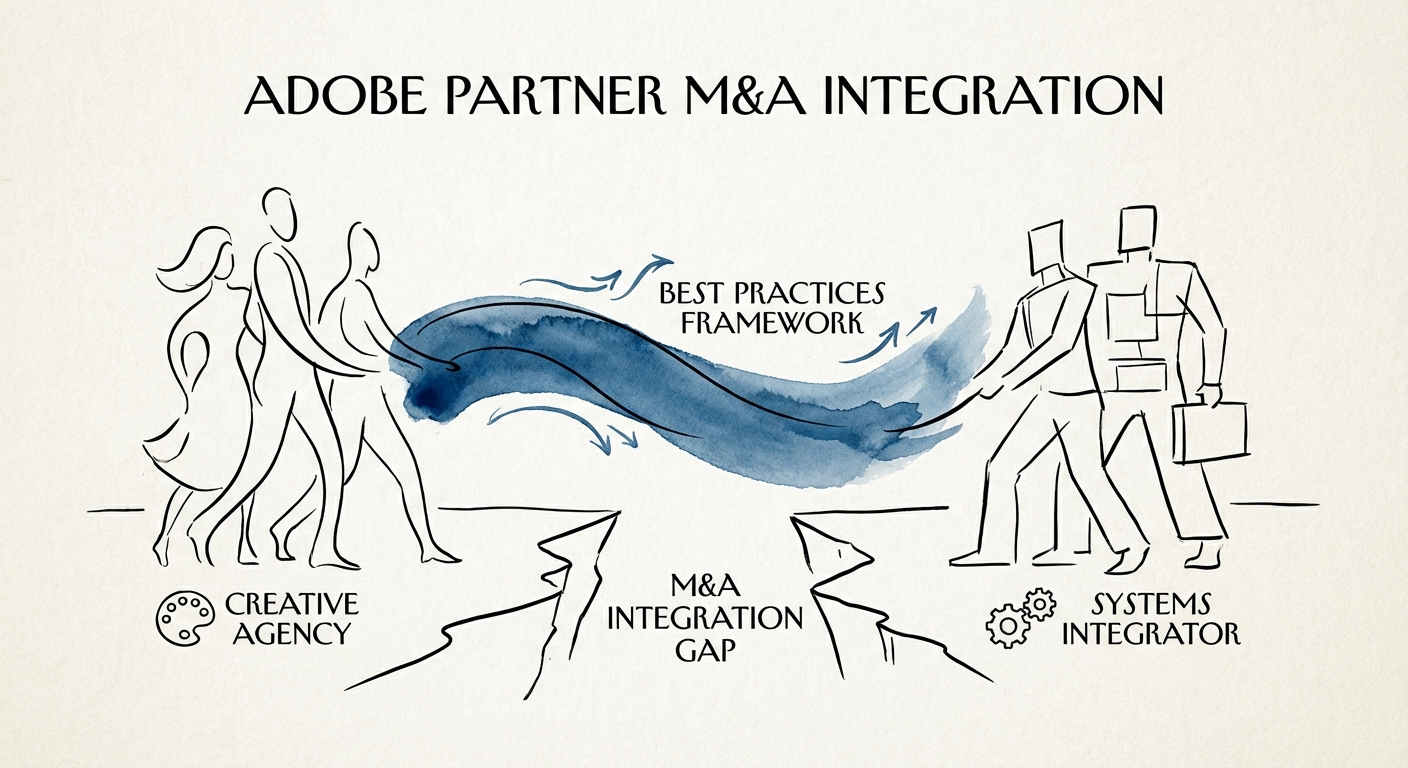
BRIEF · MIGRATION & INTEGRATION
The Adobe Partner M&A Playbook: Preventing the 30% Valuation Leak
A diagnostic guide for PE sponsors integrating Adobe partners. Covers the 'Creative vs. Technical' culture clash, retaining Platinum status, and preventing the 30% post-merger valuation leak.
47% Key Talent Attrition Rate Post-Merger
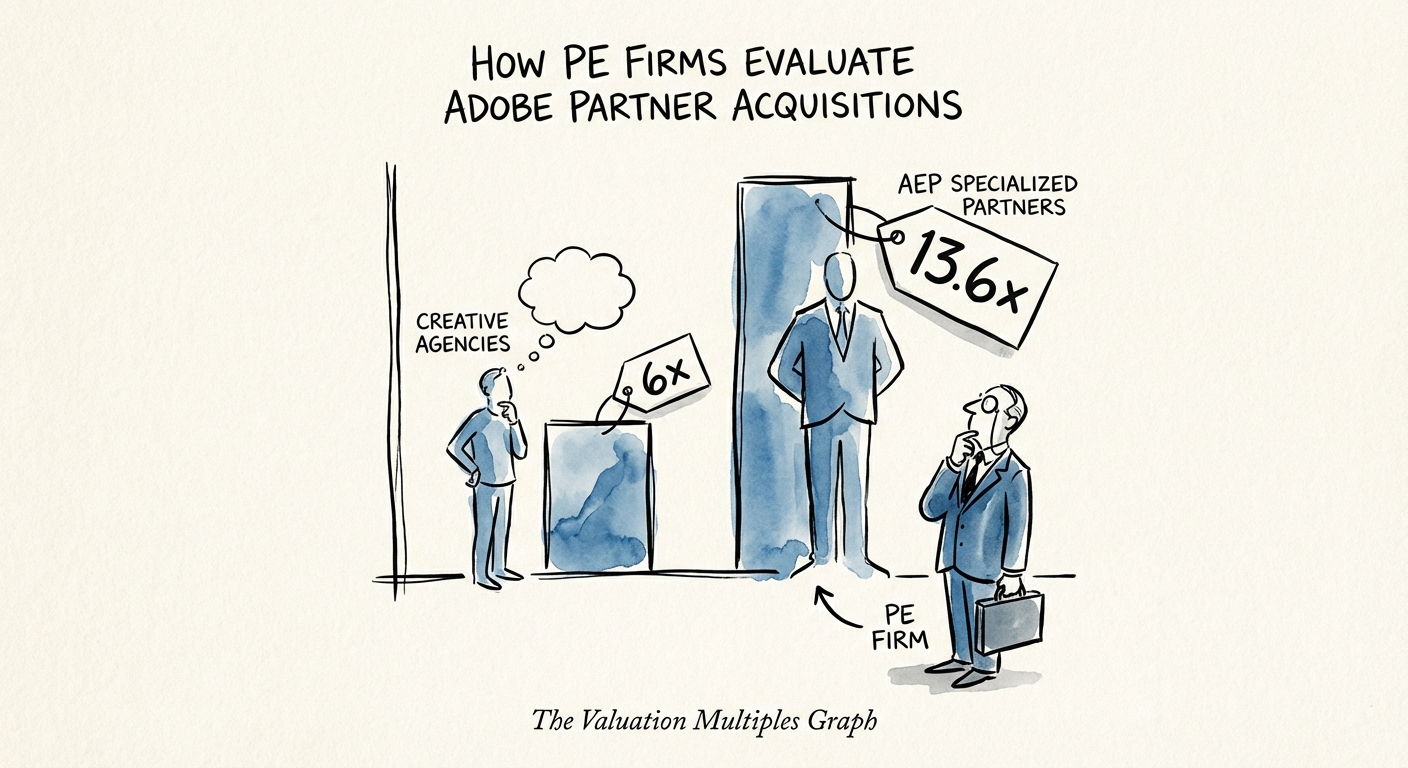
BRIEF · EXIT READINESS
How PE Firms Evaluate Adobe Partner Acquisitions: The 2026 Diagnostic
A Private Equity due diligence framework for Adobe Partners. Valuation benchmarks for AEP, Commerce, and Content Supply Chain practices in 2026.
13.6x EBITDA Multiple for AEP Specialists
BRIEF · UNIT ECONOMICS
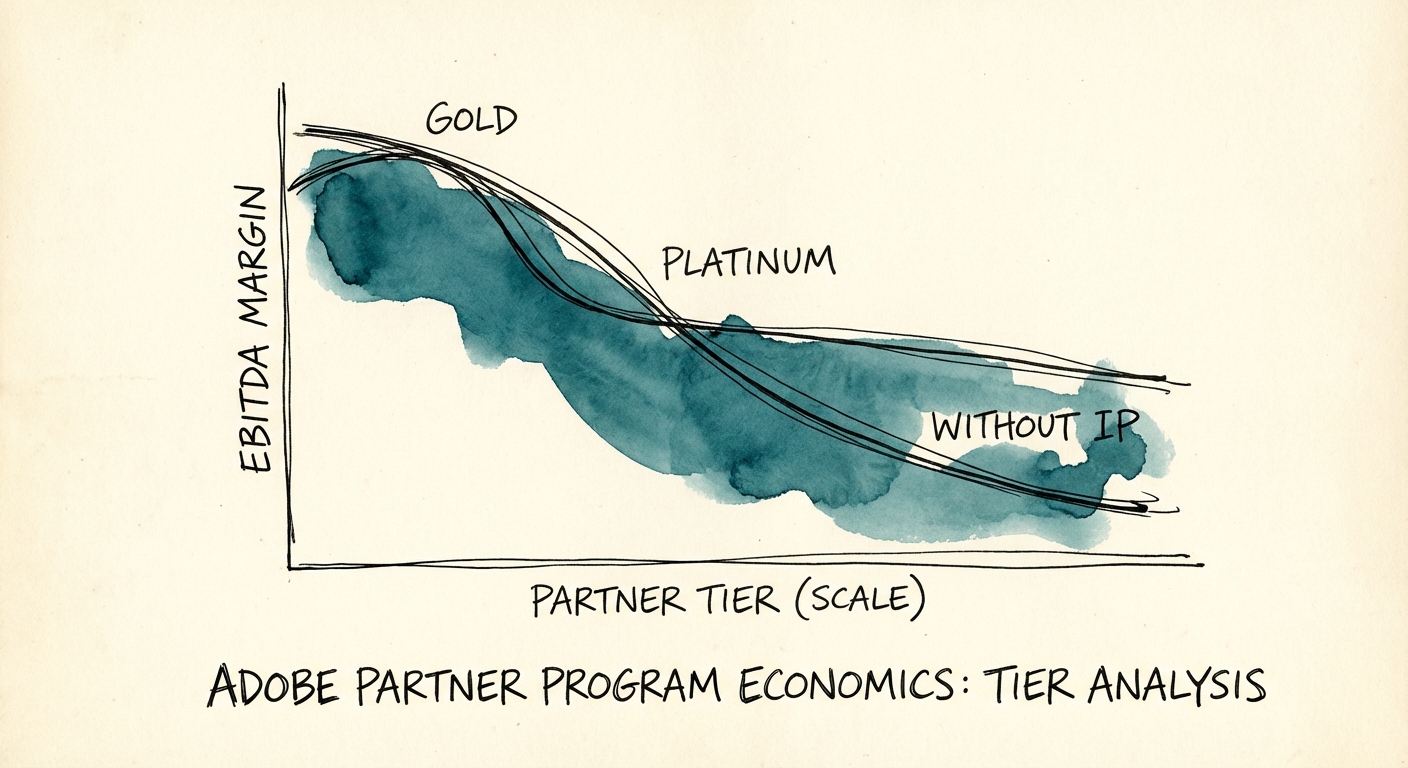
The Adobe Platinum Trap: Why Tier Ascension Kills Margins (And How to Fix It)
Analysis of Adobe Solution Partner Program economics. Why chasing Platinum status can erode EBITDA margins by 22% and how specialized boutiques command higher PE valuations.
22% EBITDA Margin Erosion from 'Vanity' Tier Maintenance
BRIEF · PROCESS DOCUMENTATION
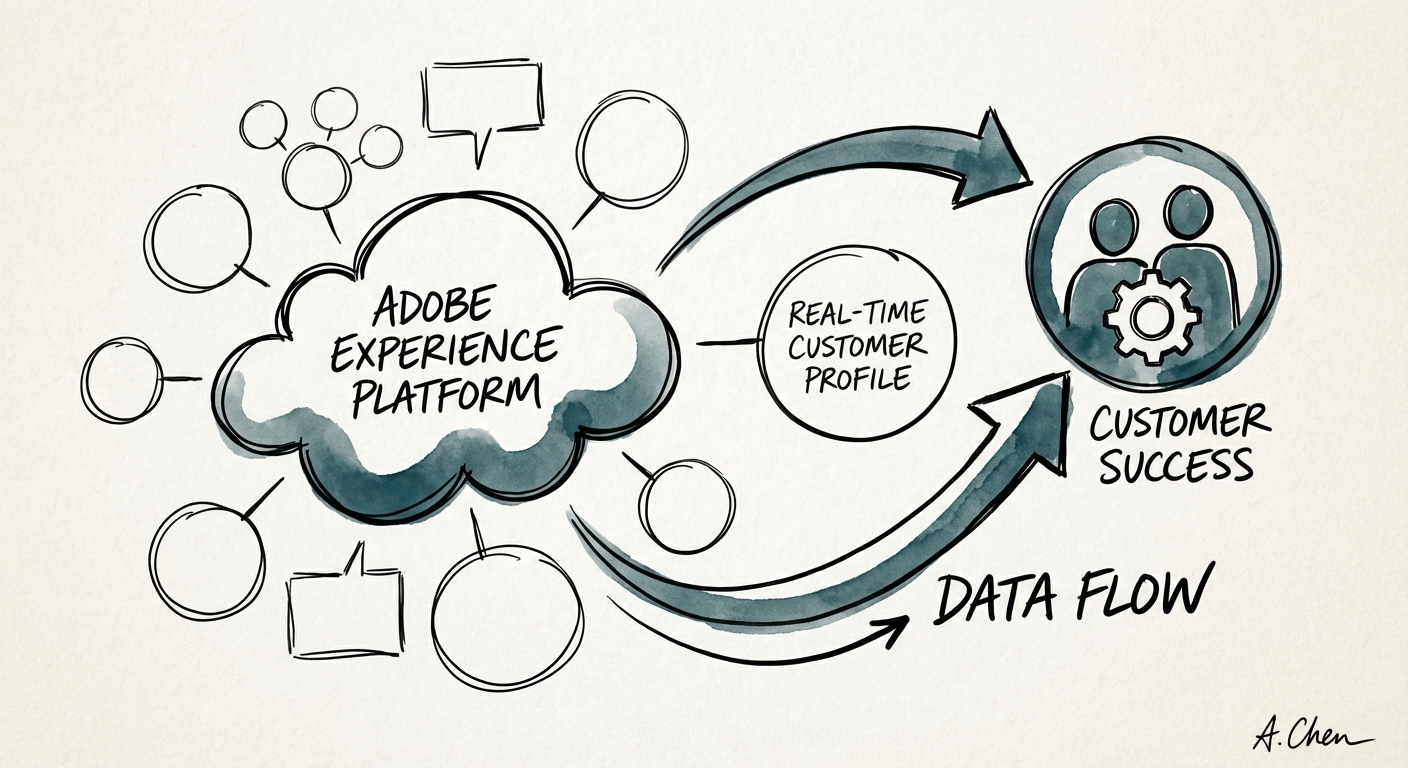
The 'Data Gravity' Trap: Why Adobe Experience Platform Projects Stall
Why Adobe Experience Platform (AEP) projects stall and how to fix them. A diagnostic guide for executives on preventing data governance stalls and selecting the right implementation partner.
17% High Utilization Rate
BRIEF · REVENUE ARCHITECTURE
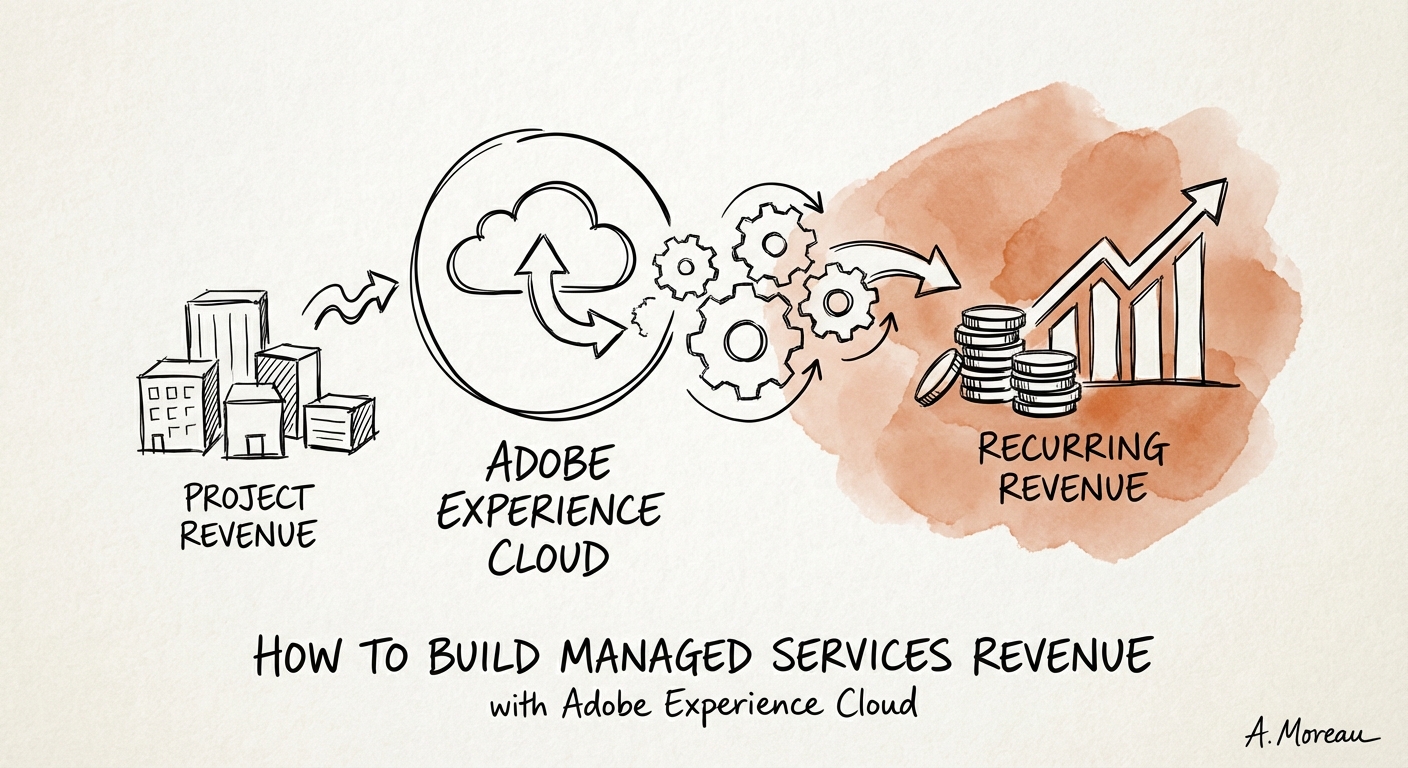
How to Build Managed Services Revenue with Adobe Experience Cloud (And Escape the Project Trap)
For Adobe Partners, the 'lift and shift' era is over. Learn how to pivot from project revenue to high-margin Managed Services and unlock a 12x valuation.
12x EBITDA Multiple for MSP vs. 5x for Project Shops
BRIEF · TECHNICAL DEBT
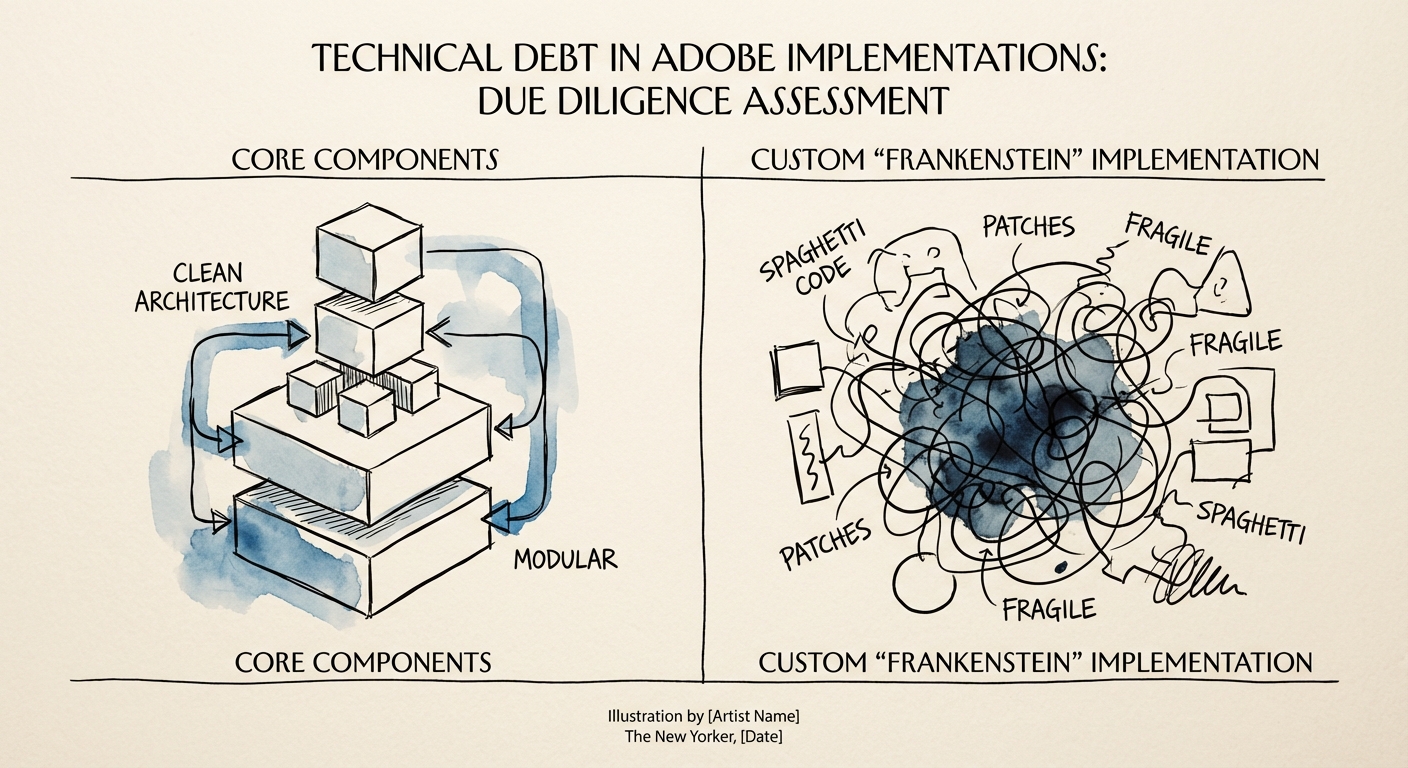
The Adobe Customization Trap: Why 'Unique' Implementations Are a 2.2x Liability
Why your target's 'custom' Adobe implementation is a liability. A PE guide to assessing technical debt in AEM and Adobe Commerce before you buy.
2.2x Maintenance Cost Multiplier
BRIEF · EXIT READINESS
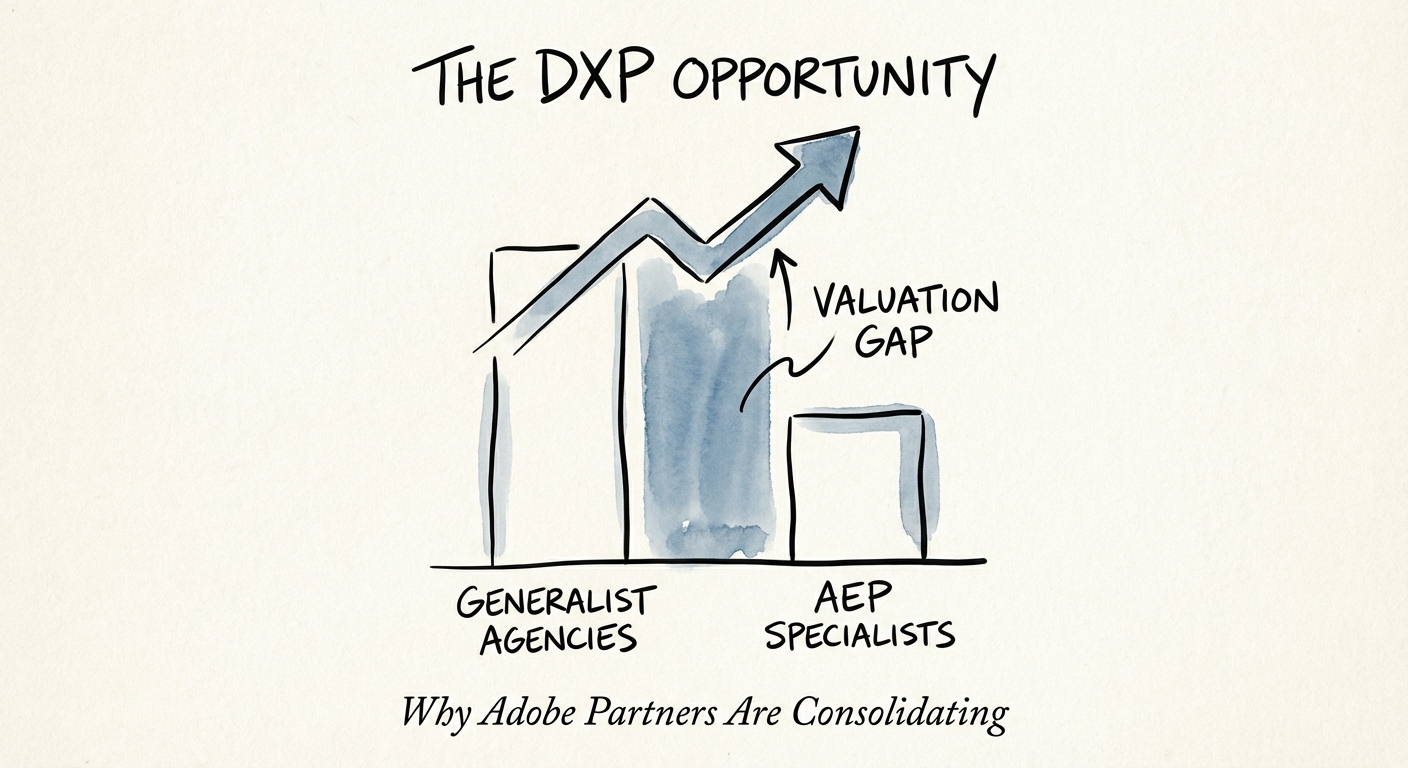
The DXP Opportunity: Why Adobe Partners Are Consolidating
Private equity is rolling up Adobe partners. Learn why AEP specialization commands 14x multiples while generalist agencies stall at 6x.
14x EBITDA Multiple for AEP Specialists
BRIEF · EXIT READINESS
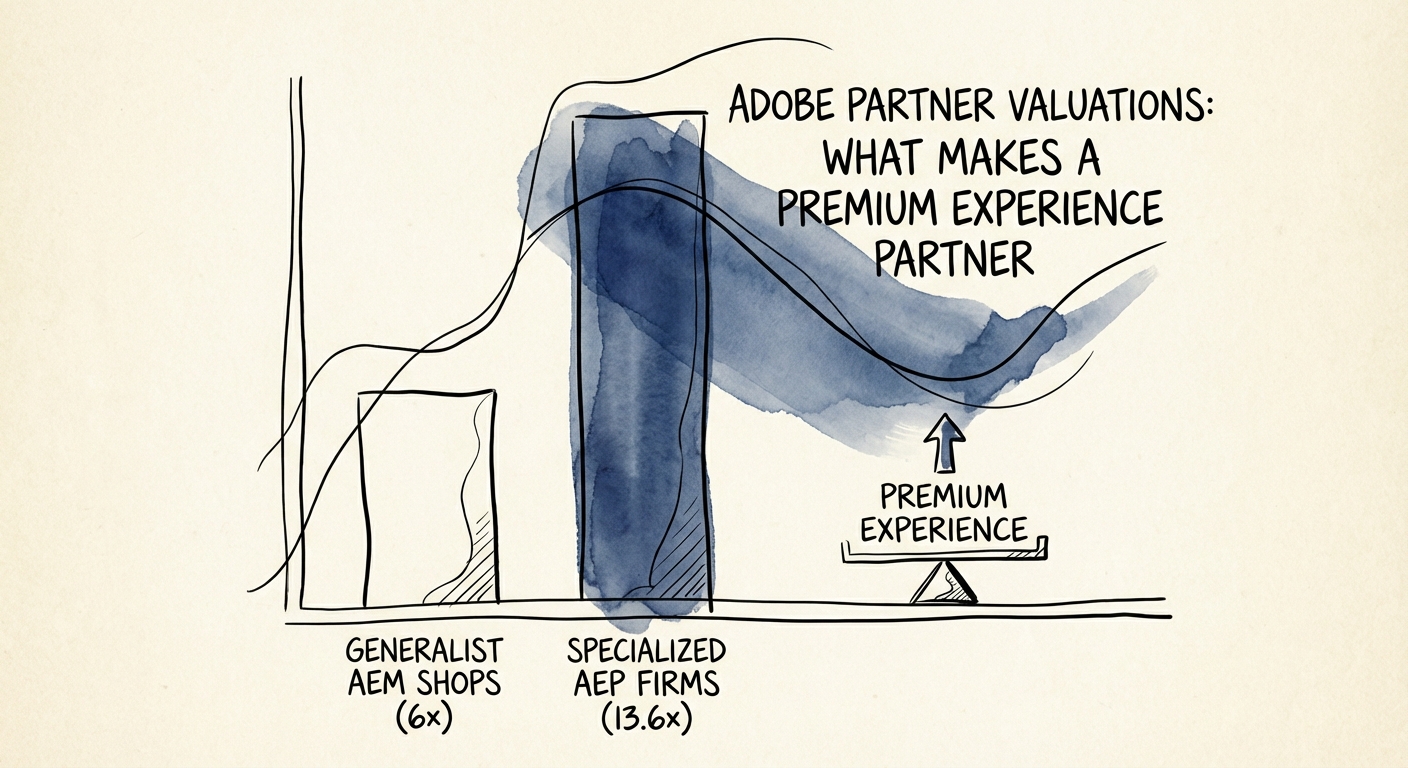
Adobe Partner Valuations: The Gap Between 'Creative Agency' and 'Digital Product Studio'
Why specialized Adobe Experience Platform (AEP) partners trade at 13.6x EBITDA while generalist AEM shops stall at 6x. A diagnostic for PE sponsors.
13.6x EBITDA Multiple for Specialized AEP Partners
BRIEF · GTM EXECUTION
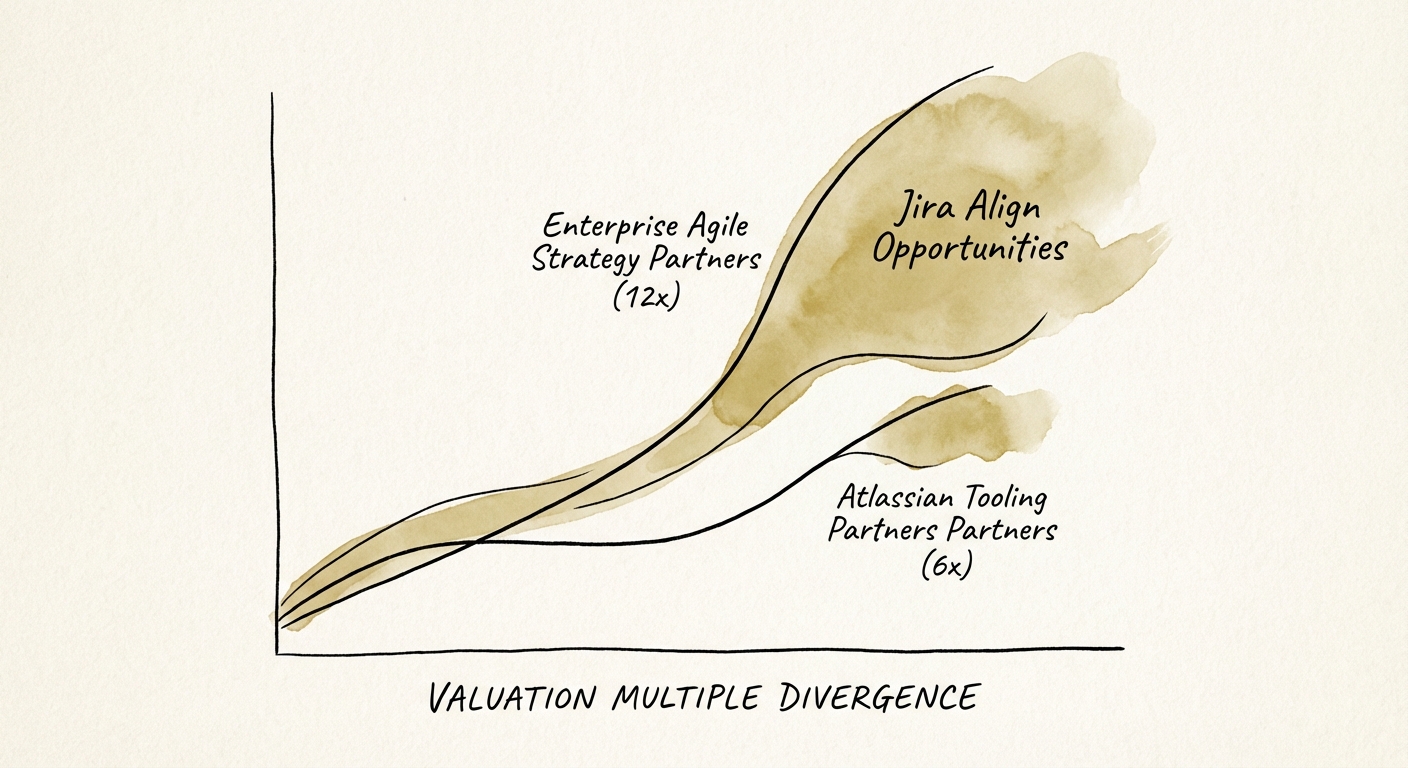
The Jira Align Premium: Why Enterprise Agile Shops Trade at 12x (And Tooling Partners Stall at 6x)
Stop selling seats. Start selling strategy. Discover why Jira Align practices command 12x multiples and how to pivot your Atlassian firm from 'admin' to 'advisor'.
12x EBITDA Multiple
BRIEF · EXIT READINESS
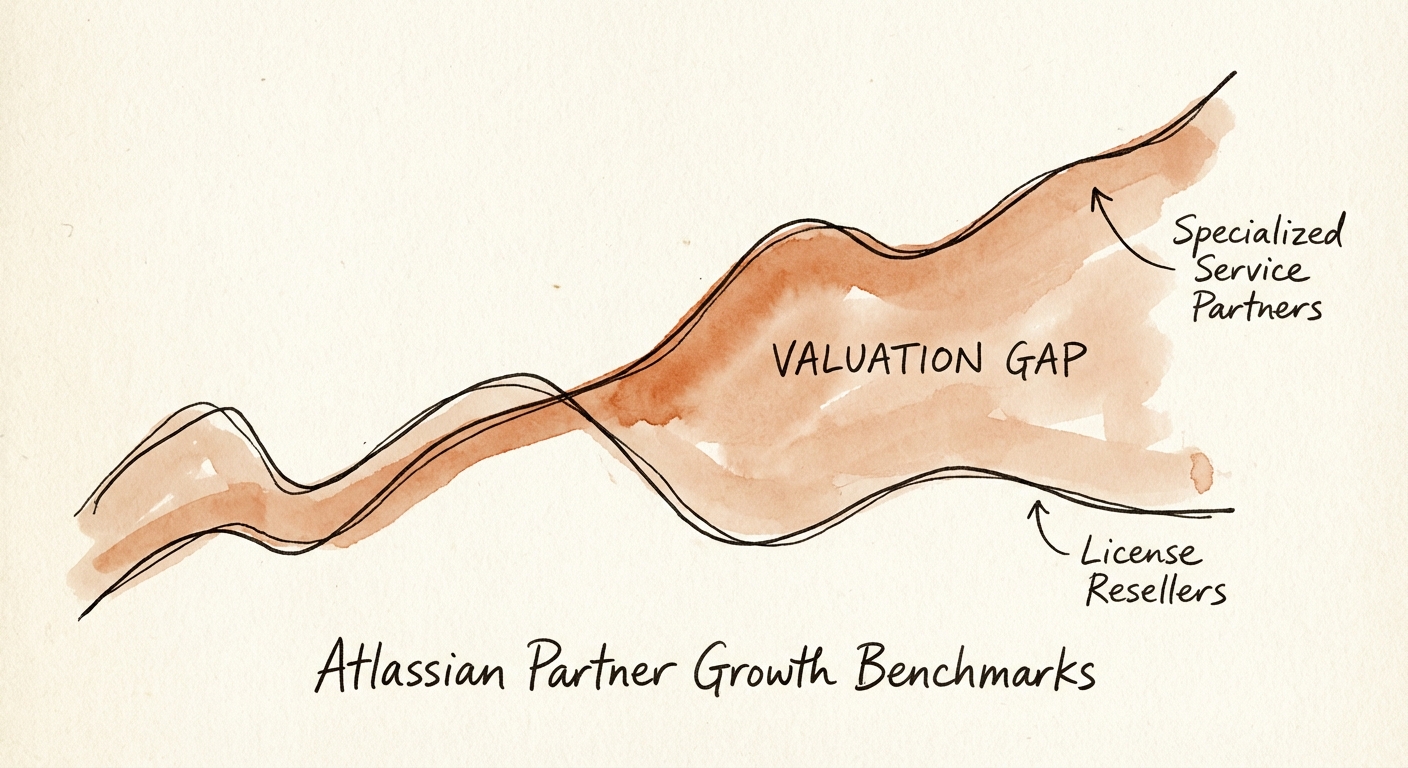
Atlassian Partner Growth Benchmarks: The Gap Between "License Resellers" and "Strategic Consultants"
Are you a Reseller or a Consultant? Why Atlassian partners stall at $10M, the valuation gap between License and Services revenue, and the 2026 growth benchmarks.
30% Min. Growth Rate