BRIEF · UNIT ECONOMICS
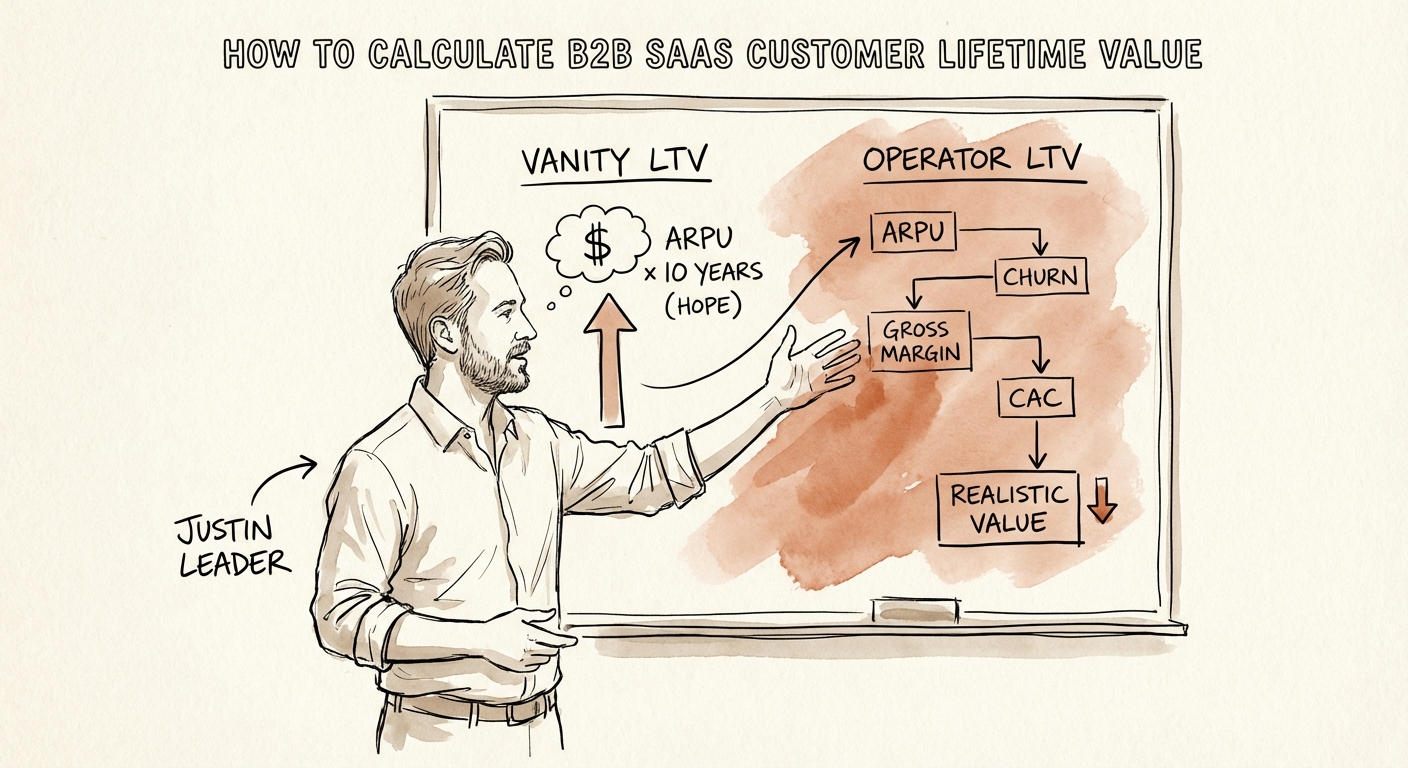
How to Calculate Customer Lifetime Value for B2B SaaS: The Operator's Guide
Stop using the 'MBA formula' for LTV. It hides churn, ignores expansion, and kills Series B startups. Here is the operator's guide to calculating true B2B SaaS LTV.
15 Months Median CAC Payback
BRIEF · TECHNICAL DEBT
Technical Debt Remediation: The 6-Month "Quick Win" Roadmap (Stop the Grand Rewrite)
Stop the 'Grand Rewrite.' A CEO-level guide to prioritizing technical debt. Focus on a 6-month remediation roadmap that restores velocity and protects EBITDA.
42% Developer time lost to technical debt
BRIEF · GTM EXECUTION
RevOps Implementation Timeline: From Chaos to 90% Forecast Accuracy in 120 Days
A 120-day RevOps implementation roadmap for scaling SaaS founders. Move from spreadsheet chaos to 90% forecast accuracy with this operator-led timeline.
90% Forecast Accuracy Target
BRIEF · COMPLIANCE & SECURITY
Healthcare IT Due Diligence: Compliance Considerations for Acquirers
Healthcare IT due diligence guide for PE acquirers. Uncover hidden security debt, HIPAA compliance traps, and the $10.22M risk factors that kill deal value.
$10.22M Avg. US Healthcare Breach Cost
BRIEF · MIGRATION & INTEGRATION
The 'Who Decides?' Trap: A RACI Matrix That Actually Unblocks Integration
Stop decision latency in your portfolio companies. A field-tested RACI matrix template for post-merger IT integration that clears bottlenecks and accelerates EBITDA realization.
50% Deal value lost due to slow integration
BRIEF · UNIT ECONOMICS
SaaS Quick Ratio: The One Number That Tells You If Your Growth Is Real
Your SaaS Quick Ratio divides revenue you won by revenue you lost. Here's how to calculate it, why 1.82 is the new median, and how to fix a number below 4.
4.0 Target Quick Ratio
BRIEF · UNIT ECONOMICS
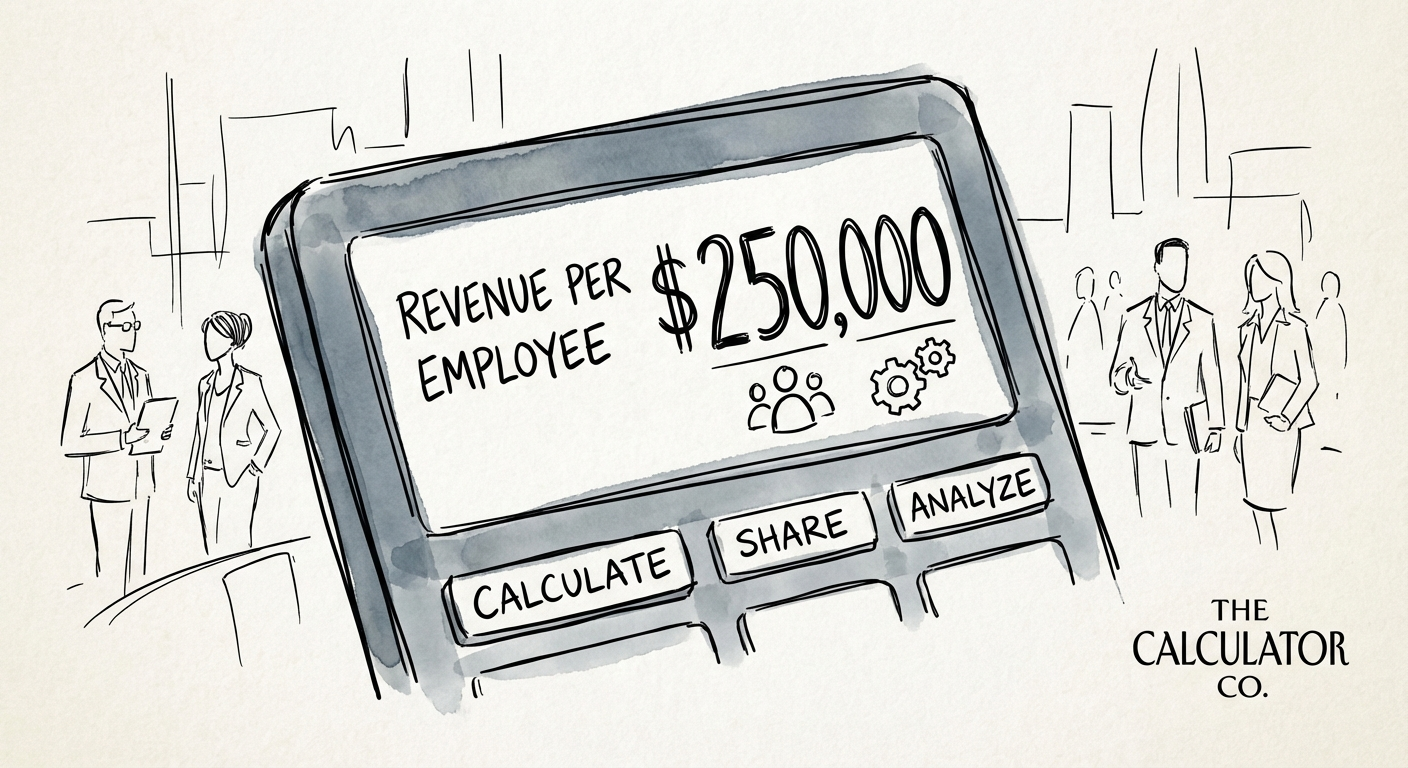
Revenue Per Employee Calculator: The Only Metric That Predicts if You're Scaling or Just Swelling
Calculate your firm's true efficiency. 2025/2026 benchmarks for Revenue Per Employee in professional services. Why <$200k is the danger zone and how to hit $300k.
$261,000 High-Performer Revenue Per Employee Target
BRIEF · EXIT READINESS
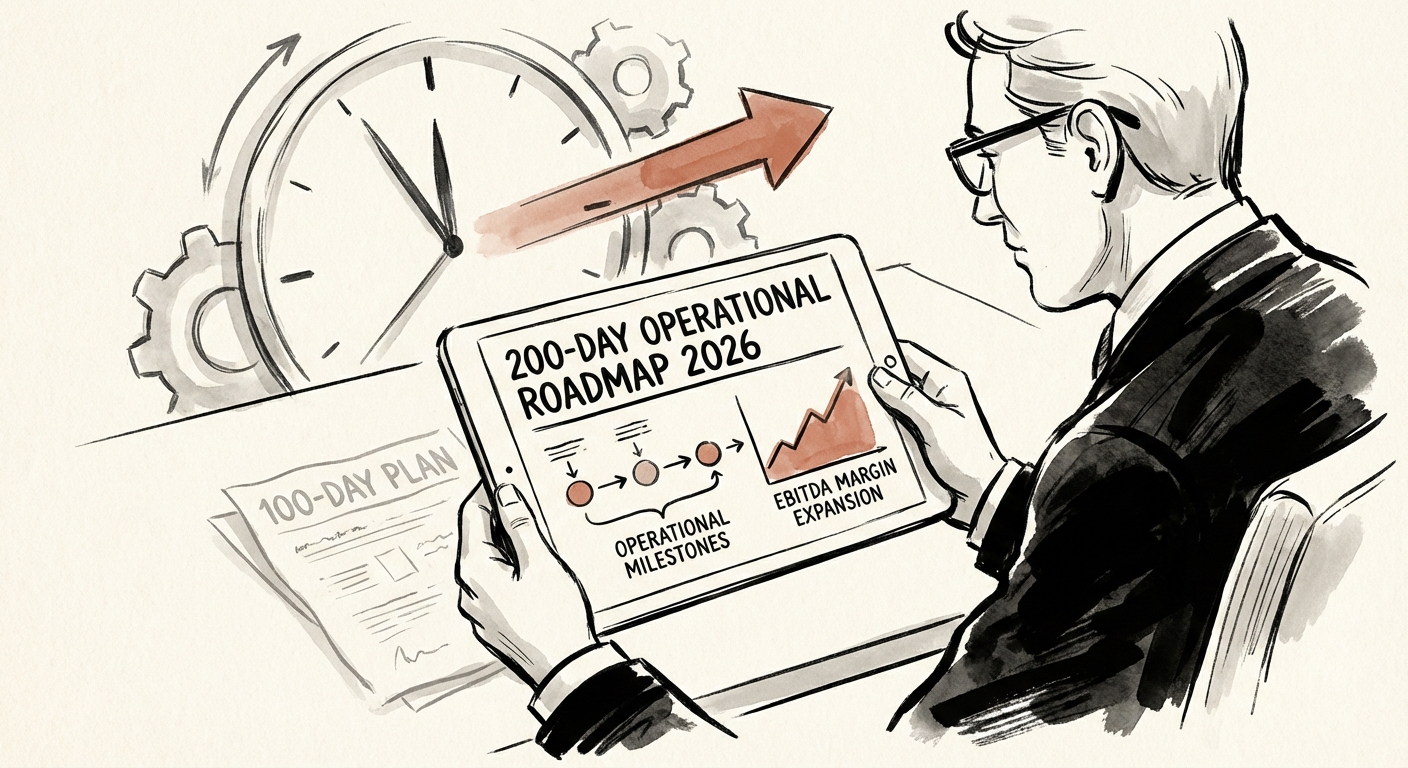
The 100-Day Plan Is Dead: The 200-Day Operational Roadmap for 2026
The 100-day plan is dead. With 2025 PE hold periods hitting 6.4 years, you need a 200-day structural roadmap. Here is the operator's guide to value creation.
6.4 Years Avg. PE Hold Period (2025)
BRIEF · MIGRATION & INTEGRATION
Audit Your Synergy Tracker: 6 Columns That Decide If the EBITDA Is Real
Most synergy trackers are wish lists. Here's the 6-column audit PE operating partners can run on their spreadsheet today to find the EBITDA that won't show up in the P&L.
70% Revenue Synergy Failure Rate
BRIEF · MIGRATION & INTEGRATION
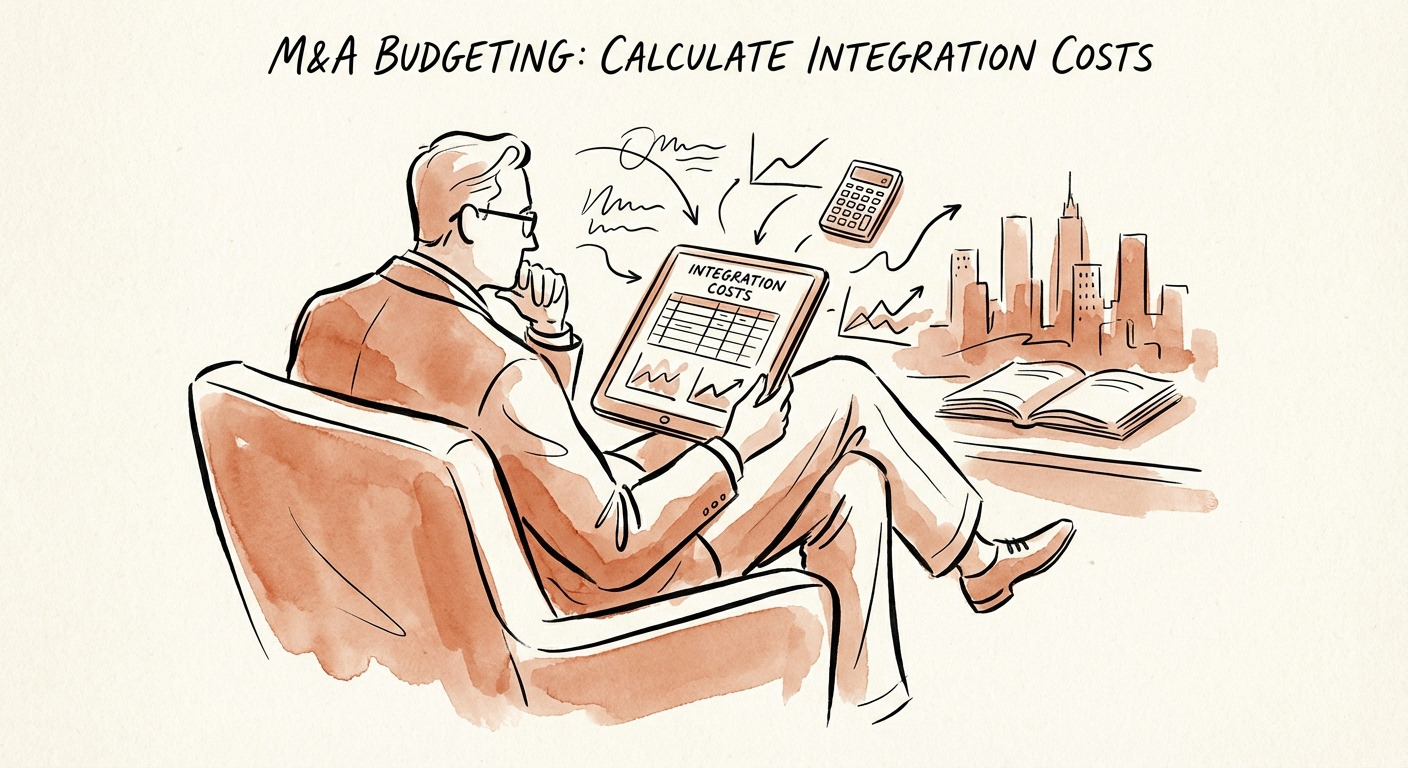
The Integration Budget Lie: Why Your 3% Estimate Will Kill Deal Value
Stop budgeting 3% for integration. Discover the Total Cost of Unification (TCU) framework and accurate benchmarks for PE-backed tech and services acquisitions.
5.6% - 10% of Target Revenue (Not Deal Value) for Tech Integrations
BRIEF · REVENUE ARCHITECTURE
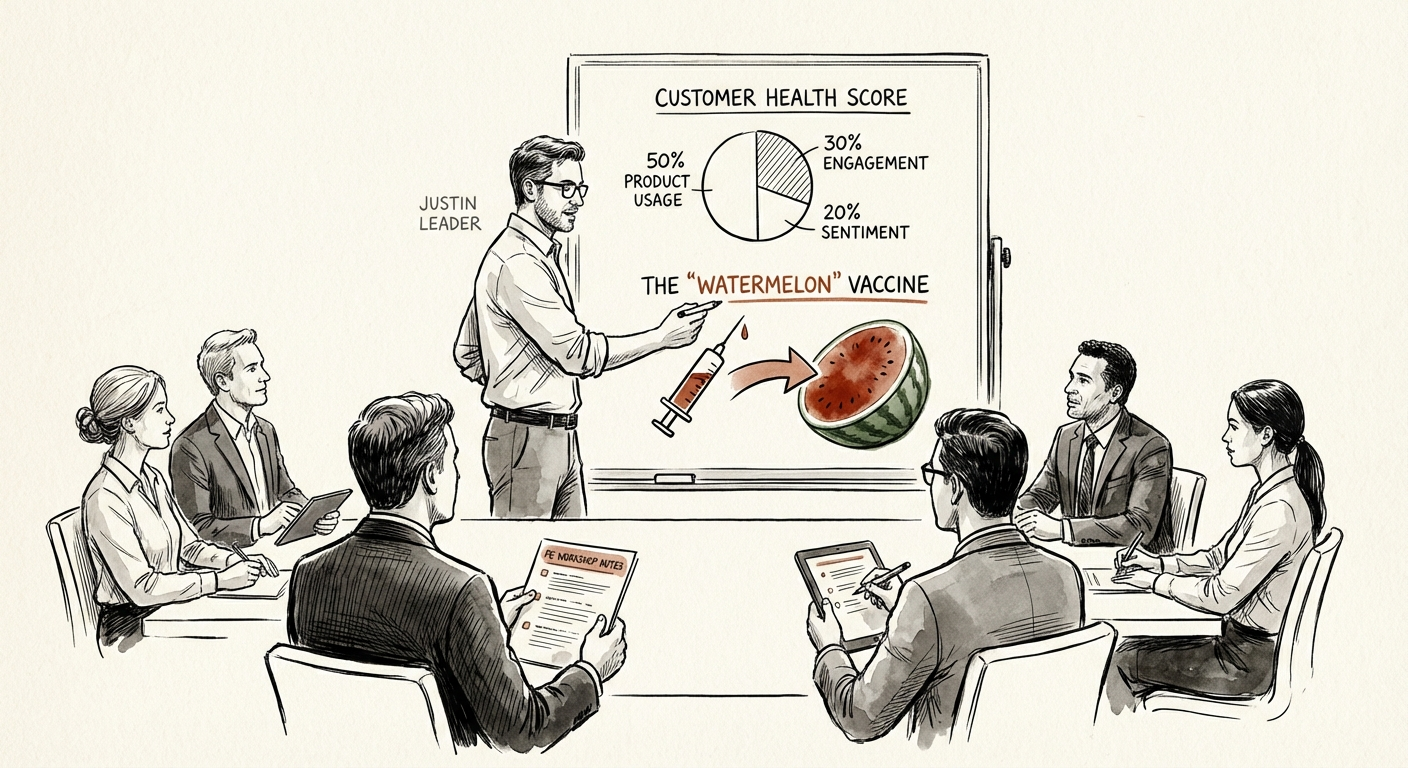
The 'Watermelon' Fix: A B2B SaaS Customer Health Score Template That Actually Predicts Churn
Stop relying on NPS. Use this weighted B2B SaaS Customer Health Score template to predict churn, fix 'Watermelon' accounts, and protect NRR. Benchmarks included.
47% Avg. License Utilization (Zylo)
BRIEF · COMPLIANCE & SECURITY
SOC 2 Timeline for Series B SaaS: How to Be Audit-Ready in 90 Days, Not 12 Months
Your six-figure deal is stuck in security review and your VP of Eng quoted 12 months. Here is the 90-day SOC 2 path that actually unblocks procurement.
35% Increase in Sales Cycle Length Without SOC 2
BRIEF · UNIT ECONOMICS
The Utilization Rate Calculator That Stops Profit Leakage
Stop using vanity metrics. Here is the utilization rate calculator and 2025 benchmarks (SPI & TSIA) that determine if your services firm is profitable or just busy.
68.9% 2025 Avg. Billable Utilization (Danger Zone)
BRIEF · FINANCIAL INFRASTRUCTURE
The Weekly Flash Report: The Only 'Truth' That Matters Between Board Meetings
Stop relying on monthly autopsies. The Weekly Flash Report is the operator's tool for 13-week cash flow visibility, revenue forecasting, and avoiding board-level surprises. Download the framework.
3.4 Days Avg. Time to Detect Revenue Miss (Weekly vs. 28 Days Monthly)
BRIEF · PROCESS DOCUMENTATION
From Series A to Series B: The 24-Month Operational Milestone Map
Only 50% of Series A startups graduate to Series B. Here is the 24-month operational roadmap to bridge the gap—from founder extraction to predictable revenue.
54% Series A to B Graduation Rate
BRIEF · TECHNICAL DEBT
The Technical Due Diligence Report Template That Actually Protects EBITDA
Stop using generic IT checklists. This Technical Due Diligence (TDD) report template quantifies technical debt into EBITDA adjustments and CAPEX requirements.
33% Engineering Payroll Wasted on Debt
BRIEF · TECHNICAL DEBT
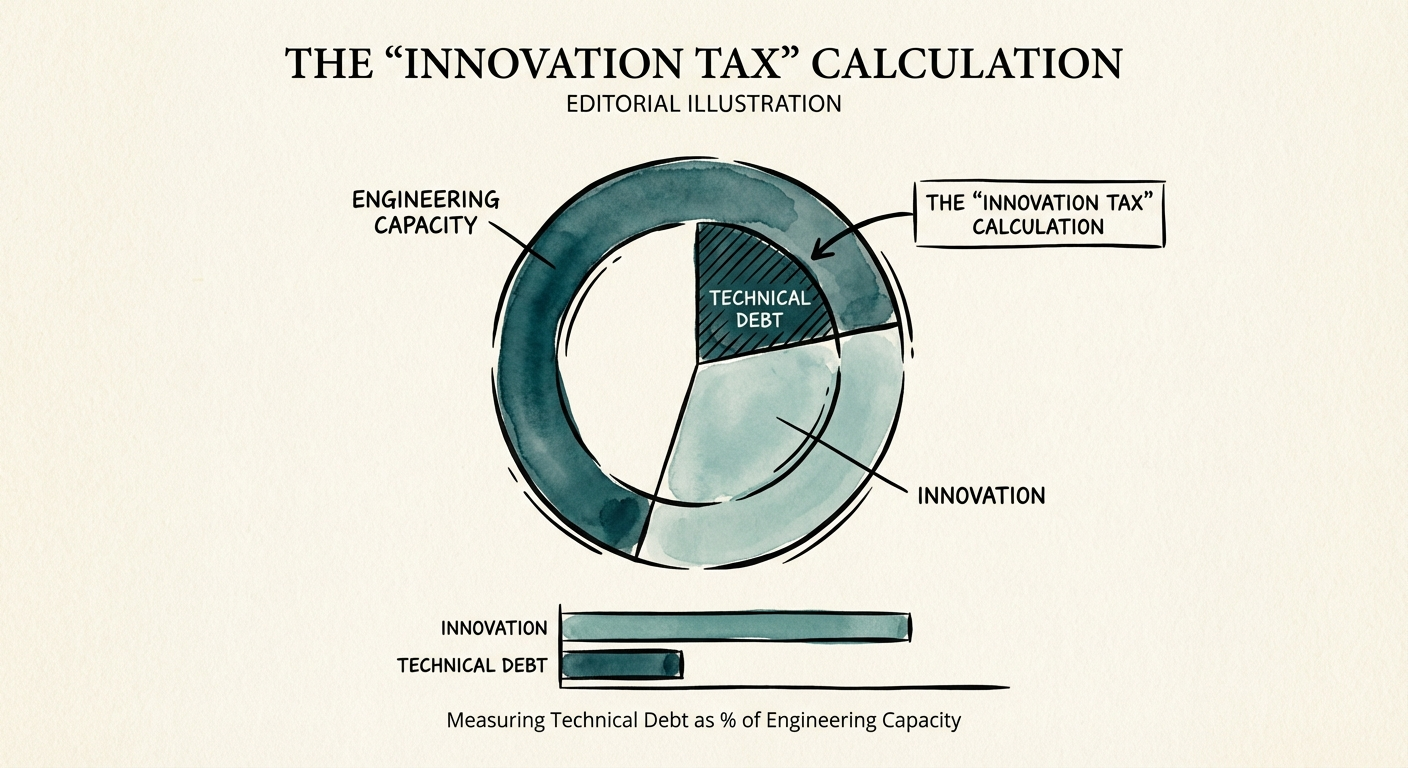
The Innovation Tax: How to Measure What Technical Debt Is Actually Costing Your Series B Roadmap
A founder's formula for calculating technical debt as a share of engineering capacity at Series B/C, plus real benchmarks, the death-spiral threshold, and the 20% rule.
42% Developer time lost to bad code (Stripe)
BRIEF · MIGRATION & INTEGRATION
M&A Technology Integration: Week-by-Week for the First 120 Days
A detailed 120-day IT integration timeline for PE operating partners. Week-by-week phases to secure value, prevent attrition, and validate the investment thesis.
30-50% Deal Value Lost to Slow Integration
BRIEF · GTM EXECUTION
The Sales Forecast Template That Actually Gets Used
A practical sales forecast template for Series B and C founders, using Commit, Upside, Pipeline, and Omitted categories backed by buyer evidence.
4 Core Forecast Categories
BRIEF · EXIT READINESS
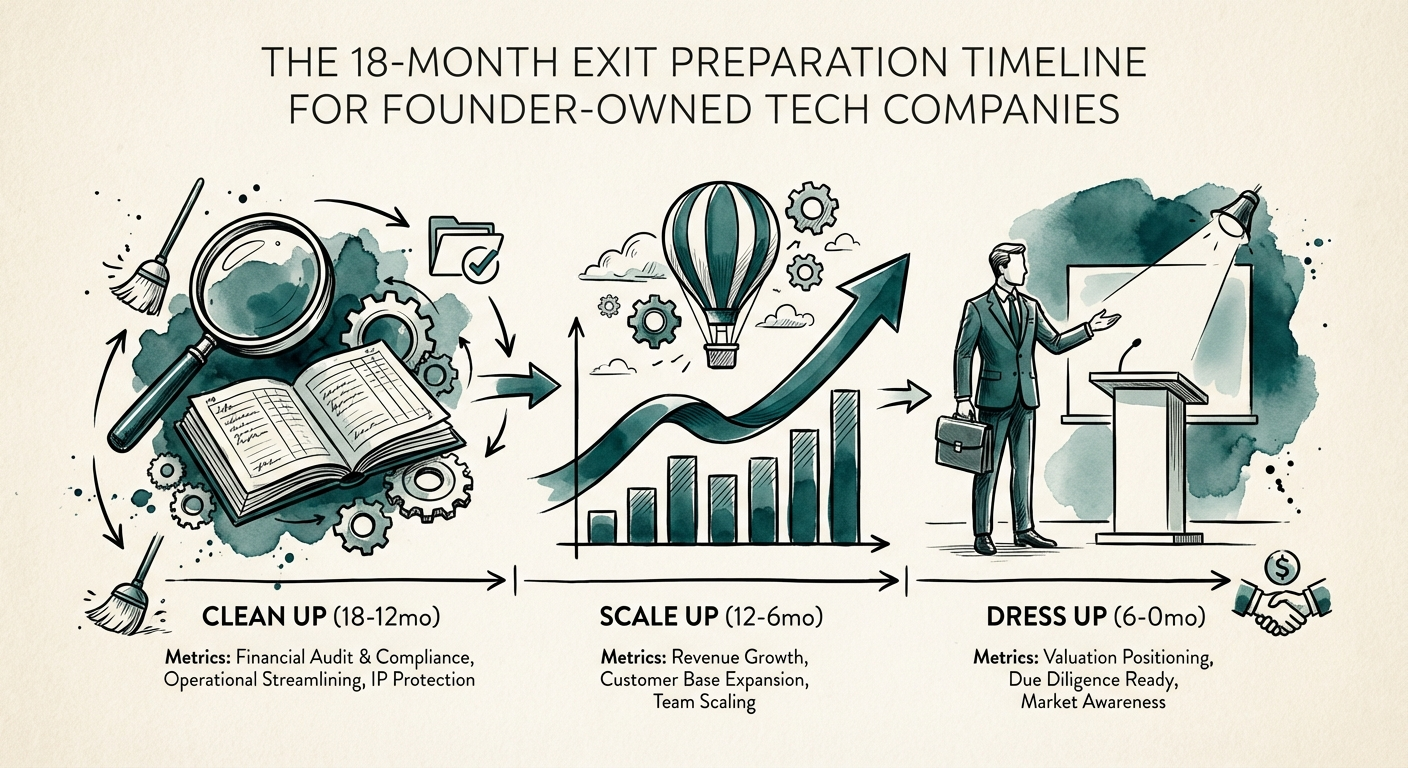
The 18-Month Exit Preparation Timeline for Founder-Owned Tech Companies
Don't sell your company for a discount. This 18-month exit preparation timeline covers financial hygiene, founder extraction, and technical due diligence to maximize valuation.
30-50% Valuation Discount for Founder Dependency
BRIEF · TECHNICAL DEBT
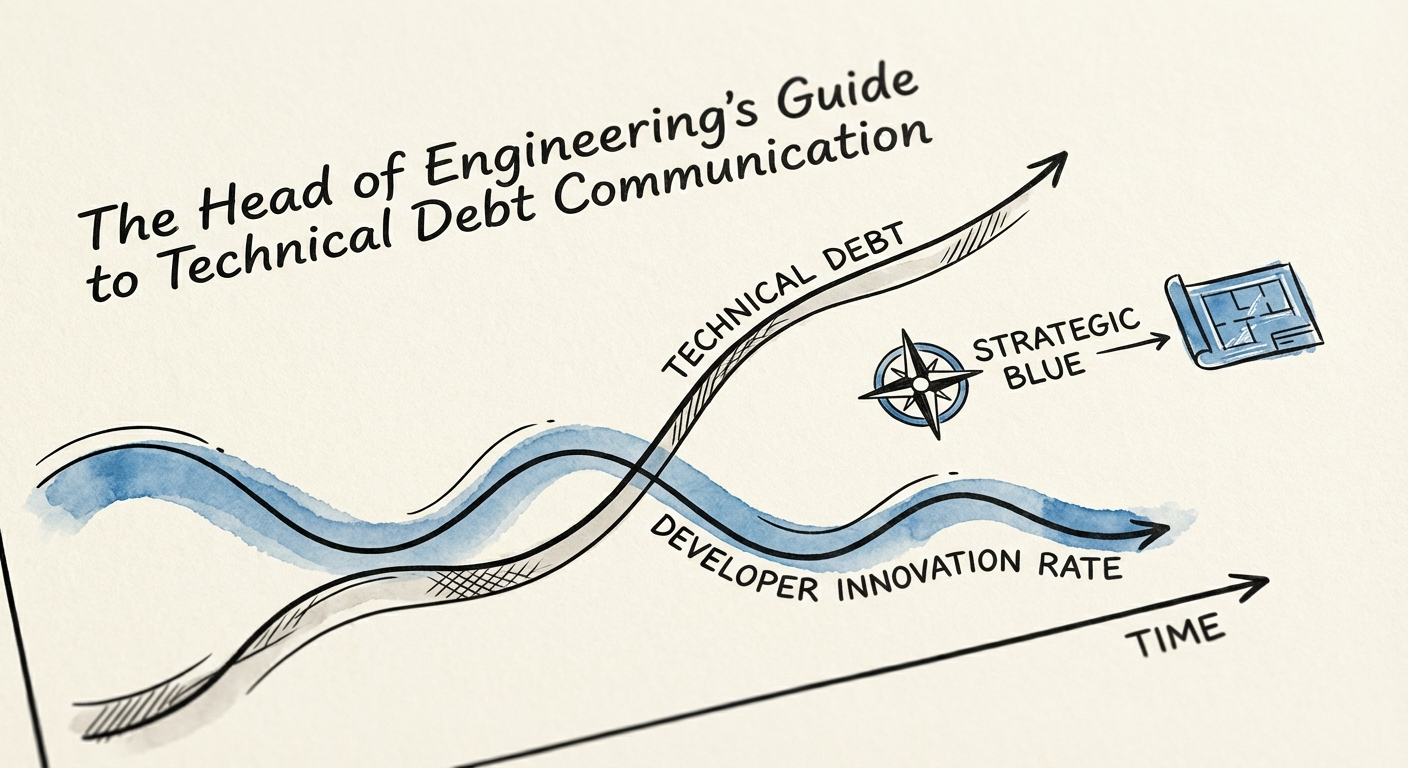
The Head of Engineering's Guide to Technical Debt Communication
Stop talking about 'refactoring' and start talking about EBITDA. A guide for Engineering Leaders to translate technical debt into business risk for CEOs and Boards.
42% Developer Time Lost to Tech Debt
BRIEF · EXIT READINESS
The One-Page Value Creation Plan Template for PE Operating Partners (2026 Edition)
Stop building 100-slide decks that gather dust. This one-page value creation plan template focuses on EBITDA impact, owner accountability, and 90-day execution sprints.
11% Distribution to NAV Ratio (Lowest in Decade)
BRIEF · GTM EXECUTION
When to Pivot Your GTM Strategy: The 2026 Diagnostic for Stalled Growth
Is your GTM strategy stalling at Series B? Discover the 3 data-driven warning signs, 2026 CAC payback benchmarks, and the decision matrix for a successful strategic pivot.
18 Months Max Viable CAC Payback
BRIEF · TEAM & HIRING
The Interim CEO Playbook: Stabilizing a Distressed Portfolio Company
Don't hire a babysitter for a burning building. The PE Operating Partner's guide to deploying an Interim CEO who stabilizes cash, fixes operations, and saves the exit.
73% CEO Turnover Rate Over Hold Period