BRIEF · EXIT READINESS
Operational Due Diligence: How to Read the Business the QofE Can't See
Financial diligence tells you what the company earned. Operational due diligence tells you whether it can earn more after you own it. Here's how PE buyers run it.
5.8 Years Median PE Hold Period (2025)
BRIEF · EXIT READINESS
SaaS Company Due Diligence: The 50 Questions Investors Always Ask
The definitive 2026 SaaS due diligence checklist. 50 diagnostic questions PE investors ask about NRR, technical debt, and founder dependency. Prepare your exit.
50% Deals that fail during due diligence
BRIEF · MIGRATION & INTEGRATION
The Platform Paradox: Why Your 'First Purchase' Isn't Necessarily a Foundation
A platform company isn't just your first acquisition—it's the infrastructure for scale. Learn the difference between a true platform and a 'Frankenstein' rollup.
4.2x Avg. Multiple Arbitrage Gap
BRIEF · EXIT READINESS
IT Services M&A: Valuation Multiples and Deal Structure Trends 2025
2025 IT Services M&A analysis for PE Operating Partners. Current EBITDA multiples (MSP vs. Consulting), deal structure trends, and why earnouts are paying 21 cents on the dollar.
21¢ Avg. Earnout Payout per $1
BRIEF · PROCESS DOCUMENTATION
The ROI of Process Documentation: Measuring Exit Multiple Impact
Stop viewing process documentation as admin work. It is asset engineering. Learn how shifting from 'Tribal Knowledge' to 'Turnkey' drives a 25% valuation premium.
25% Valuation Premium for Documented Operations
BRIEF · GTM EXECUTION
What Is RevOps? The $5M-to-$20M ARR Handoff Problem, Solved
RevOps fixes the broken handoffs between sales, marketing, and CS that quietly tax 10% of your revenue. Here's when a Series B SaaS company should build it—and in what order.
19% Faster Growth Rate
BRIEF · COMPLIANCE & SECURITY
SOC 2 Costs $40k at Seed and $230k Pre-Exit. Here's Why It Scales That Way.
SOC 2 doesn't cost $30k — that's just the invoice. See the real all-in number for a 15-person startup, a 100-person Series B, and a 200+ pre-exit company.
$150k Avg. Total Year 1 Cost (Mid-Market)
BRIEF · FINANCIAL INFRASTRUCTURE
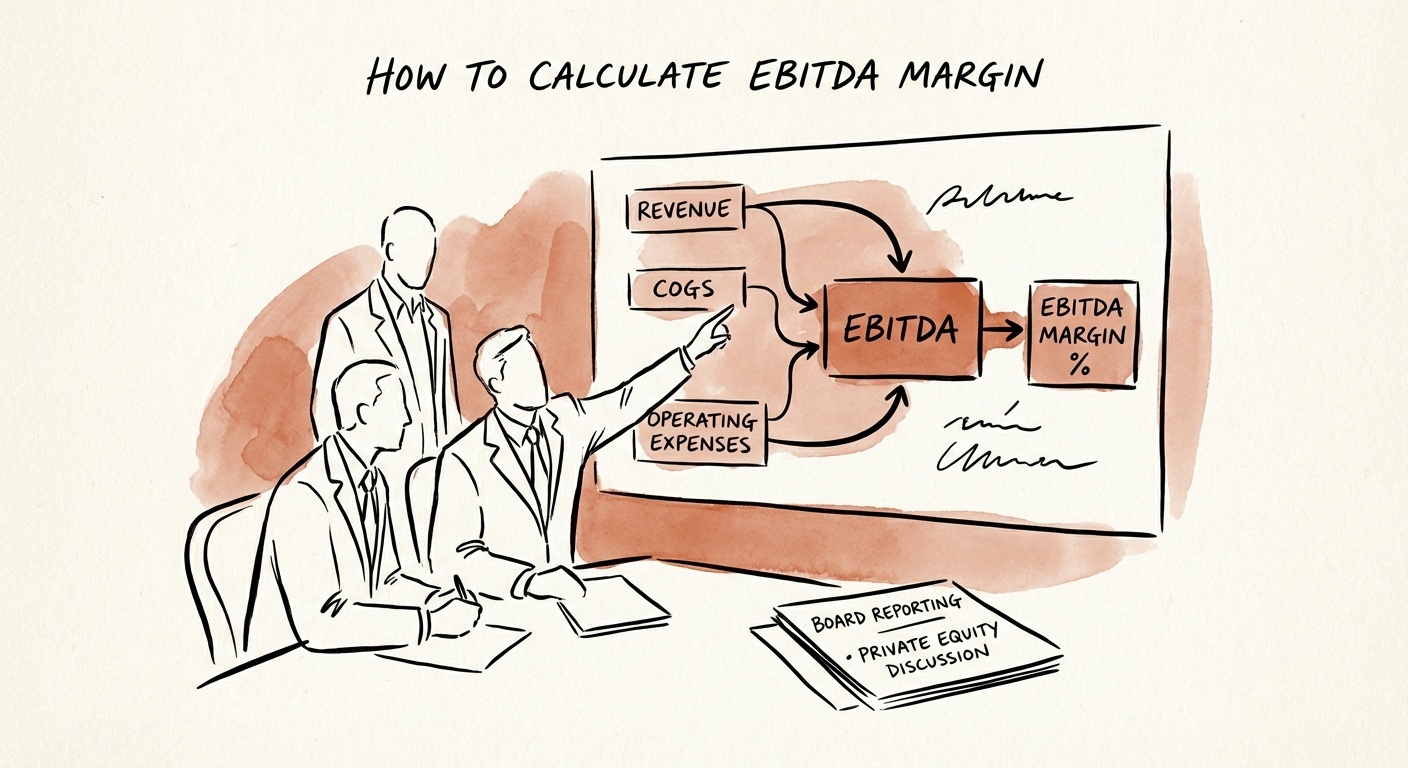
How to Calculate EBITDA Margin for Board Reporting (Without Getting Shredded in Due Diligence)
Stop reporting 'vanity EBITDA' to your board. Learn the precise EBITDA calculation formula that survives due diligence and the add-backs PE firms actually accept.
28% Average reduction in Management EBITDA during Quality of Earnings (QofE)
BRIEF · TECHNICAL DEBT
What Is Technical Debt? A Plain-English Guide for Business Leaders
Technical debt isn't just messy code—it's an off-balance-sheet liability costing you 42% of your engineering velocity. Here is the CEO's guide to identifying, measuring, and paying it down.
42% Engineering Time Lost to Debt
BRIEF · TECHNICAL DEBT
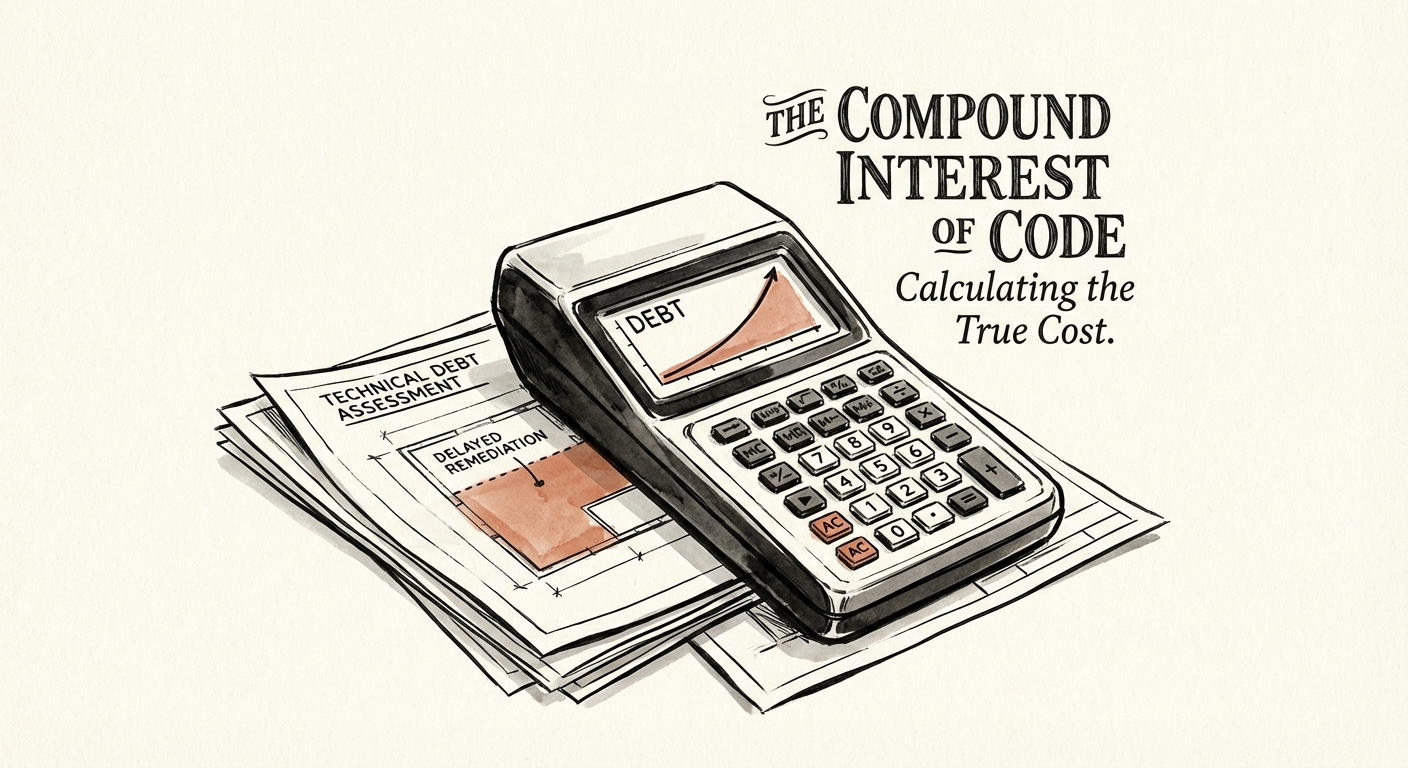
The True Cost of Delaying Technical Debt: A CFO's Perspective
Technical debt isn't just an engineering complaint—it's a 42% tax on your roadmap. Here is the CFO's framework for quantifying and fixing it before it kills your exit.
42% of Engineering Payroll Consumed by Debt
BRIEF · GTM EXECUTION
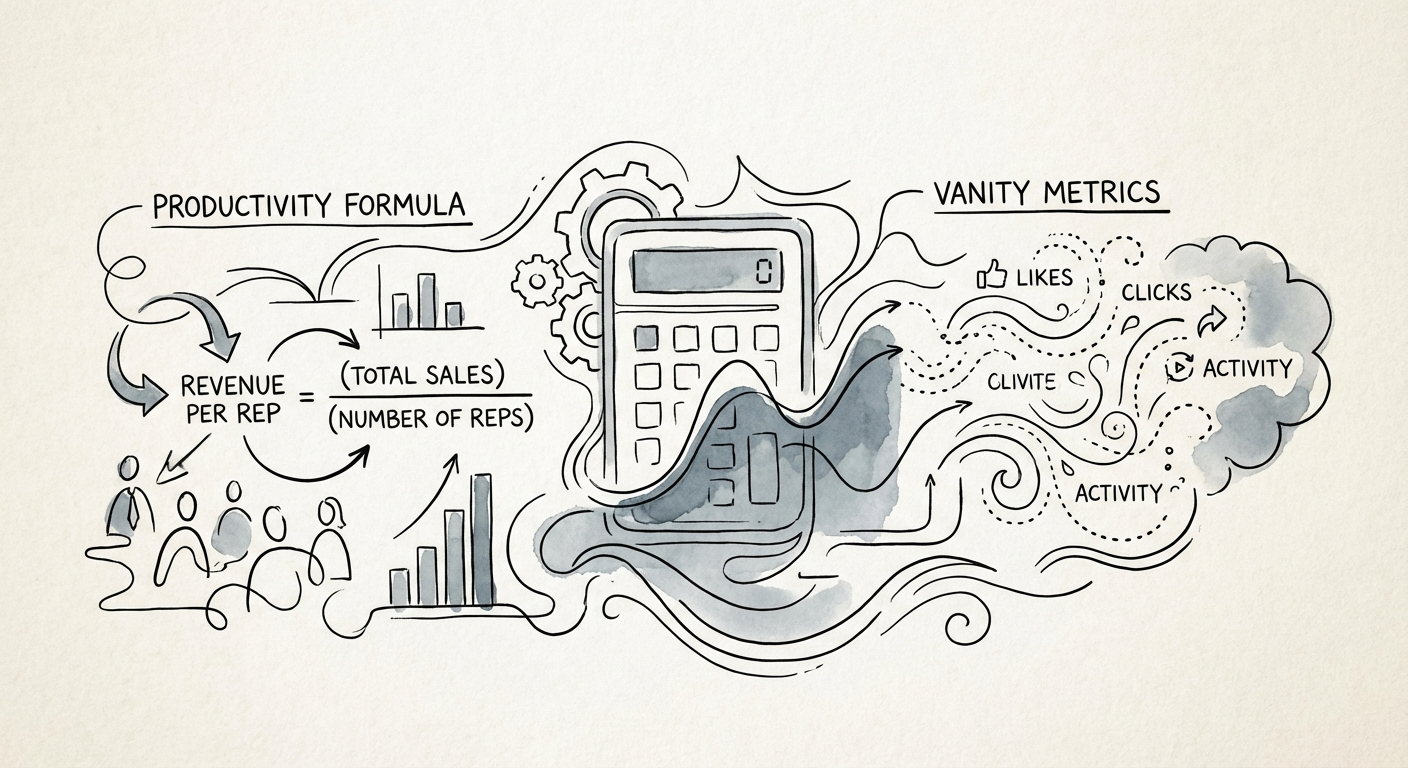
The Revenue Per Rep Lie: Why Your "Average" Is Killing Your Forecast
Stop using 'Average Revenue per Rep.' It's a vanity metric hiding your efficiency problem. Here is the ramp-adjusted productivity formula for Series B/C CEOs.
41.3% Mid-Market Quota Attainment (2025)
BRIEF · FINANCIAL INFRASTRUCTURE
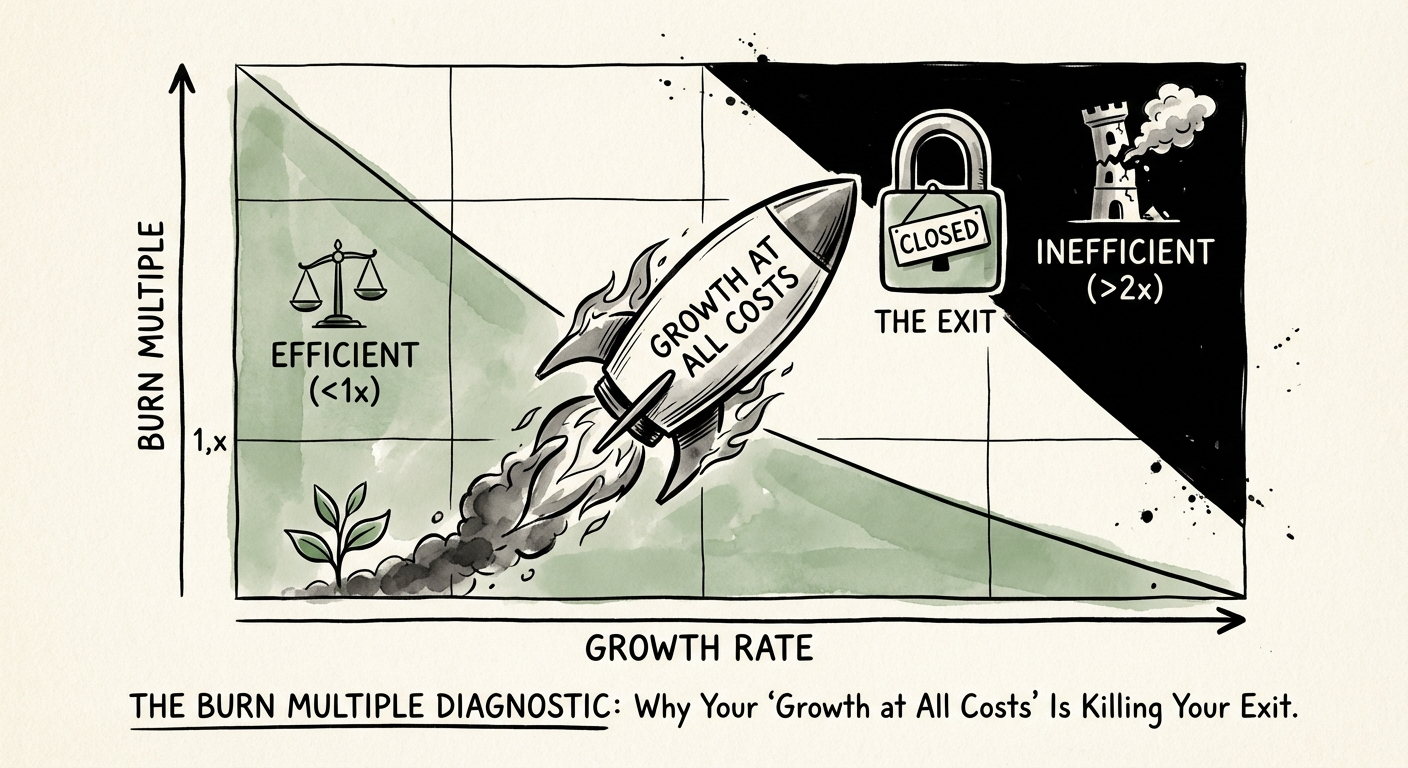
The Burn Multiple Diagnostic: Why Your 'Growth at All Costs' Is Killing Your Exit
Is your startup burning cash too fast? Use the Burn Multiple formula (Net Burn / Net New ARR) to diagnose your capital efficiency. 2026 benchmarks included.
< 1.5x Target Burn Multiple (Series B)
BRIEF · EXIT READINESS
What Is Quality of Earnings? The $5M EBITDA Slide That Changes Deals
Quality of Earnings (QofE) isn't an audit—it's a stress test. Learn why 50% of deal collapses happen here and how a sell-side QofE can increase your exit multiple by 0.4x.
0.4x Multiple Lift with Sell-Side QofE
BRIEF · REVENUE ARCHITECTURE
Your 105% NRR Looks Fine. Your GRR Says You're Quietly Bleeding Out.
A 105% NRR can hide 15% logo churn. Here's the cohort NRR formula, the GRR sanity check that exposes expansion masking, and 2025 B2B SaaS benchmarks.
120% Top-Decile NRR Benchmark (Series B/C)
BRIEF · GTM EXECUTION
Sales Team Restructuring Timeline: Minimize Disruption, Maximize Results
The 'rip and replace' sales restructure usually kills Year 1 EBITDA. Here is the operator's guide to the restructuring timeline, the J-Curve of productivity, and minimizing the revenue air pocket.
4-6 Months Productivity Recovery Period
BRIEF · UNIT ECONOMICS
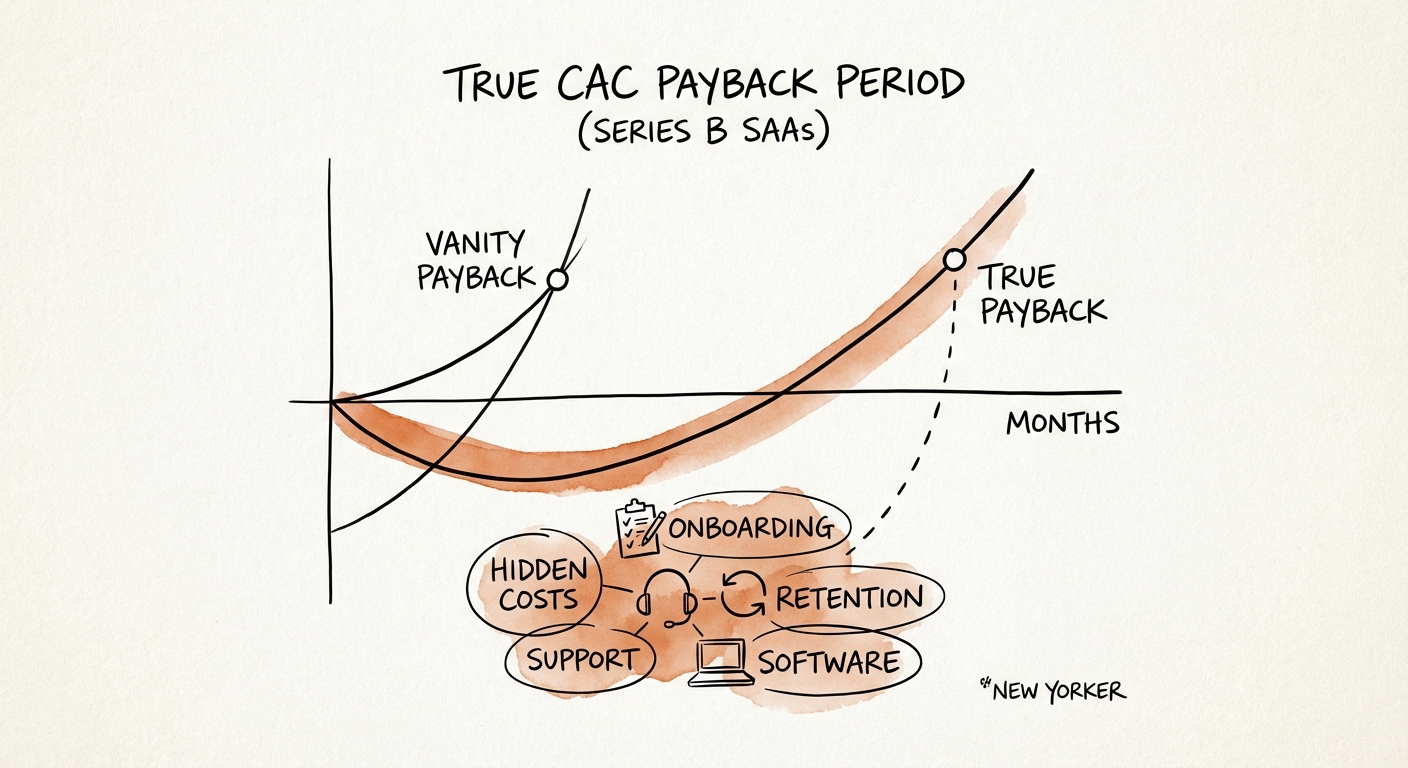
How to Calculate True CAC Payback Period (And Why Your Investor Deck Is Wrong)
Most founders calculate CAC Payback wrong. Learn the 'True Payback' formula that factors in Gross Margin, onboarding costs, and churn to stop burning cash.
18 Months Real Payback Period
BRIEF · MIGRATION & INTEGRATION
The Post-Acquisition Integration Scorecard: Why 70% of Synergies Die on the Spreadsheet
Stop tracking activities and start tracking value. A diagnostic integration scorecard for PE Operating Partners to prevent the 23% synergy gap.
23% Average Synergy Miss
BRIEF · EXIT READINESS
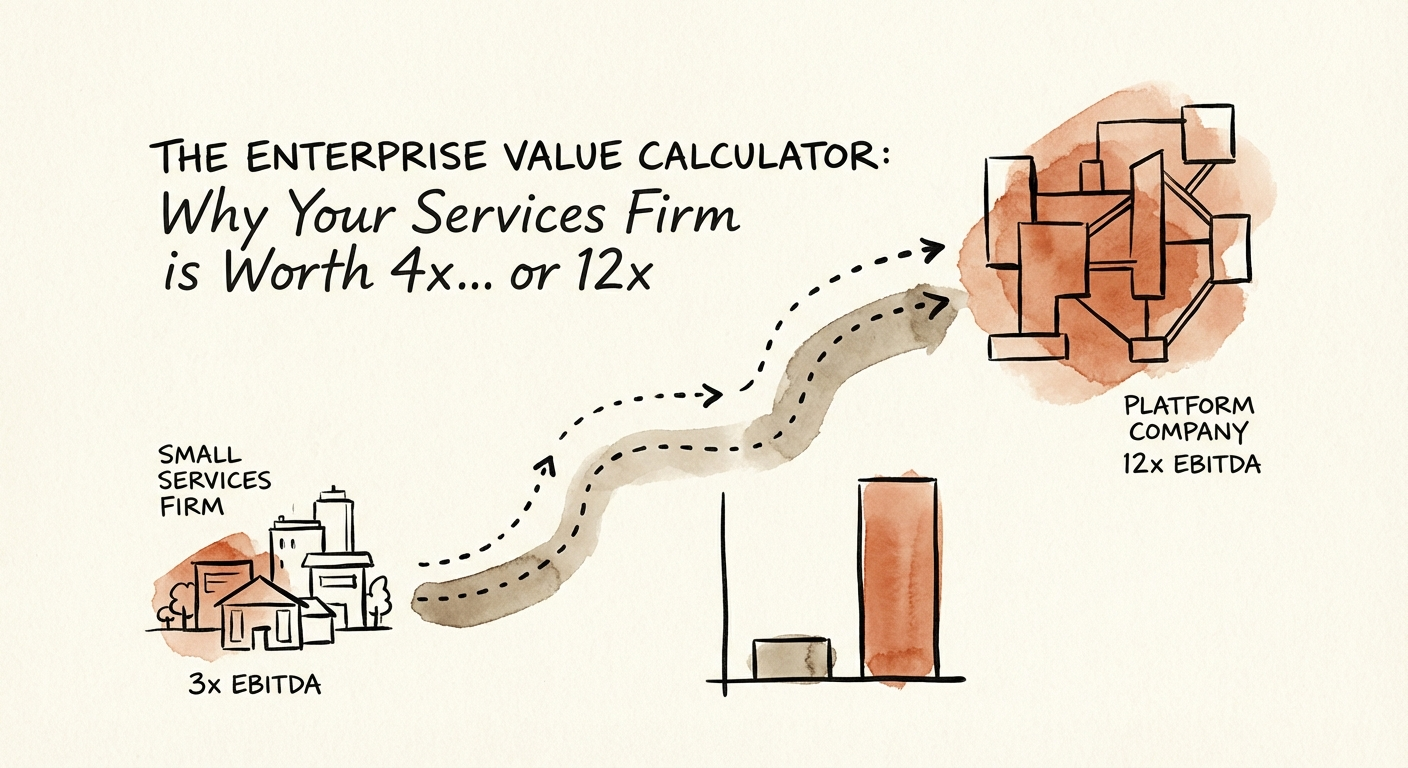
Why Two Identical $2M Services Firms Sell for $8M and $24M
Two firms, same EBITDA, triple the exit price. Five structural multipliers decide whether a B2B tech services firm clears 4x or 12x in 2026.
12.8x Avg PE Multiple (2025)
BRIEF · EXIT READINESS
Your SaaS Is Worth 4.5x ARR Until You Prove Otherwise: The 2026 Multiple Math
The median private B2B SaaS company trades at 4.5x ARR. Here's the line-by-line math PE buyers use to move you up or down from that number in 2026.
4.5x Median Private SaaS ARR Multiple (2026)
BRIEF · MIGRATION & INTEGRATION
Post-Acquisition Customer Communication Timeline: When to Say What
Silence is expensive. This 100-day post-acquisition communication timeline prevents the 'Month 6 Churn Cliff' and protects deal value.
40% Increase in B2B Customer Acquisition Costs (CAC) since 2023
BRIEF · GTM EXECUTION
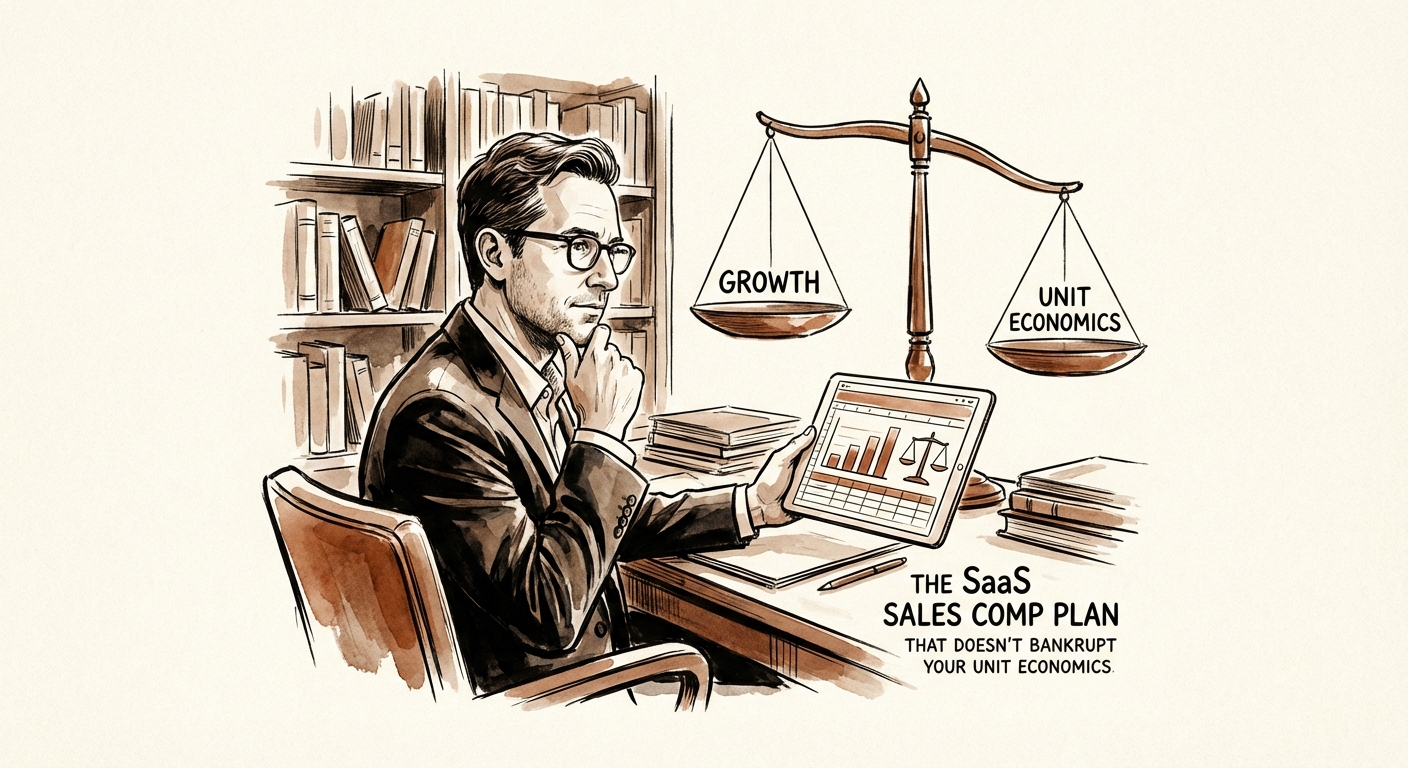
The SaaS Sales Comp Plan Template That Doesn't Bankrupt Your Unit Economics
Stop overpaying for bad revenue. A data-backed B2B SaaS sales compensation plan template, including 2025 benchmarks for OTE, accelerators, and clawbacks.
4.2x Median Quota-to-OTE Ratio
BRIEF · FINANCIAL INFRASTRUCTURE
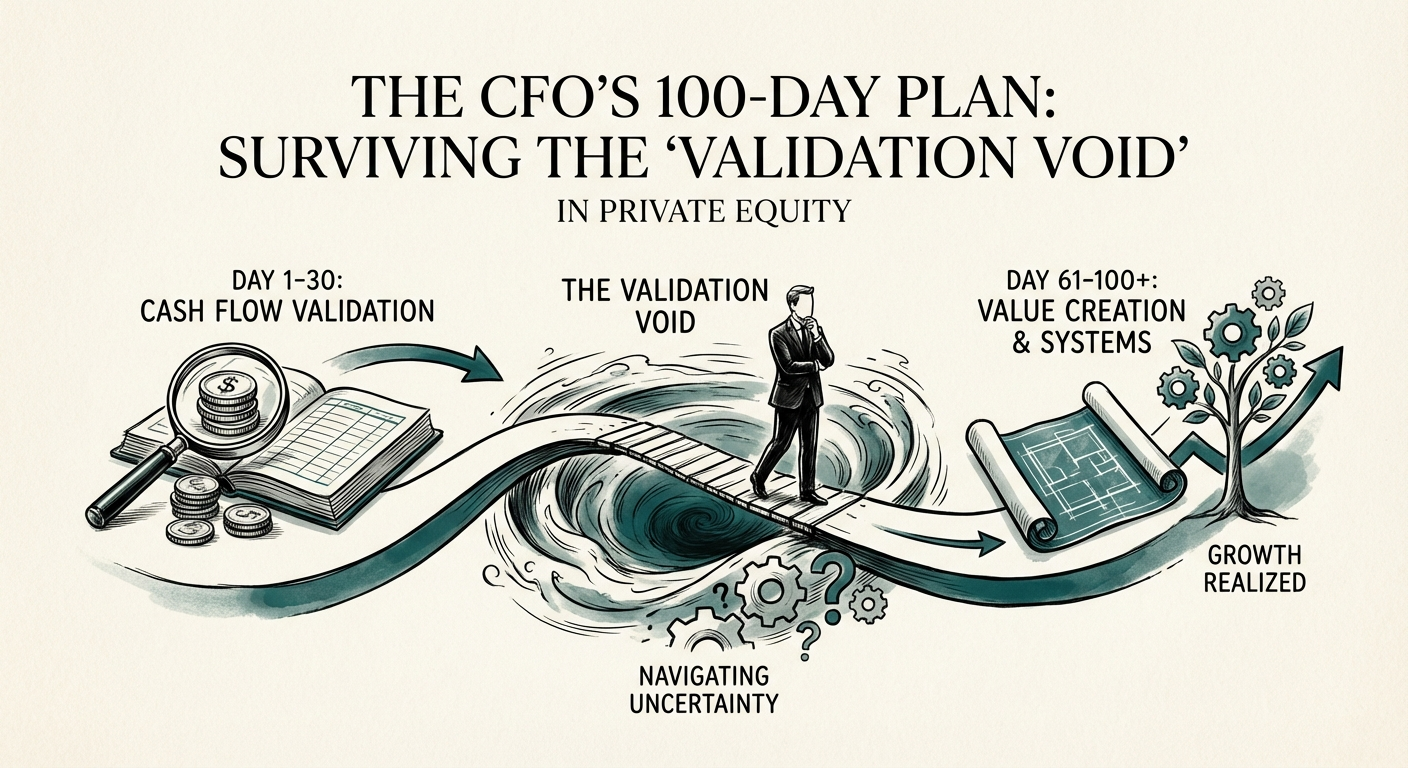
The CFO's 100-Day Plan: Surviving the "Validation Void" in Private Equity
Nearly 50% of PE CFOs fail within 18 months. This 100-day diagnostic plan focuses on the 13-week cash flow, working capital, and data integrity to ensure survival.
50% CFO Failure Rate (<18 Months)
BRIEF · TECHNICAL DEBT
The 42% Tax: A Series B/C Founder's Formula for the Cost of Delaying Technical Debt
Series B/C CEOs: stop arguing about code quality. Here's the formula to put a dollar-per-day price on delayed tech debt remediation, and defend it in the boardroom.
42% Developer Time Wasted
BRIEF · FINANCIAL INFRASTRUCTURE
The 15-Slide Board Deck That Saves Your Job (And Your EBITDA)
Stop the 80-page vanity metrics. Here is the 15-slide board deck template that Private Equity Operating Partners actually want to see in 2026.
21% More Time on Strategy