BRIEF · TECHNICAL DEBT
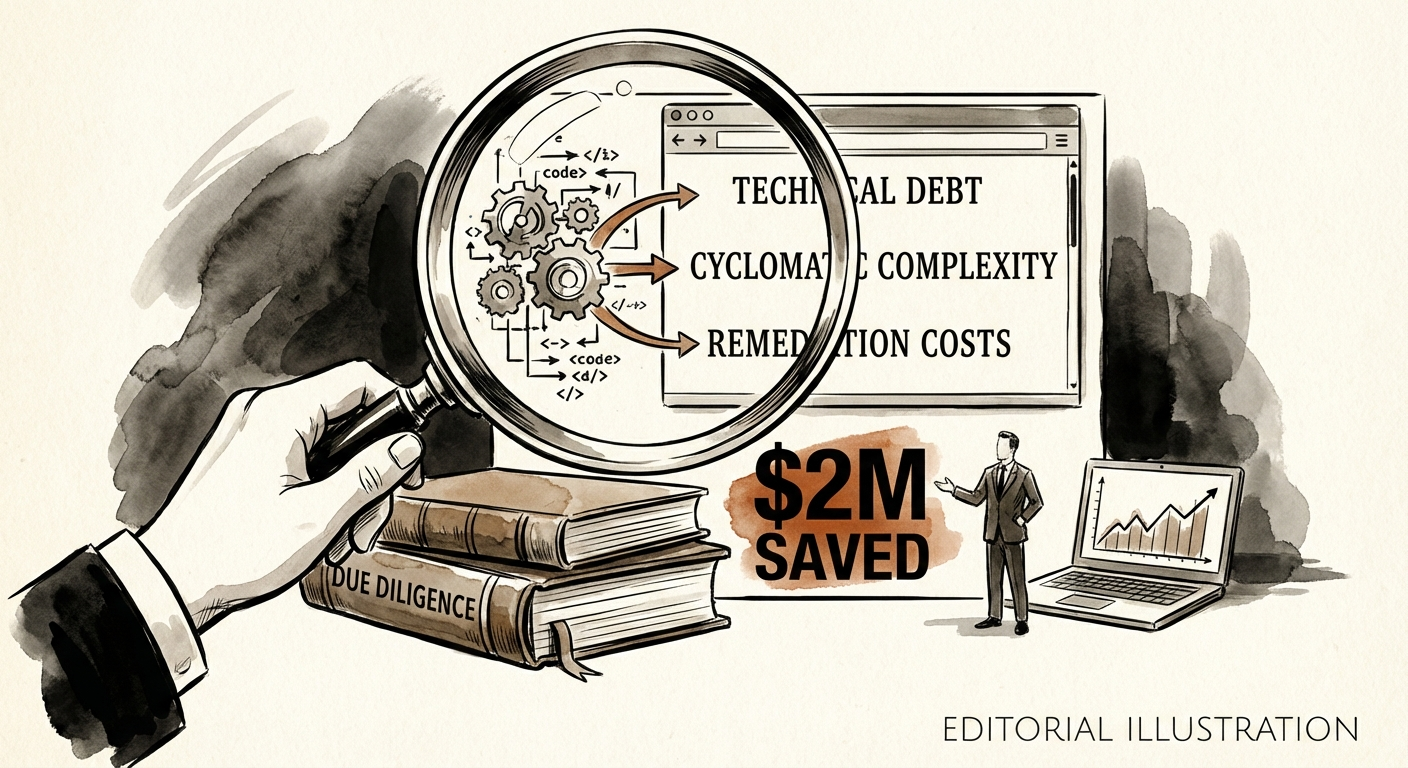
The $12M ARR Logistics SaaS That Cost $2M Less After We Read the Code
A logistics SaaS looked clean at 8x ARR. The billing engine told a different story. How reading the code re-traded the price down $2M before close.
$2,000,000 Deal Value Saved
BRIEF · TEAM & HIRING
When to Fire Your Sales Leader: The 6-Month Assessment Framework
Stop waiting 12 months to fix a bad sales hire. Use this 6-month diagnostic framework to assess your VP of Sales using metrics like ramp time, forecast accuracy, and hiring velocity.
19 Months Avg. VP Sales Tenure
BRIEF · FINANCIAL INFRASTRUCTURE
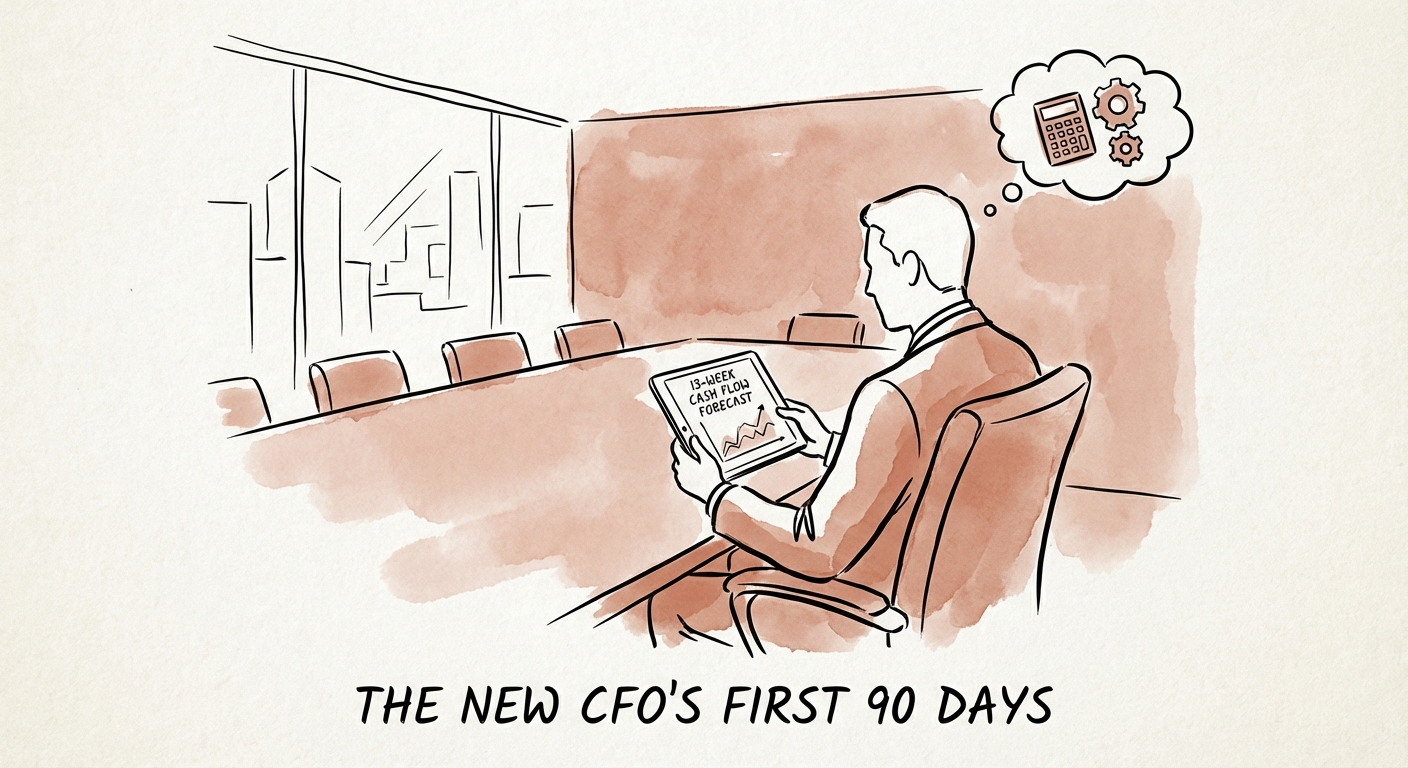
The New CFO's First 90 Days: A Survival Guide for the 'Operator' Era
A 90-day operational playbook for new PE portfolio CFOs. From the 13-week cash flow to the 5-day close, here is how to survive the first quarter and secure the exit.
5.8 Years Median PE Hold Period (2025)
BRIEF · GTM EXECUTION
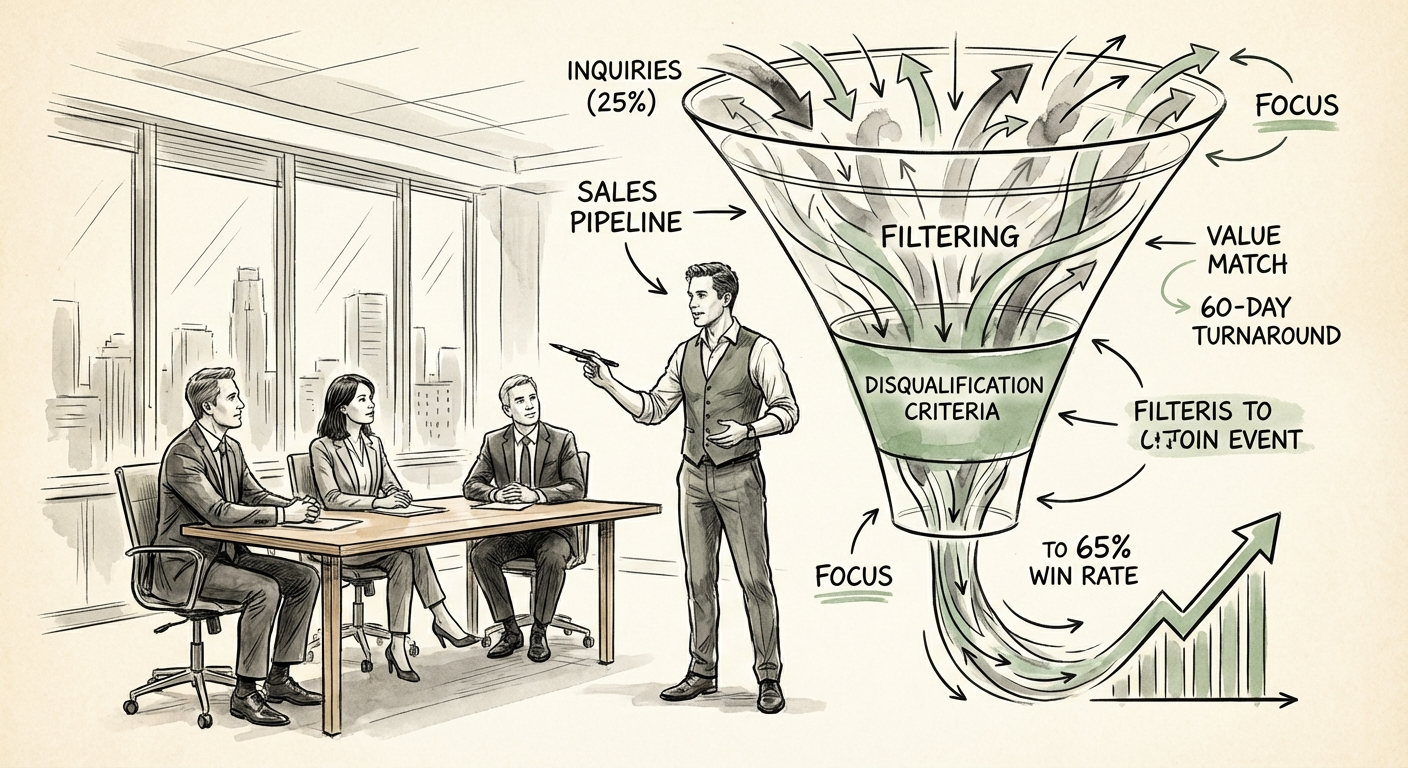
The 60-Day Sales Turnaround: From 25% to 65% Win Rate
A 60-day diagnostic and execution plan to triple sales win rates. Learn how to fix the 'Founder Distortion Field,' implement radical disqualification, and scale GTM execution.
65% Win Rate (Qualified)
BRIEF · EXIT READINESS
The Series B Cliff: Should You Raise Another Round or Sell?
Series B to C graduation rates have dropped to 42%. Justin Leader breaks down the math of raising vs. exiting, calculating liquidation overhangs, and why 'waiting for a better multiple' is a trap.
42% Series B to C Graduation Rate
BRIEF · EXIT READINESS
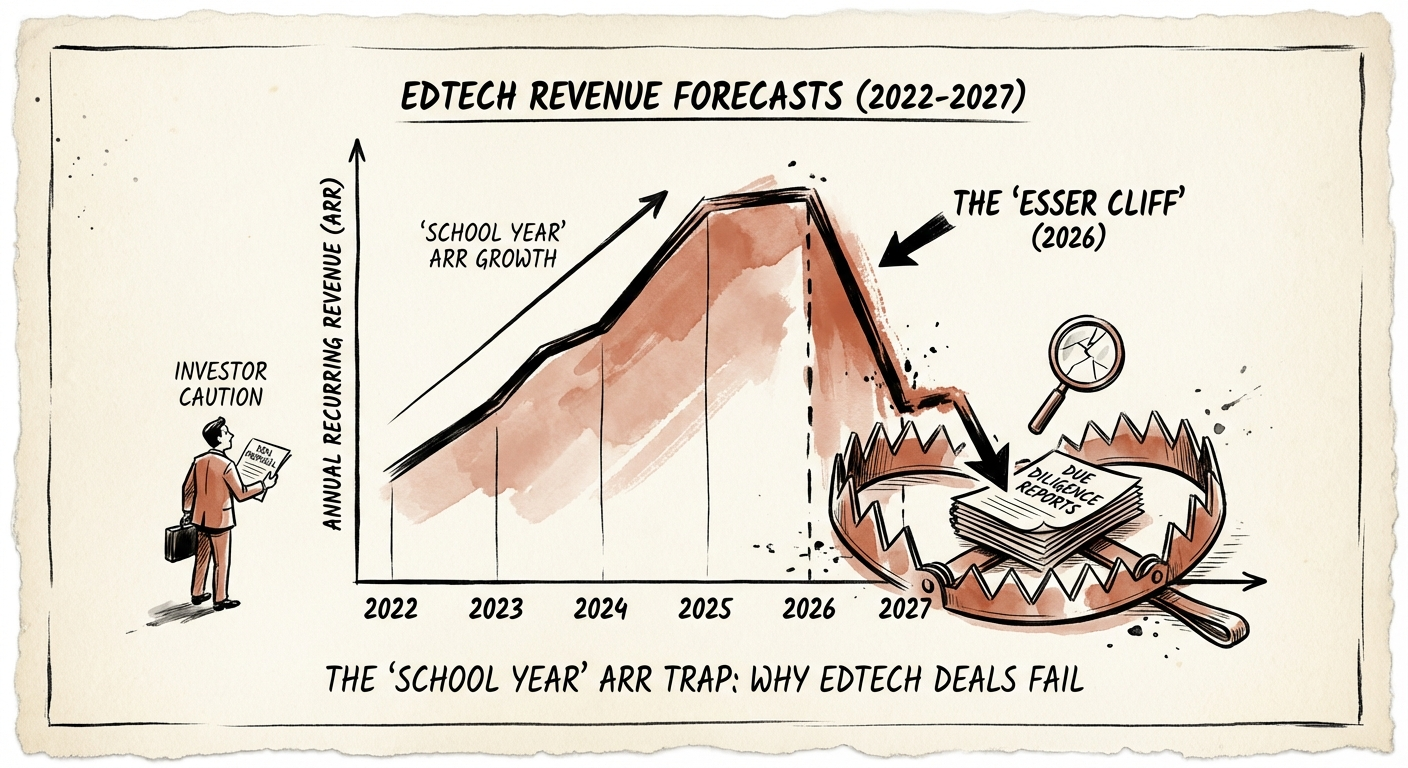
The 'School Year' ARR Trap: Why EdTech Deals Fail in Due Diligence
The 2026 EdTech M&A playbook for PE operating partners. How to spot phantom ARR, adjust for school-year seasonality, and navigate the ESSER funding cliff.
28% Avg. "Phantom ARR" in K-12 Deals
BRIEF · EXIT READINESS
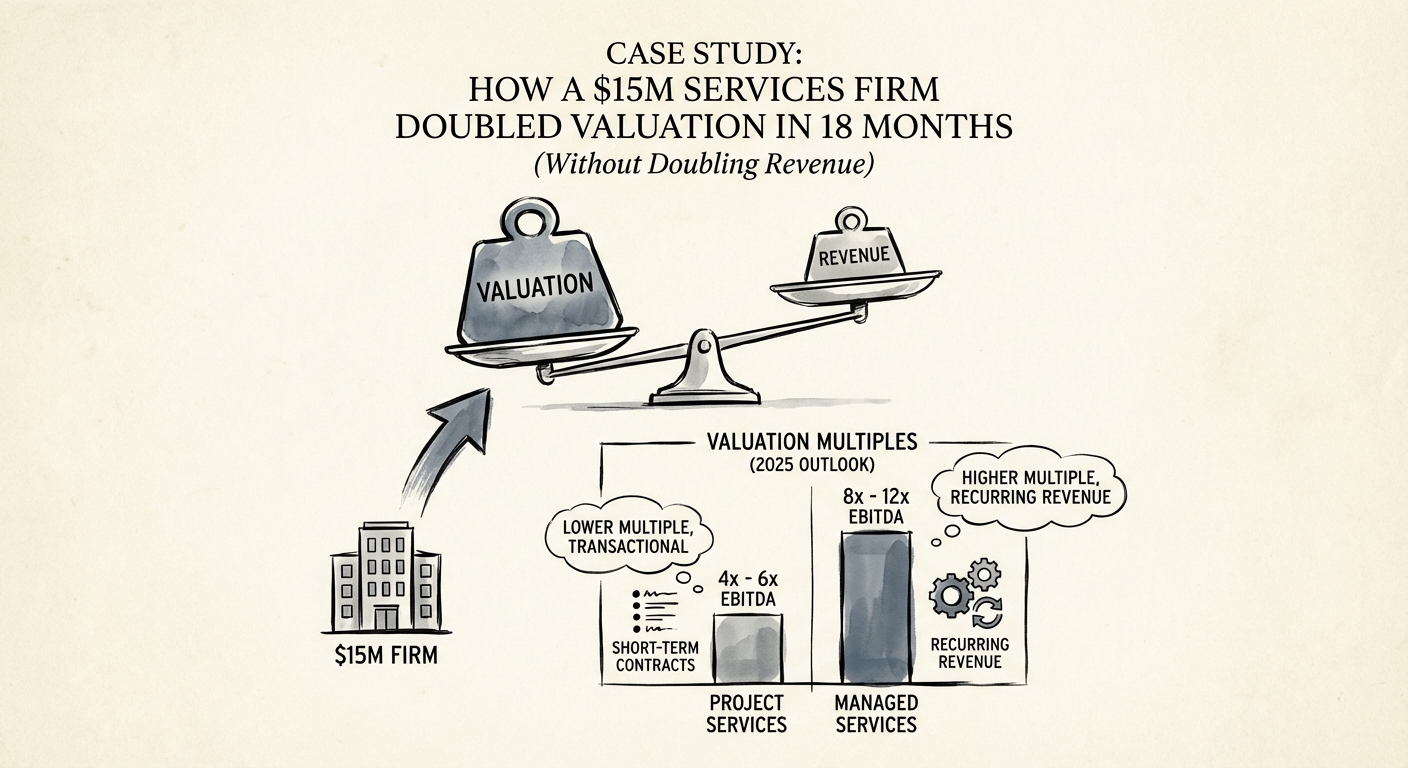
Case Study: How a $15M Services Firm Doubled Valuation in 18 Months (Without Doubling Revenue)
A diagnostic case study of how a $15M tech services firm moved from a 5x to 10x EBITDA multiple by fixing revenue quality, standardization, and founder dependency.
100% Valuation Increase
BRIEF · GTM EXECUTION
The Enablement ROI Trap: Why 90% of Programs Fail to Move Win Rates (And How to Fix It)
Stop tracking course completion. Start tracking revenue. Benchmarks for Sales Enablement ROI, win rate impact (49% vs 42%), and the "Revenue Engineering" framework for Series B scale-ups.
49% Win Rate (with Enablement)
BRIEF · TECHNICAL DEBT
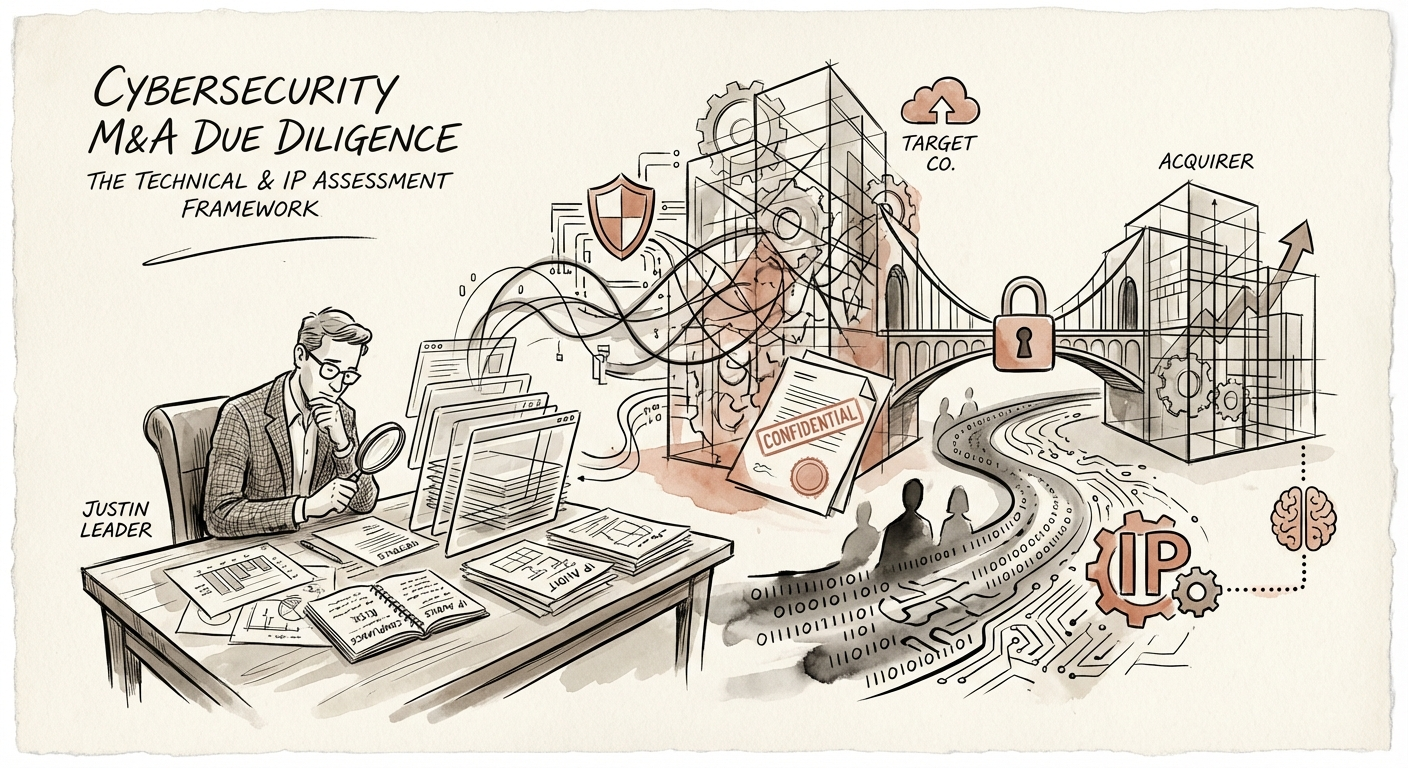
Cybersecurity M&A Due Diligence: The Technical & IP Assessment Framework
A PE Operating Partner's guide to cybersecurity due diligence. How to assess technical debt, IP risks, and open source liability before buying a security company.
99% M&A codebases with open source components
BRIEF · FOUNDER EXTRACTION
Founder-Led Sales: The Phase That Builds Your Business (And Then strangles It)
Founder-led sales works until it kills your growth. Learn the signs of the $10M ceiling, the 18-month VP Sales failure trap, and how to extract yourself without losing revenue.
19 Months Avg VP Sales Tenure
BRIEF · COMPLIANCE & SECURITY
The Price of Compliance Gaps: Fines, Delays, and Lost Deals
Non-compliance costs 2.71x more than prevention. Learn the true cost of compliance gaps in M&A holdbacks, lost B2B sales, and SEC fines for PE portfolios.
2.71x Cost Multiplier (Remediation vs. Prevention)
BRIEF · UNIT ECONOMICS
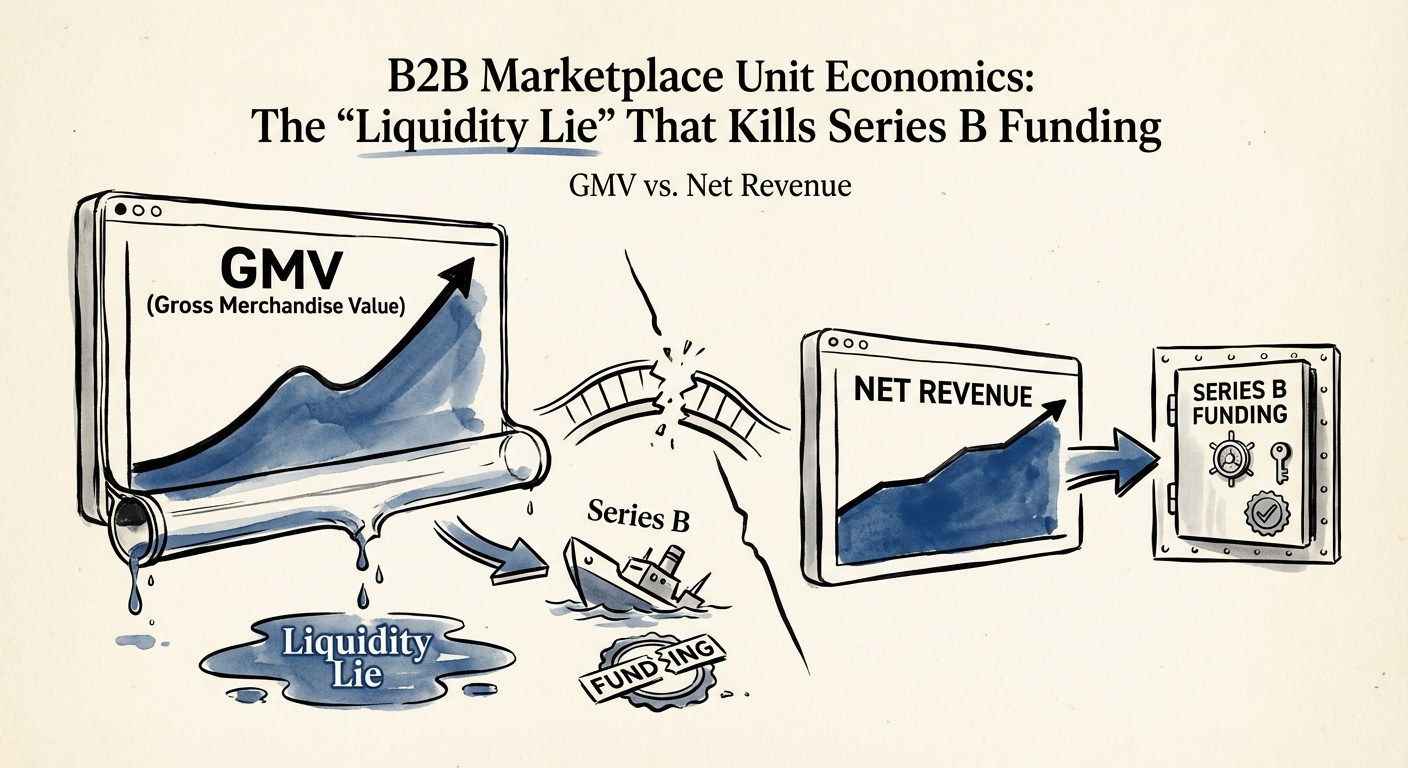
B2B Marketplace Unit Economics: The "Liquidity Lie" That Kills Series B Funding
Stop optimizing for GMV. Here are the 2025 B2B marketplace benchmarks for Take Rate, Net GMV Retention, and LTV:CAC that investors actually vet.
140% Net GMV Retention (Top Quartile)
BRIEF · EXIT READINESS
The Defensive Moat: Why a Sell-Side Quality of Earnings (QofE) Report Prevents the 30% Re-Trade
A Sell-Side Quality of Earnings (QofE) is not an audit—it's your defense against re-trading. Learn how to protect your EBITDA multiple and deal value.
7.4x EBITDA Multiple with Sell-Side QofE (vs 7.0x without)
BRIEF · PROJECT RECOVERY
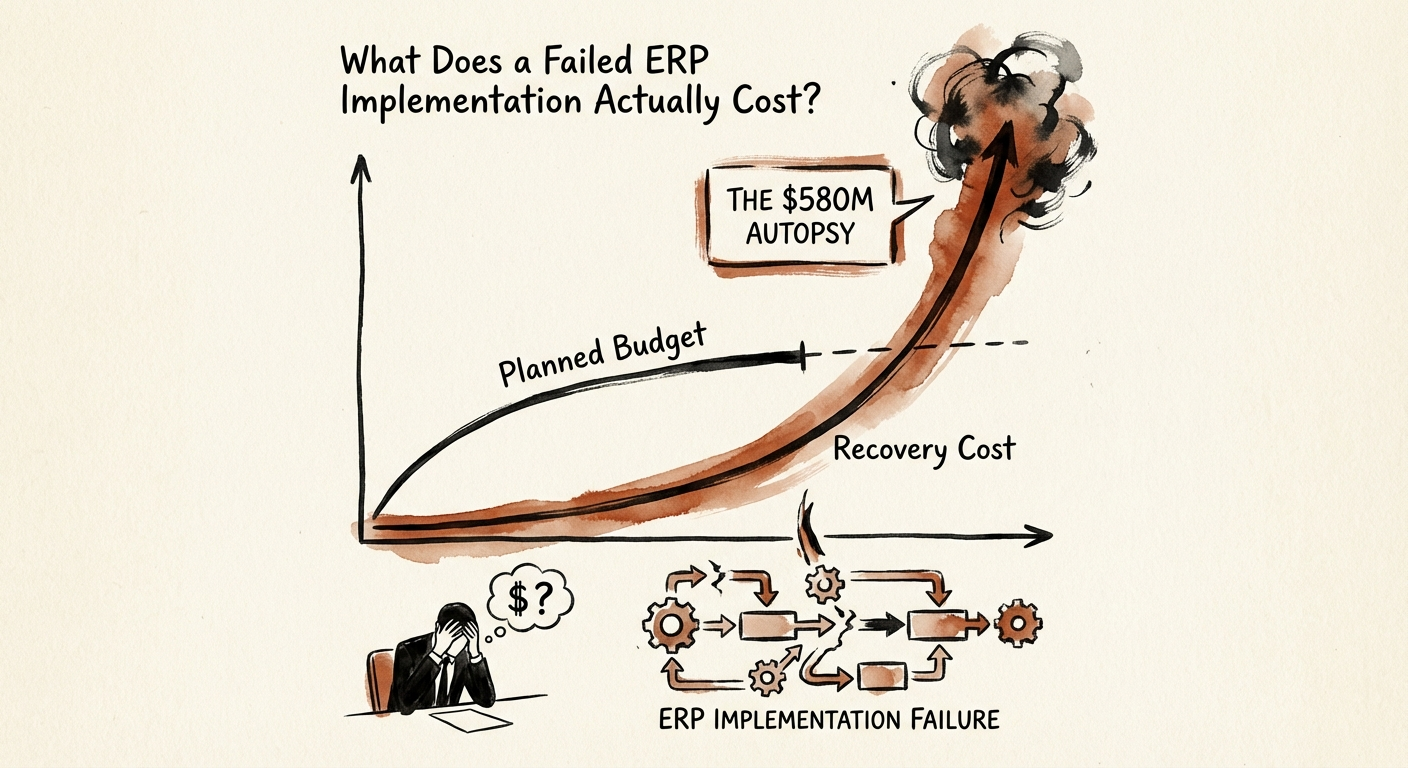
What Does a Failed ERP Implementation Actually Cost? (The $580M Autopsy)
A failed ERP implementation costs 3-4x the initial budget and kills stock prices. Here is the failure cost analysis and recovery playbook for C-Suite leaders.
200% Avg. Cost of Recovery vs. Initial Budget
BRIEF · EXIT READINESS
Marketing Agency Valuations: Why Revenue Multiples Are a Lie (And What Your Firm Is Actually Worth)
Stop calculating your agency's value based on revenue. Learn why EBITDA multiples are the only metric that matters for exits in 2026, and how to maximize yours.
8-12x Best-in-Class EBITDA Multiple (2025/26)
BRIEF · EXIT READINESS
What Are EBITDA Add-Backs? The Complete List (And What Buyers Actually Accept in 2026)
The definitive list of accepted, debated, and rejected EBITDA add-backs for 2026. Stop leaving valuation on the table. A guide for Founders and PE Operating Partners.
30% Avg Add-Back % of EBITDA
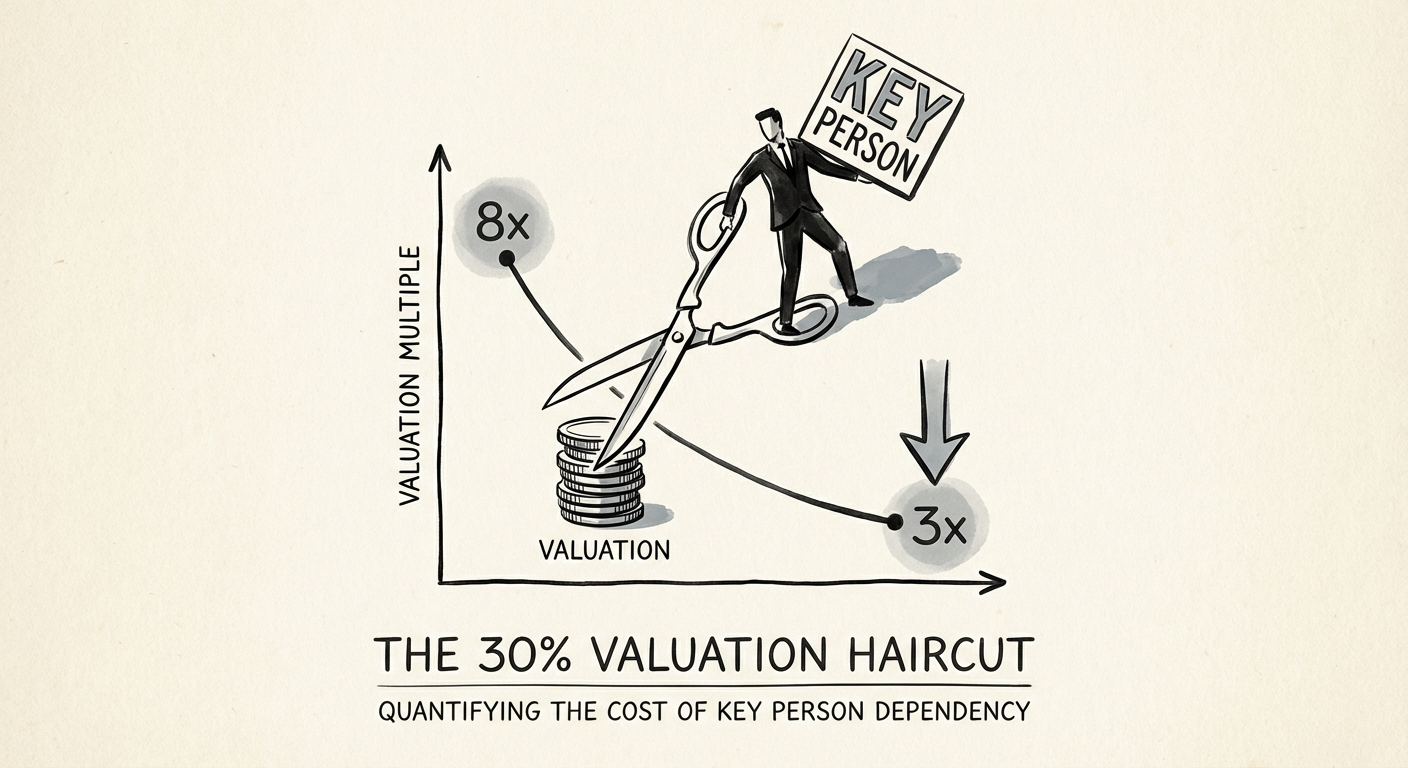
BRIEF · FOUNDER EXTRACTION
The 30% Valuation Haircut: Quantifying the Cost of Key Person Dependency
Founder dependency costs you 30-50% in valuation. Learn how to quantify key person risk, avoid earnout traps, and build a transferable company.
30-50% Valuation Haircut
BRIEF · EXIT READINESS
MSP Valuation Factors: What Drives Multiples for Managed Services Providers
See the MSP valuation factors buyers actually price: recurring revenue, EBITDA quality, retention, specialization, founder dependency, and exit readiness.
11.4x Median EV/EBITDA (High-Maturity)
BRIEF · MIGRATION & INTEGRATION
M&A Integration Costs: The "Hidden" 15% That Kills Deal Value
Most PE firms budget 1-3% for M&A integration. Market data shows the real cost is 5-15%. Here is the breakdown of where that money goes and how to budget correctly.
15% Real Integration Cost (% of Deal Value)
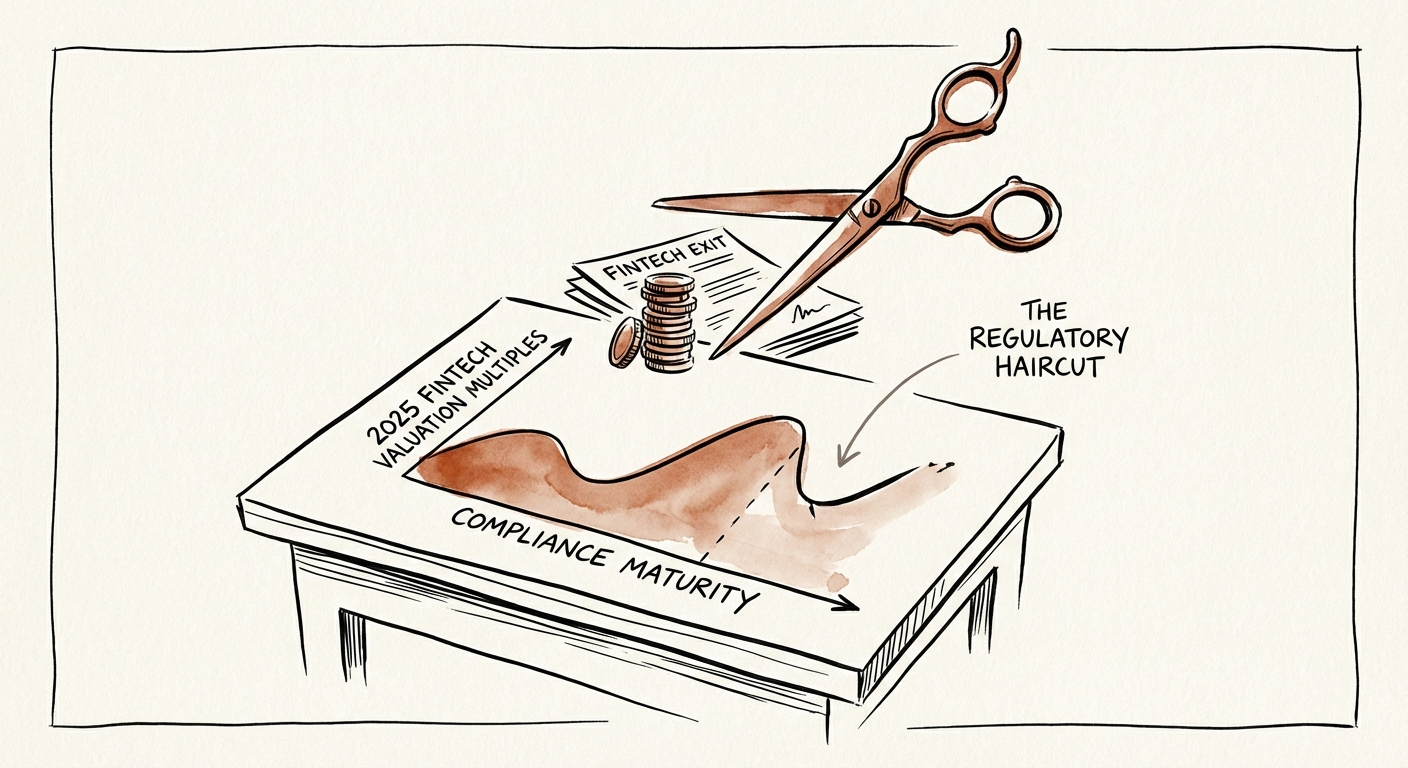
BRIEF · COMPLIANCE & SECURITY
The Regulatory Haircut: Why Compliance Debt is Killing Your Fintech Exit Multiple
New 2026 data: How compliance debt erodes fintech multiples. A diagnostic guide for PE Operating Partners on AML, BaaS, and SOC 2 deal impacts.
87% of successful Q4 2025 fintech exits had SOC 2 Type II in place at LOI
BRIEF · REVENUE ARCHITECTURE
What Is Net Revenue Retention? The Metric That Matters Most
Net Revenue Retention (NRR) is the single biggest predictor of SaaS valuation. Here are the 2026 benchmarks for Series B/C companies and how to fix your retention.
120% Target NRR for Series B
BRIEF · EXIT READINESS
Professional Services Firm Exit Planning: A 36-Month Timeline
A 36-month exit planning timeline for professional services firms. Move from founder-led heroics to a 12x EBITDA exit. Benchmarks for 2026.
10 Months Avg. 2025 Deal Cycle
BRIEF · GTM EXECUTION
The Hidden Costs of Poor Forecast Accuracy: A Diagnostic for Scaling Founders
Poor forecast accuracy isn't just a sales problem—it's a valuation killer. Discover the hidden costs of missing your number and how to fix it.
34% Higher Revenue Growth for Teams Tracking Velocity Weekly
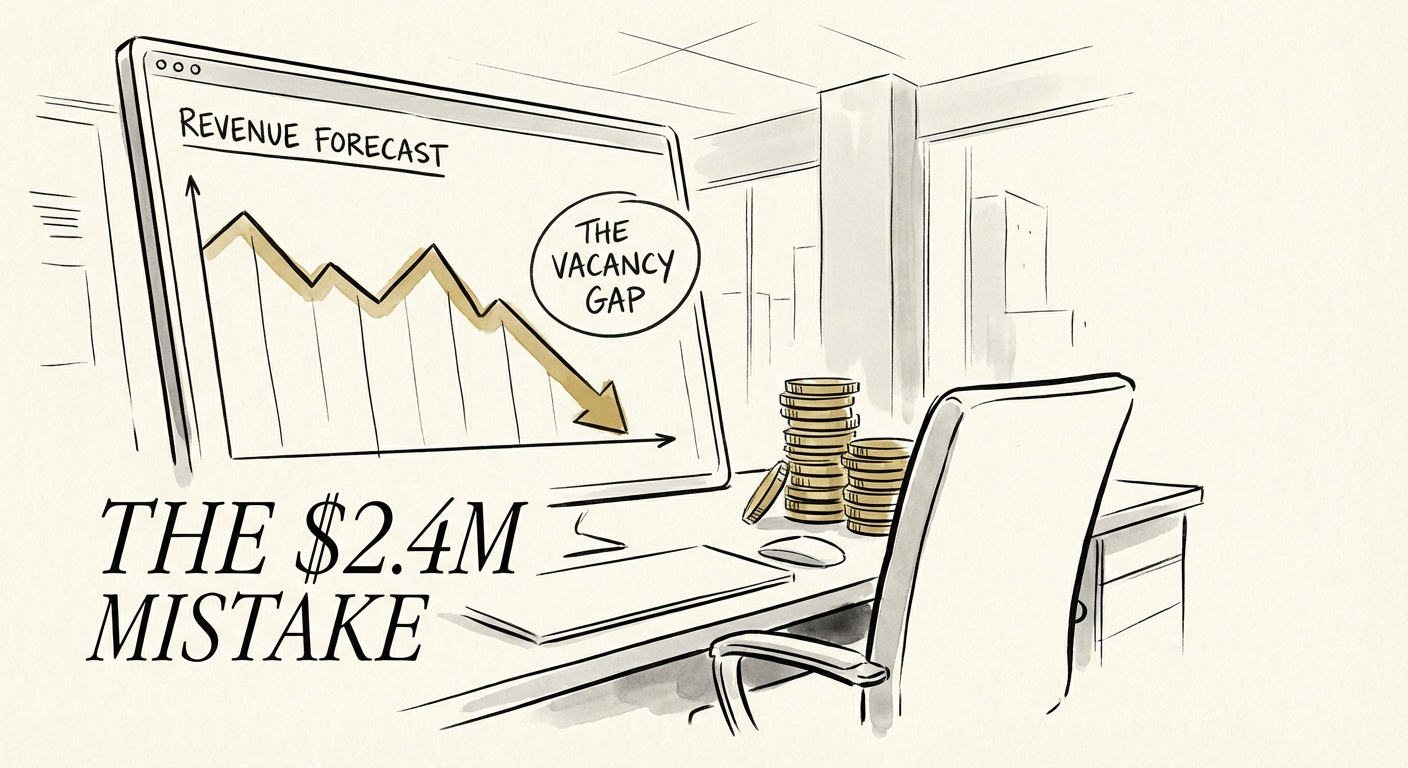
BRIEF · TEAM & HIRING
The $2.4M Mistake: What It Actually Costs to Replace Your VP of Sales
Replacing a VP of Sales costs far more than the recruiter fee. 2026 data reveals the true cost in lost pipeline, ramp time, and rep attrition. Read the full diagnostic.
$2.4M Total Replacement Cost