BRIEF · FINANCIAL INFRASTRUCTURE
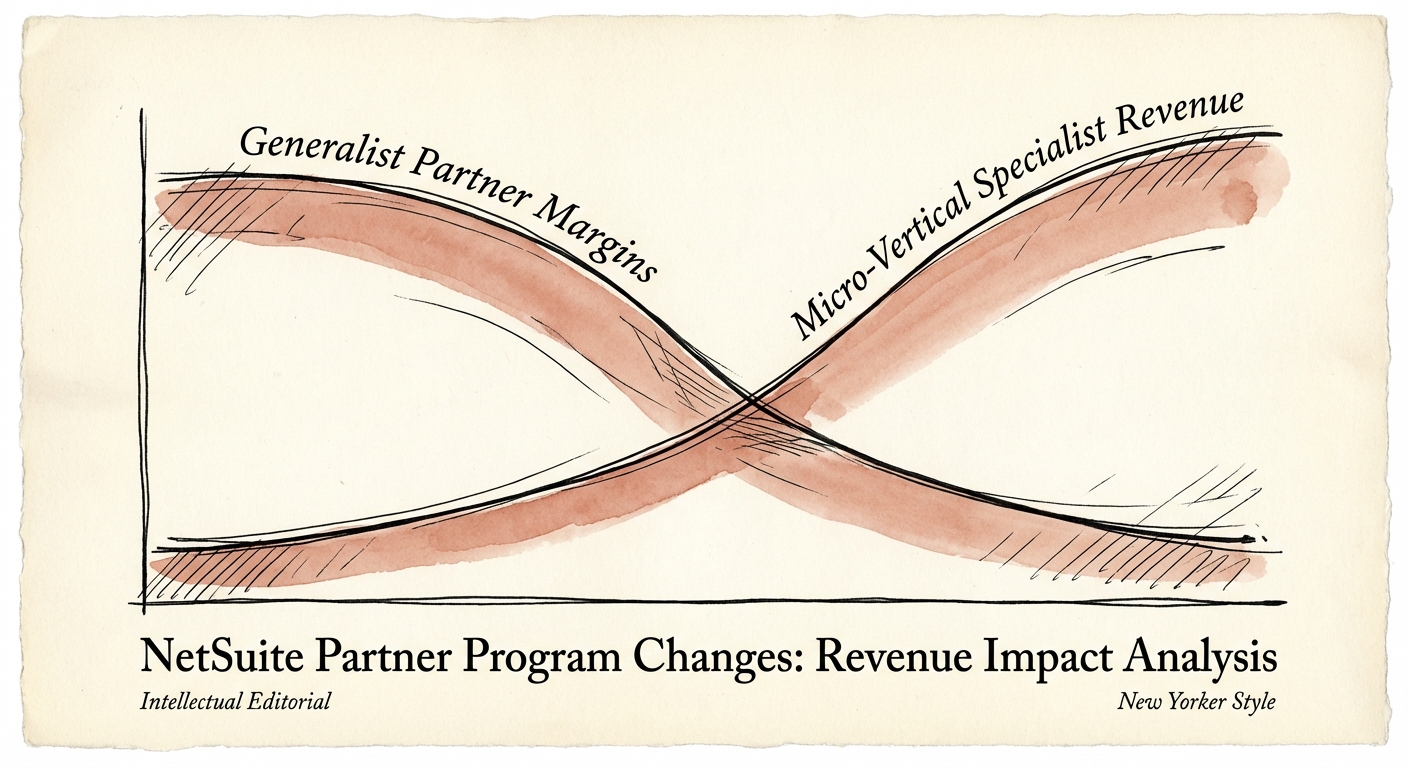
Oracle Is Eating Your Retainer: The NetSuite Partner Margin Squeeze Nobody Priced In
Oracle's ACS now competes for the post-go-live support revenue NetSuite partners built valuations on. Here's the math on what it costs you and how to pivot.
5x Faster growth for micro-vertical partners vs. generalists
BRIEF · EXIT READINESS
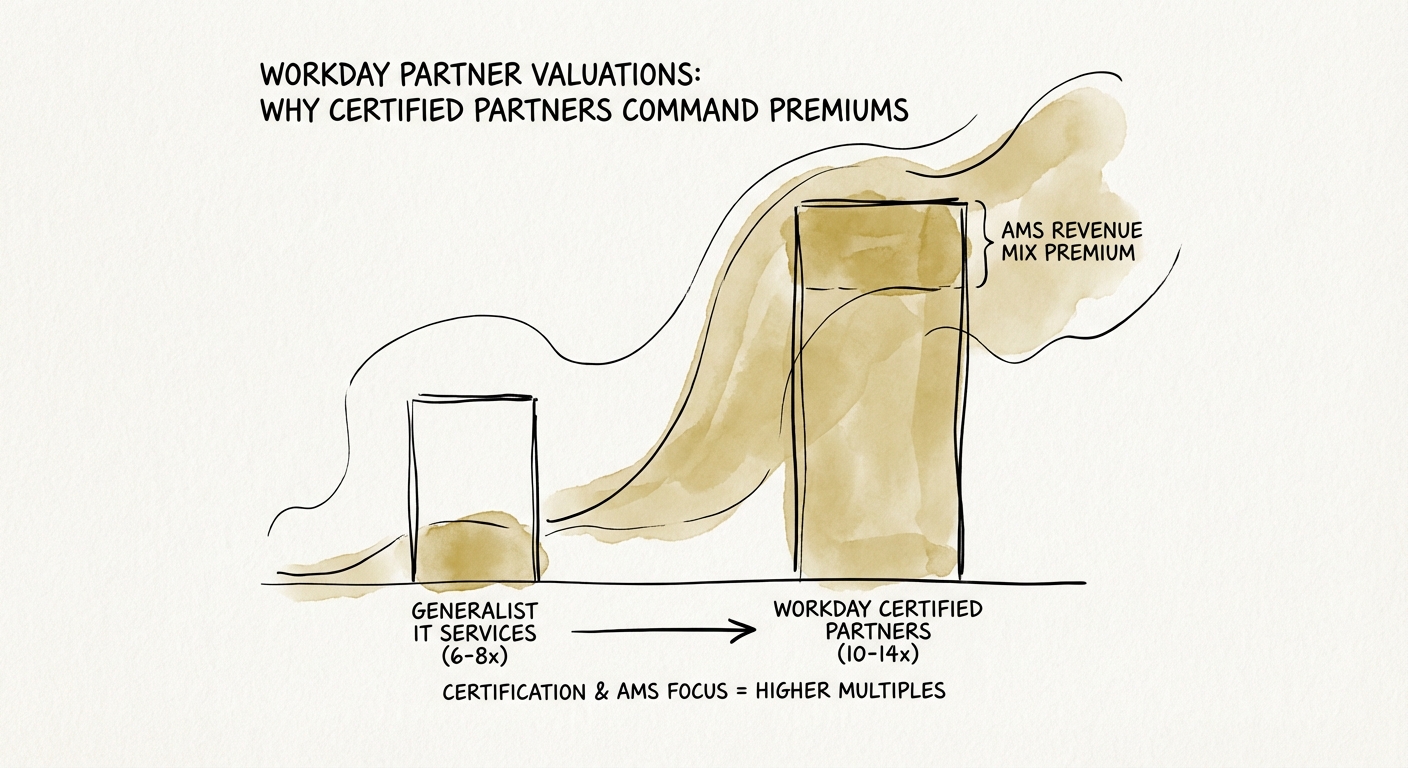
The Velvet Rope: Why Workday Partners Command a 40% Valuation Premium
Workday partners command a 40-60% valuation premium over generalist IT firms. Here is the data on multiples, certification moats, and the AMS revenue mix that drives 12x+ exits.
12.1x Avg. Top-Tier EBITDA Multiple
BRIEF · EXIT READINESS
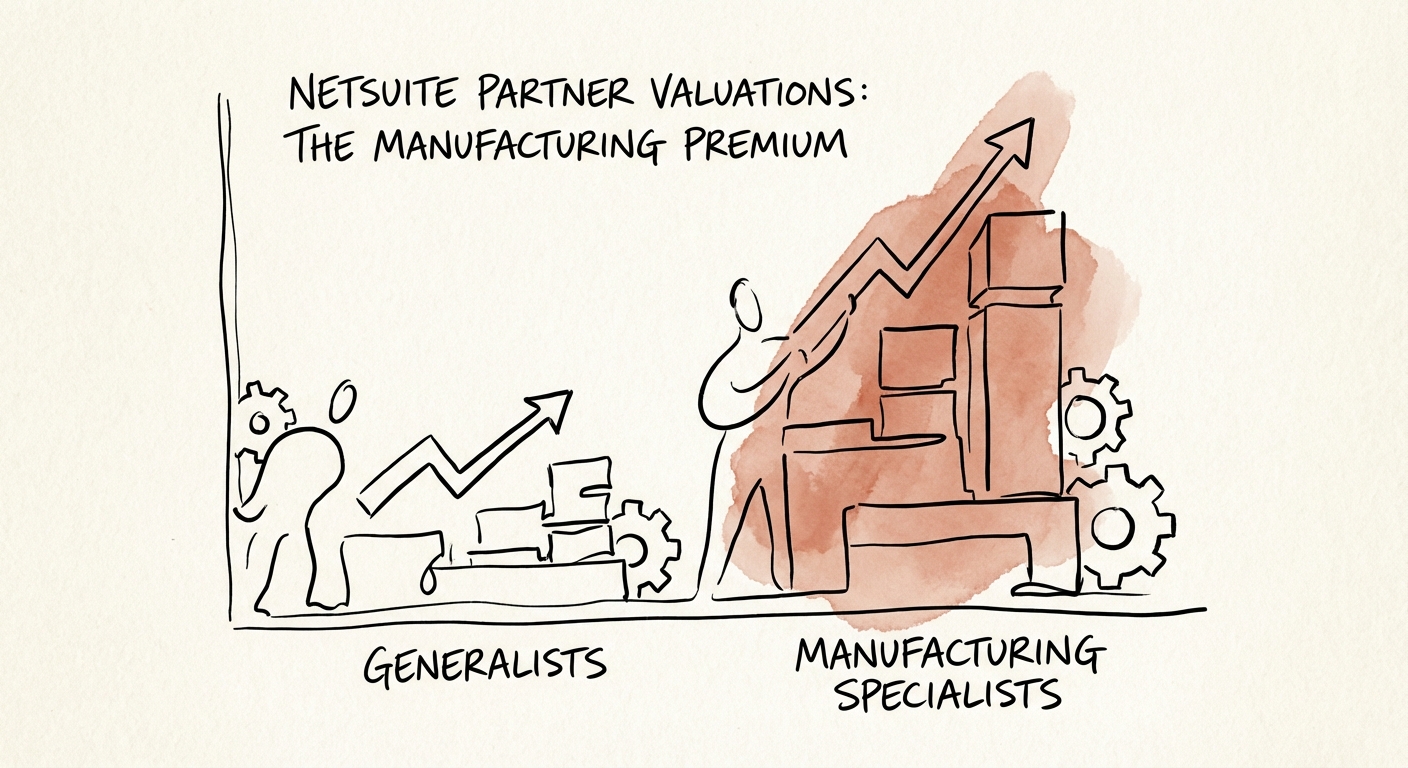
The Advanced Manufacturing Premium: Why NetSuite Partners with 'Shop Floor' DNA Trade at 12x
Why NetSuite partners with Advanced Manufacturing expertise trade at 10-12x EBITDA while generalists stall at 6x. A diagnostic guide for founders on valuation premiums.
12x Potential EBITDA Multiple
BRIEF · EXIT READINESS
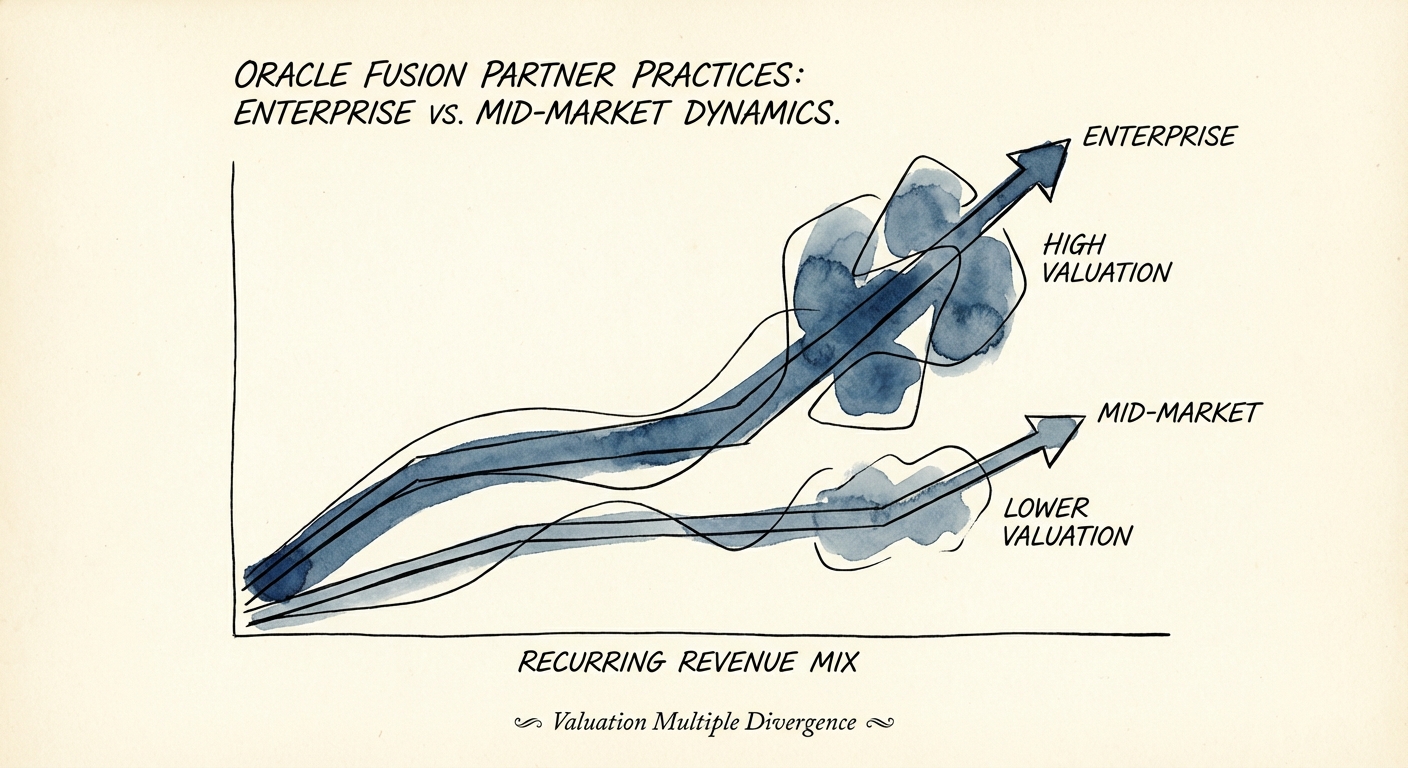
The Oracle Fusion Partner Valuation Trap: Why "Enterprise" Revenue Quality Is Killing Your Exit
Diagnostic for PE Operating Partners: Why Enterprise Oracle Fusion partners often trade at lower multiples than their Mid-Market counterparts due to revenue quality and margin erosion.
4.2x Valuation Multiple Gap (Recurring vs. Project)
BRIEF · EXIT READINESS
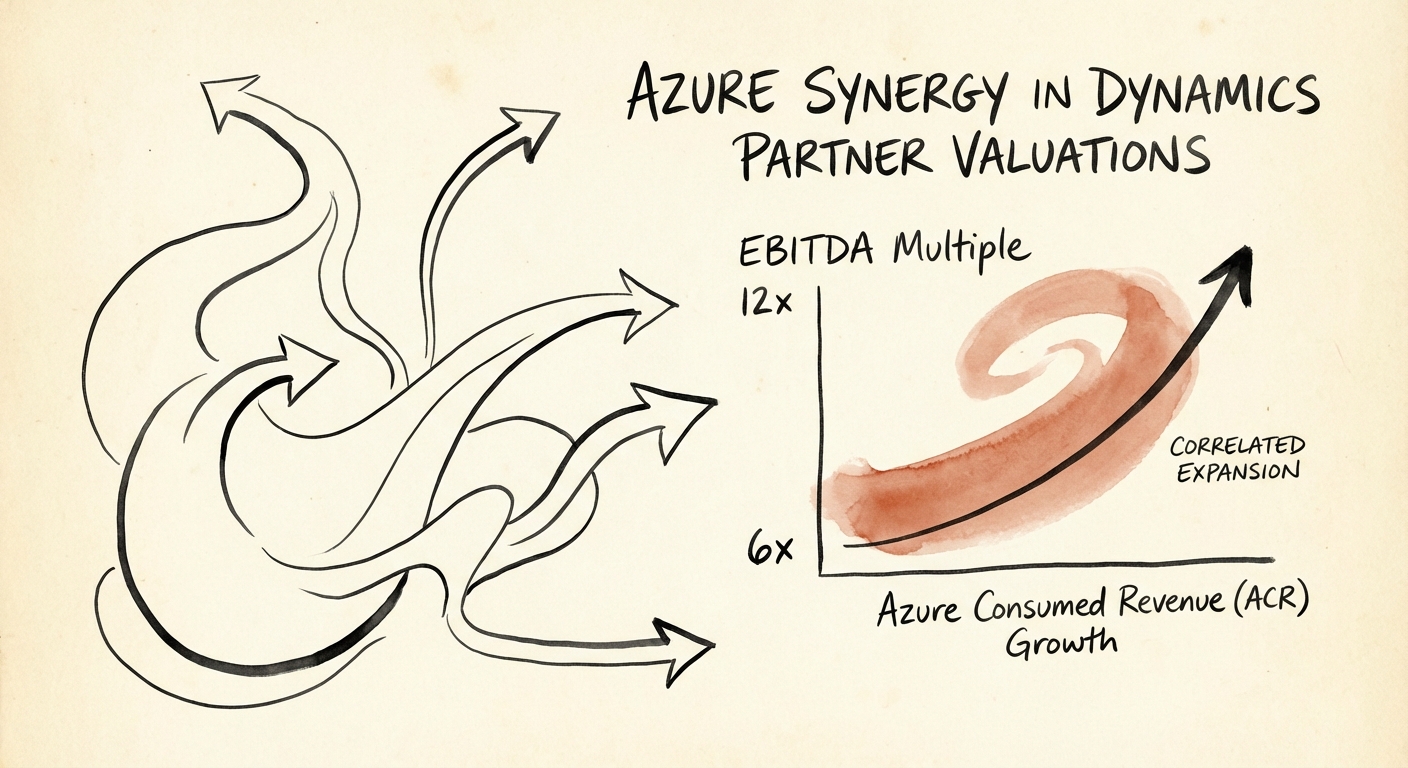
The Azure Multiplier: Unlocking a 12x Exit for Dynamics Partners
Dynamics partners with high Azure attach rates trade at 11-12x EBITDA vs. 6.5x for pure services. Here is the diagnostic framework for PE sponsors to unlock platform synergy.
12x Potential EBITDA Multiple for High-ACR Partners
BRIEF · EXIT READINESS
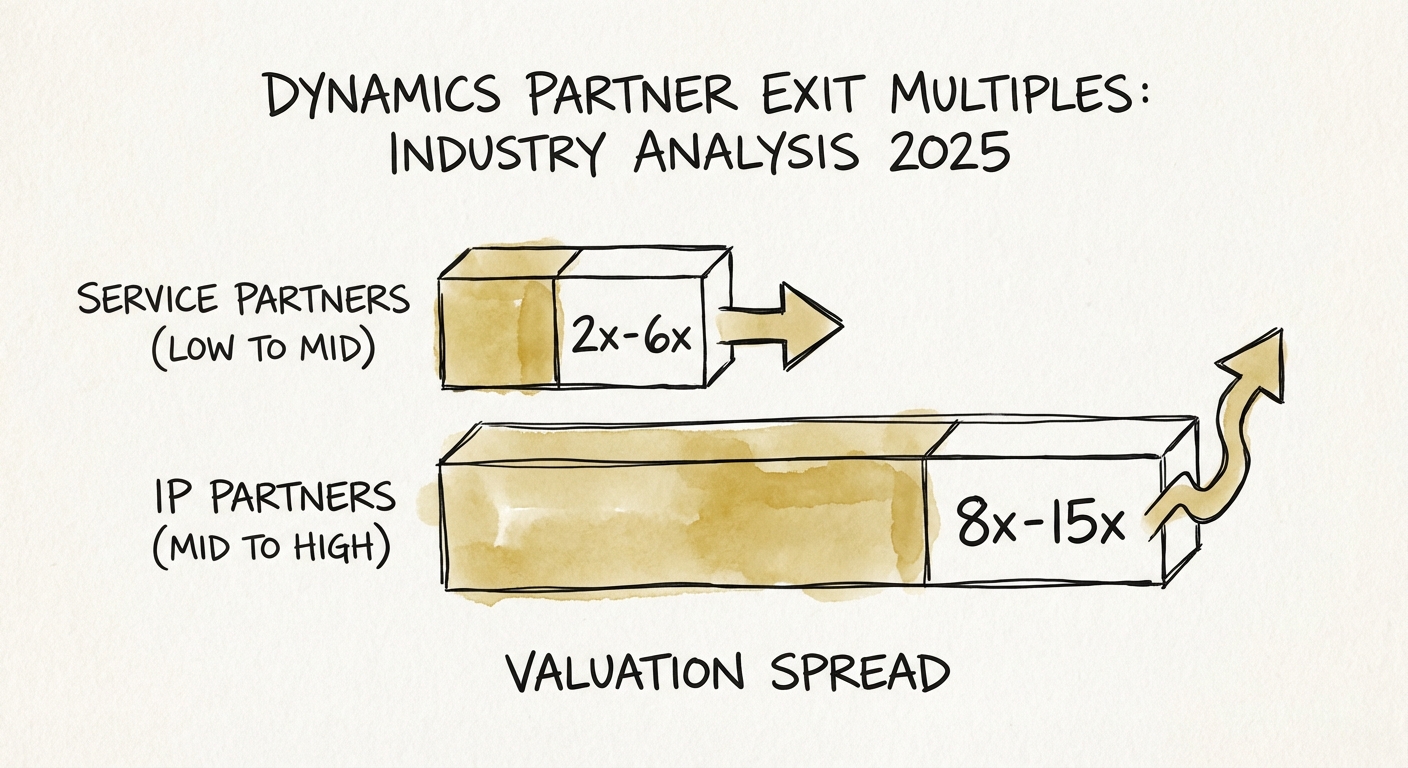
Dynamics Partner Exit Multiples: Industry Analysis 2025
2025 analysis of Microsoft Dynamics partner valuations. Learn why some partners trade at 6x EBITDA while others command 12x, and how to engineer your multiple.
4.2x Valuation Multiple Spread (Services vs. IP)
BRIEF · TEAM & HIRING
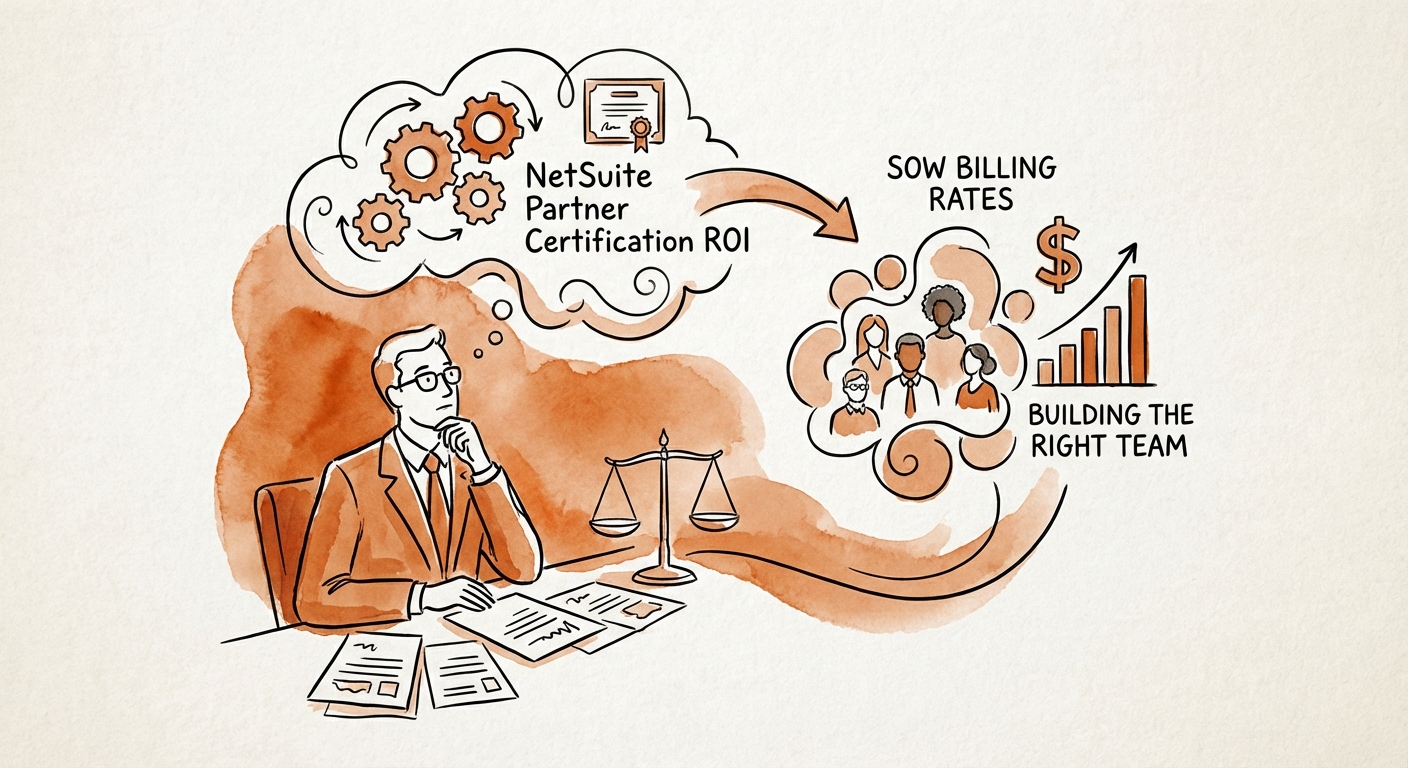
NetSuite Partner Certification ROI: The 'Paper Tiger' Trap That Kills Implementation Value
Don't pay $250/hr for a 'paper tiger.' Learn the real ROI of NetSuite certifications and how to build an implementation team that actually delivers.
150% Cost of Implementation Rescue
BRIEF · EXIT READINESS
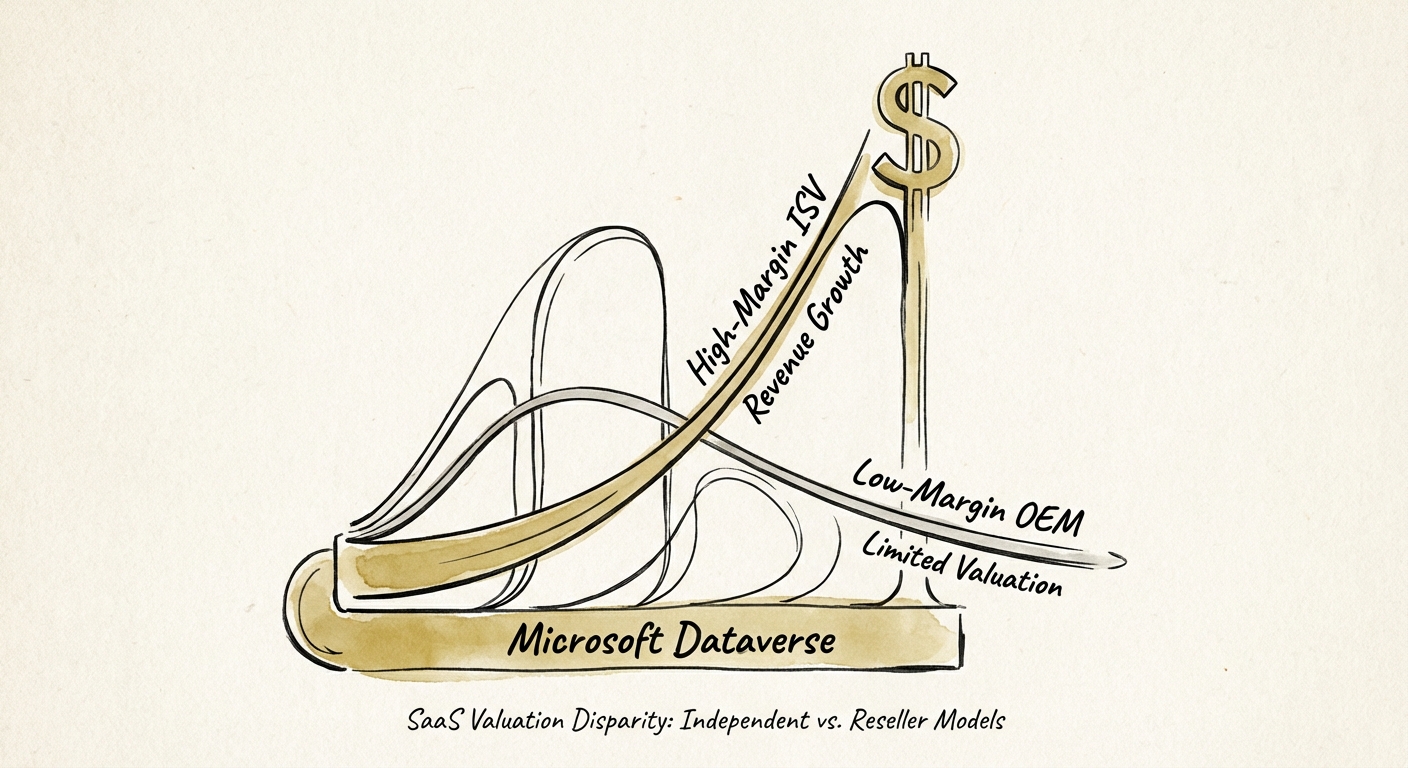
Built Your SaaS on Microsoft Dataverse? Here's the Gross-Margin Math That Decides Your Exit
Building on Microsoft Dataverse got you to $5M ARR fast. Now it caps your exit multiple. The BYOL pivot and MACC co-sell move that fix it.
3% Marketplace Transaction Fee
BRIEF · REVENUE ARCHITECTURE
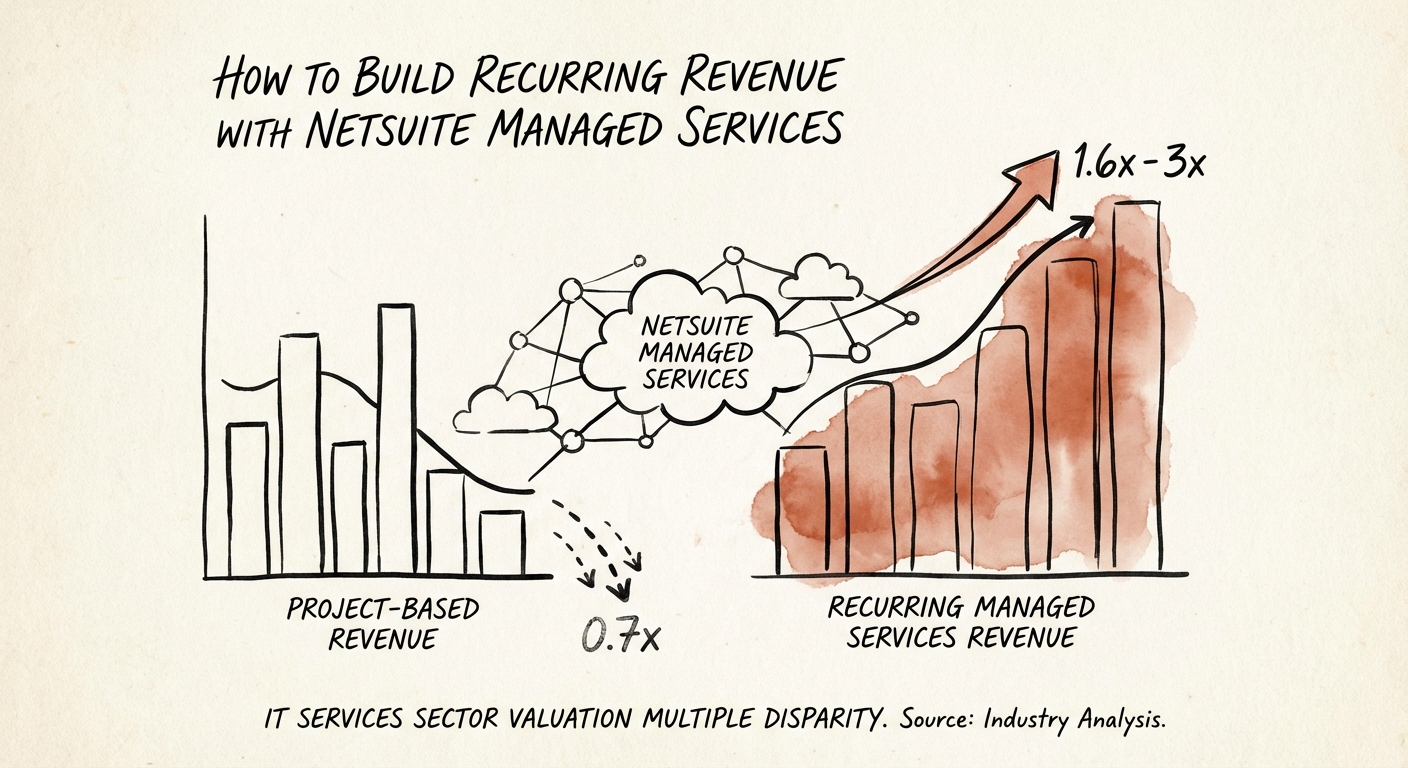
NetSuite Managed Services: How to Turn a 0.7x Implementation Shop Into a 3x Recurring-Revenue Firm
Why NetSuite implementation firms sell for 0.7x revenue and managed-services firms sell for 3x — and the attach-rate, tiering, and margin math to close the gap.
3x Valuation Multiple Lift
BRIEF · TEAM & HIRING
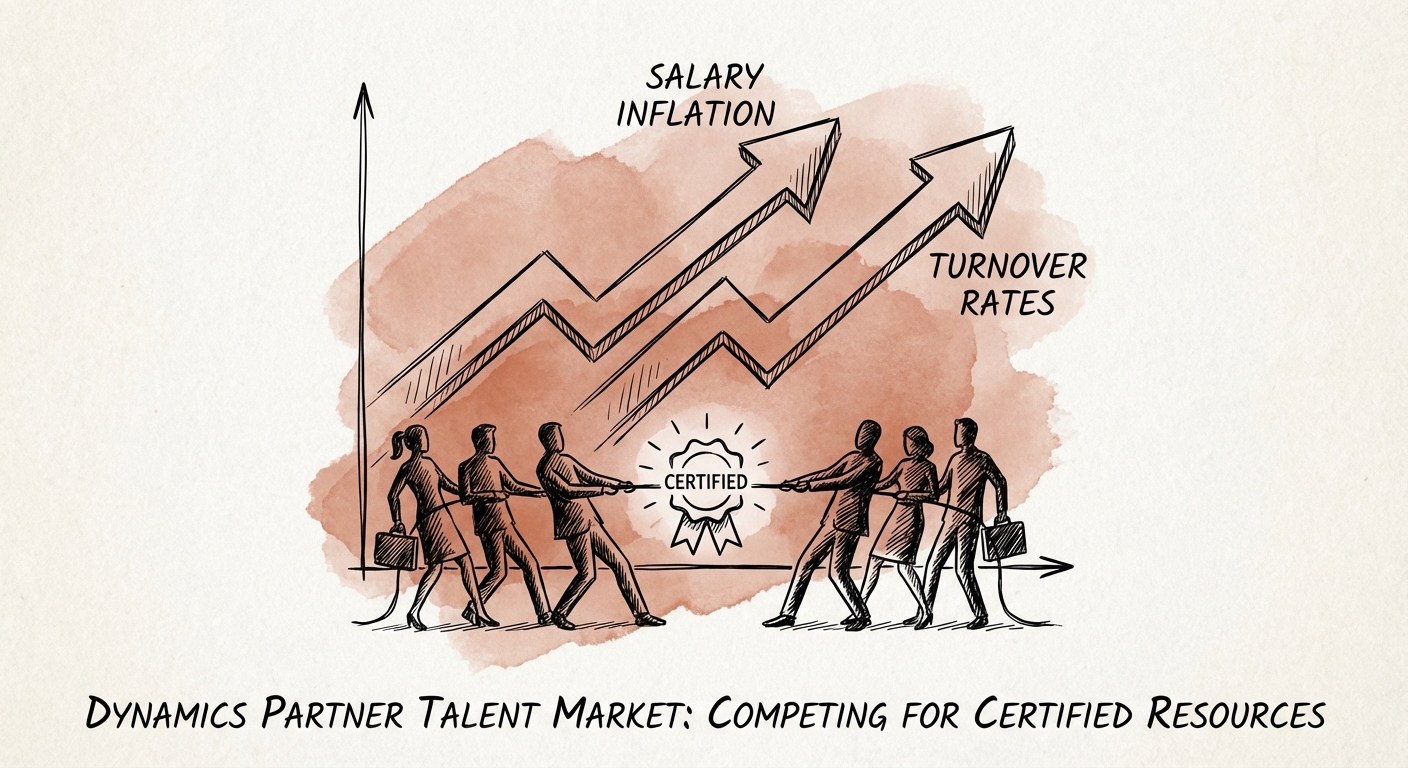
The Dynamics Talent War: Why Your "Certified" Consultants Can't Deliver
The Microsoft Dynamics talent market is broken. Learn why partners are losing their best consultants to end-users and how to avoid the $240k cost of a mis-hire.
$240,000 Avg. Cost of a Bad Senior Hire
BRIEF · REVENUE ARCHITECTURE
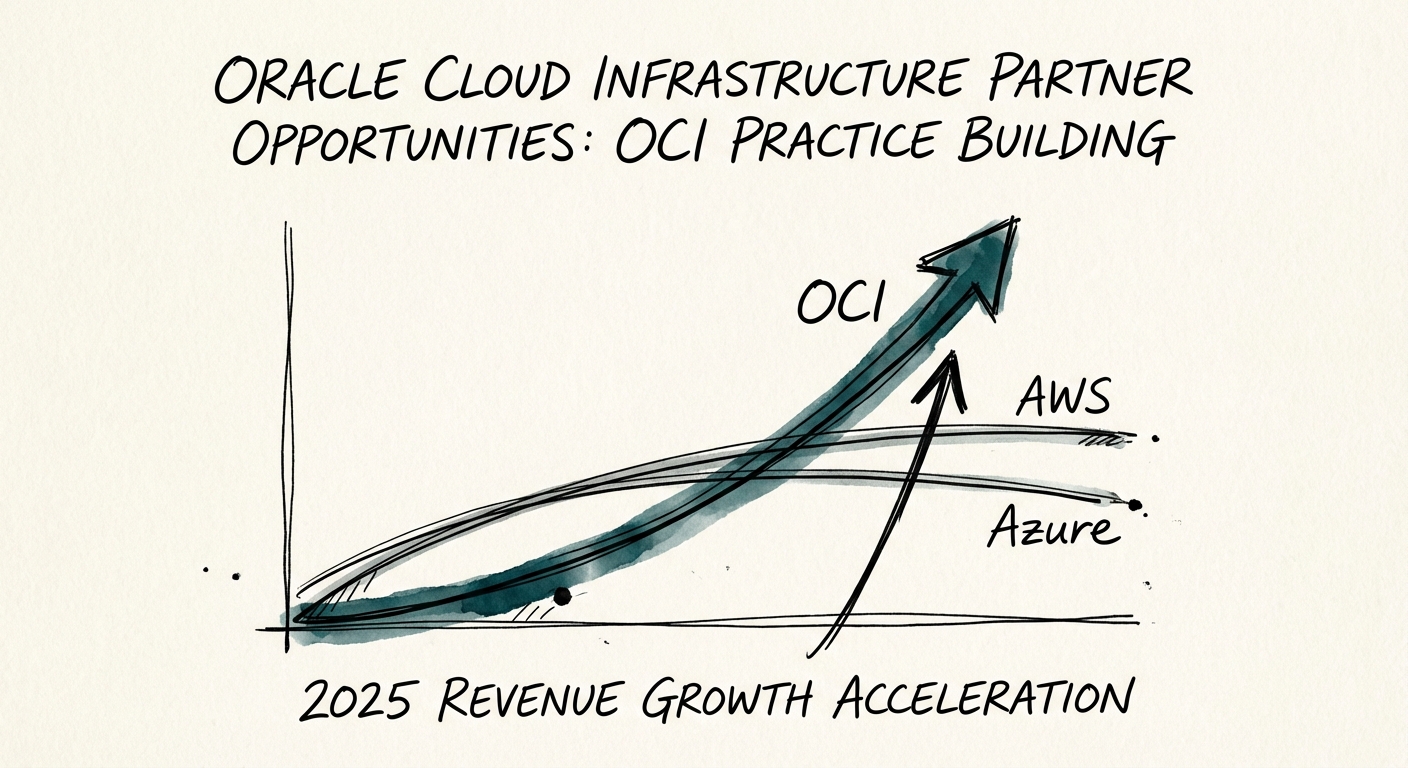
The 'Uncool' Cloud Creating Margin: Why Smart Founders Are Pivoting to OCI
While AWS and Azure markets saturate, Oracle Cloud Infrastructure (OCI) is growing at 52% YoY. Here is the diagnostic playbook for services firms to build a high-margin OCI practice.
52% YoY IaaS Growth (FY25)
BRIEF · TECHNICAL DEBT
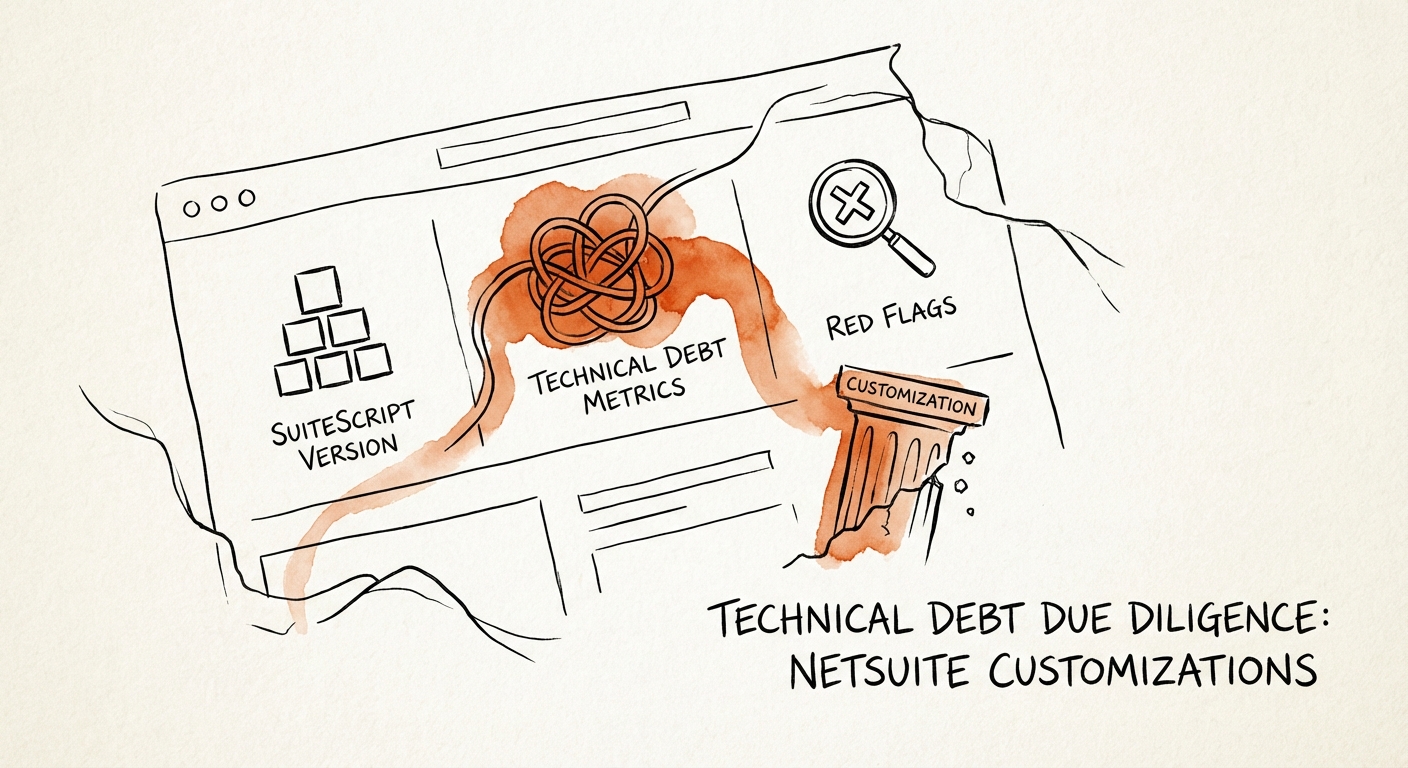
The NetSuite 'Spaghetti Code' Discount: Why Over-Customization Kills Deal Value
Don't inherit a 'Franken-Suite.' Learn how to quantify technical debt in NetSuite customizations, identify SuiteScript red flags, and adjust your deal valuation.
$400k+ Hidden Remediation CapEx
BRIEF · EXIT READINESS
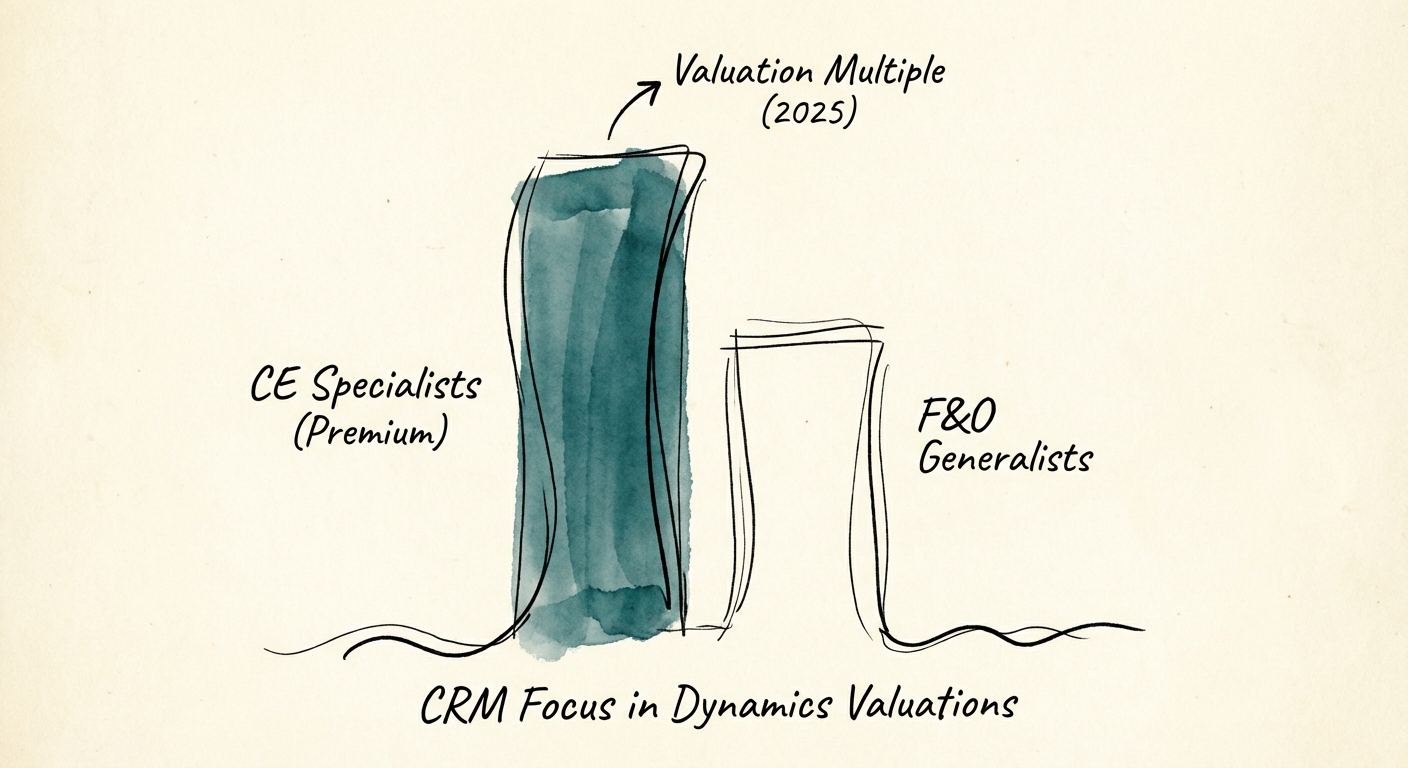
The CE Specialist Premium: Why Dynamics CRM Practices Trade Higher Than Generalists
Why Microsoft Dynamics 365 CE practices trade at 10-12x EBITDA while F&O generalists lag at 6-8x. A valuation diagnostic for scaling founders.
4 Turns Valuation Premium (CE vs. Generalist)
BRIEF · FOUNDER EXTRACTION
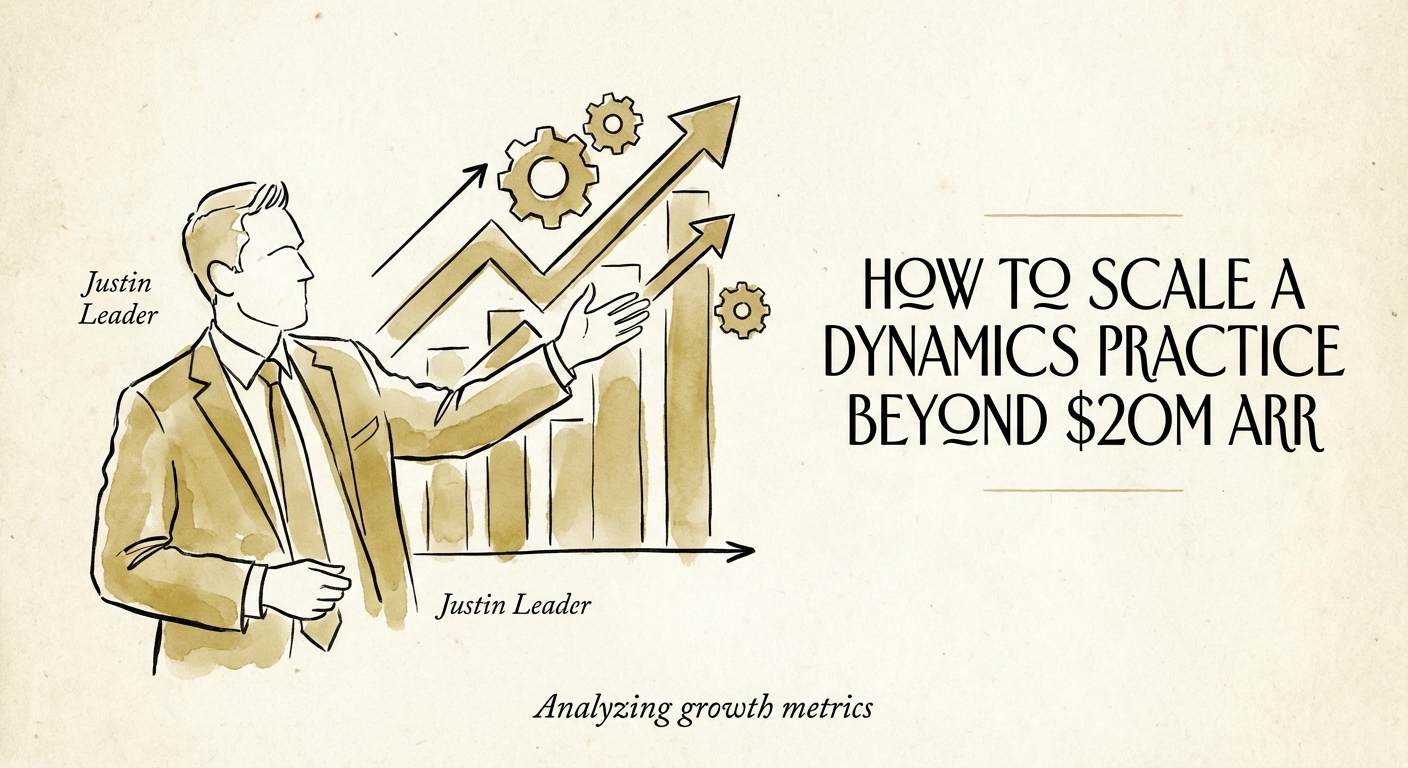
The Valley of Death: How to Scale a Dynamics Practice Beyond $20M ARR
Stuck at $10M ARR? Here is the operator's guide to scaling a Microsoft Dynamics 365 practice past $20M. Benchmarks, valuation multiples, and founder extraction strategies.
68.9% Avg. Billable Utilization (2025 Low)
BRIEF · MIGRATION & INTEGRATION
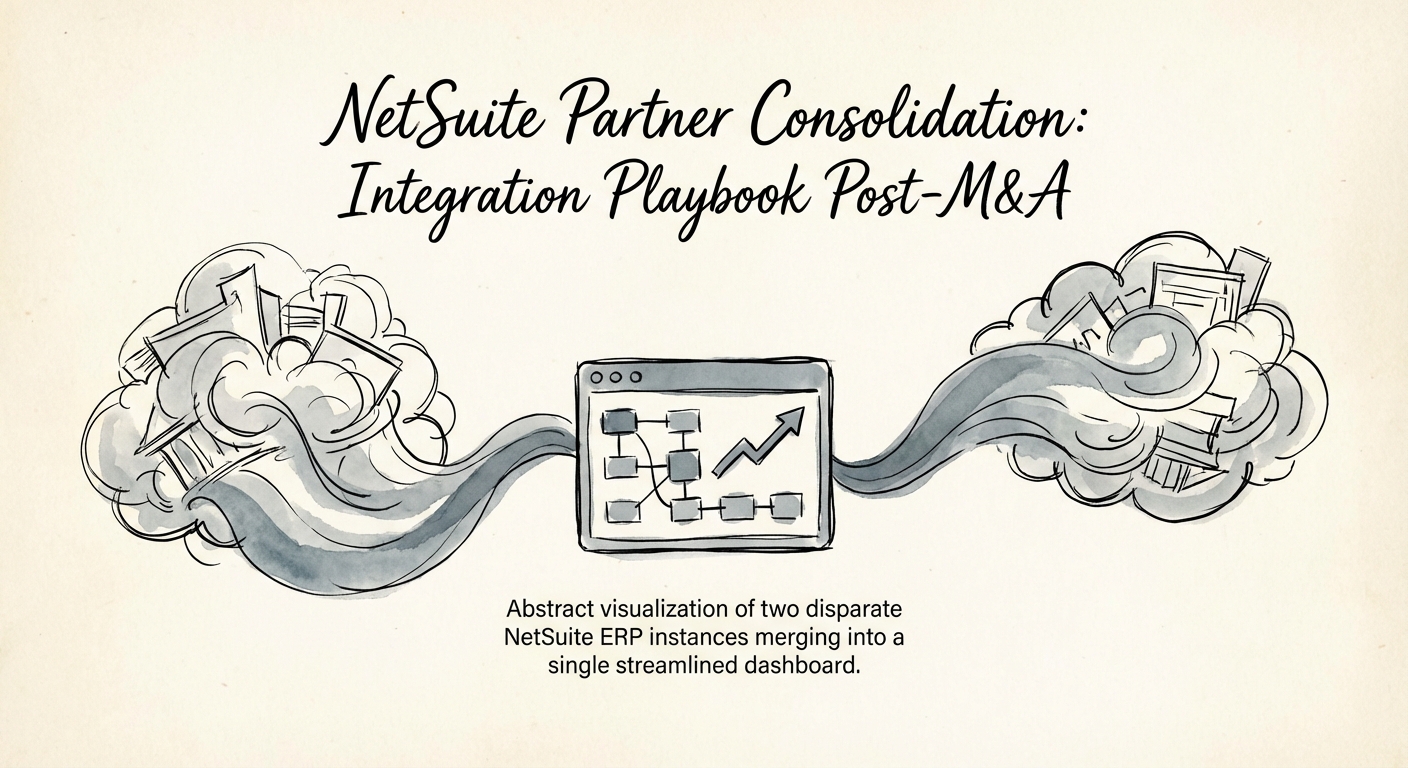
The NetSuite Partner Roll-Up: Why 1+1=1.5 (Until You Fix Integration)
A diagnostic guide for PE Operating Partners integrating NetSuite Solution Providers. Benchmarks on utilization, technical debt, and the 'Cobbler's Children' trap.
68.9% Avg. Billable Utilization (Post-Merger Dip)
BRIEF · TECHNICAL DEBT
In-House vs. Outsource at Series B: The Build Decision That Sets Your Next Multiple
Series B founders face one engineering sourcing decision that diligence will price in 18 months later. Here is the framework, the trap, and what to do Monday.
60% Failure rate of outsourced projects due to governance gaps
BRIEF · FOUNDER EXTRACTION
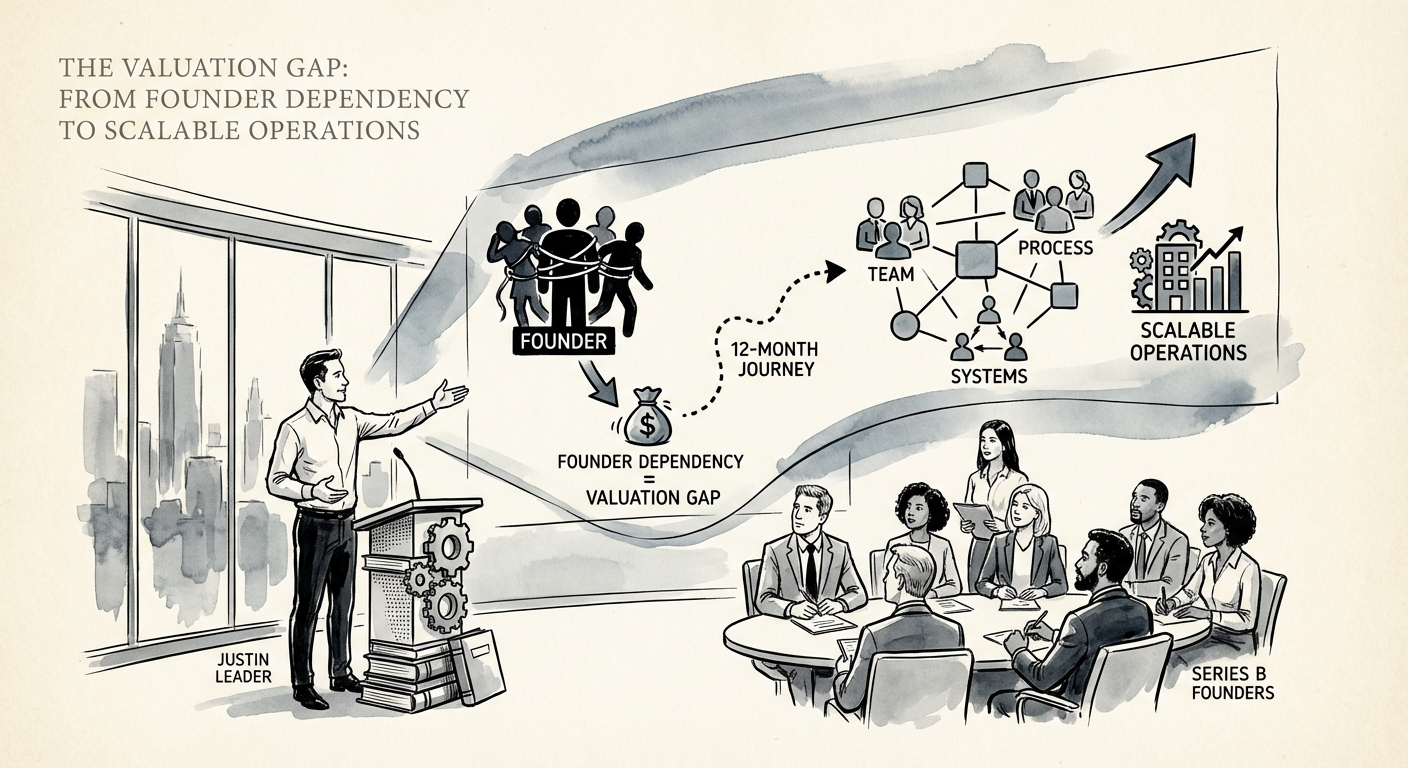
The 12-Month Plan to Make Your $10M+ Tech Company Survive Without You
A month-by-month plan to extract yourself from a $10M-$50M tech company before you sell — and close why founder-dependent firms trade at a 30-50% discount.
50% Valuation Discount for Key-Person Risk
BRIEF · EXIT READINESS
The CTO's Code Audit Survival Guide: What PE Diligence Actually Reads in Your Repos
A CTO's field guide to surviving PE technical due diligence: the forensic code scan, key-person math, and the 20% re-trade that hides in your legacy module.
2.8x Higher Success Rate
BRIEF · PROJECT RECOVERY
How a Stalled ERP Implementation Got Back on Track in 45 Days
A practical ERP recovery playbook for cutting scope, fixing governance, forcing vendor evidence, and getting a stalled implementation back on track.
Daily decisions Recovery Cadence
BRIEF · TECHNICAL DEBT
When to Walk Away: The 5 Technical Deal-Breakers That Kill M&A Value
Discover the 5 technical due diligence red flags that signal a deal is high-risk. Learn the math behind 'remediation vs. walk away' decisions for PE sponsors.
70% Deal integrations that fail due to overlooked tech gaps
BRIEF · TEAM & HIRING
Your First VP of Sales: The 120-Day Plan That Beats the 18-Month Clock
First-time VP of Sales hires fail more than 75% of the time. Here's the 120-day plan that turns your founder magic into a system someone else can run.
18 Months Avg VP Tenure
BRIEF · MIGRATION & INTEGRATION
98% Gross Revenue Retention After a Merger of Equals: The 100-Day Freeze
A tech-services merger of equals with 28,000 customer records, two CRMs, three ERPs—and how a 100-day "Do No Harm" freeze held gross revenue retention at 98%.
98% Customer Retention Rate
BRIEF · TECHNICAL DEBT
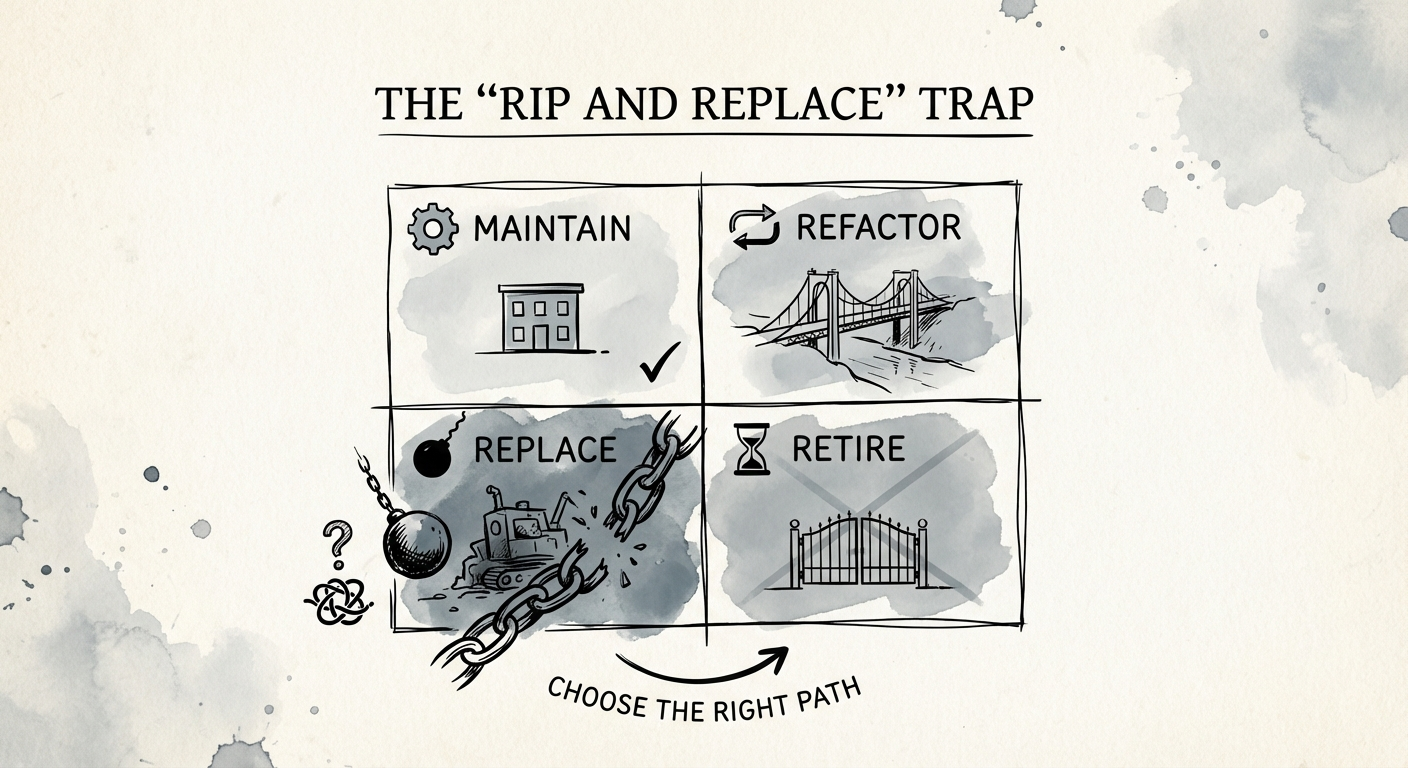
The 'Rip and Replace' Trap: Why 70% of Modernization Projects Fail (And How to Choose the Right Path)
Stop the 'Grand Rewrite.' Use this 4-quadrant diagnostic framework to decide when to refactor, replace, or retire legacy systems. Benchmarks included.
80% of IT Budget Consumed by Maintenance
BRIEF · TECHNICAL DEBT
When Your Portfolio CTO Says "We Have to Rewrite It": A PE Operating Partner's Playbook
Your portfolio CTO wants 18 months and a clean rewrite. Here's how a PE operating partner pressure-tests that request against the hold clock and the exit multiple.
70% Rewrite Failure Rate