BRIEF · EXIT READINESS
Two Dynamics 365 Partners, Same Revenue, Double the Multiple: What AppSource Decides
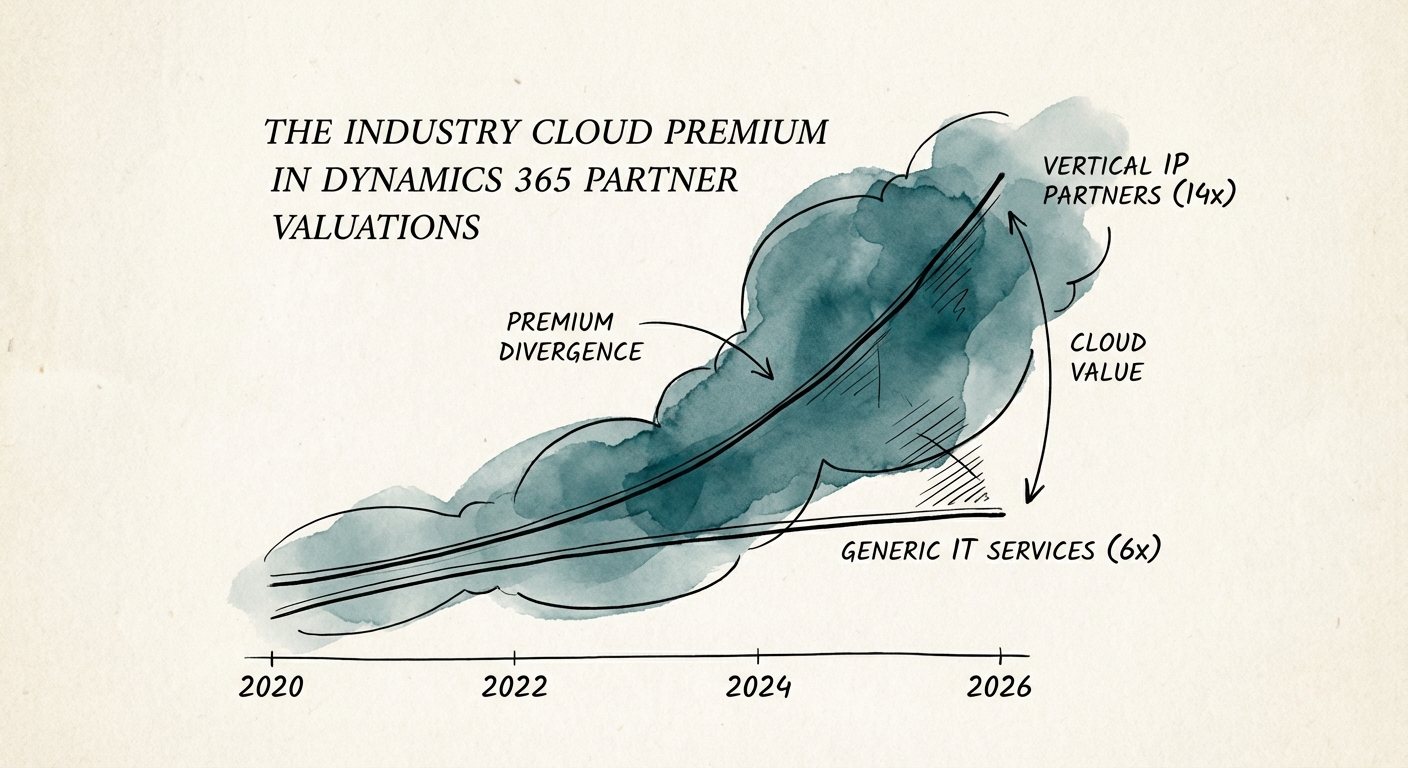
A $14M-revenue generalist D365 shop sells at 6x. The vertical specialist next door sells at 14x. The difference isn't size. It's IP attach and co-sell.
14x EBITDA Multiple for Vertical IP
BRIEF · EXIT READINESS
The Dynamics Multiple: How to Value Microsoft Partners Beyond the 'Gold' Badge
Dynamics partners trade between 6x and 14x EBITDA. Learn the 3 revenue quality metrics that determine the multiple and why generic implementation shops are a value trap.
14x Potential EBITDA Multiple for IP-Led Partners
BRIEF · MIGRATION & INTEGRATION
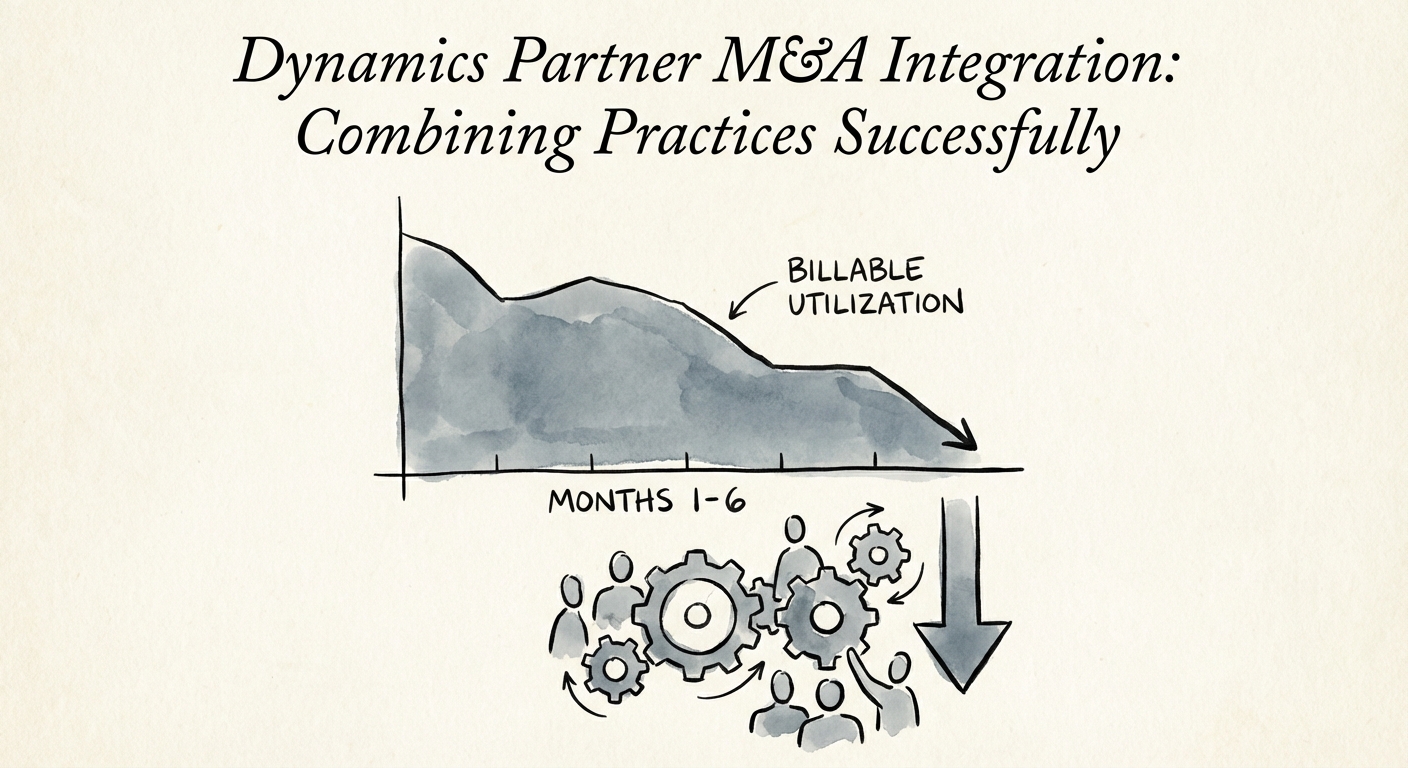
Rolling Up Dynamics 365 Partners: Why F&O and CE Won't Just Merge
A Dynamics 365 roll-up doesn't fail at the bank account. It fails when your F&O architects refuse to work with the CE team. Here's how to integrate the practice, not just the P&L.
30% Avg. Utilization Drop Post-Merger
BRIEF · PROCESS DOCUMENTATION
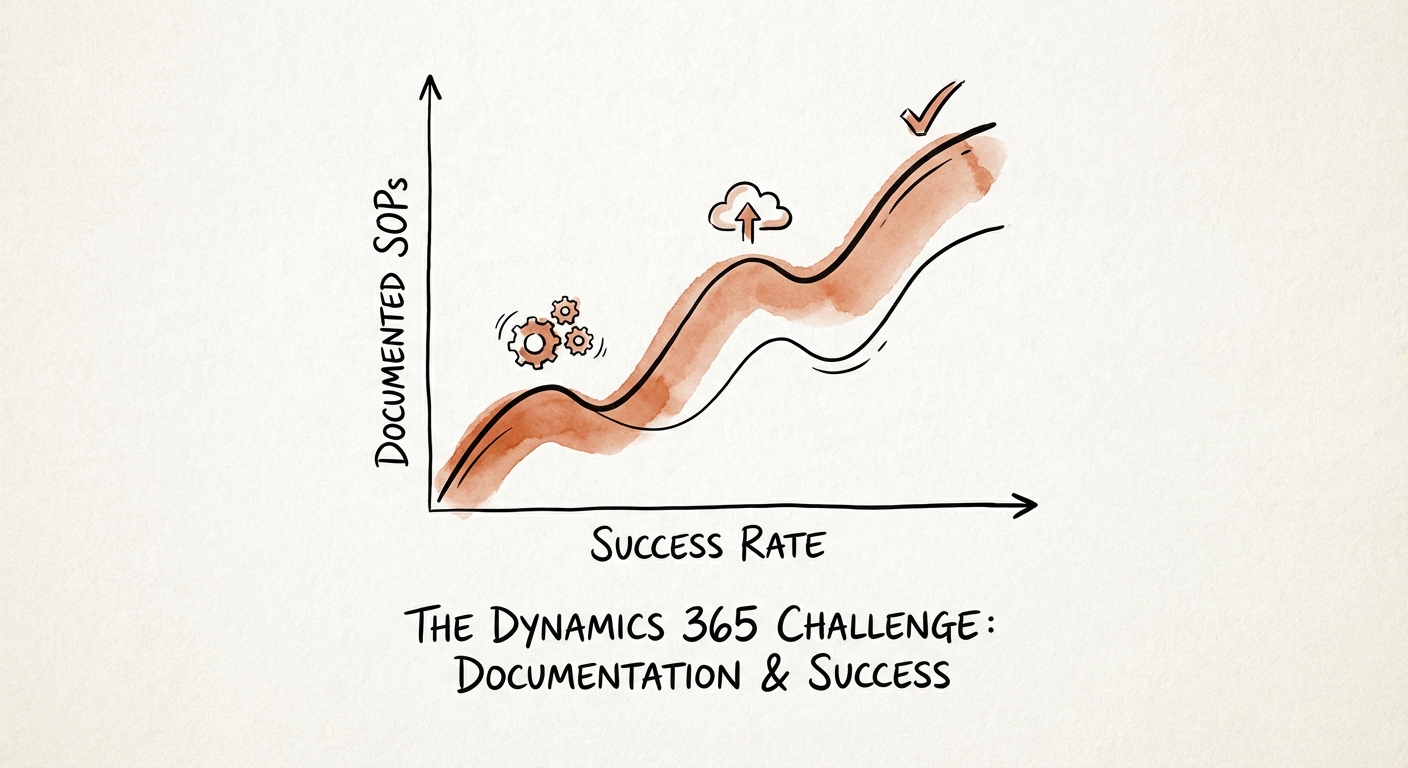
The Dynamics 365 Margin Leak: Why Your Best Implementations Still Lose Money
Most Dynamics 365 partners lose margin to rework, not bad sales. Here is the documentation discipline that keeps F&O and CE projects out of the red zone.
60% D365 Projects Missing ROI Targets
BRIEF · GTM EXECUTION
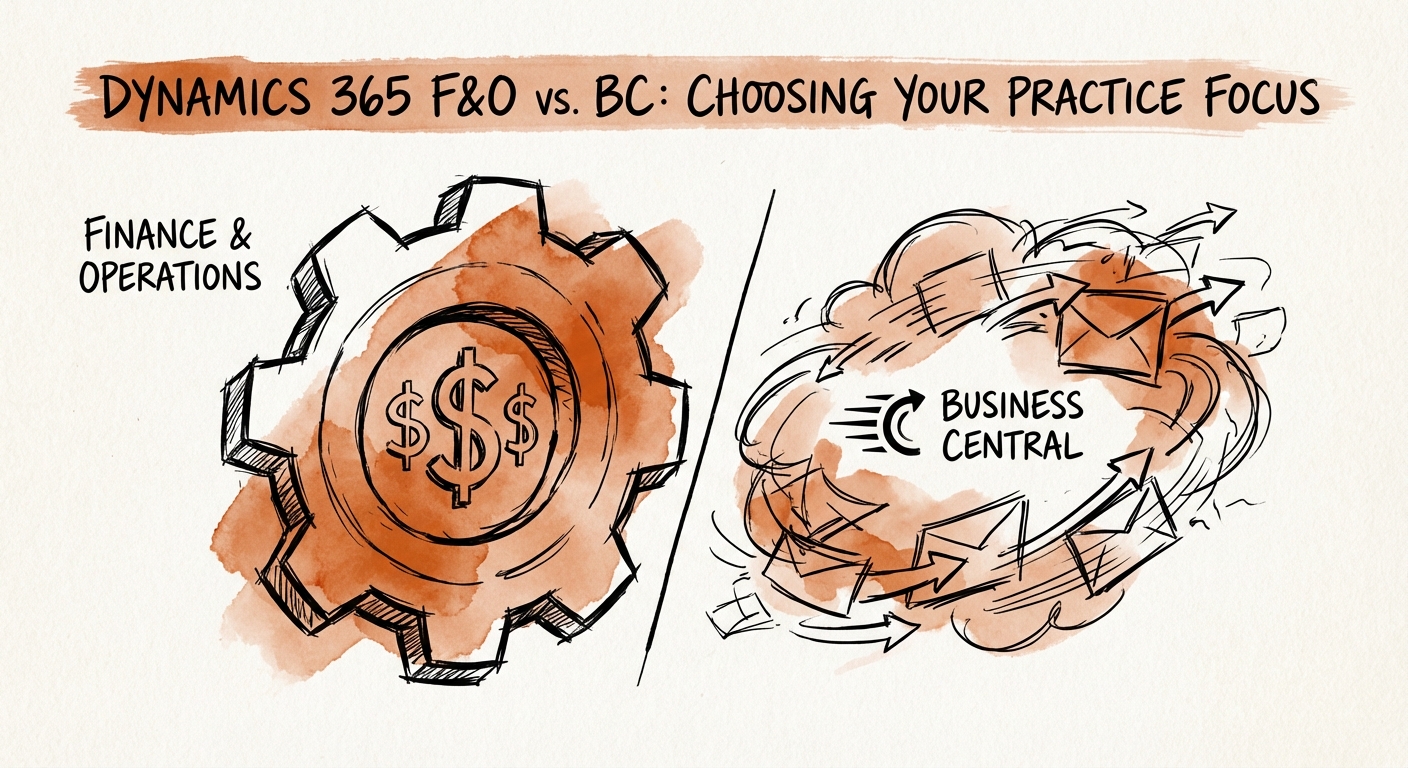
Dynamics 365 F&O vs. BC: The Practice Specialization Decision That Determines Your Exit Multiple
Stop choosing your Dynamics practice based on features. Learn the unit economics, valuation multiples, and capital requirements of F&O vs. Business Central.
18 vs. 4 Avg. Implementation Months (F&O vs. BC)
BRIEF · REVENUE ARCHITECTURE
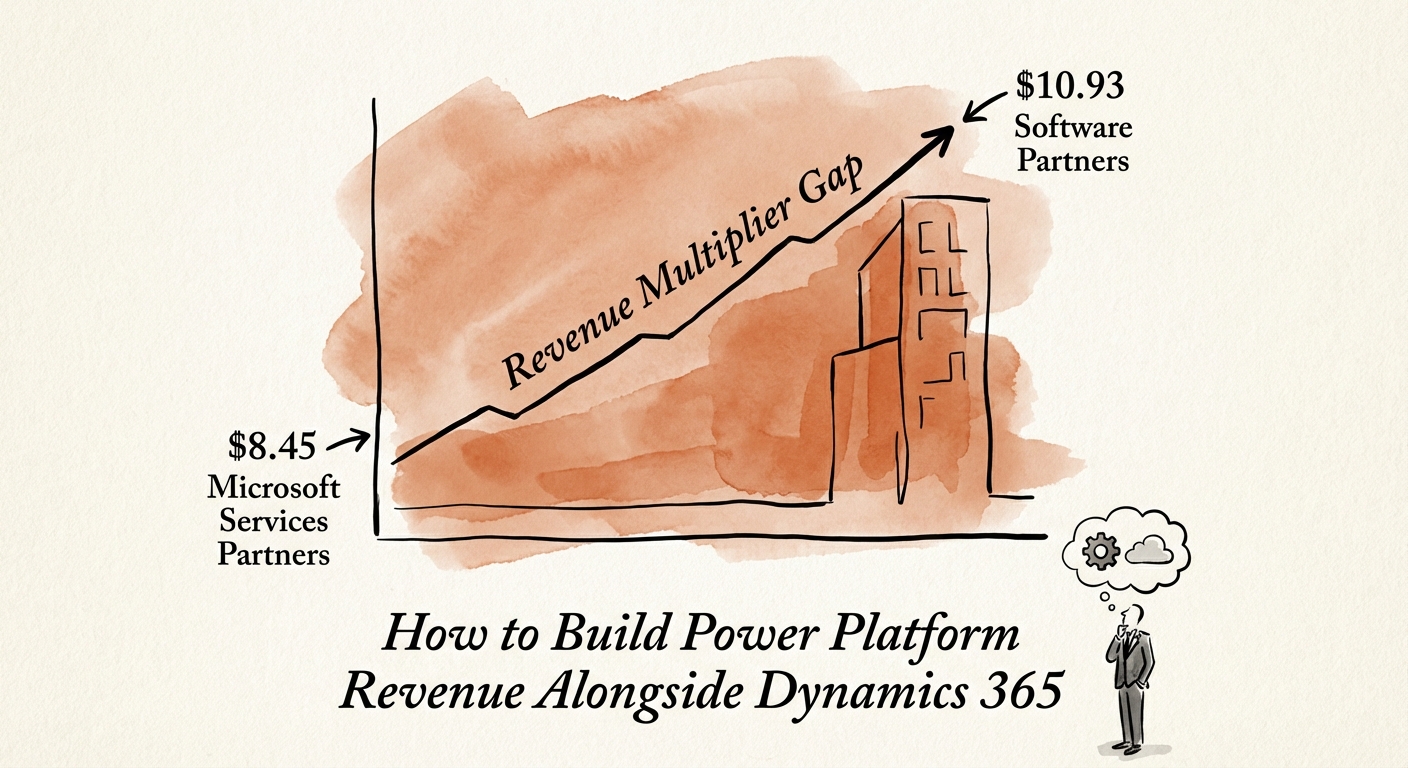
Your Dynamics 365 Practice Is Giving Away Its Best Margin in Power Apps
Dynamics 365 partners bury Power Platform on the invoice. Here's the line-item audit that turns those hours into reusable IP and a higher exit multiple.
$10.93 Partner Economic Multiplier (Software-Led)
BRIEF · FINANCIAL INFRASTRUCTURE
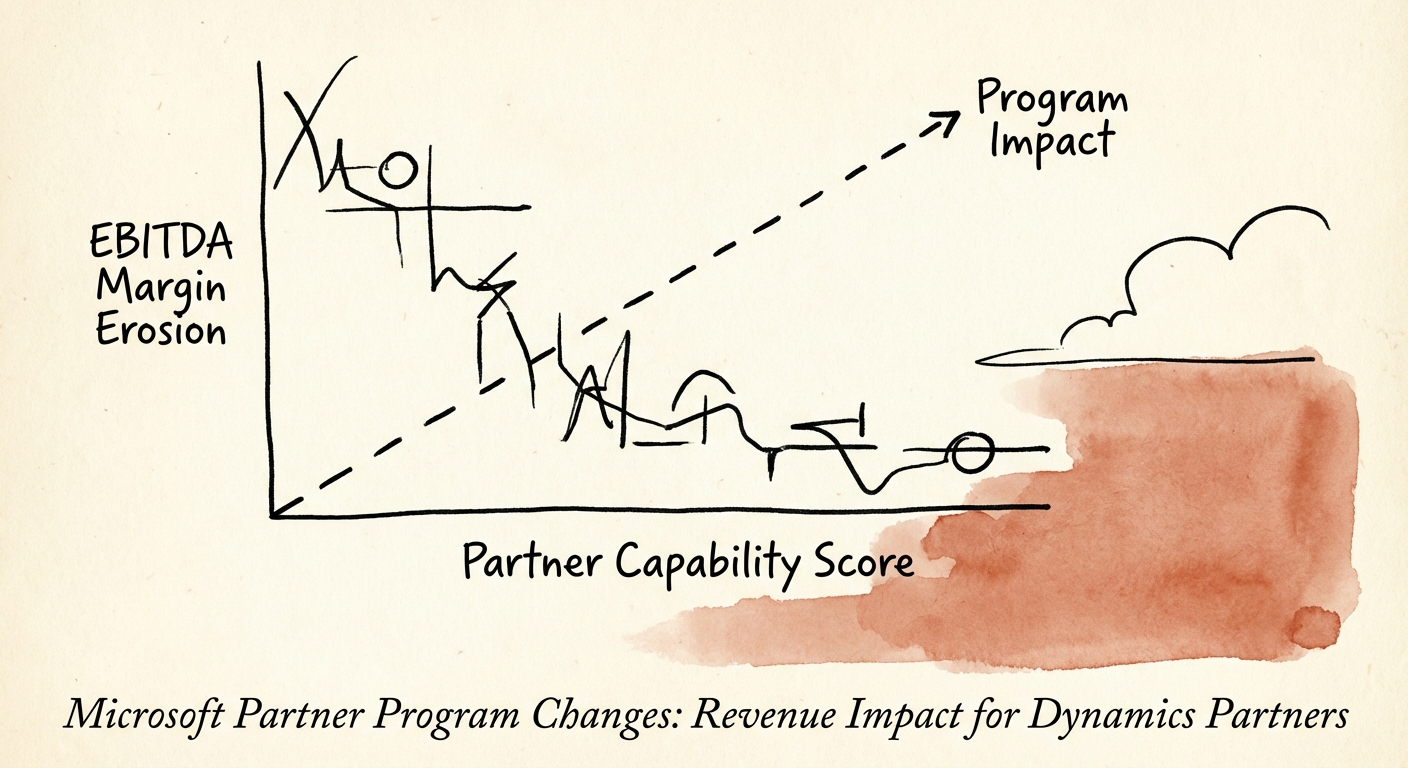
The 'Partner Margin Cliff': Why Dynamics 365 Firms Will Lose 15% of EBITDA in 2026
The transition to Solutions Partner designations is an extinction event for legacy Dynamics firms. Here is the revenue impact analysis for 2025.
70 Min. Capability Score
BRIEF · REVENUE ARCHITECTURE
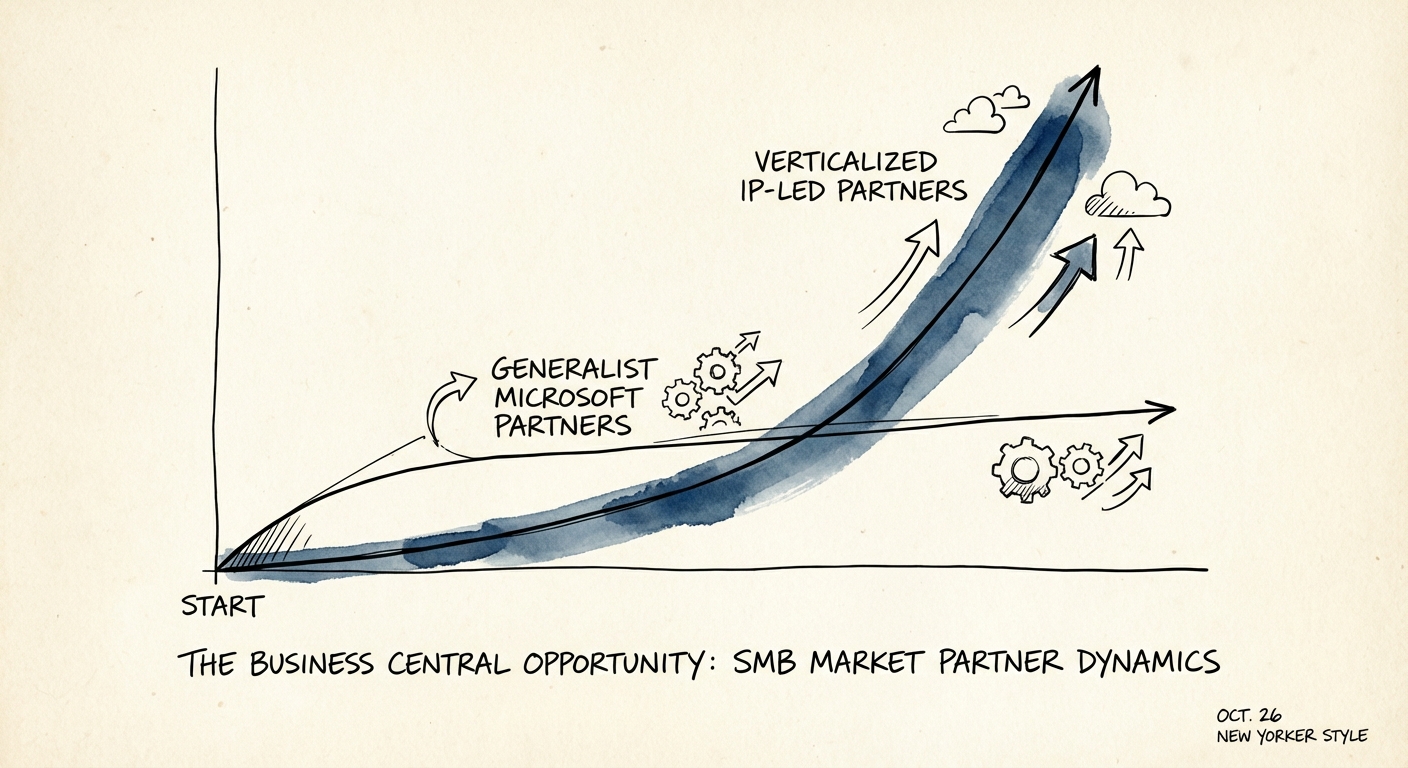
The Business Central Opportunity: Why the 'White Hot' Market Is a Margin Trap for Generalists
Microsoft Business Central is booming, but generalist partners are dying. Here is the diagnostic on how to capture the opportunity without killing your margins.
45,000+ SaaS Customers (and Growing)
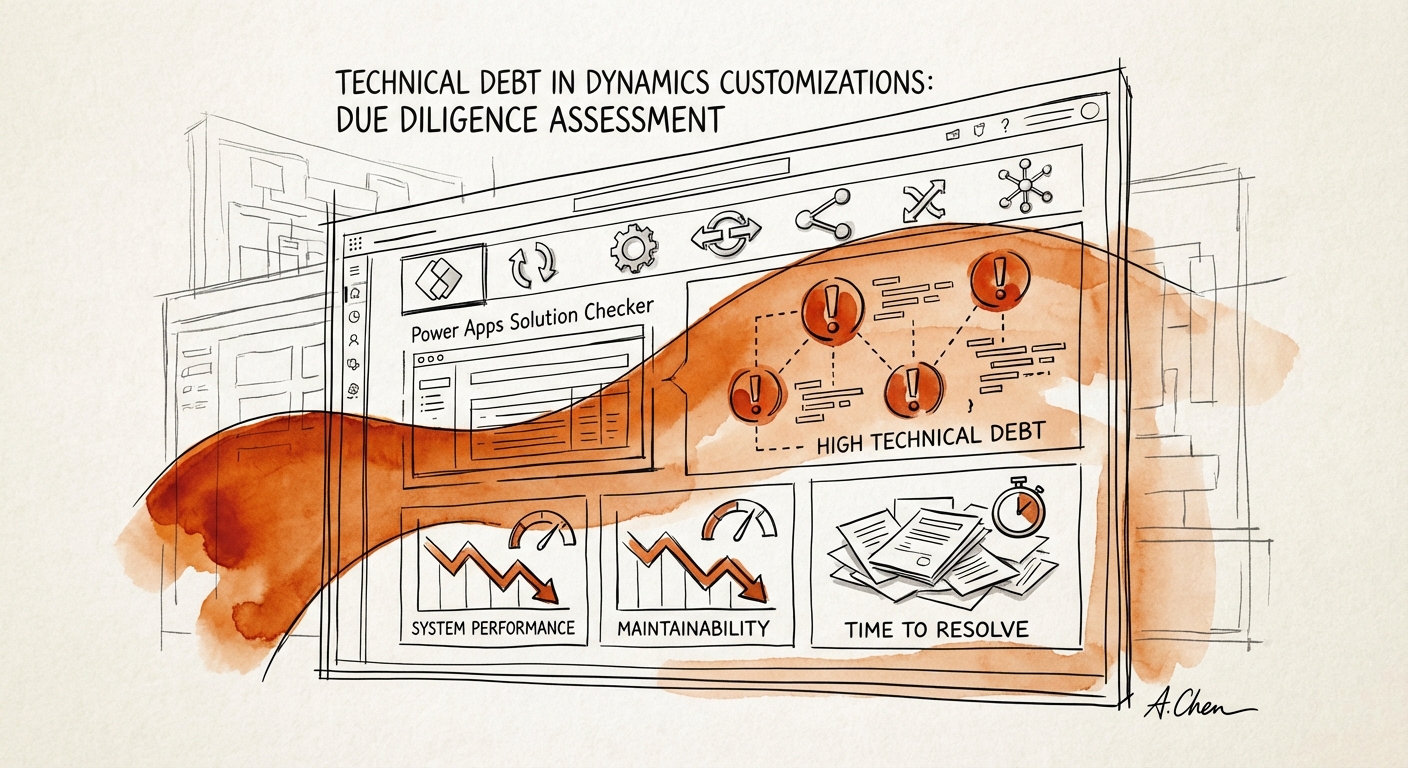
BRIEF · TECHNICAL DEBT
The "Customization Tax": Why Your Target's "Unique" Dynamics Implementation Is a $2M Liability
Heavily customized Dynamics 365 implementations are a valuation trap. Learn the benchmarks, the "One Version" risks, and how to calculate the purchase price adjustment.
70% ERP Failure Rate Linked to Debt
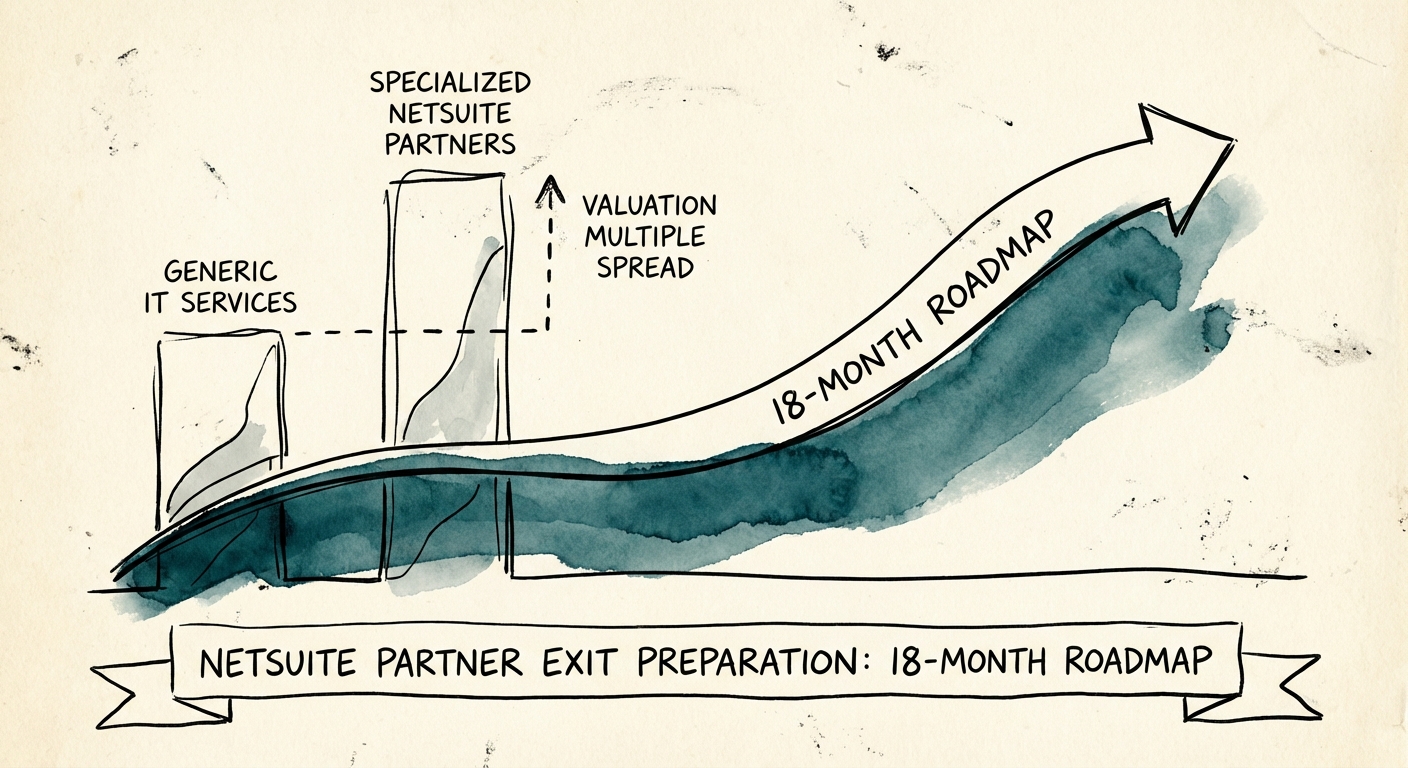
BRIEF · EXIT READINESS
The NetSuite Partner Exit: An 18-Month Roadmap to a Premium Multiple
Don't sell your NetSuite practice for a 4x multiple. Follow this 18-month roadmap to shift revenue mix, extract the founder, and target 10x+ valuations.
40% vs 15% Recurring Revenue Premium
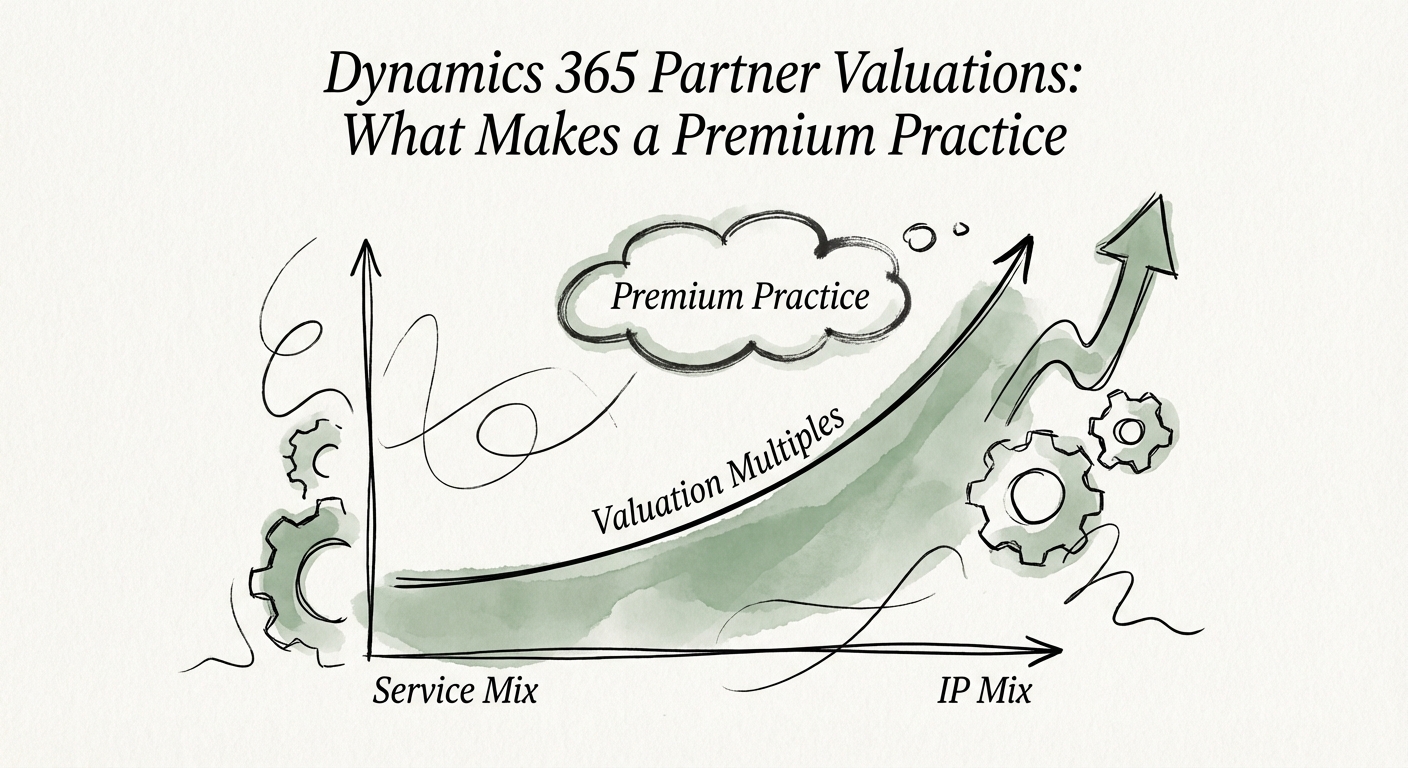
BRIEF · EXIT READINESS
Dynamics 365 Partner Valuations: The Gap Between 5x and 12x
Dynamics 365 partner valuations range from 4x to 12x EBITDA. Discover the 3 specific levers that drive premium multiples for PE-backed implementation firms.
12x Premium EBITDA Multiple
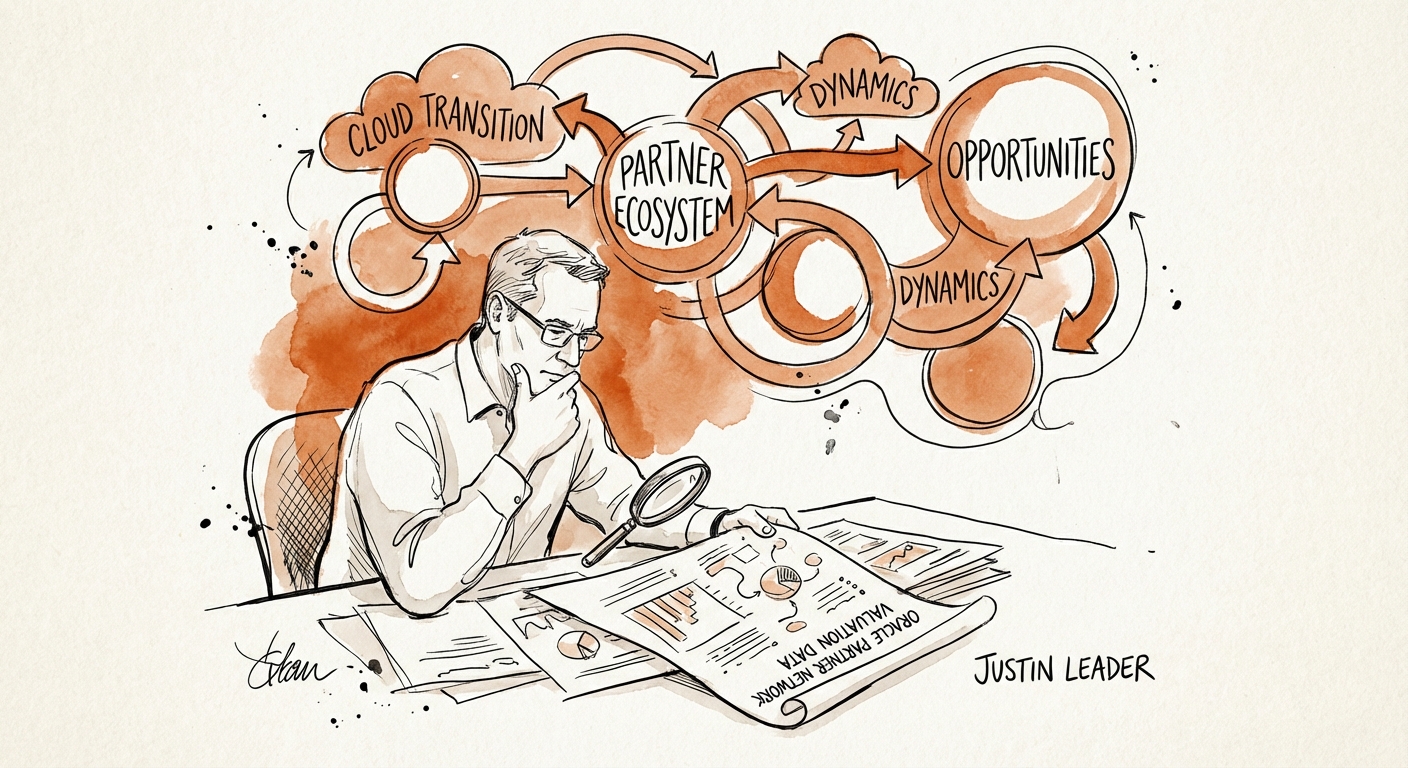
BRIEF · GTM EXECUTION
The Oracle Partner Valuation Trap: Why 'Lift and Shift' Is Killing Your Exit Multiple
Diagnostic guide for Oracle Partners: Why legacy 'Lift and Shift' models are killing valuation multiples and how to pivot to OCI consumption economics.
68% OCI Revenue Growth (Q2 FY2026)
BRIEF · EXIT READINESS
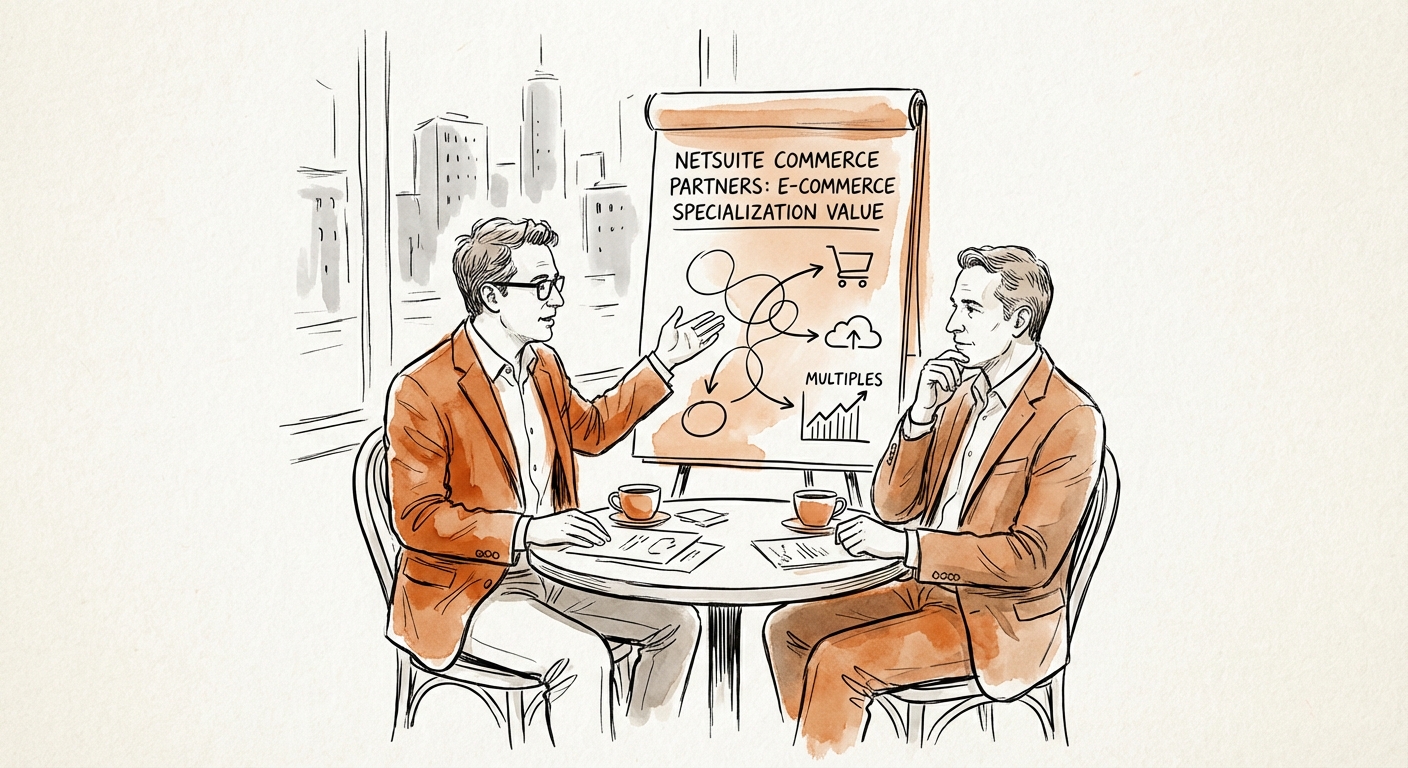
The Specialization Premium: Why 'Generalist' NetSuite Partners Leave 50% of Exit Value on the Table
Generalist NetSuite partners trade at 5x EBITDA. Commerce specialists trade at 10x. Here is the diagnostic framework to bridge the gap before you exit.
3.4x Higher Referral Conversion for Specialists
BRIEF · EXIT READINESS
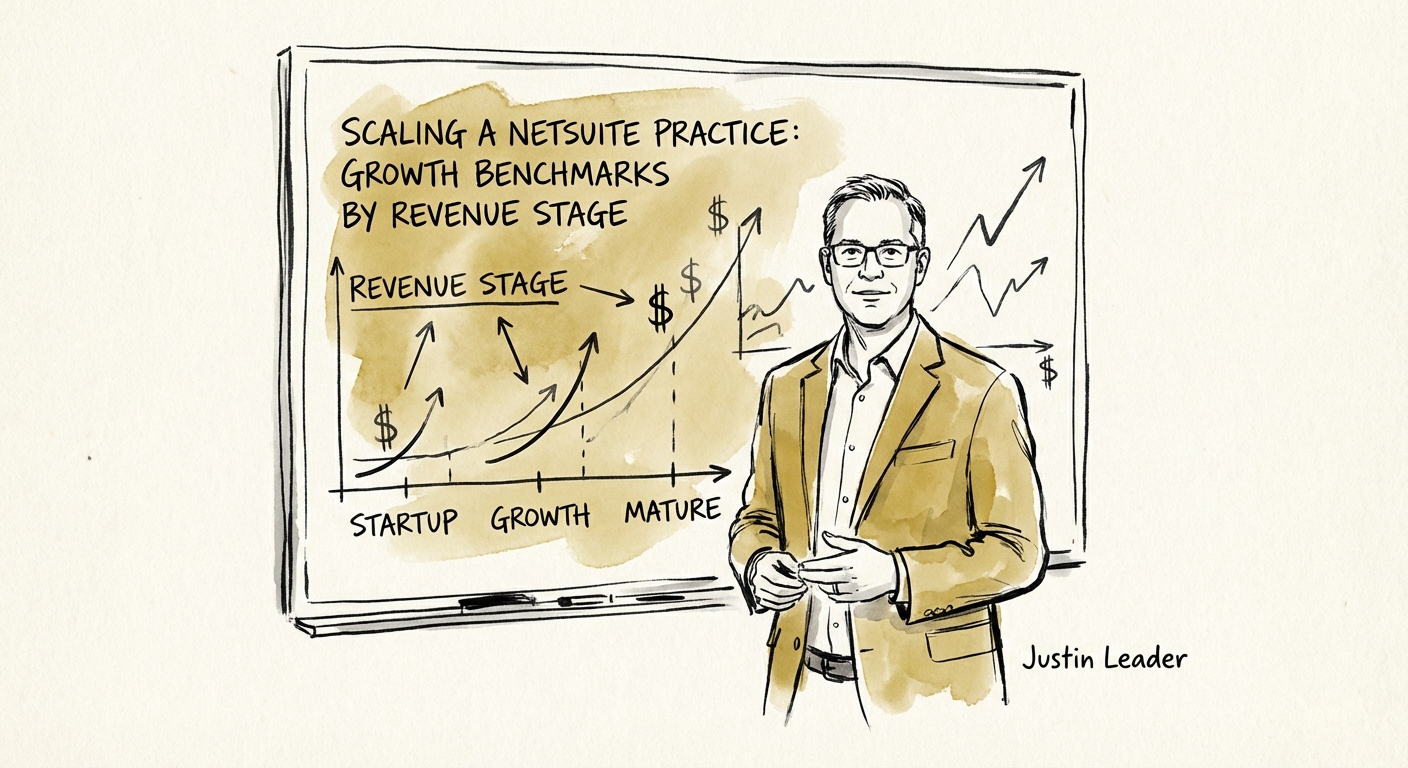
Why NetSuite Partners Stall at $10M (and the Revenue Mix That Breaks Them Out)
Why most NetSuite implementation partners flatten near $10M, the utilization and EBITDA numbers that signal the stall, and the SuiteApp-plus-managed-services mix buyers actually pay up for.
18% YoY NetSuite Ecosystem Growth (Q4 '25)
BRIEF · REVENUE ARCHITECTURE
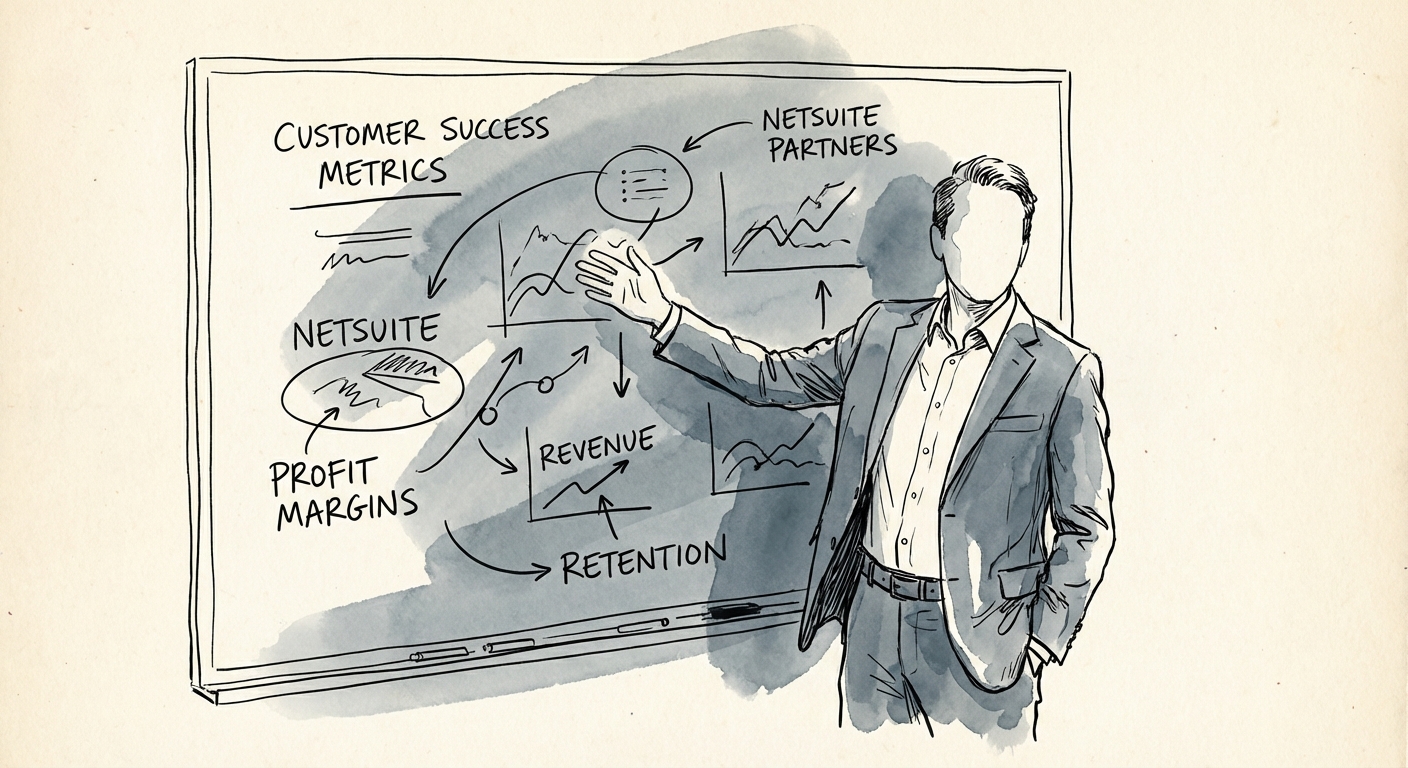
Your NetSuite Practice Sells Go-Lives. Acquirers Buy Month 13.
CSAT and on-time delivery don't move a NetSuite partner's multiple. The three metrics that do: Managed Services NRR, SuiteApp attach, and effective rate.
110% Target NRR for Managed Services
BRIEF · EXIT READINESS
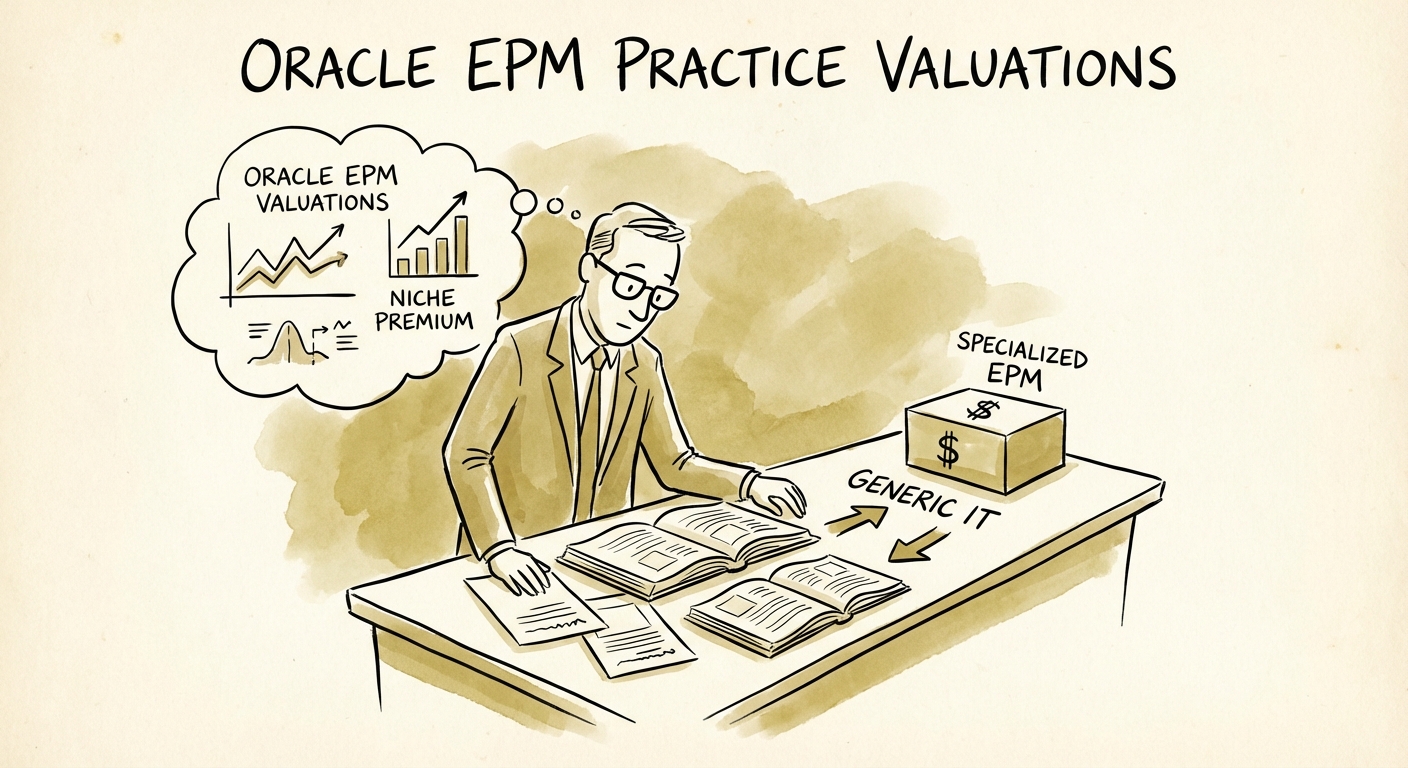
Oracle EPM Practice Valuations: The Niche Expertise Premium
Why Oracle EPM practices trade at 12x+ EBITDA while generic IT services stall at 6x. Benchmarks, valuation drivers, and the specialization premium explained.
13.6x Median EBITDA Multiple for Specialized IT Consulting (2025)
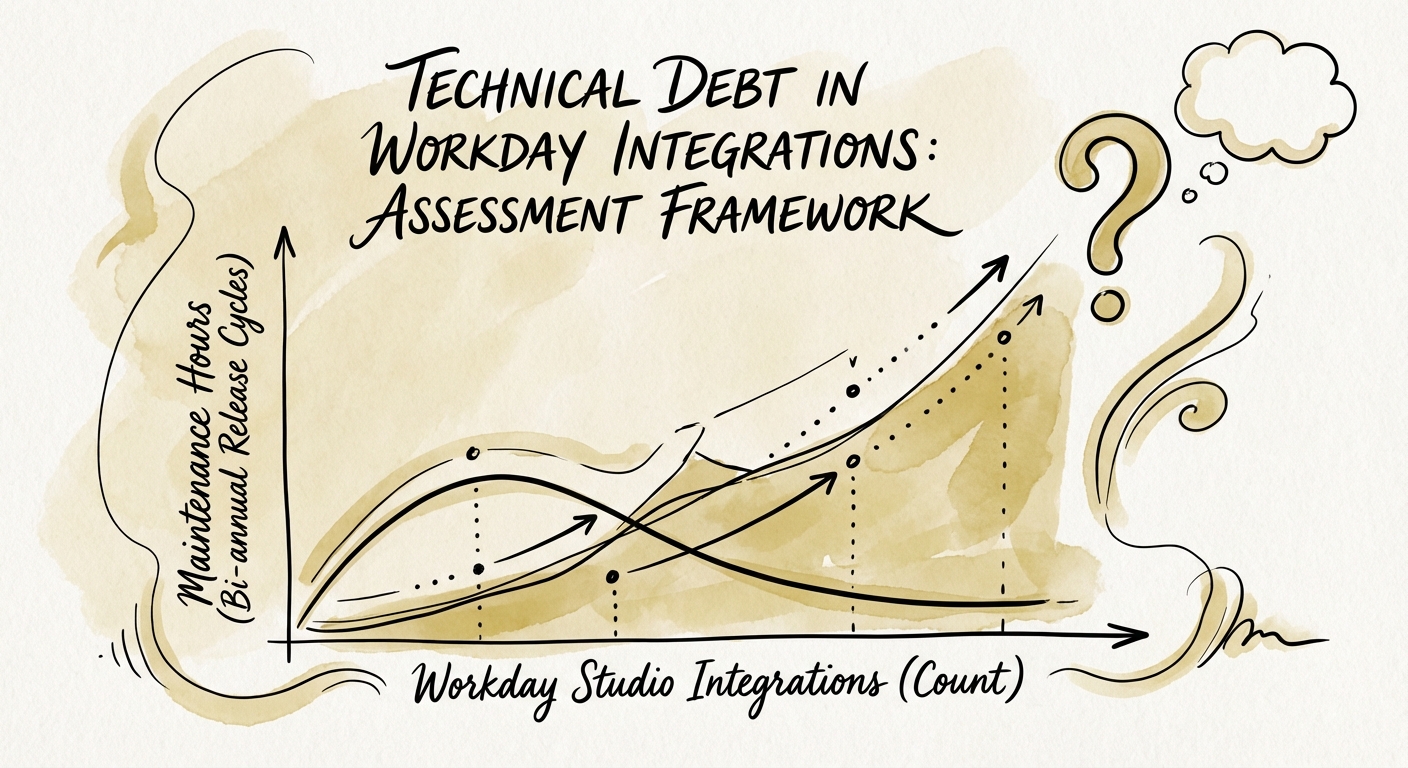
BRIEF · TECHNICAL DEBT
Workday Integration Debt: The Hidden CapEx Trap in Tech-Enabled Services Deals
A technical due diligence framework for assessing Workday integration debt in M&A. Learn how to quantify liabilities, spot 'Studio' red flags, and protect EBITDA.
150-200% Cost multiplier to remediate failed ERP integrations vs. initial build
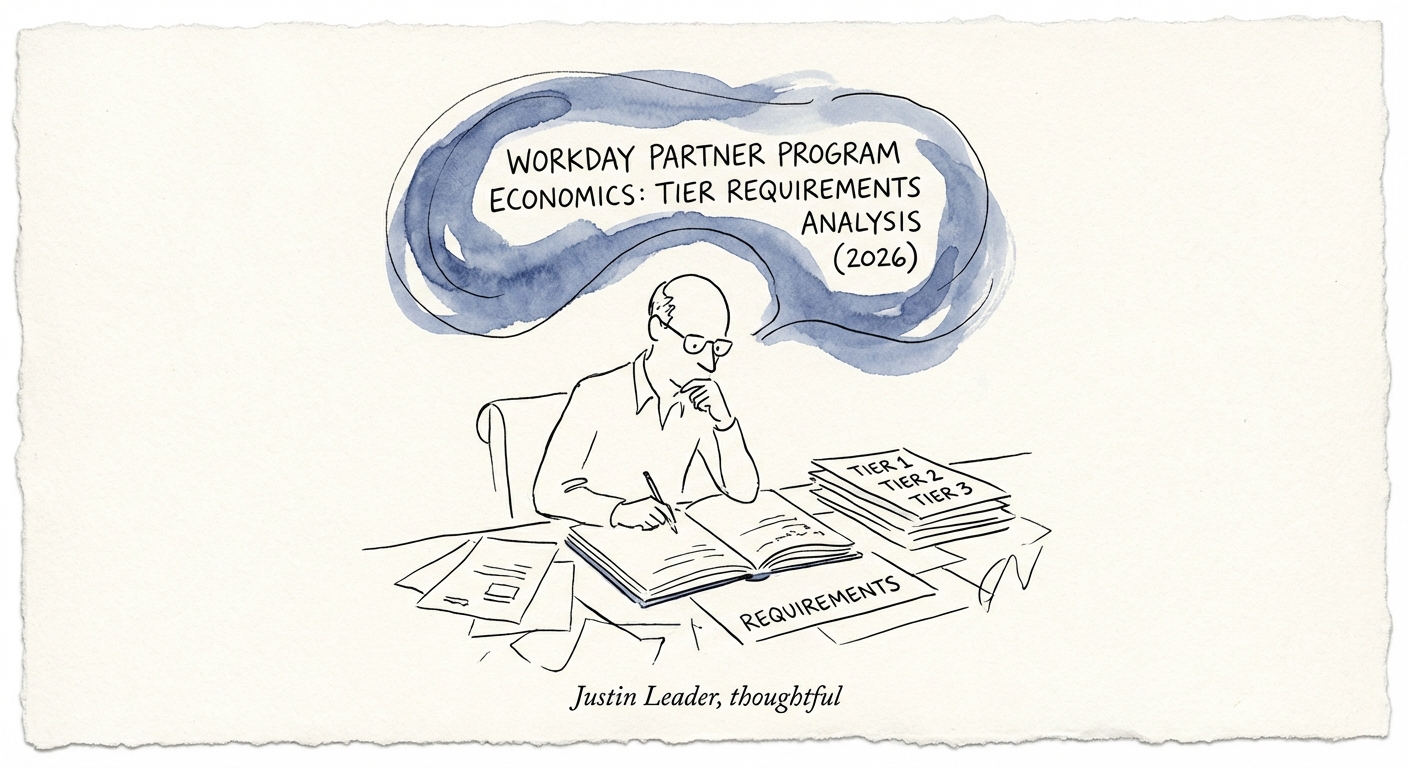
BRIEF · UNIT ECONOMICS
Workday Partner Program Economics: Tier Requirements Analysis
A diagnostic guide for services founders on Workday partner economics. Analysis of tier requirements, certification costs, and the 2026 'bifurcation' of the ecosystem.
400+ Global Service Partners (Exploded from <50)
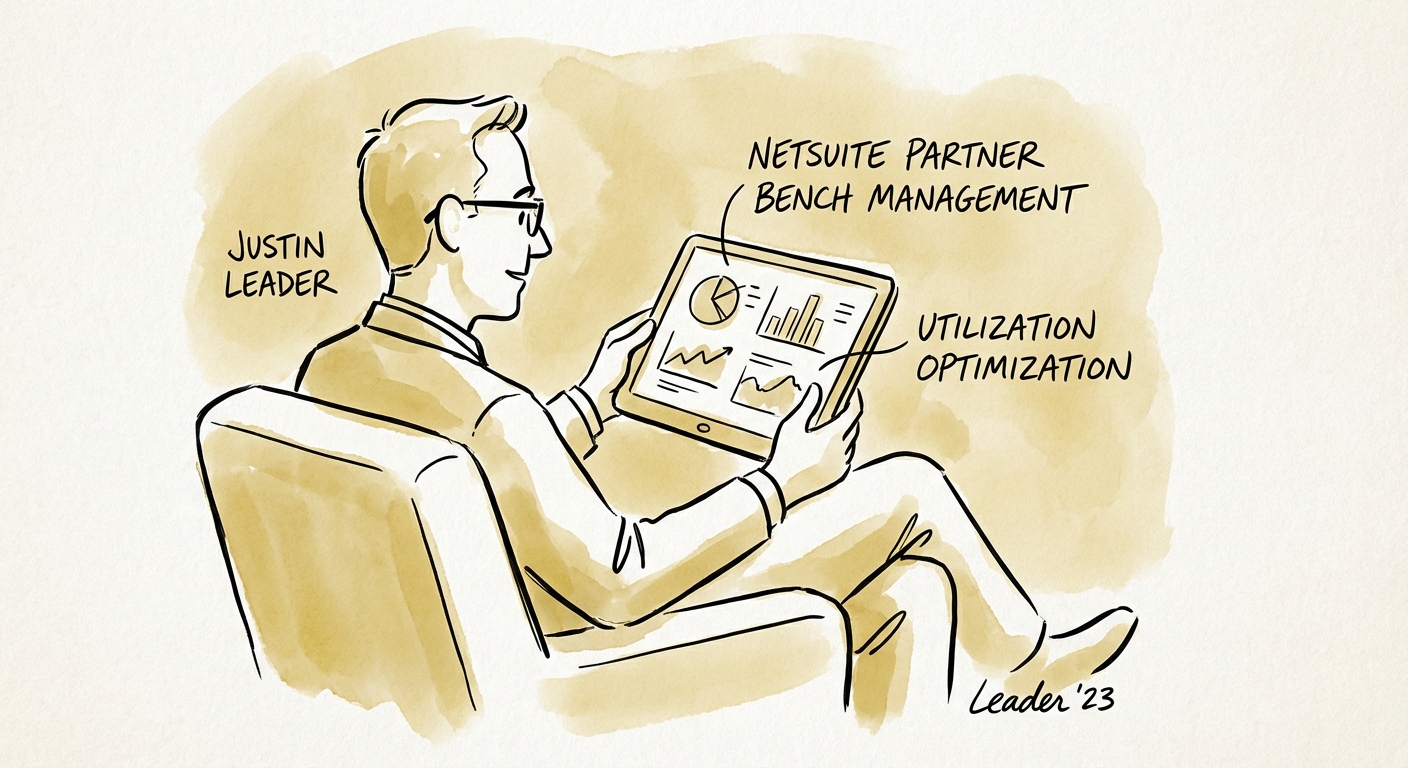
BRIEF · UNIT ECONOMICS
NetSuite Partner Bench Management: The 68.9% Utilization Trap
Why the 2025 drop in billable utilization to 68.9% is killing NetSuite partner margins. A diagnostic guide to fixing bench management and restoring 25%+ EBITDA.
68.9% Avg Billable Utilization (2025)
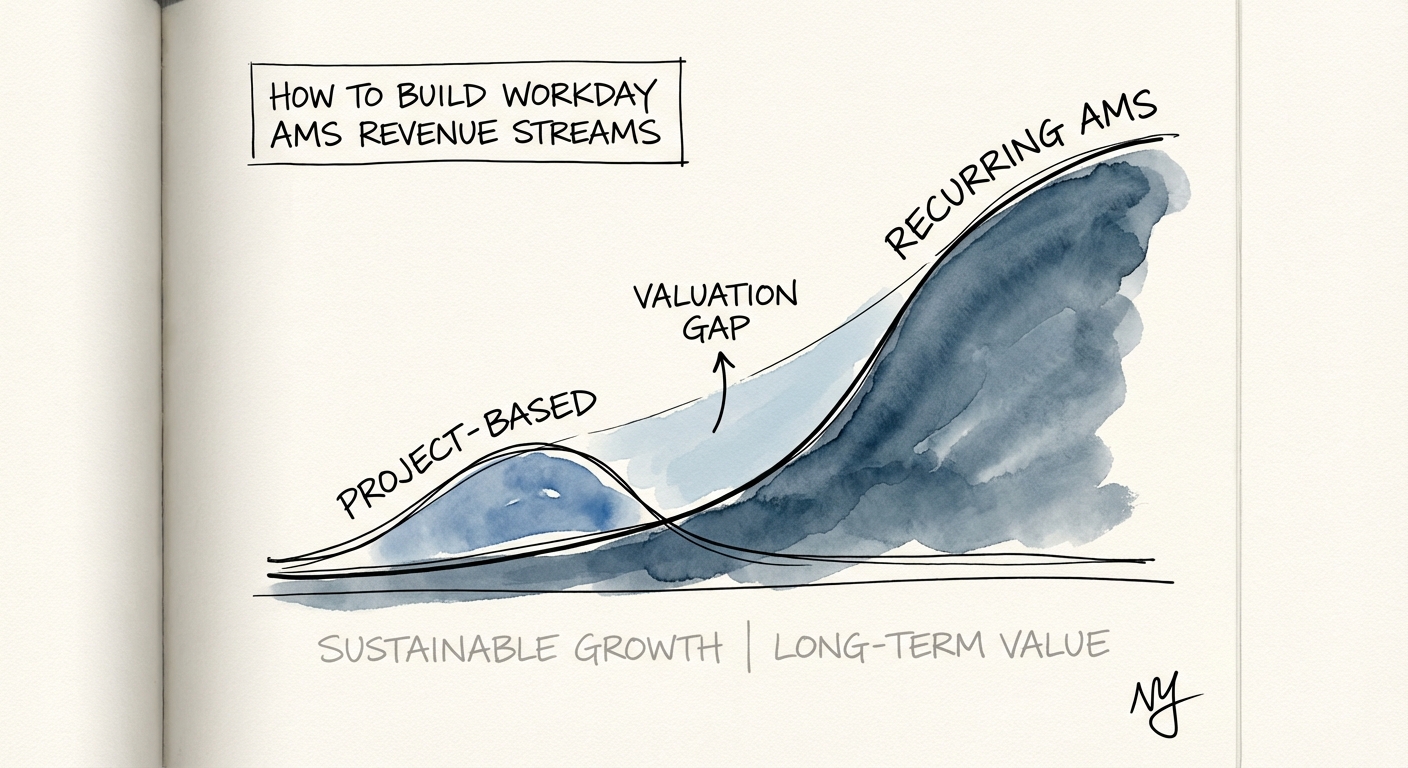
BRIEF · REVENUE ARCHITECTURE
The Workday AMS Playbook: Turn One-Time Implementations Into 3x Recurring Revenue
Workday partners: your project revenue trades at 1x, recurring AMS at 3x. Here's how to build the attach motion and pod structure that doubles your exit.
3x Valuation Multiplier vs. Project Revenue
BRIEF · EXIT READINESS
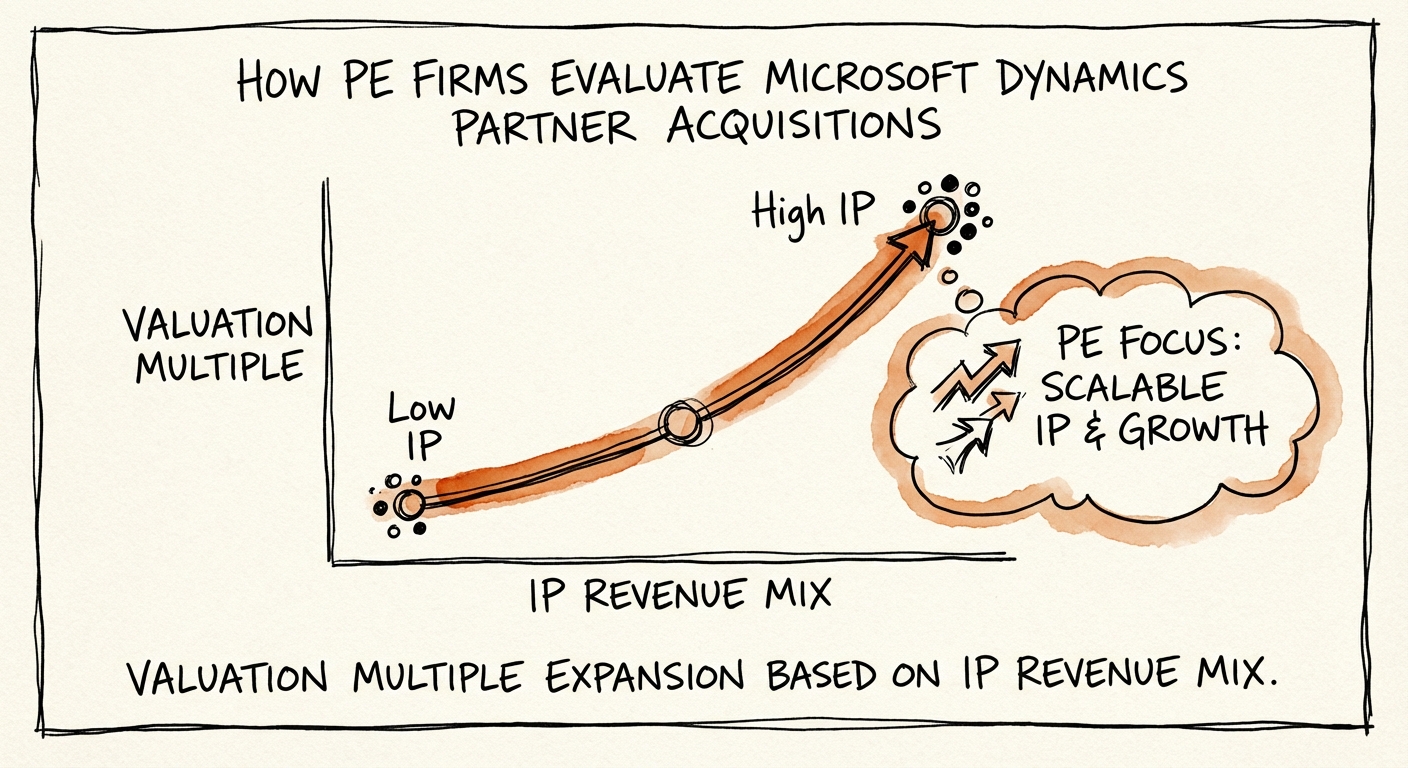
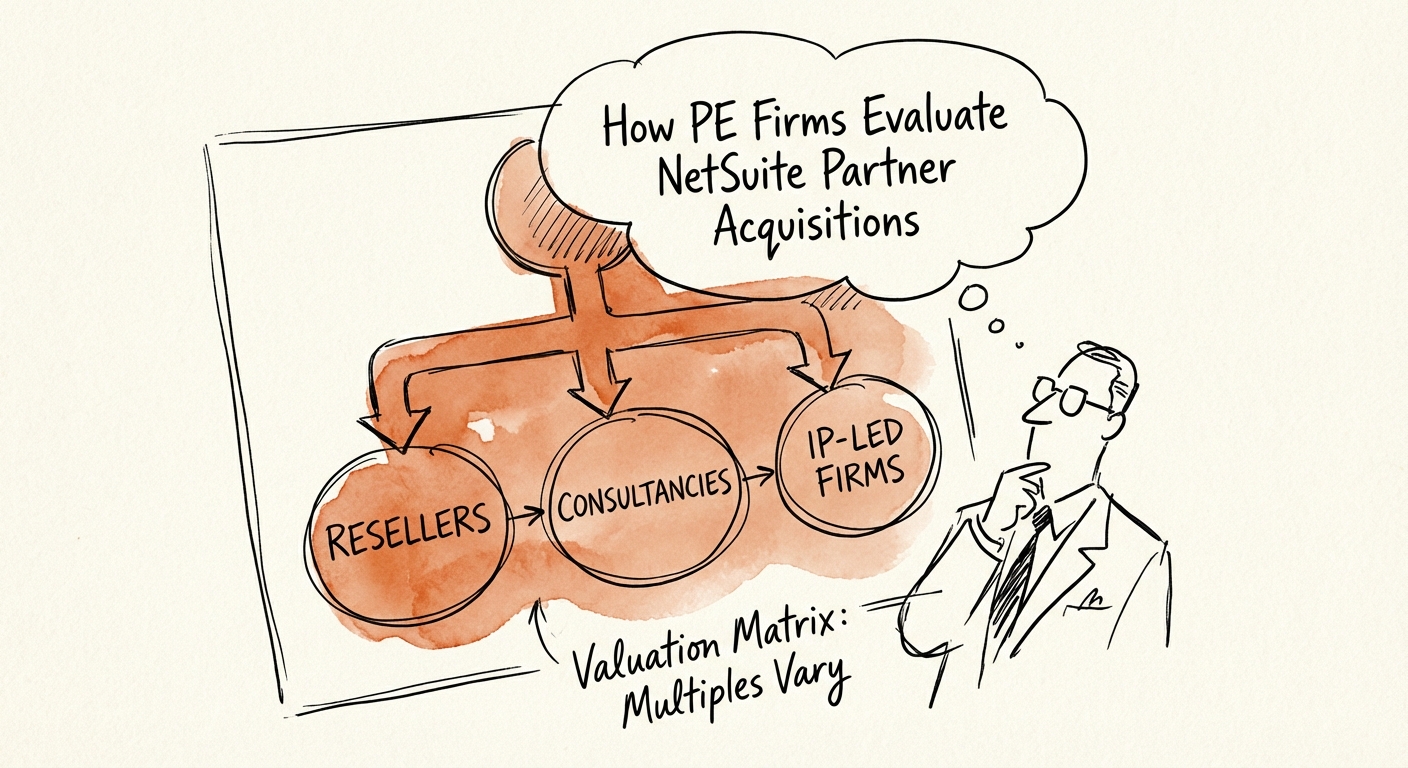
How PE Firms Evaluate NetSuite Partner Acquisitions: The 2026 Diagnostic
A private equity operator's guide to evaluating NetSuite Solution Providers and Alliance Partners. Valuation multiples, due diligence KPIs, and red flags for 2026.
8x-12x EBITDA Multiple for IP-Led Partners
BRIEF · PROJECT RECOVERY
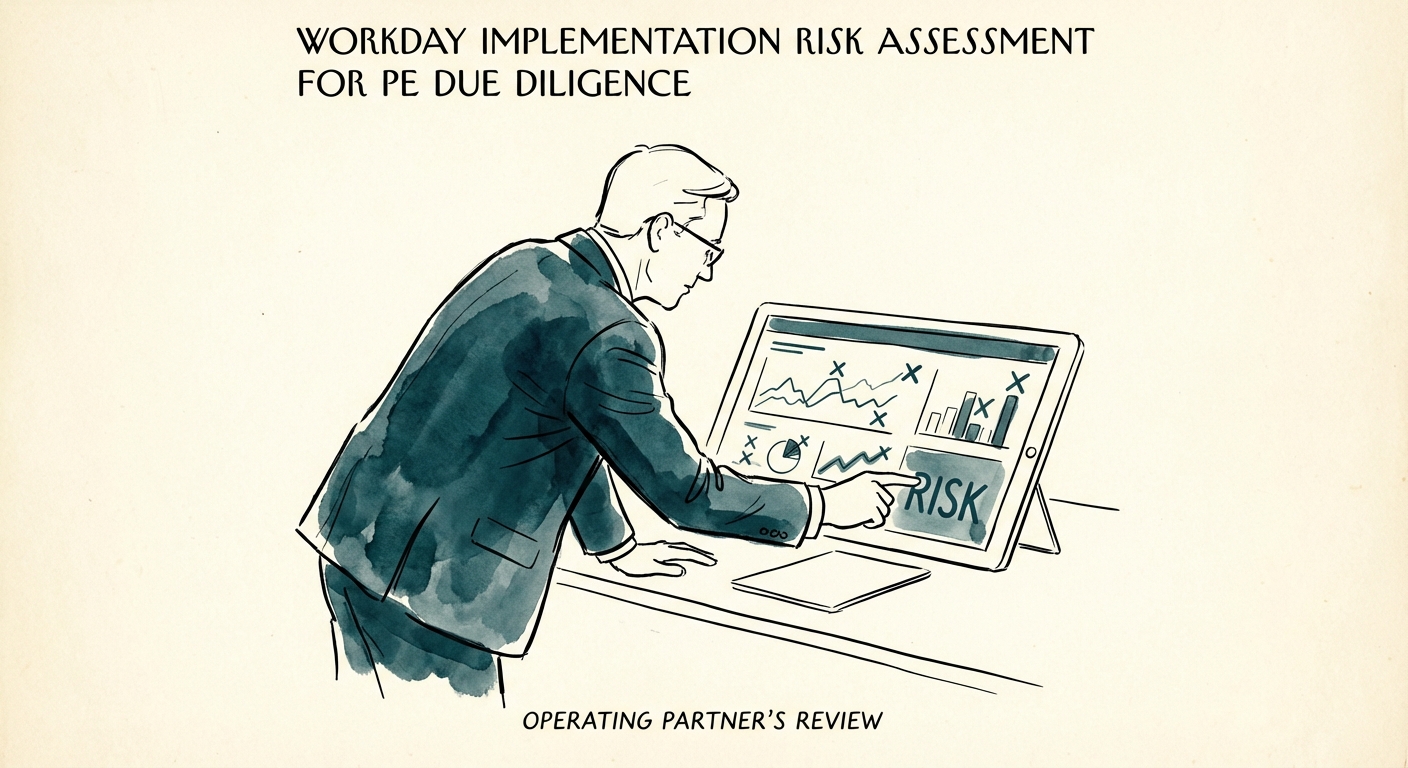
The Workday Trap: Why Your Portfolio Company's "Green" Implementation is Actually Red
Why 70% of Workday implementations fail to meet PE investment thesis goals. A diagnostic framework for Operating Partners to assess project risk, pricing adjustments, and timeline delays during due diligence.
45% Avg. Budget Overrun
BRIEF · EXIT READINESS
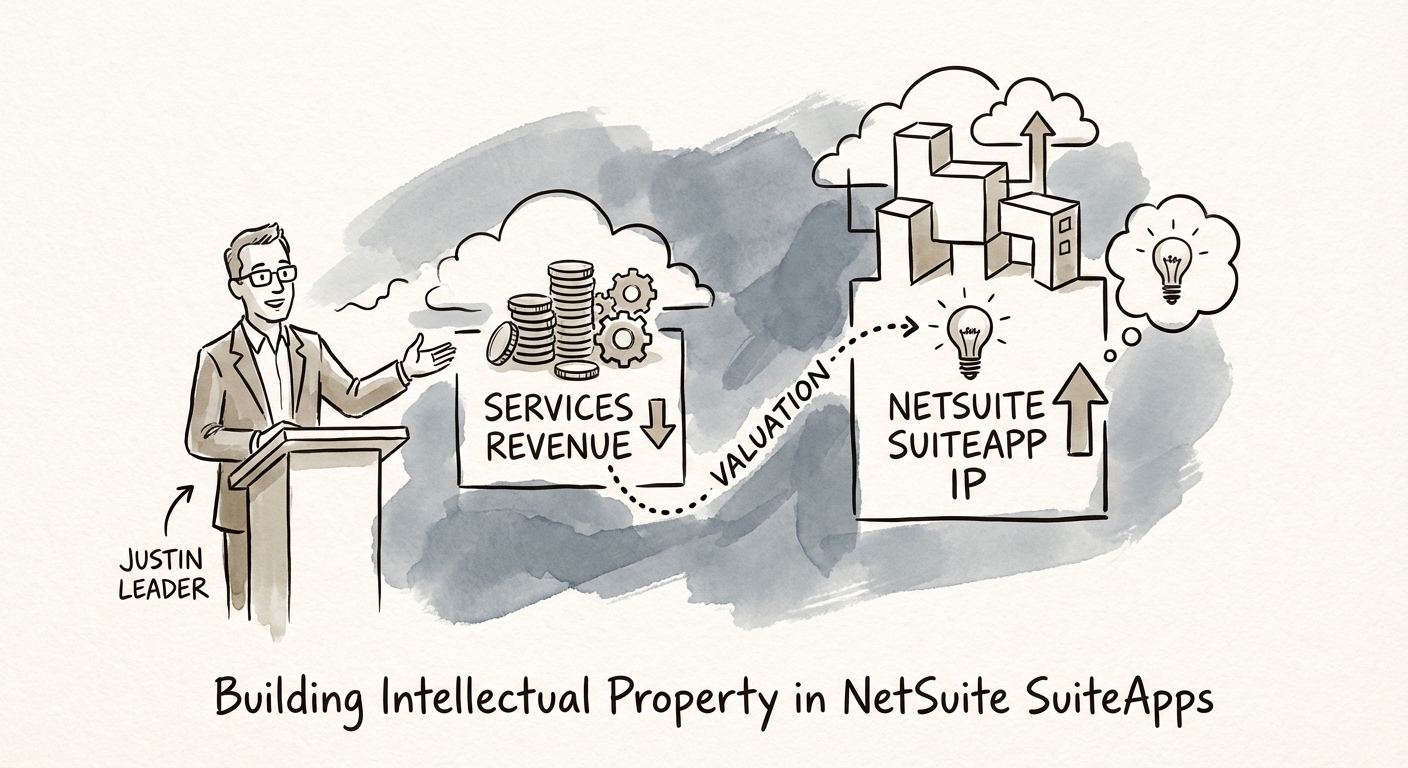
The SuiteApp Multiplier: Transforming NetSuite Customizations into 8x Revenue IP
Turn one-off NetSuite customizations into 8x revenue Intellectual Property. A diagnostic guide for Service Founders looking to capture the SaaS multiple arbitrage.
8x Valuation Multiple (IP vs. Services)
BRIEF · TEAM & HIRING
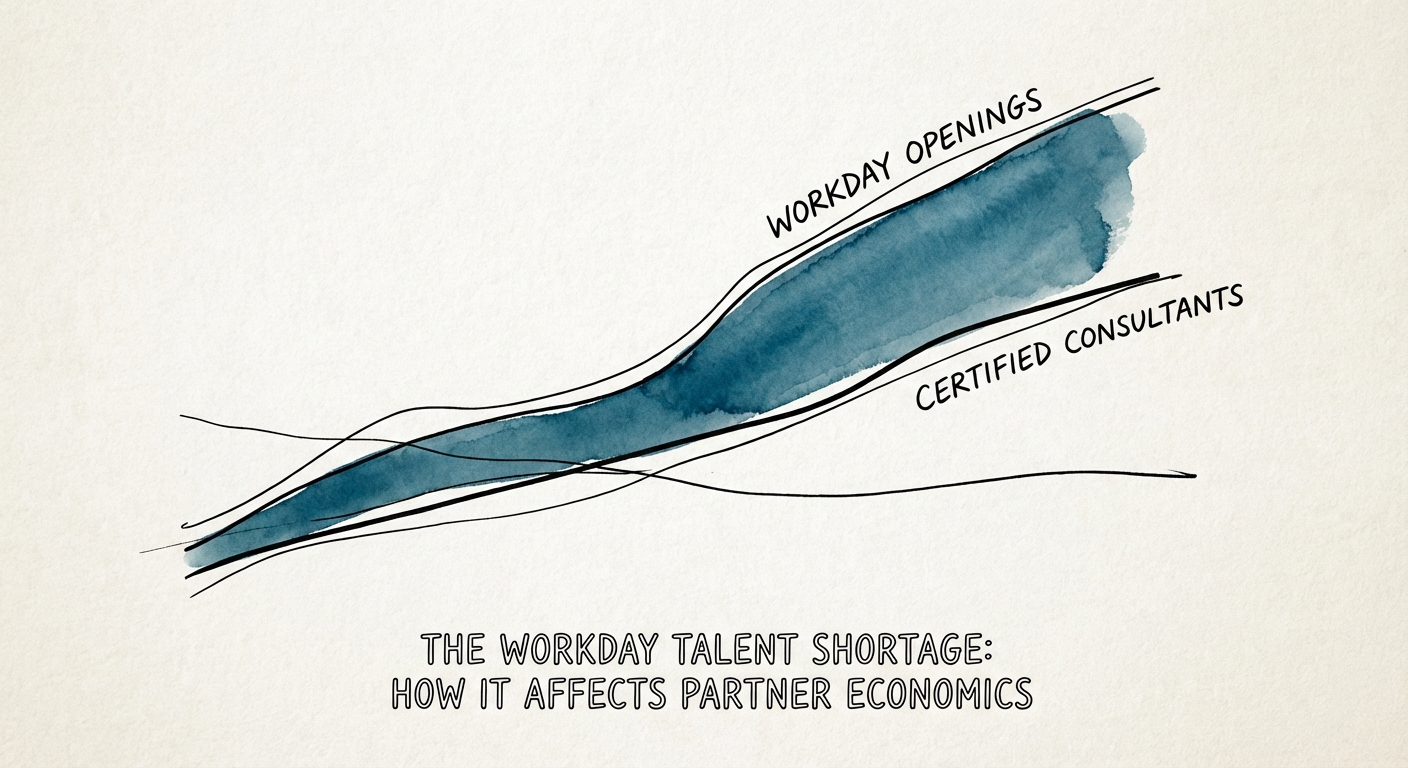
The Workday Talent Shortage: Why Rising Labor Costs Are Killing Your Partner Margins
The Workday talent shortage is eroding partner margins. Learn how rising labor costs and the contractor-driven labor market impact your EBITDA, and how to fix it.
1:1 Ratio of Open Jobs to Certified Consultants