BRIEF · UNIT ECONOMICS
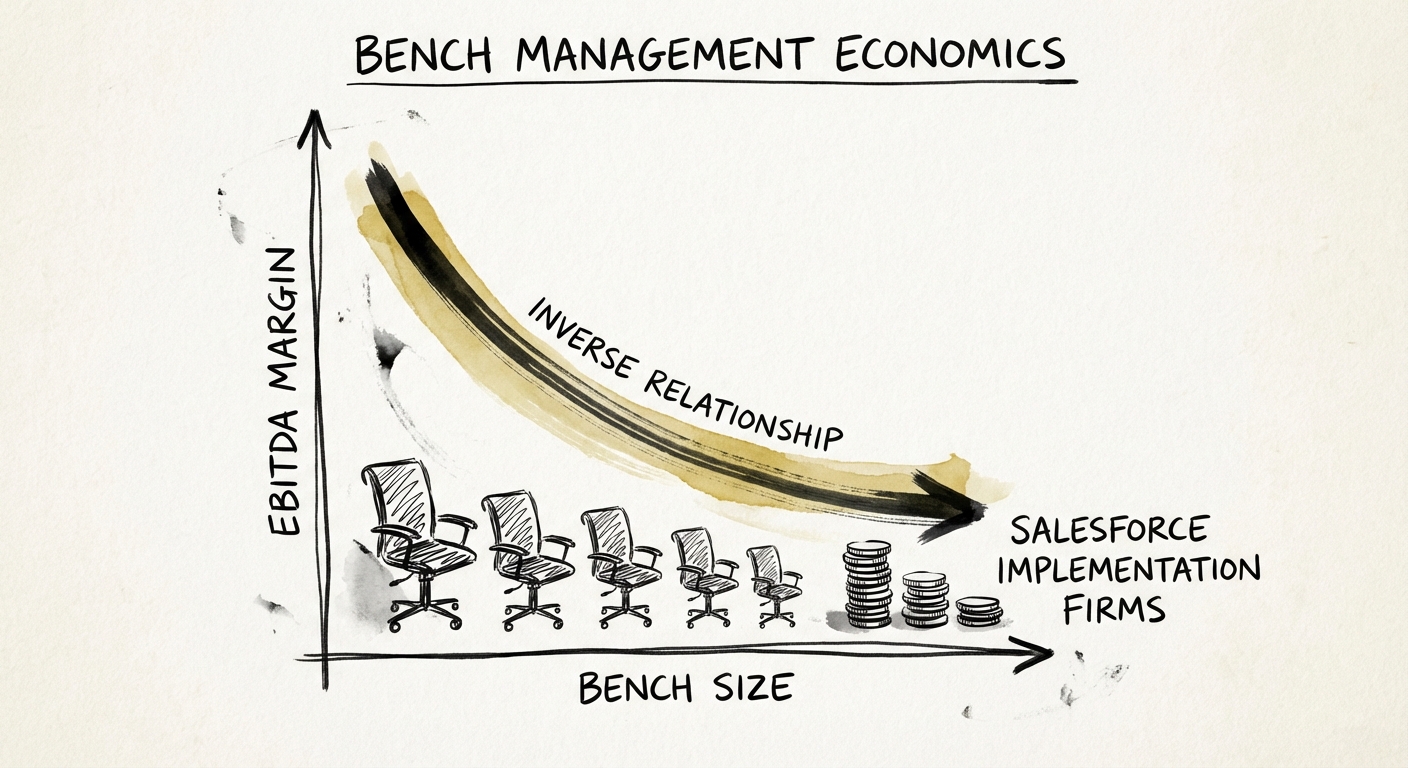
The 'Growth Bench' Fallacy: Why Your 15% Talent Buffer Is Killing Your Valuation
Your 'growth bench' is costing you a 15% EBITDA haircut. Learn the unit economics of bench management, optimal utilization targets for Salesforce partners, and how to build a Just-in-Time talent supply chain.
78% Optimal Billable Utilization
BRIEF · UNIT ECONOMICS
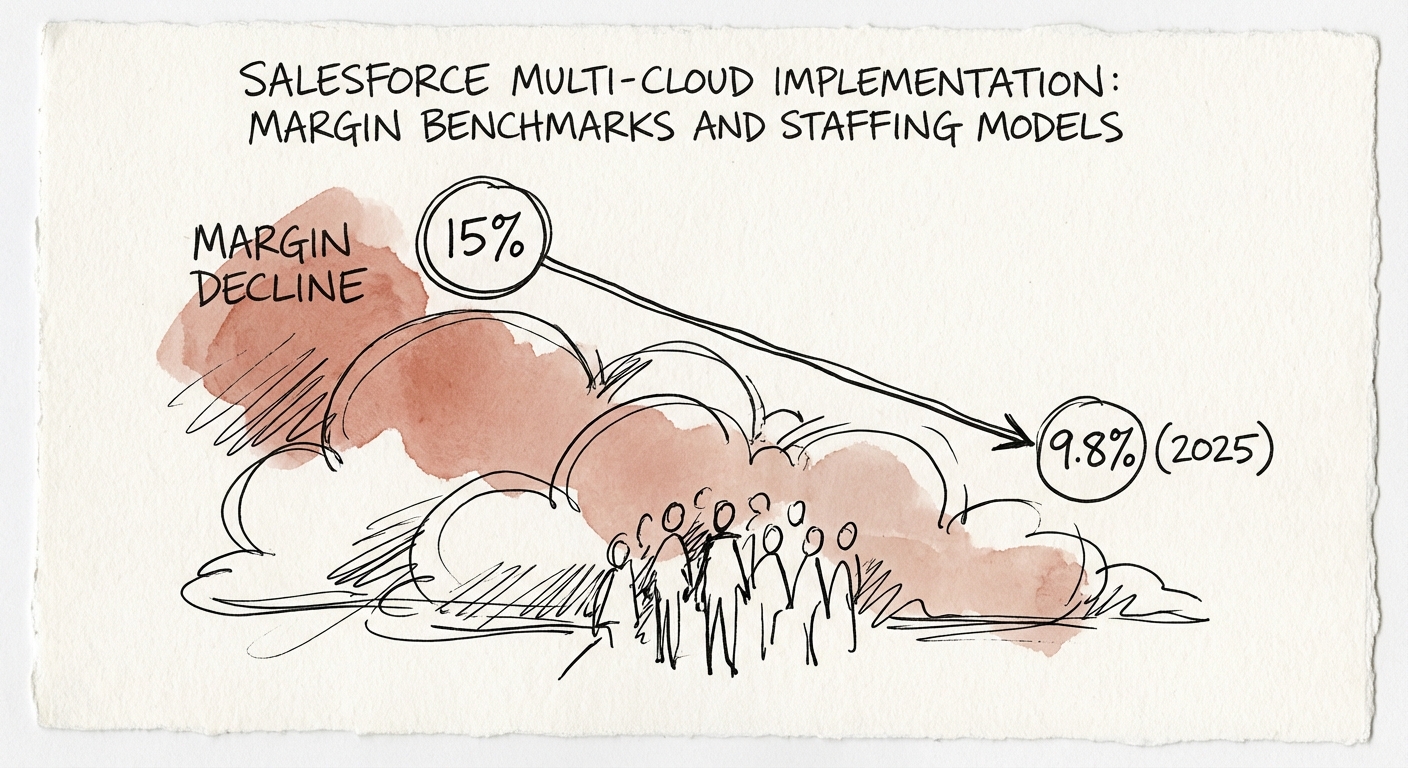
Your Salesforce Multi-Cloud Deals Tripled. Your EBITDA Just Disappeared.
Salesforce partner EBITDA fell to 9.8% in 2025 as multi-cloud deals scaled risk faster than rates. The staffing-pyramid fix for $10M-$50M practices.
9.8% Avg. EBITDA Margin (2025)
BRIEF · EXIT READINESS
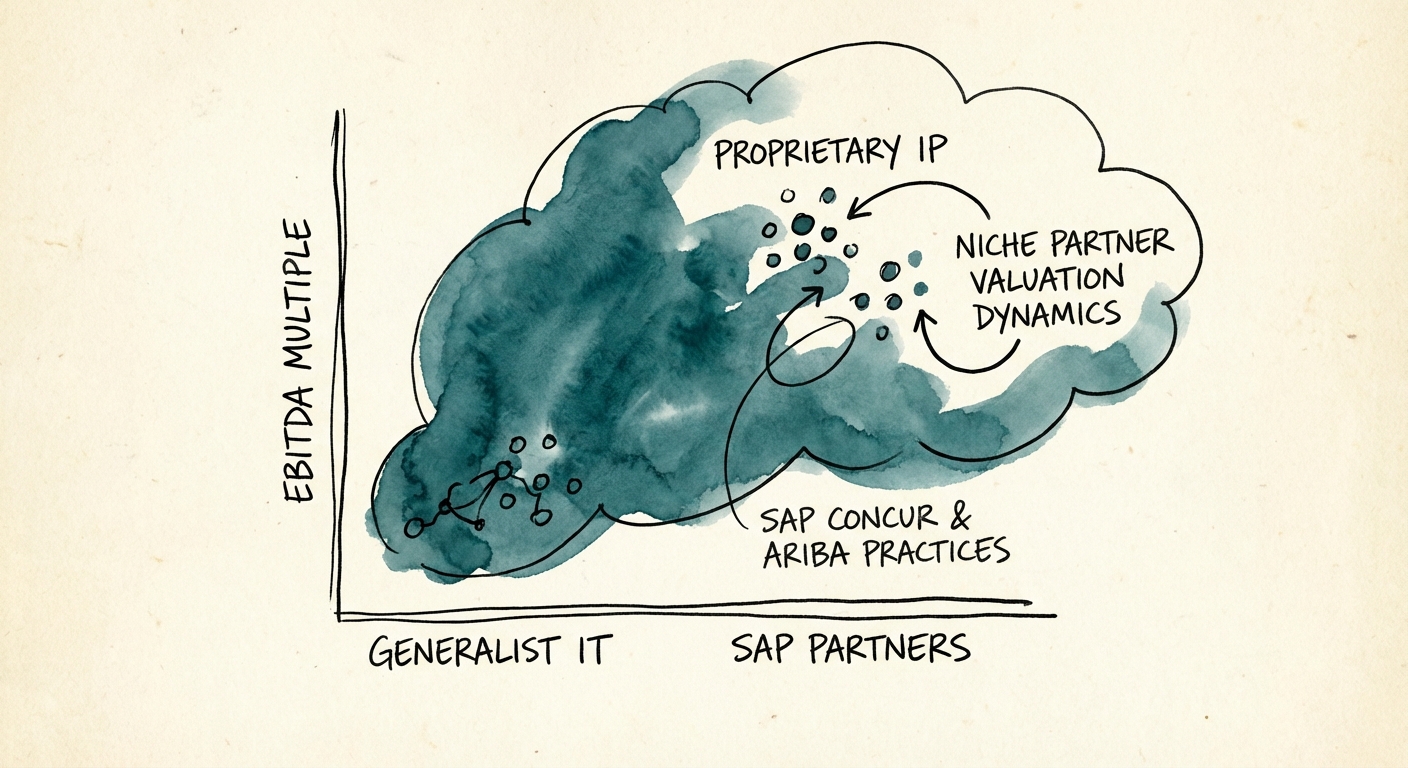
The Specialist's Dilemma: Why Your SAP Concur & Ariba Practice Is Worth 6x... or 12x
For SAP Concur and Ariba partners, specialization alone isn't enough. Learn the valuation multiples, M&A trends, and strategic pivots that turn a 6x implementation shop into a 12x strategic asset.
13.0x Top-Quartile EBITDA Multiple
BRIEF · MIGRATION & INTEGRATION
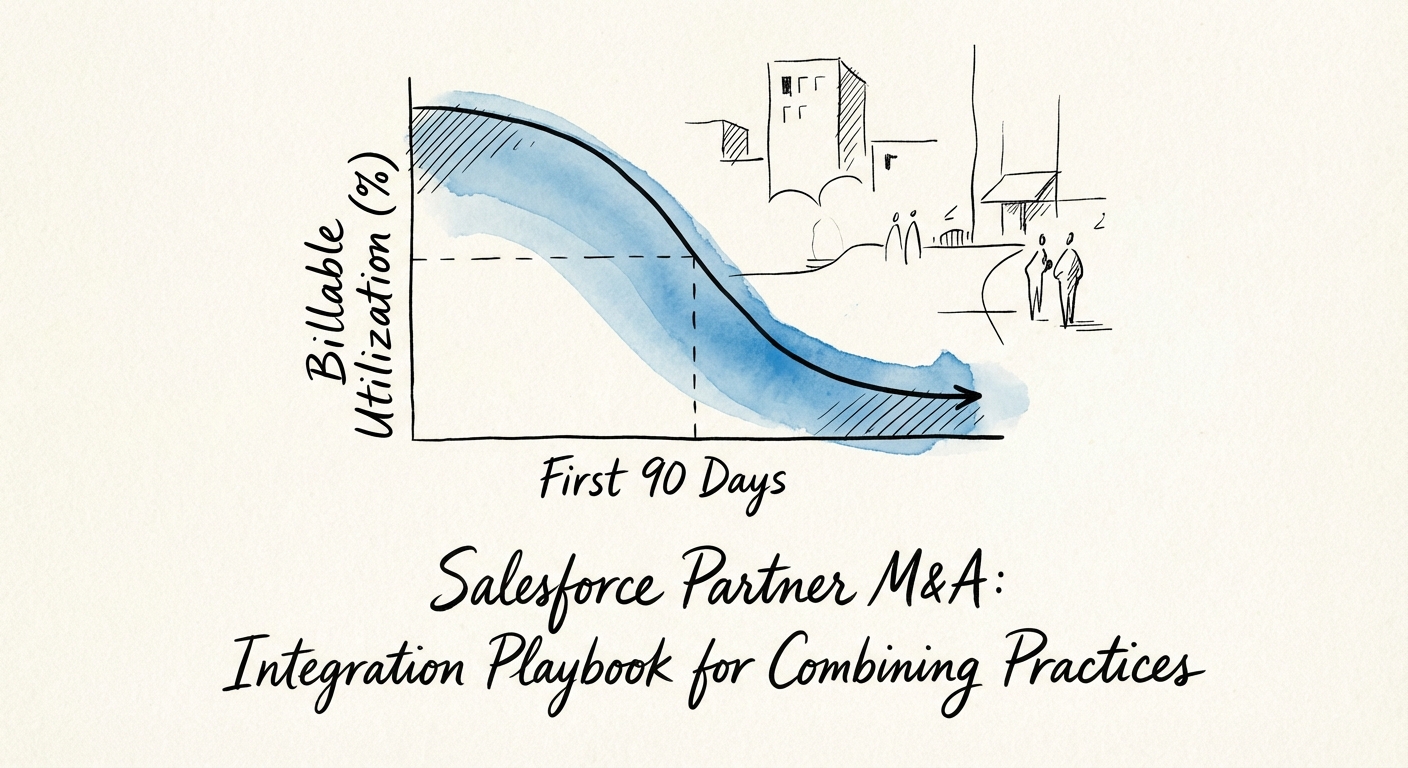
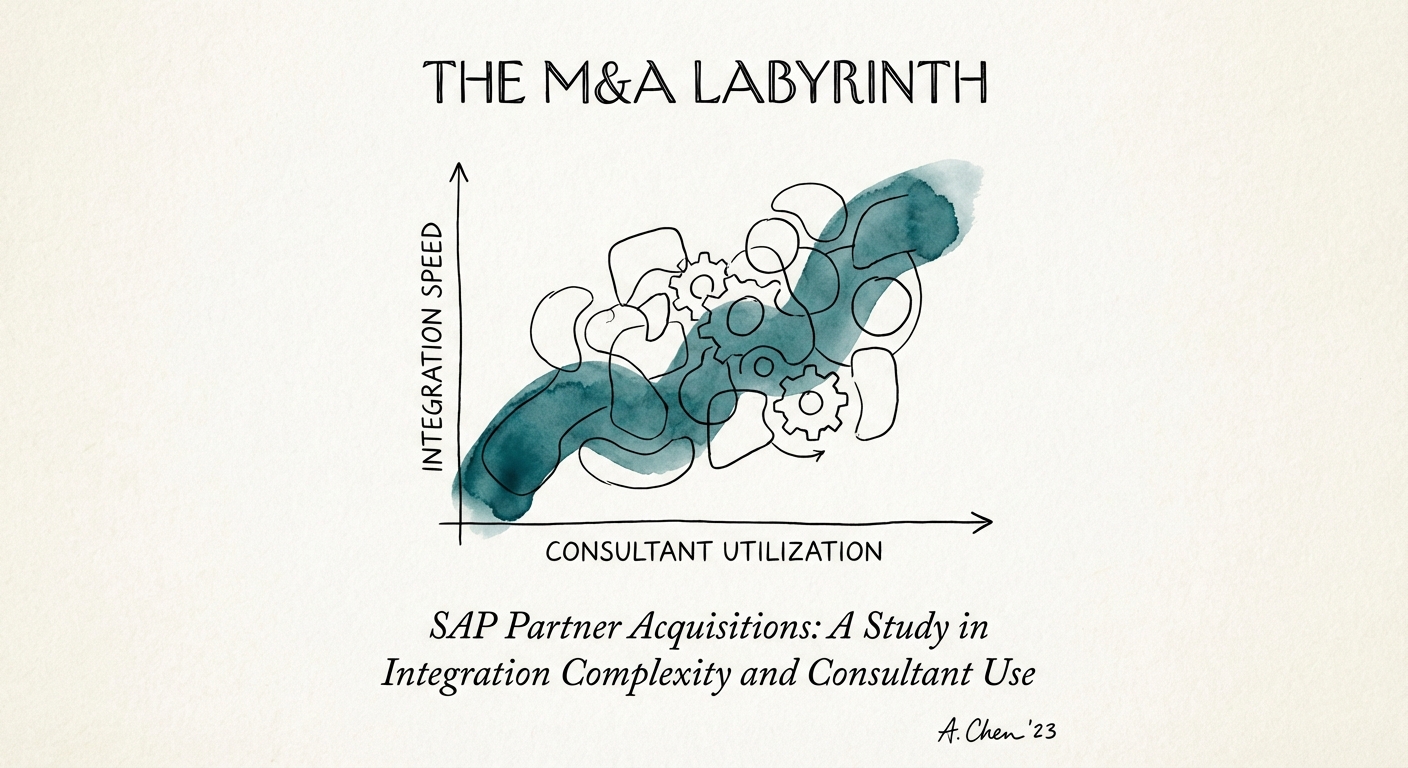
Salesforce Partner M&A: The Integration Playbook That Saves EBITDA
Why 70% of Salesforce partner acquisitions miss EBITDA targets. A diagnostic guide for PE Operating Partners on merging utilization, instances, and talent.
47% Year 1 Employee Turnover Rate Post-Merger
BRIEF · MIGRATION & INTEGRATION
You Bought an SAP Partner. Did You Just Buy a Lapsed Gold Tier?
Acquiring an SAP consultancy? Your partner tier, your margin, and your earnout all hinge on a few certified architects. Here's the diagnostic to run before you sign.
70% Integration Failure Rate
BRIEF · TECHNICAL DEBT
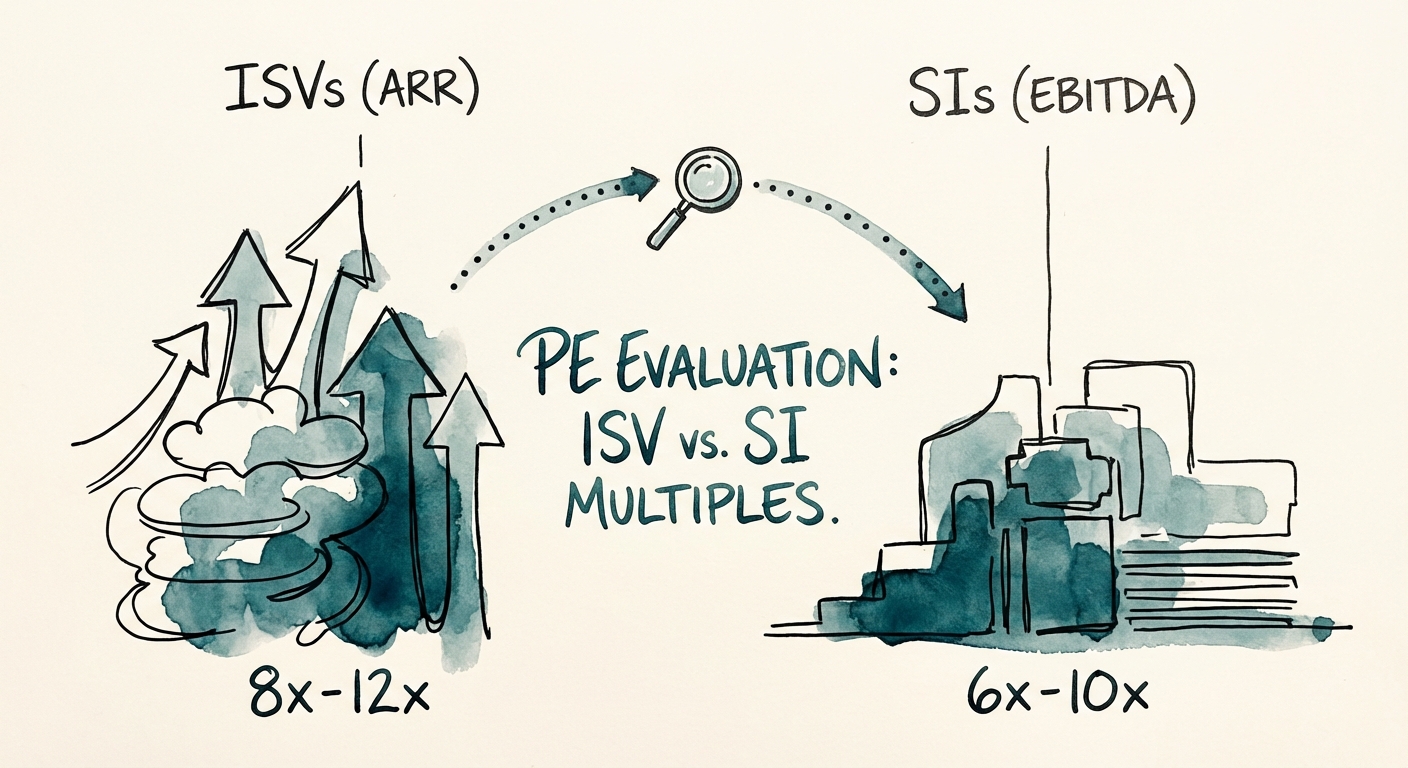
The AppExchange Arbitrage: How to Spot 'Fake ISVs' Before You Sign the LOI
Private Equity guide to evaluating Salesforce AppExchange ISVs. Valuations (8x ARR vs 6x EBITDA), technical debt red flags, and the security review trap.
50% First-Attempt Security Review Failure Rate
BRIEF · TEAM & HIRING
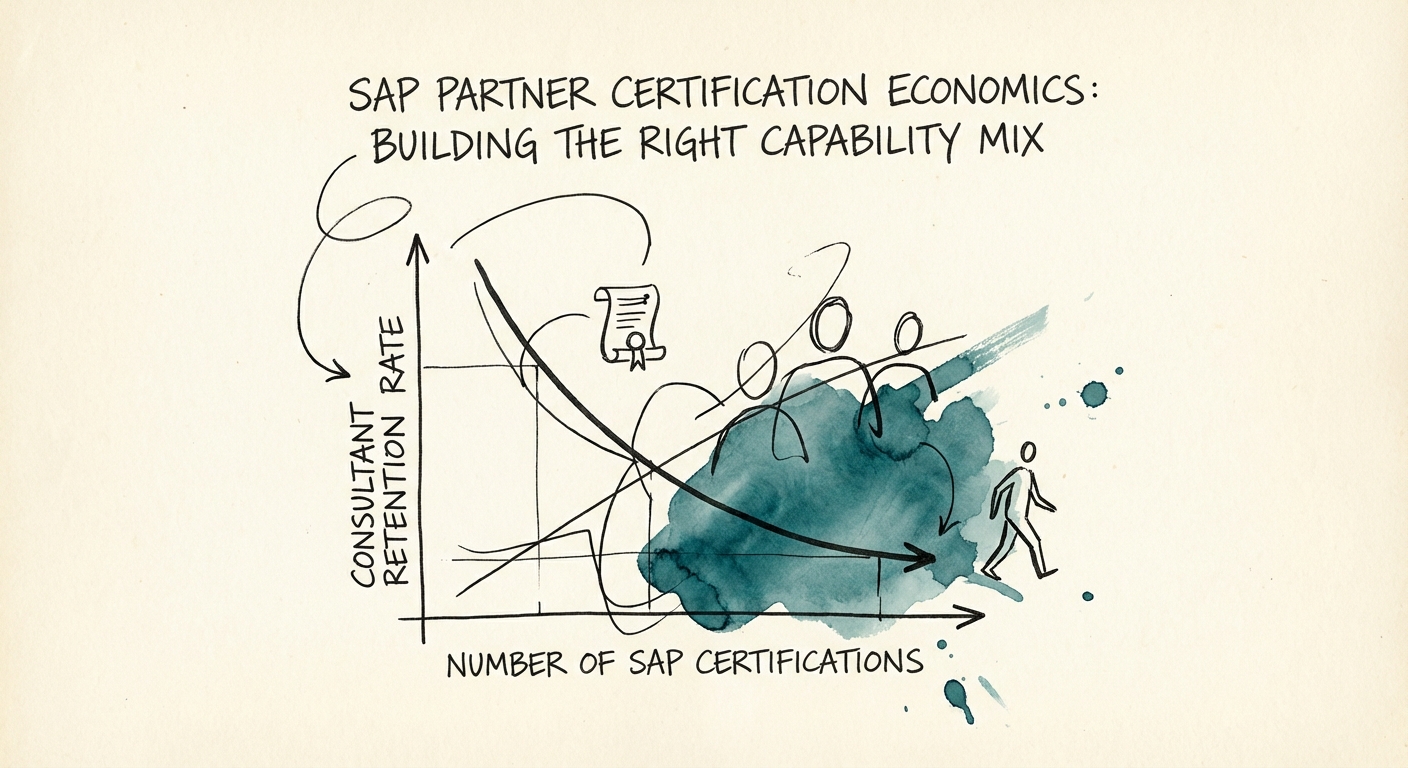
SAP Partner Certification Economics: Building the Right Capability Mix
Stop collecting 'paper tigers.' A diagnostic guide for SAP partners on balancing certification costs, consultant bill rates, and margin targets in the S/4HANA era.
31% Attrition Risk Post-Certification
BRIEF · GTM EXECUTION
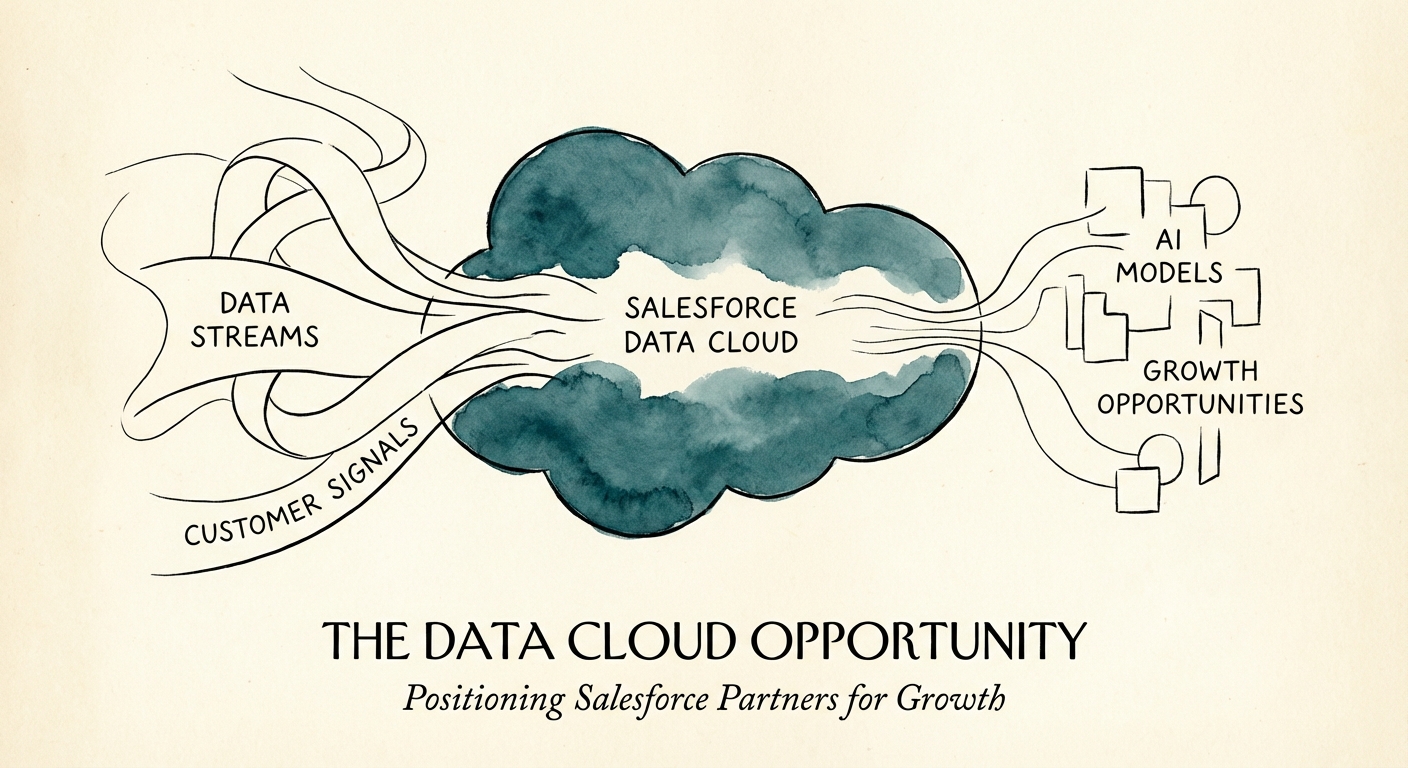
The Data Cloud Wedge: How to Pivot Your Salesforce Practice Before the 'Generalist' Market Collapses
Data Cloud is the new growth engine for Salesforce partners. Shift from low-margin implementation to high-value data strategy. Here is the playbook for founders.
120% YoY Data Cloud Growth
BRIEF · REVENUE ARCHITECTURE
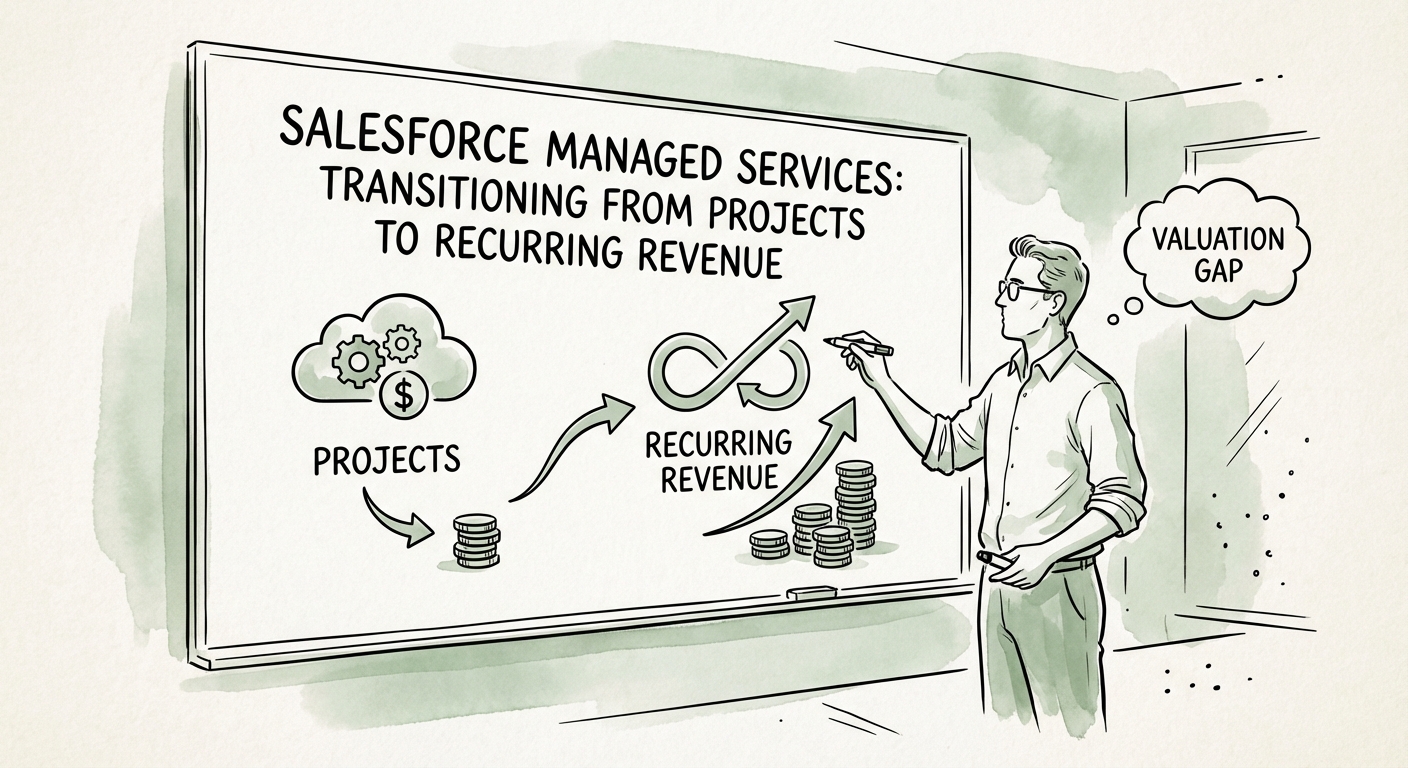
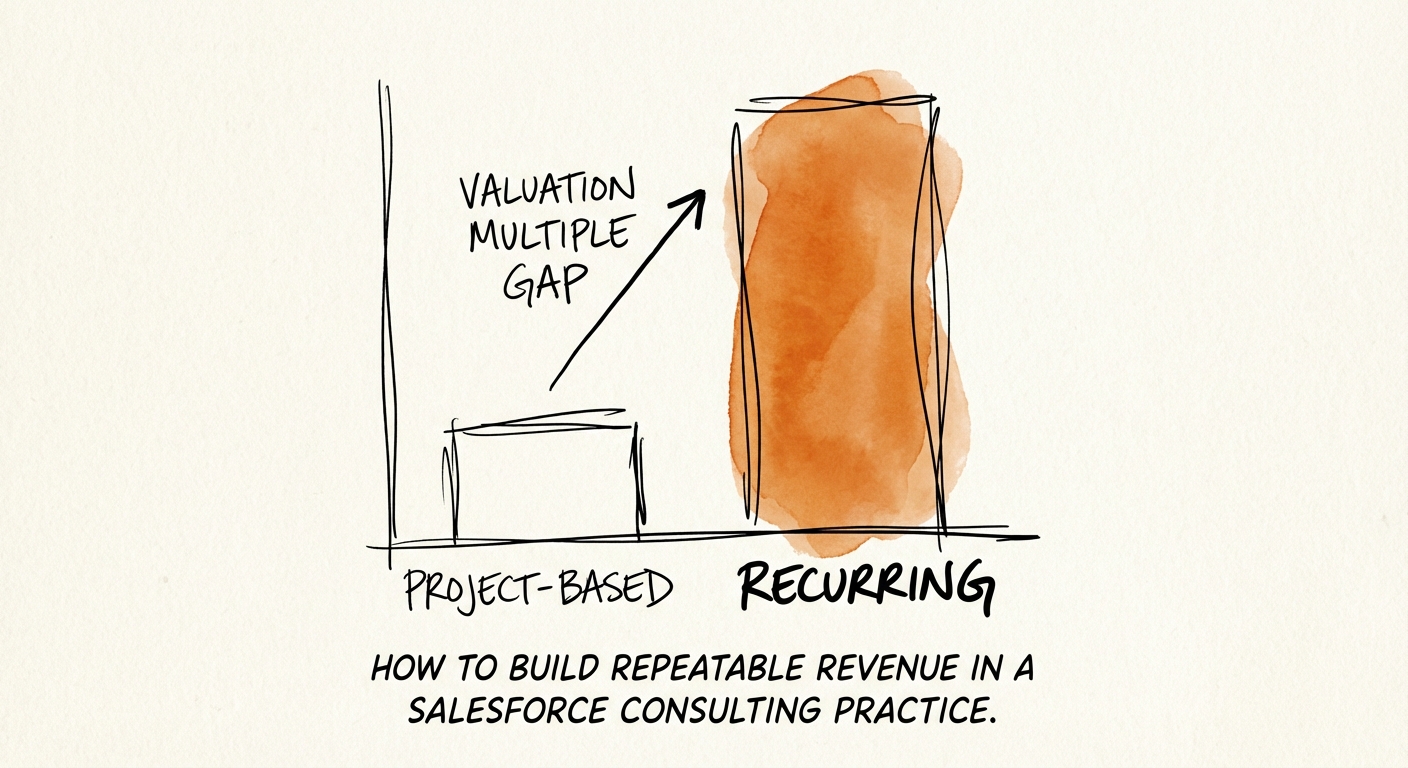
The Project Trap: Why Your Salesforce Consultancy is Worth 50% Less Than You Think
Why Salesforce partners stuck in project revenue trade at 5x EBITDA while managed services firms hit 12x. The complete diagnostic for transitioning to recurring revenue.
12x EBITDA Multiple for Recurring Revenue
BRIEF · REVENUE ARCHITECTURE
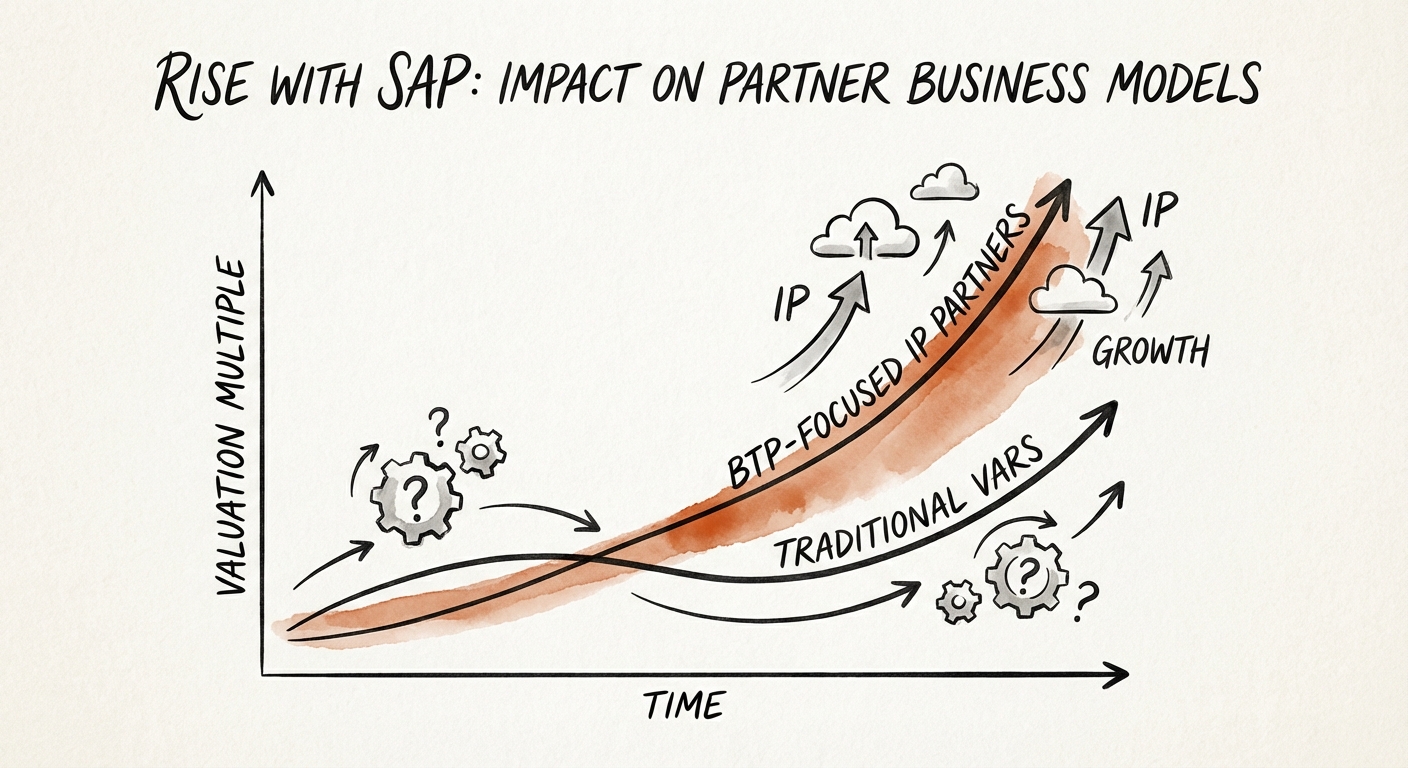
RISE with SAP: The 'Death of the Reseller' and the $12M Valuation Pivot
The RISE with SAP era has killed the traditional VAR model. Here is the diagnostic for SAP partners to pivot from 5x services valuation to 12x IP valuation in 2026.
12x Valuation Multiple (IP vs. Services)
BRIEF · REVENUE ARCHITECTURE
Why Your $20M Salesforce Practice Sells for 6x and the One Next Door Sells for 11x
Two Salesforce SI firms, same $20M revenue, $30M gap in enterprise value. Here is exactly how the recurring-revenue one got built, and the 90-day path to it.
12x Potential EBITDA Multiple for Recurring Revenue
BRIEF · REVENUE ARCHITECTURE
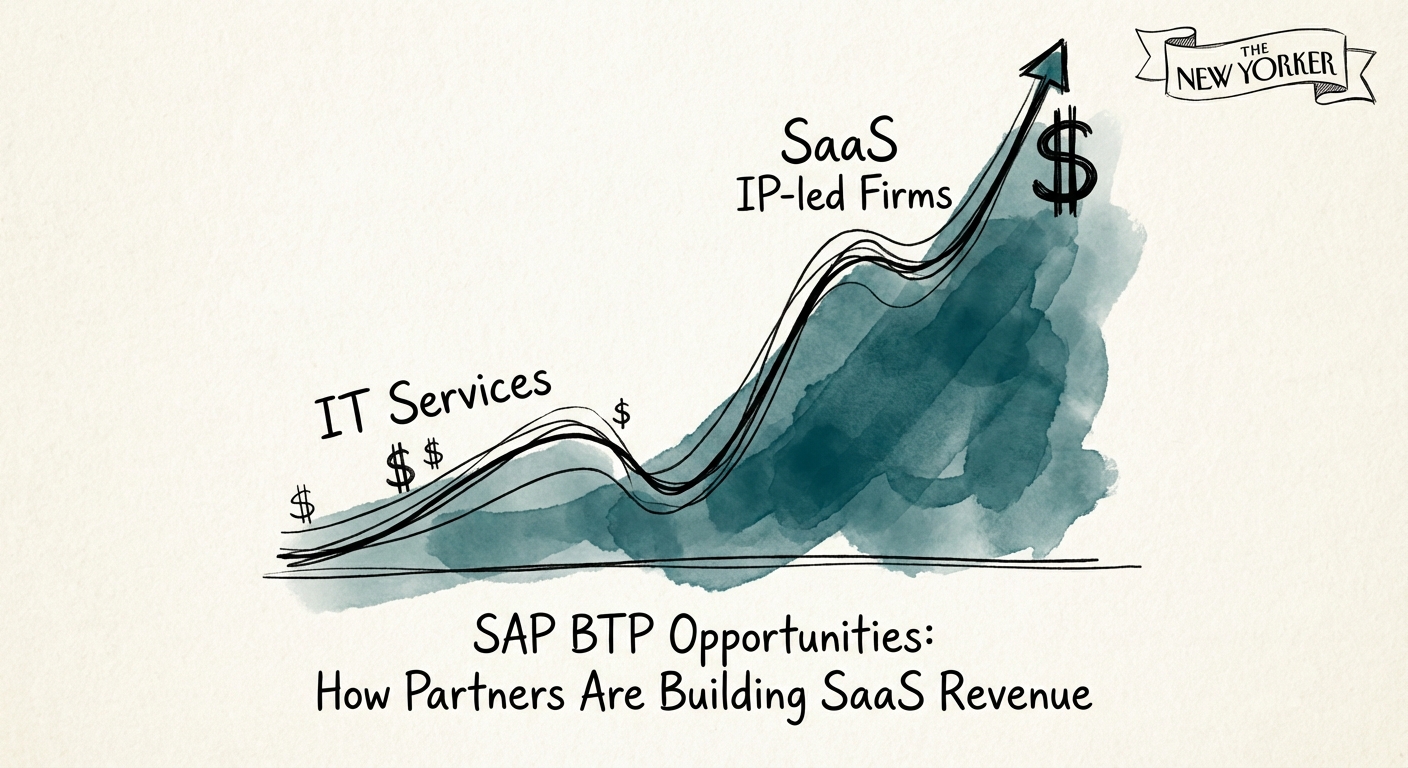
The SAP BTP Play: Turning Your Best RICEFW Objects Into SaaS Revenue
SAP services firms exit at 1.5x revenue. BTP-IP partners trade at 5-8x. Here is how to turn the custom code you already wrote into packaged SaaS.
10x Revenue Multiplier for IP vs. Services
BRIEF · EXIT READINESS
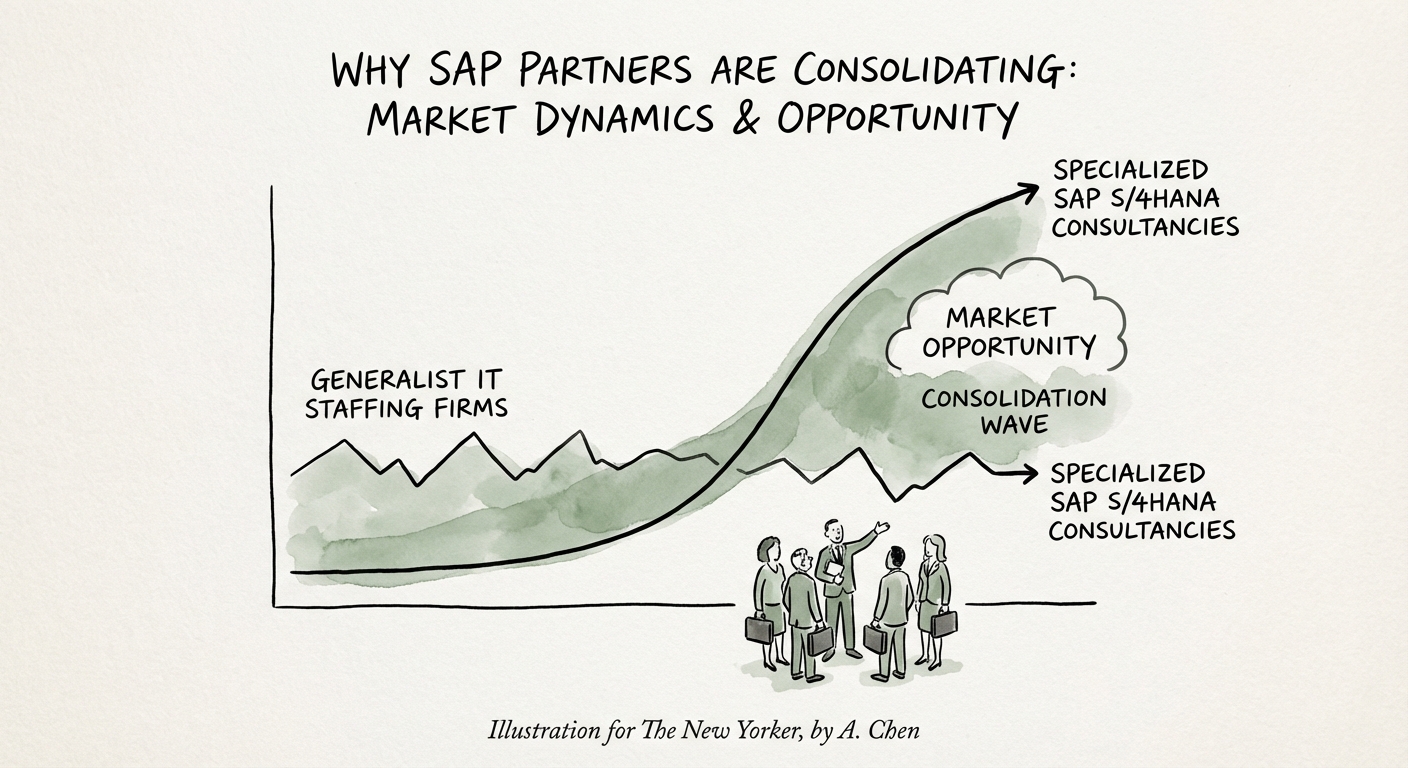
Why SAP Partners Are Consolidating: The PE Playbook for 2026
The 2027 S/4HANA deadline is driving a massive wave of SAP partner consolidation. Here's the Private Equity playbook for capitalizing on the 40,000-person talent deficit.
40,000 Global SAP Talent Deficit
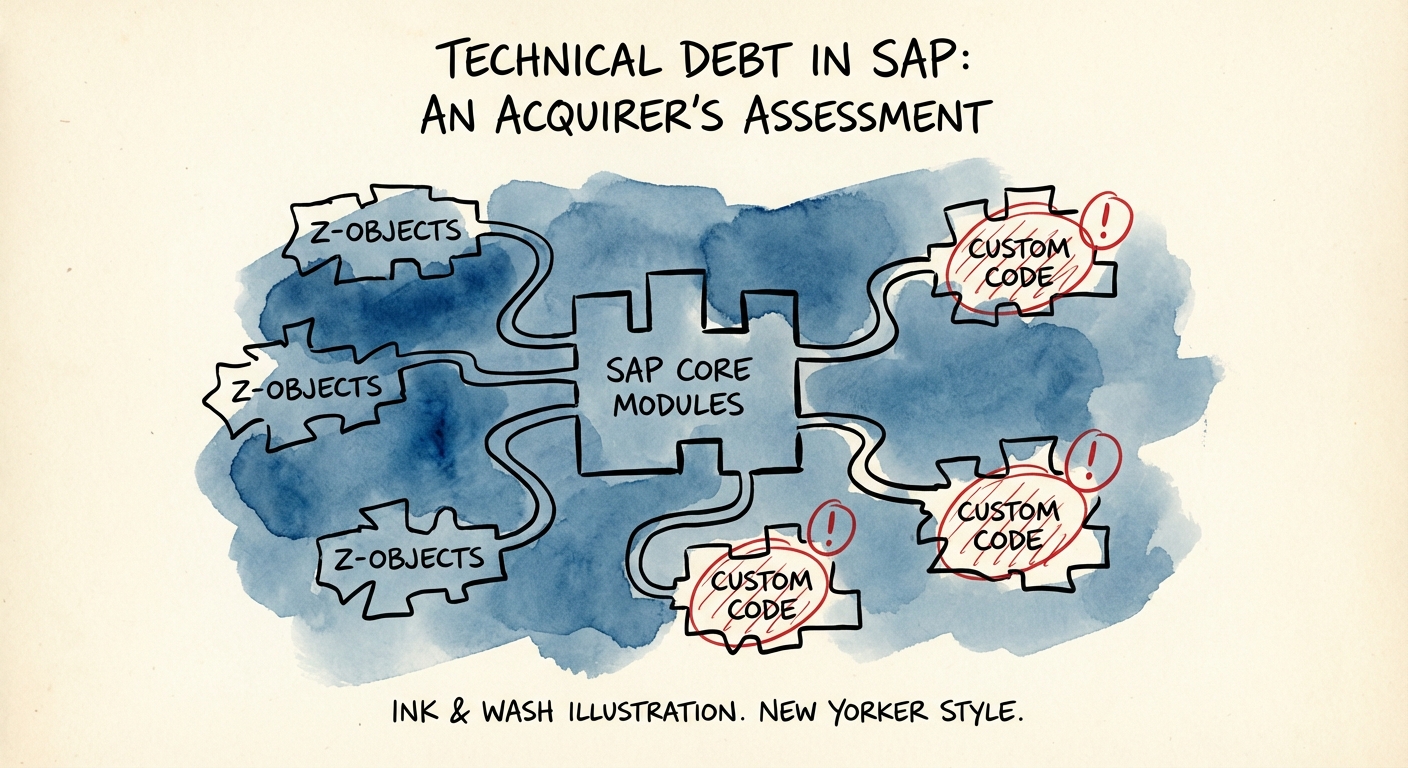
BRIEF · TECHNICAL DEBT
The SAP 'Clean Core' Trap: Why Legacy Custom Code Is a 60% CAPEX Tax on Your Next Exit
Legacy SAP custom code can inflate S/4HANA migration costs by 60%. Use this diagnostic framework to assess technical debt and protect your deal value.
60% Migration Cost Inflation
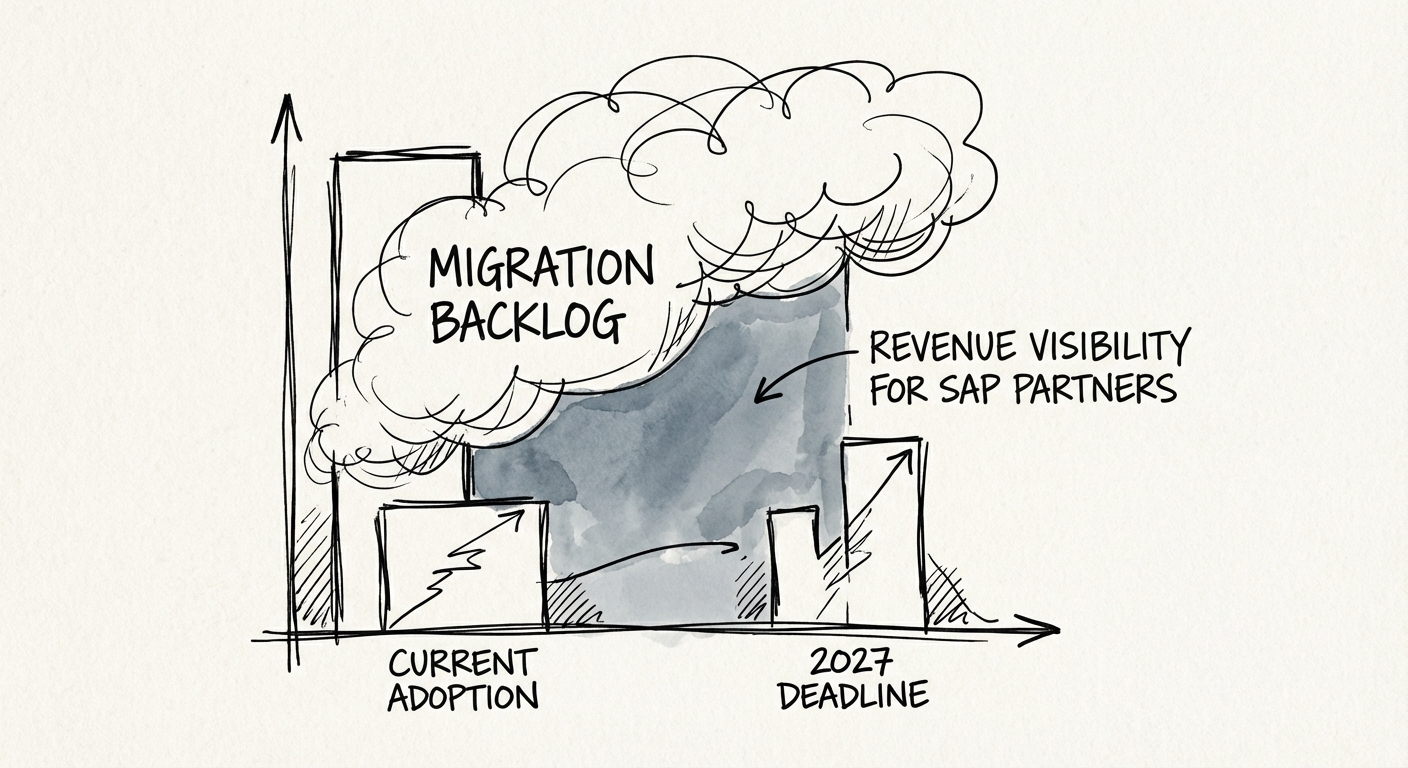
BRIEF · REVENUE ARCHITECTURE
The S/4HANA Phantom Pipeline: Why Your 2026 Forecast Is a Lie
Only 39% of SAP ECC customers have licensed S/4HANA. Here is how SAP partners can fix revenue forecasting visibility and avoid the 'utilization trap' before the 2027 deadline.
39% S/4HANA Adoption Rate (Gartner)
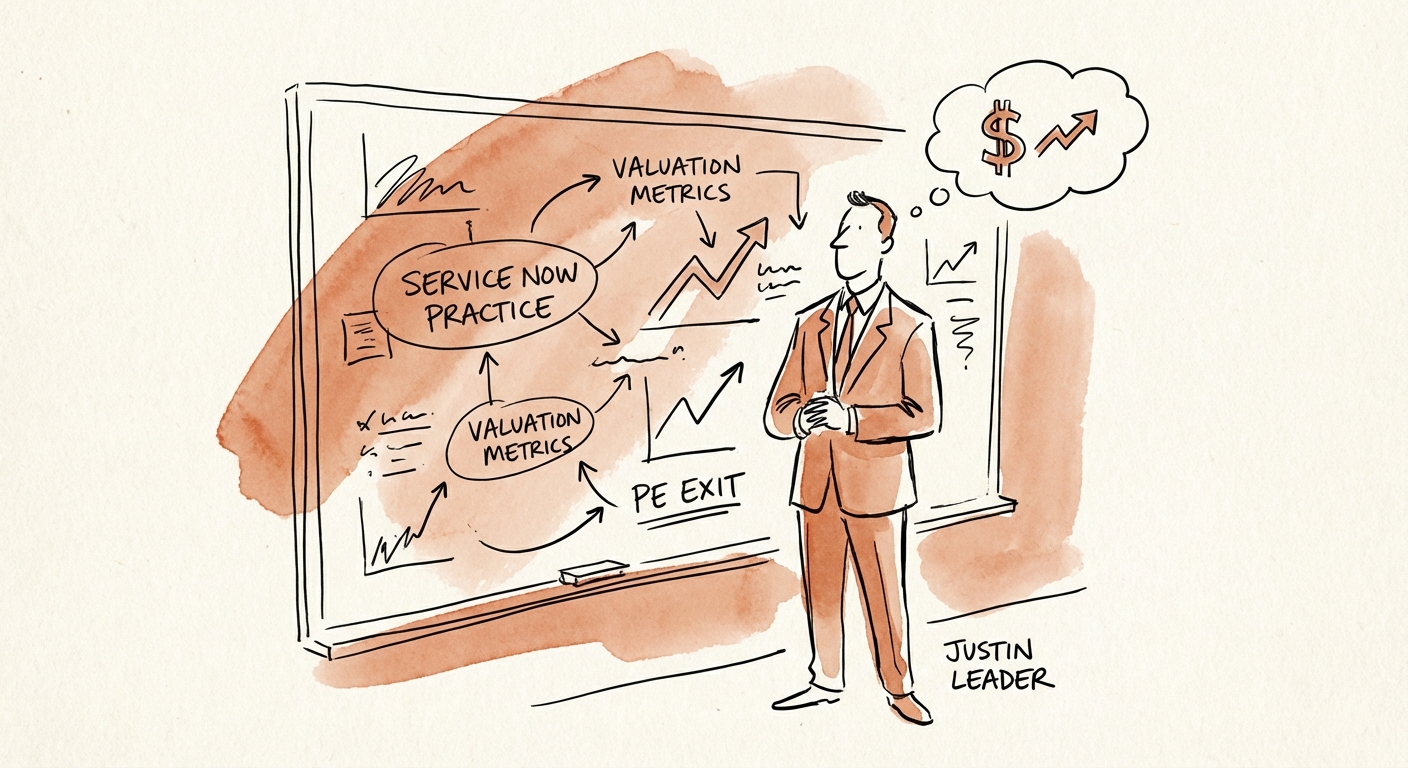
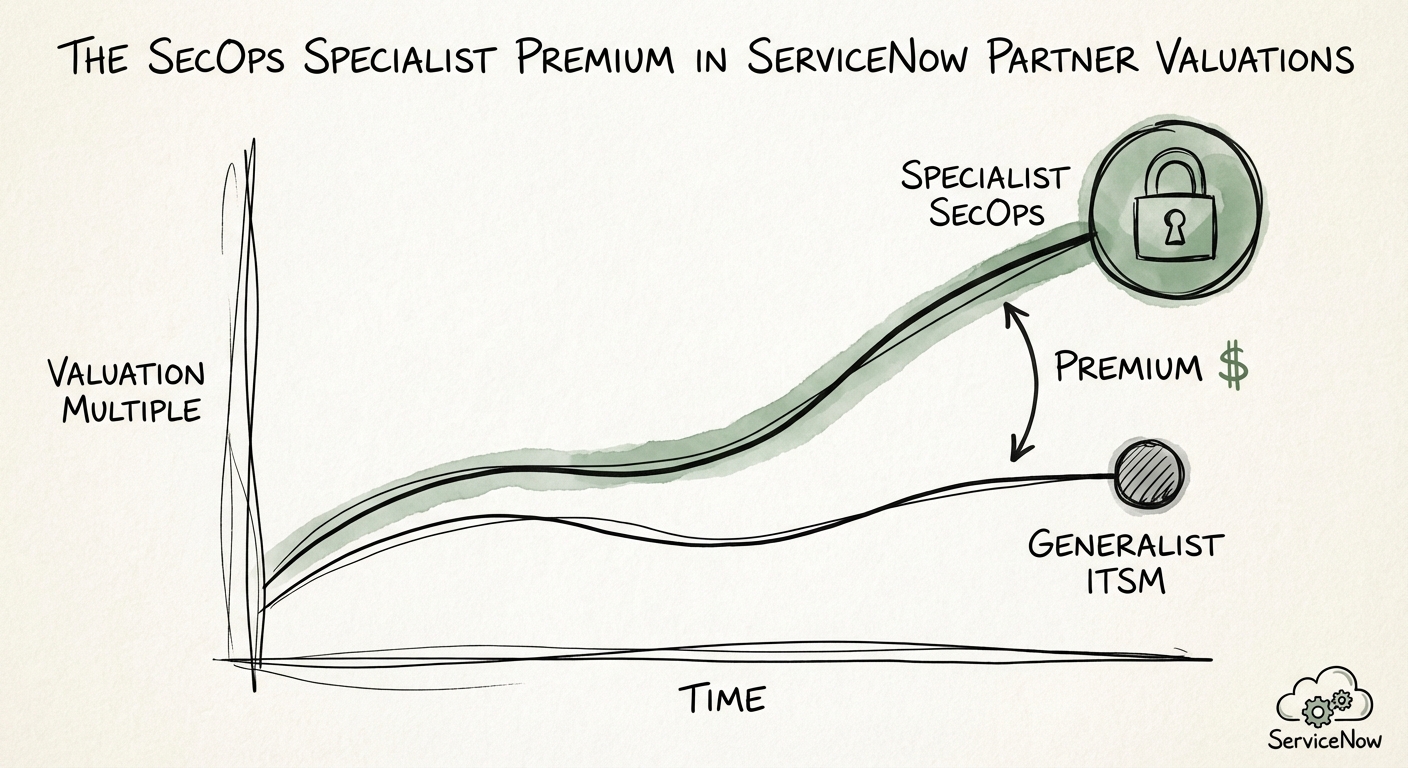
BRIEF · EXIT READINESS
The "Generic Elite" Trap: How to Position Your ServiceNow Practice for a Premium PE Exit
ServiceNow Elite status is no longer a differentiator. Learn the specific financial and operational metrics PE firms demand for premium exits in 2026.
15-20% Target EBITDA Margin
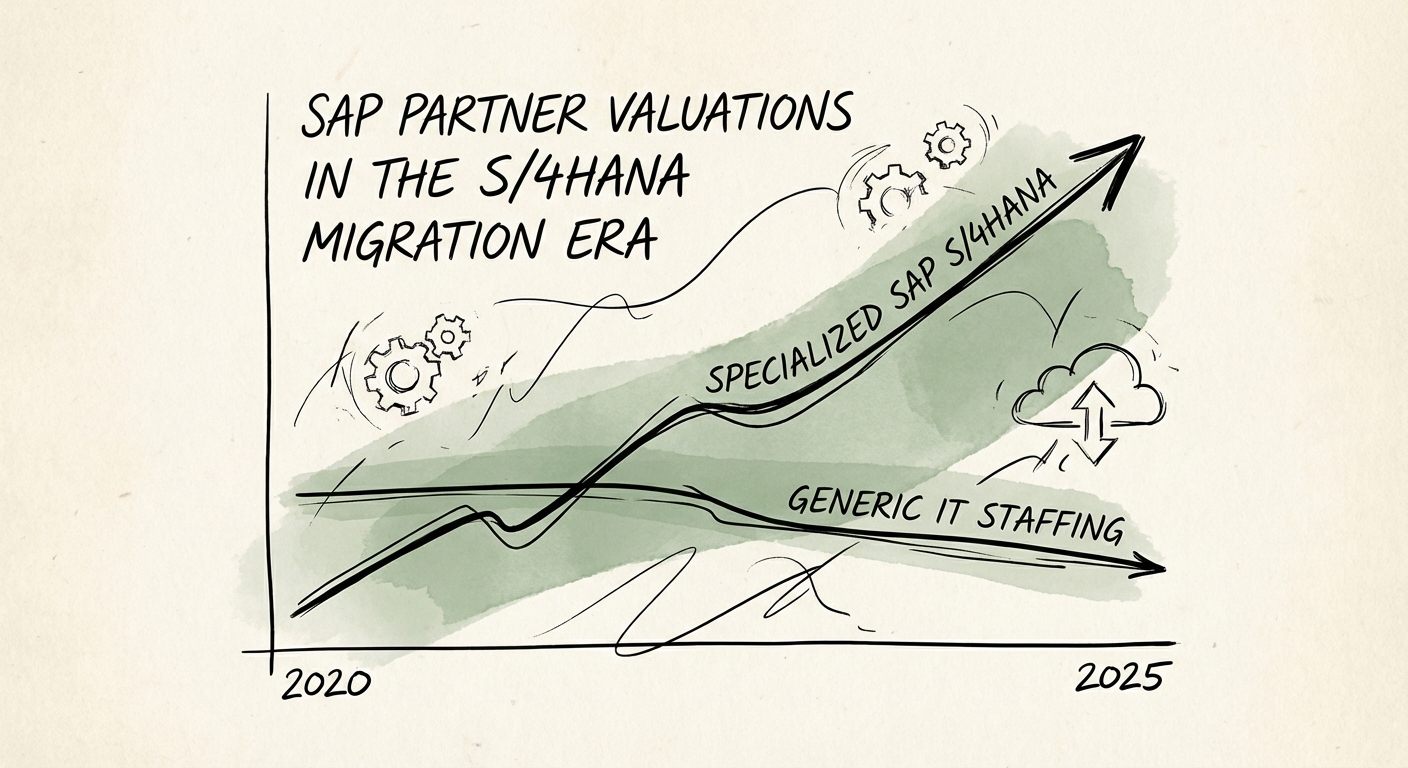
BRIEF · EXIT READINESS
The SAP Migration market opening: Why S/4HANA Expertise is Trading at a 13.6x Premium
The 2027 S/4HANA deadline is creating a valuation bifurcation in the SAP partner ecosystem. Here is the diagnostic for PE investors and founders.
13.6x Median EBITDA Multiple (Specialized IT Consulting, 2025)
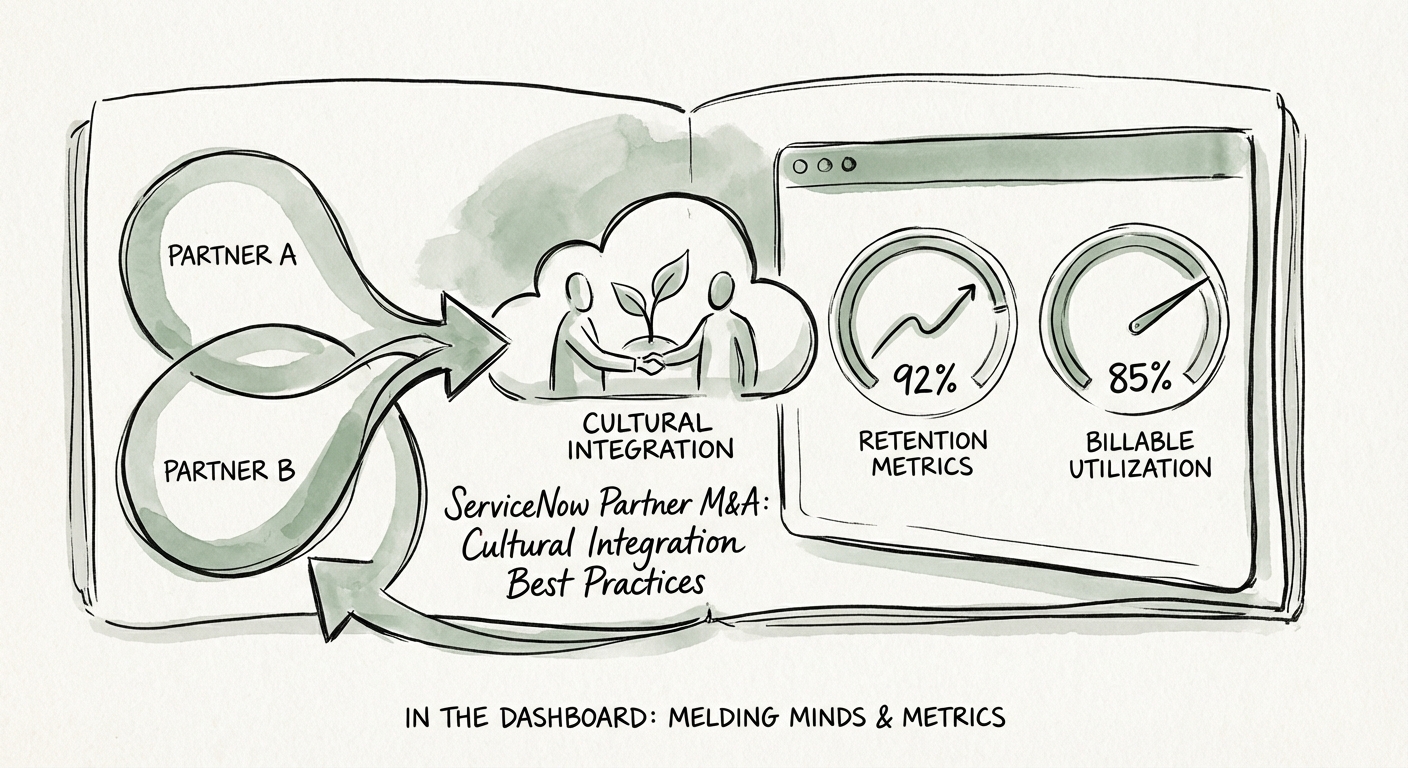
BRIEF · MIGRATION & INTEGRATION
ServiceNow Partner M&A: Why "Culture" Is Actually A Retention Metric
ServiceNow partner M&A fails when culture is ignored. Learn why 33% of technical talent leaves post-close and how to protect your Elite Partner status with a retention-first integration playbook.
33% Year 1 Attrition Risk
BRIEF · EXIT READINESS
Why Two Identical ServiceNow Partners Sell for 6 Turns of EBITDA Apart
Two ServiceNow partners, same revenue, same headcount. One sells at 8x EBITDA, the other at 14x. The difference is whose budget signs the check.
40% Valuation Premium
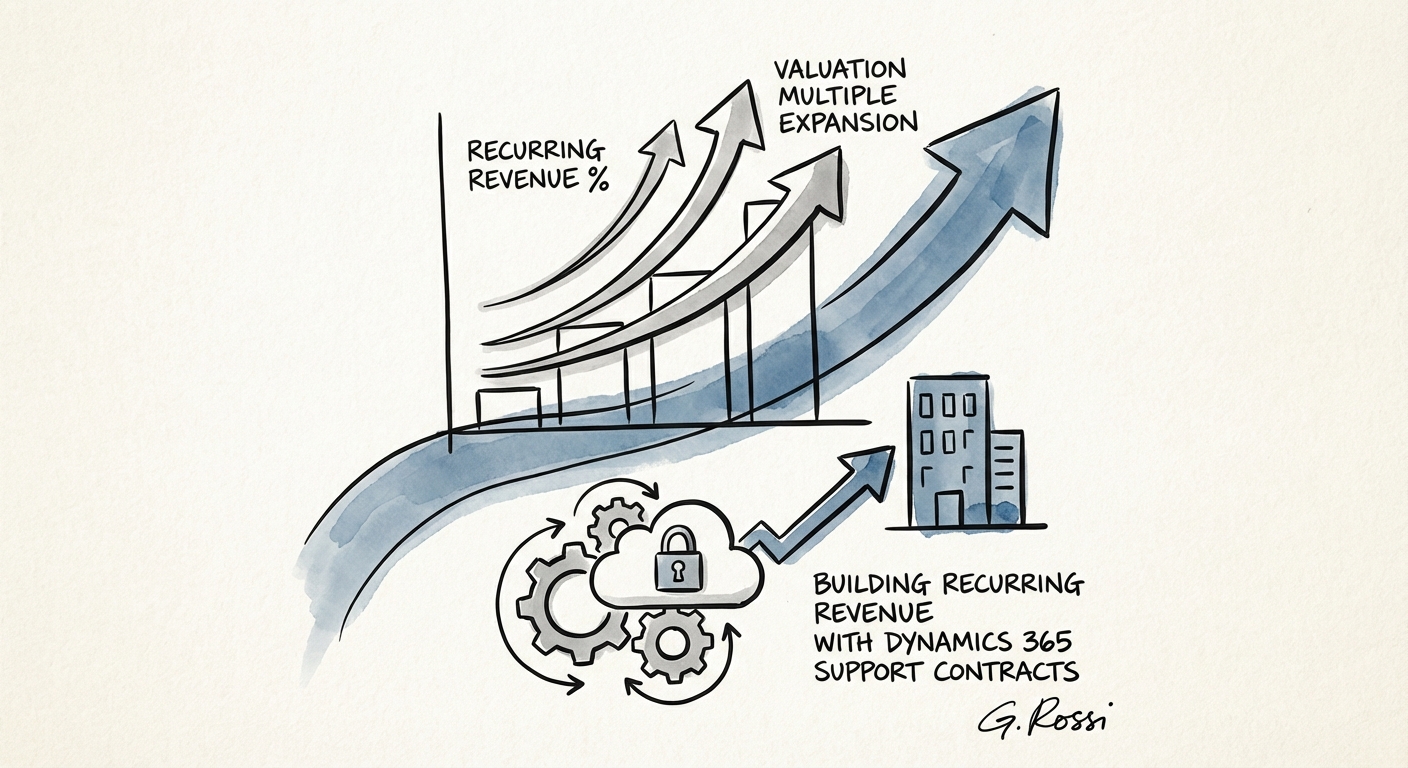
BRIEF · REVENUE ARCHITECTURE
Building Recurring Revenue with Dynamics 365 Support Contracts: The Valuation Multiplier
Transform your Dynamics 365 practice from feast-or-famine projects to predictable ARR. Discover the 8x valuation multiple of Application Managed Services (AMS).
8.1x EBITDA Multiple
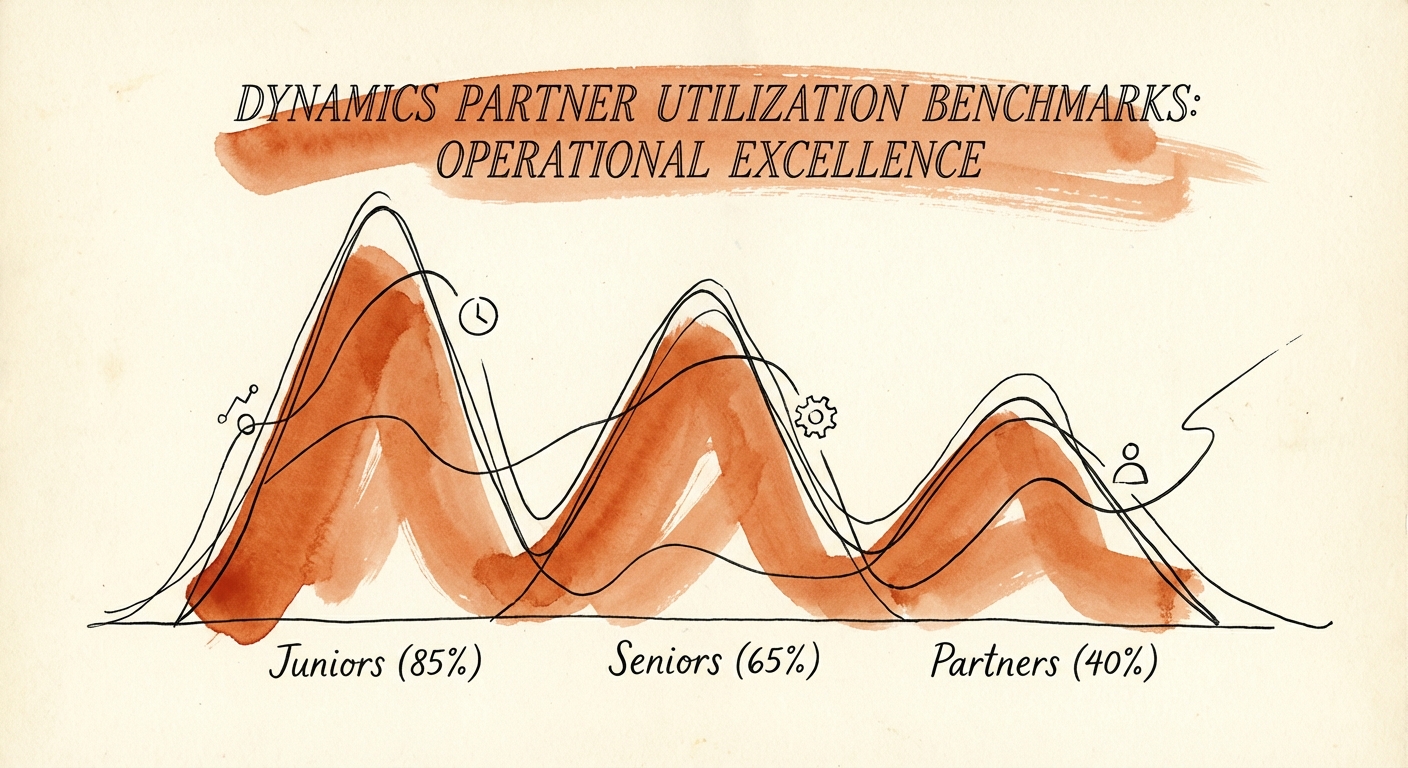
BRIEF · UNIT ECONOMICS
Why 85% Utilization Is Killing Your Dynamics Practice (And What to Aim For Instead)
New 2026 data shows average Dynamics partner utilization has dropped to 68.9%. Discover why aiming for 85%+ is killing your EBITDA and the role-based targets you should use instead.
75% Optimal Firm-Wide Utilization
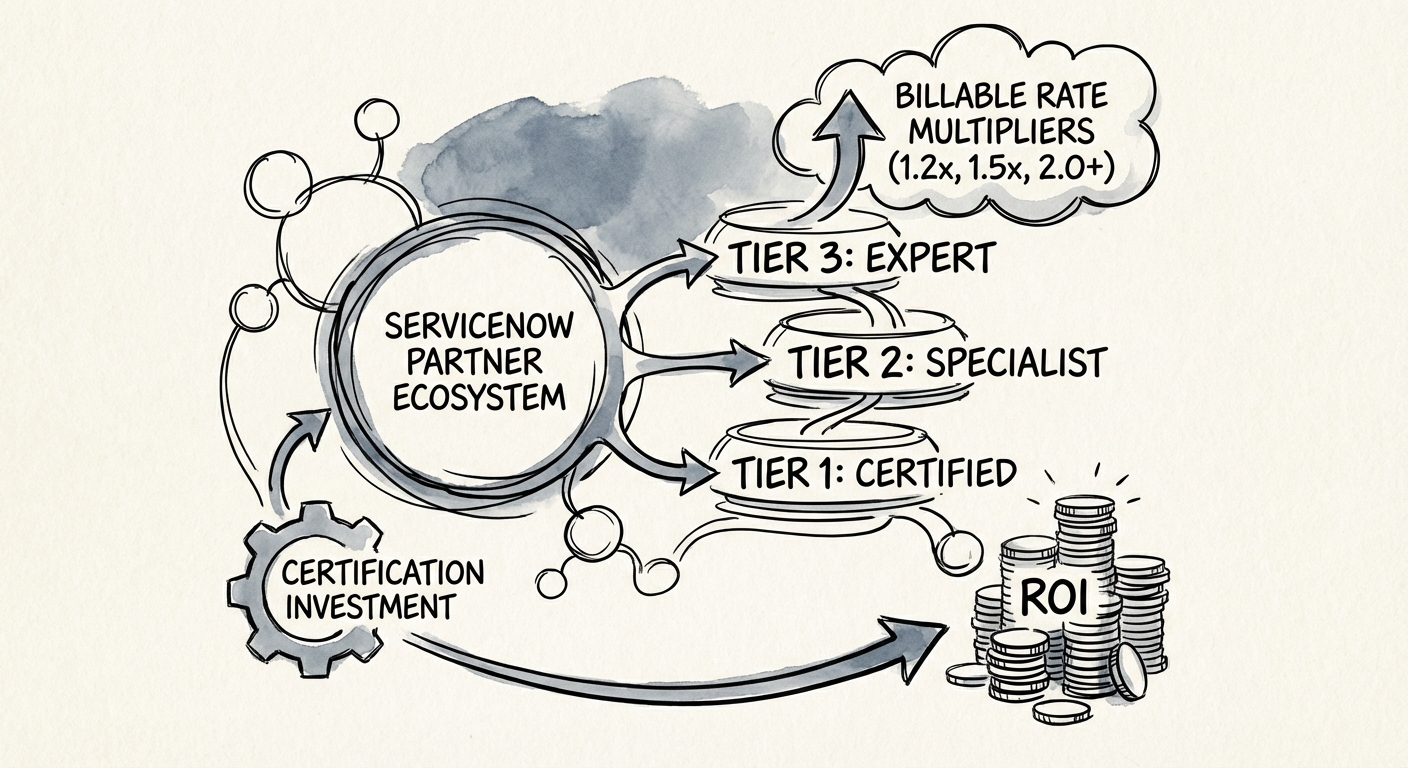
BRIEF · UNIT ECONOMICS
The Certification Trap: Why Your Most Certified ServiceNow Consultants Are Killing Your Margins
Stop treating ServiceNow certifications like trophies. A diagnostic guide to calculating the true ROI of your partner bench, from CMA costs to billable rate multipliers.
$17,000 Direct Cost Per CMA
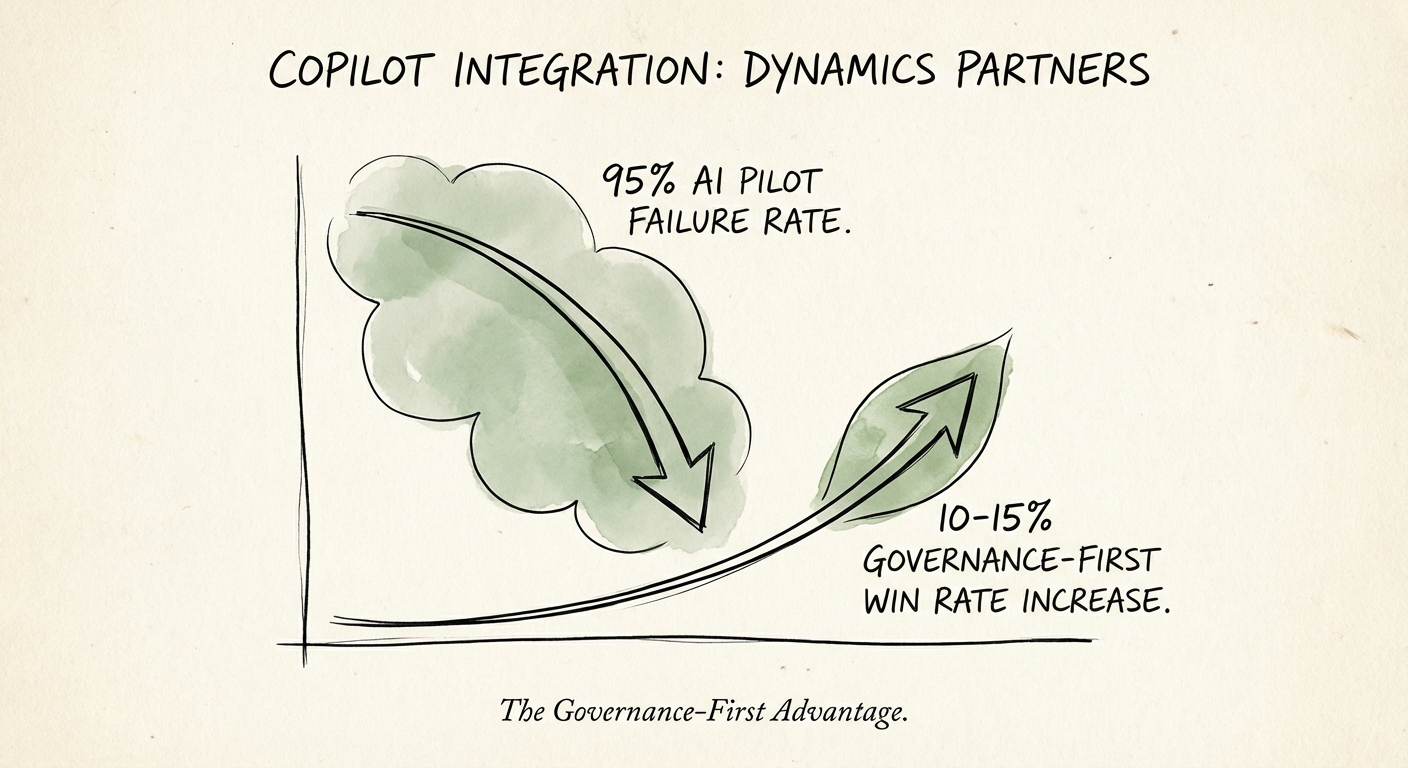
BRIEF · GTM EXECUTION
The Reseller's Trap: Why Your Copilot Strategy Is Failing (And How to Fix It)
Microsoft Copilot adoption is stalling at 2%. Here is the diagnostic for Dynamics Partners to pivot from license resale to high-margin AI governance and 'System of Action' implementation.
95% AI Pilot Failure Rate
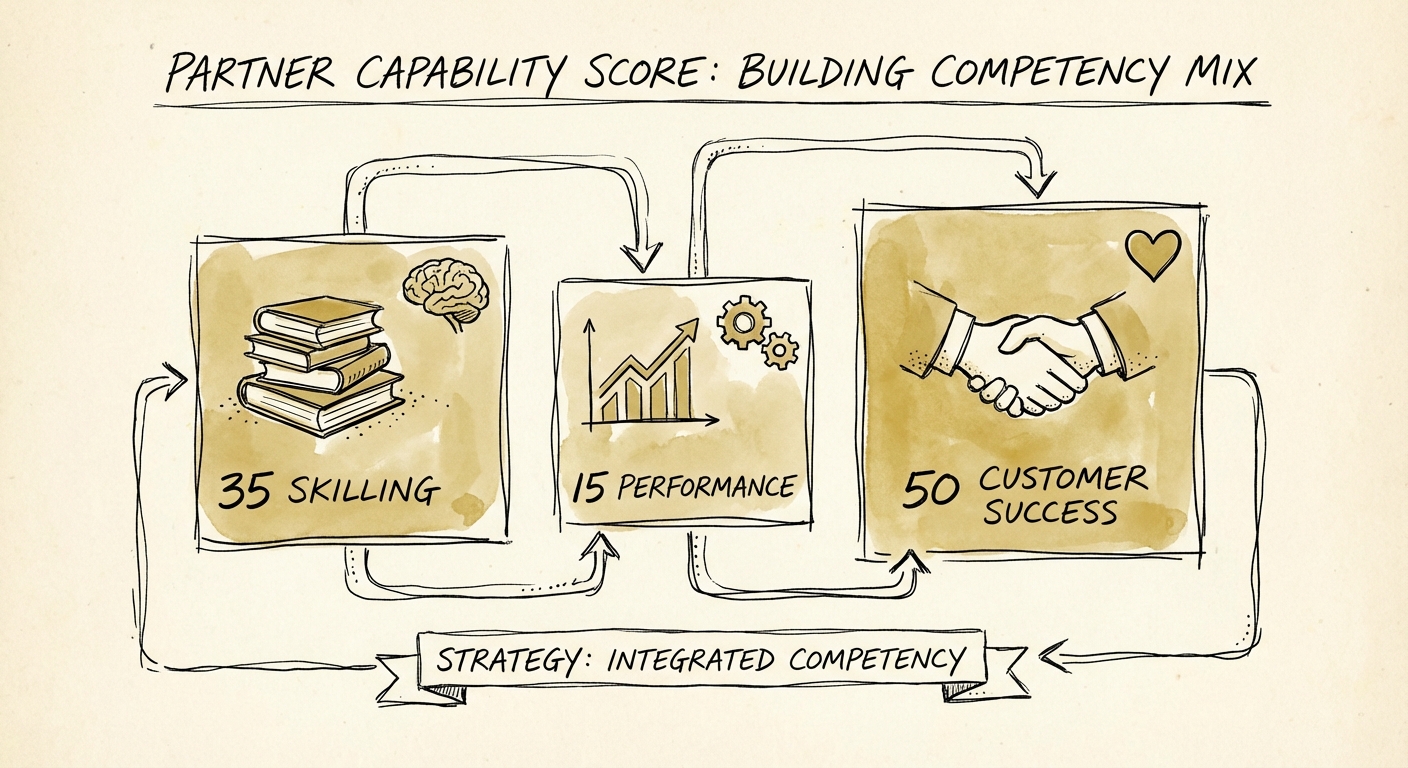
BRIEF · TEAM & HIRING
Dynamics Partner Certification Strategy: Building a Competency Mix That Bills
Stop badge collecting. Learn how to build a Microsoft Dynamics competency mix that drives Partner Capability Scores (PCS) and billable revenue. Diagnostic for scaling partners.
35 Points Max Skilling Score (MAICPP)