BRIEF · EXIT READINESS
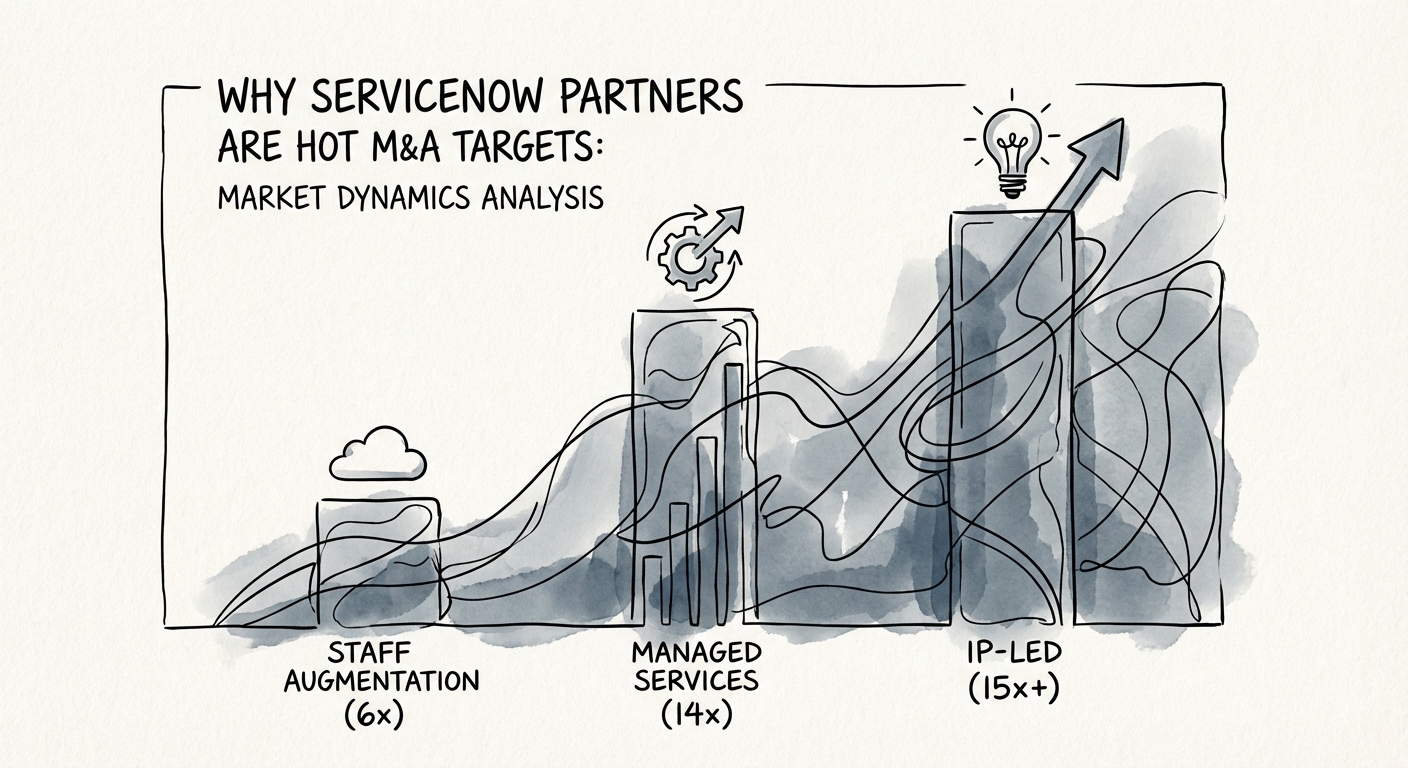
Why ServiceNow Partners Are Trading at 15x EBITDA: The 2026 Market Dynamics Analysis
ServiceNow partners are trading at 15x EBITDA. Learn the market dynamics, valuation drivers, and due diligence red flags fueling the 2026 M&A consolidation wave.
15x EBITDA Multiple for Elite Partners
BRIEF · REVENUE ARCHITECTURE
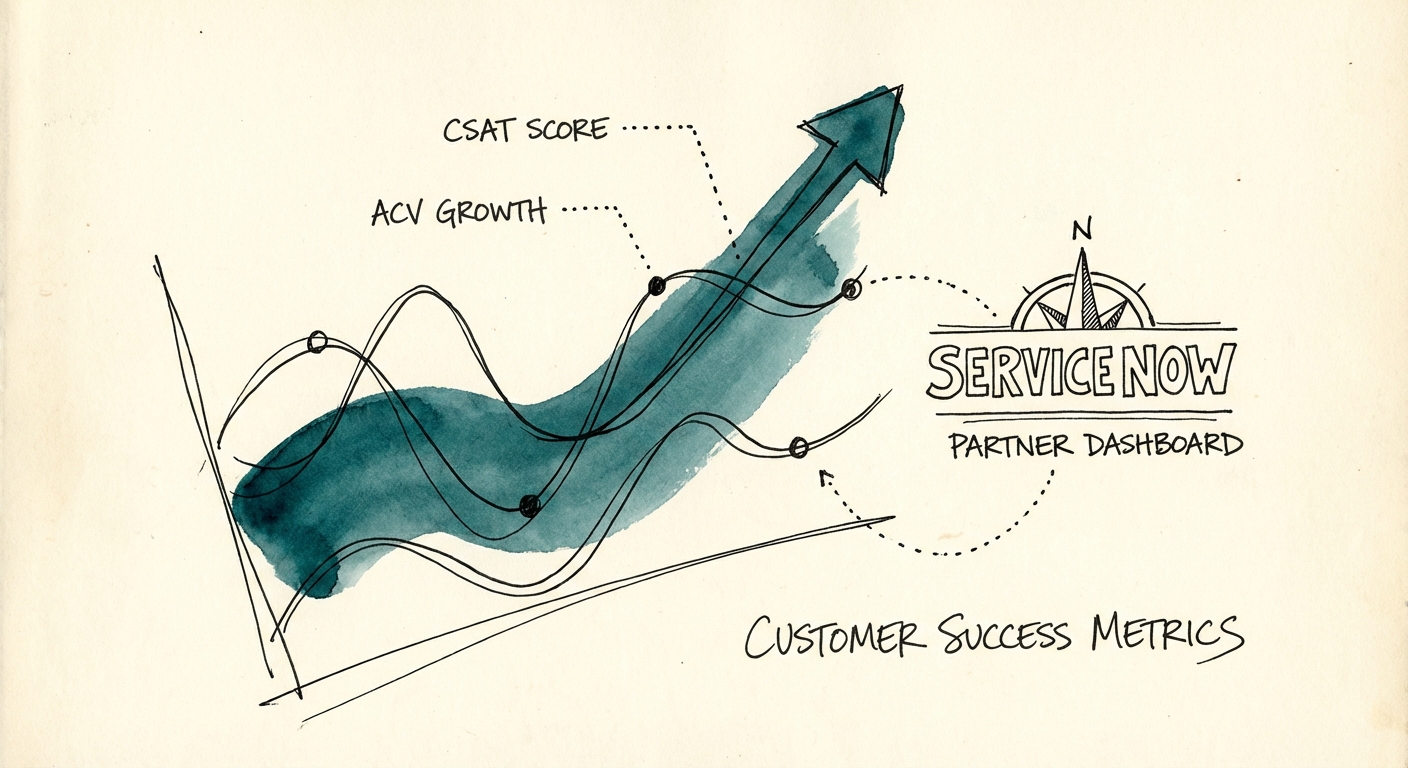
Customer Success Metrics for ServiceNow Implementation Partners: The 'Project Trap' Diagnostic
Stop tracking just 'on-time delivery.' Here are the 5 Customer Success metrics ServiceNow implementation partners must track to retain Elite status and drive valuation.
4.6/5.0 Minimum CSAT for Elite Status
BRIEF · FINANCIAL INFRASTRUCTURE
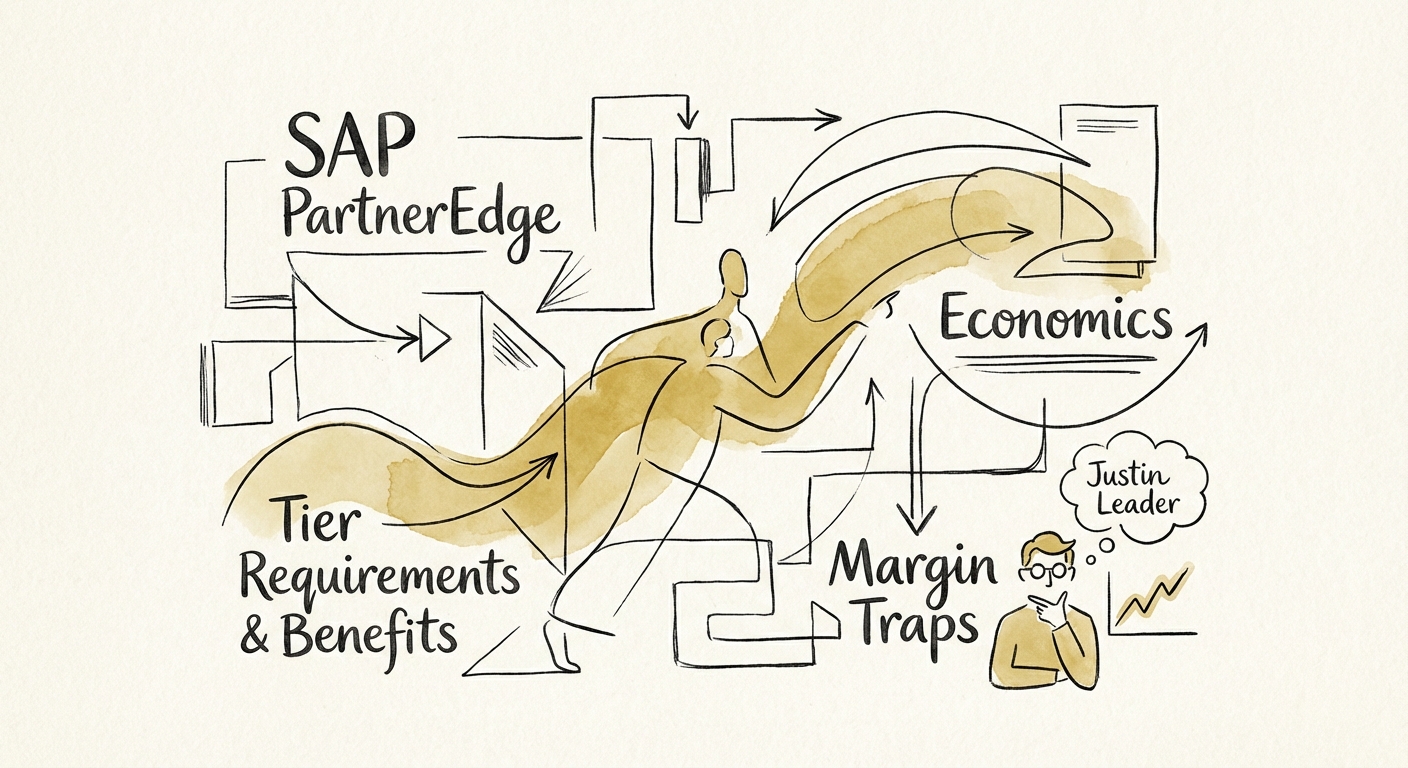
The SAP PartnerEdge ROI Calculator: Why "Gold" Status Might Be Killing Your Margins
Is SAP Gold status worth the cost? A diagnostic guide for service firm CEOs and PE investors on PartnerEdge economics, tier requirements, and the hidden margin trap of resale.
18.5% Avg. Margin Erosion from 'Tier Chasing'
BRIEF · EXIT READINESS
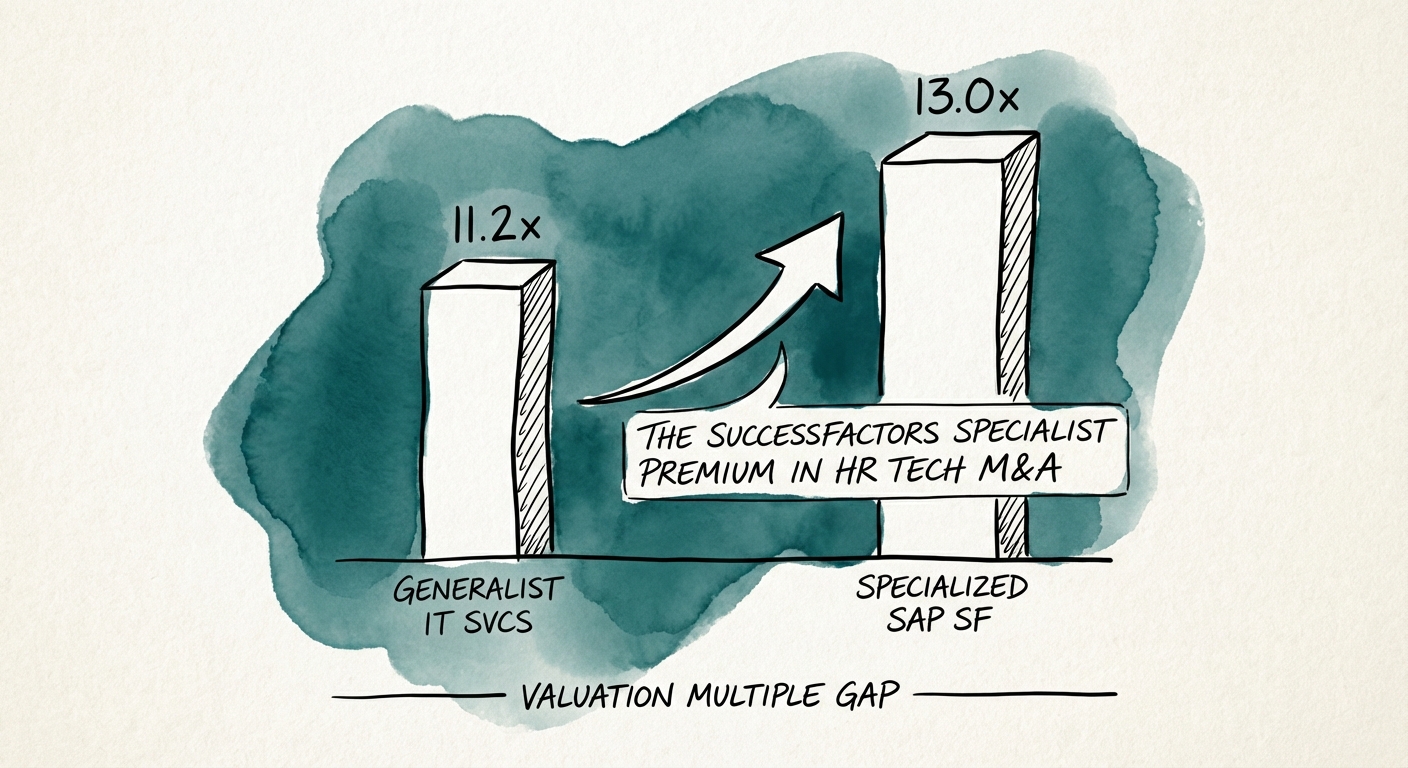
The SuccessFactors Specialist Premium: Why Niche Firms Command 12x EBITDA in 2026
Generalist IT shops trade at 8x EBITDA. Specialized SuccessFactors partners trade at 12x+. Here is the operational diagnostic to capture the specialist premium in 2026.
13.0x Median EBITDA Multiple
BRIEF · UNIT ECONOMICS
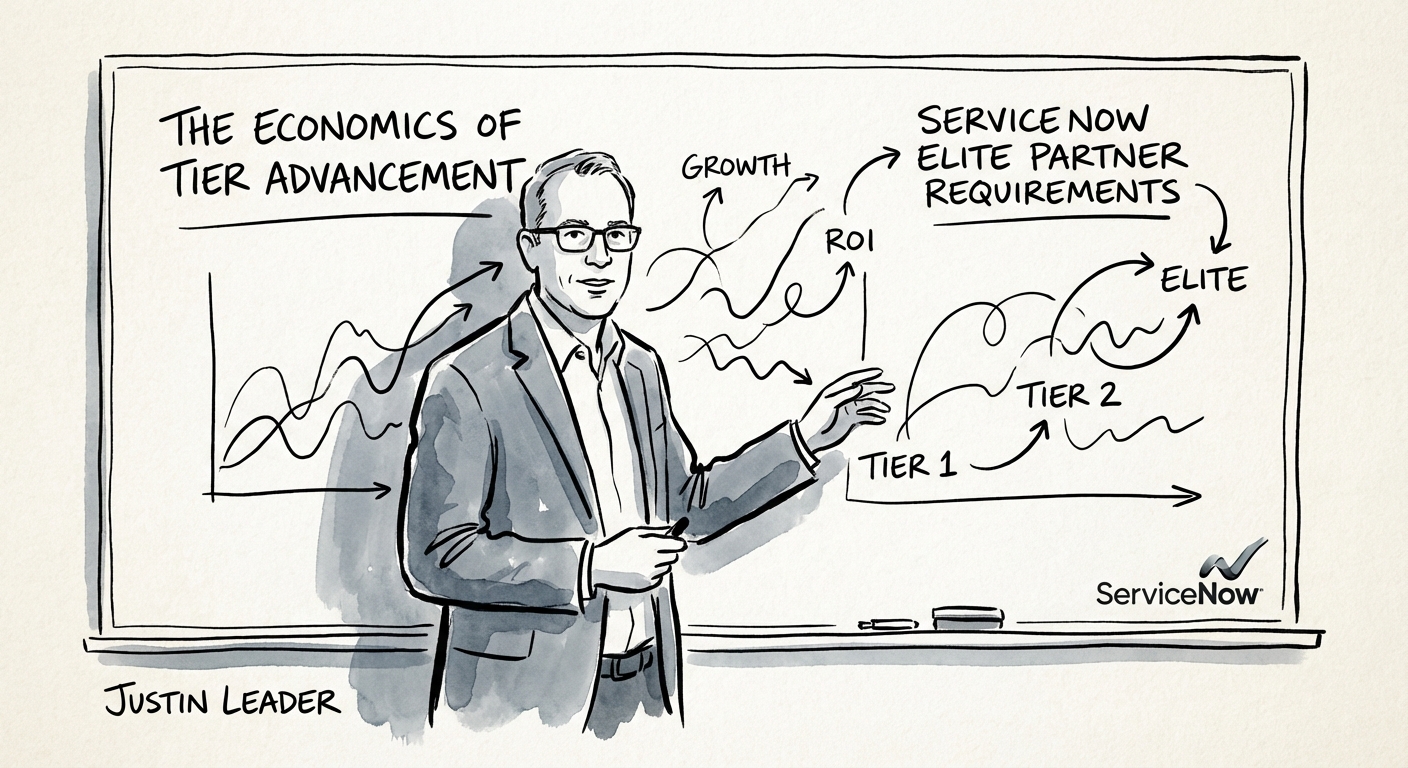
The 'Elite' Trap: The Real Economics of ServiceNow Tier Advancement
Analysis of the true costs and valuation impact of ServiceNow Elite Partner advancement. Benchmarks on certification costs, margin erosion, and the valuation gap.
41% Reduction in Elite Partner Count (2025 Consolidation)
BRIEF · REVENUE ARCHITECTURE
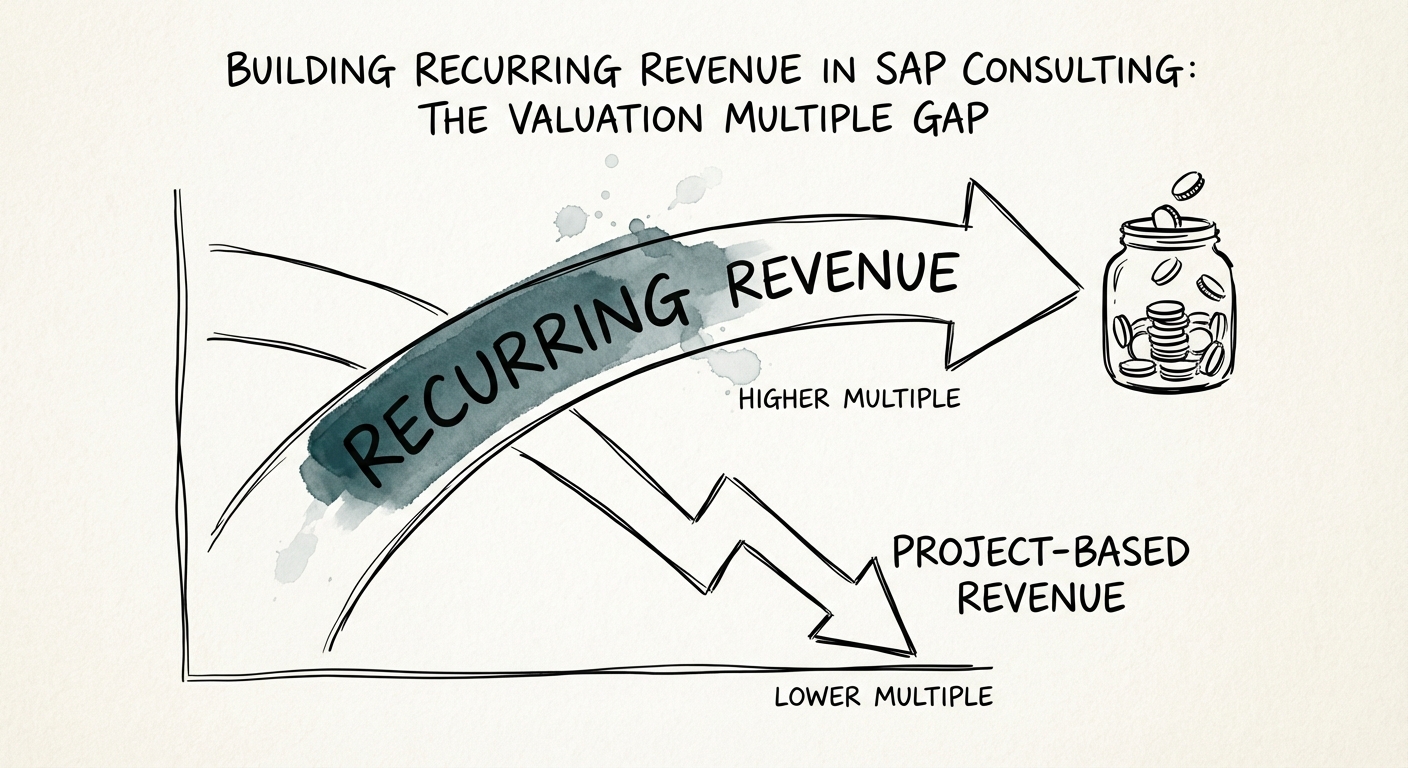
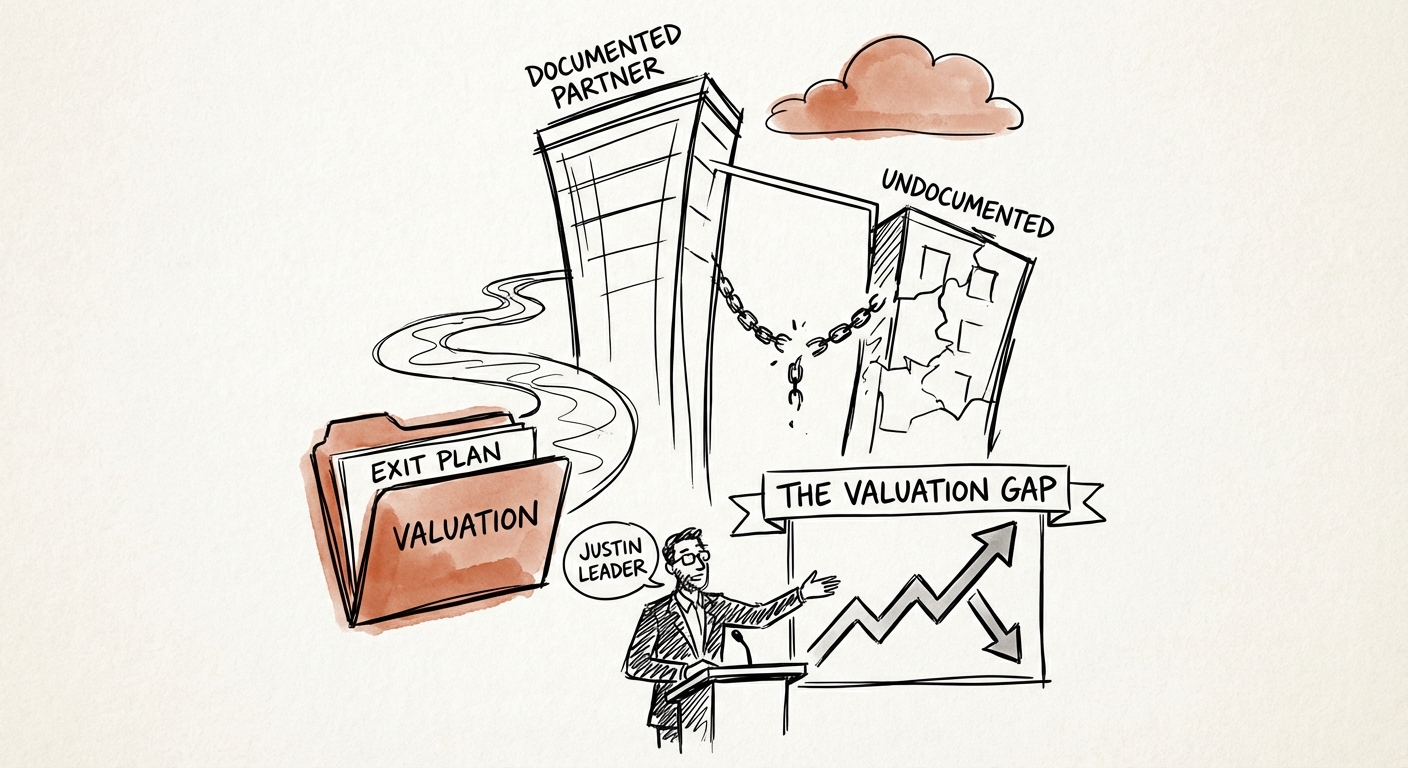
The SAP Valuation Gap: Why Your Project Revenue Is Worth 6x Less Than Your Managed Services (And How to Fix It)
Transform your SAP practice from a project-based treadmill to a recurring revenue asset. Learn why recurring revenue commands a 3x valuation premium and how to build it.
2.28x - 2.53x Recurring Revenue Multiple vs. 1.01x for Projects
BRIEF · TECHNICAL DEBT
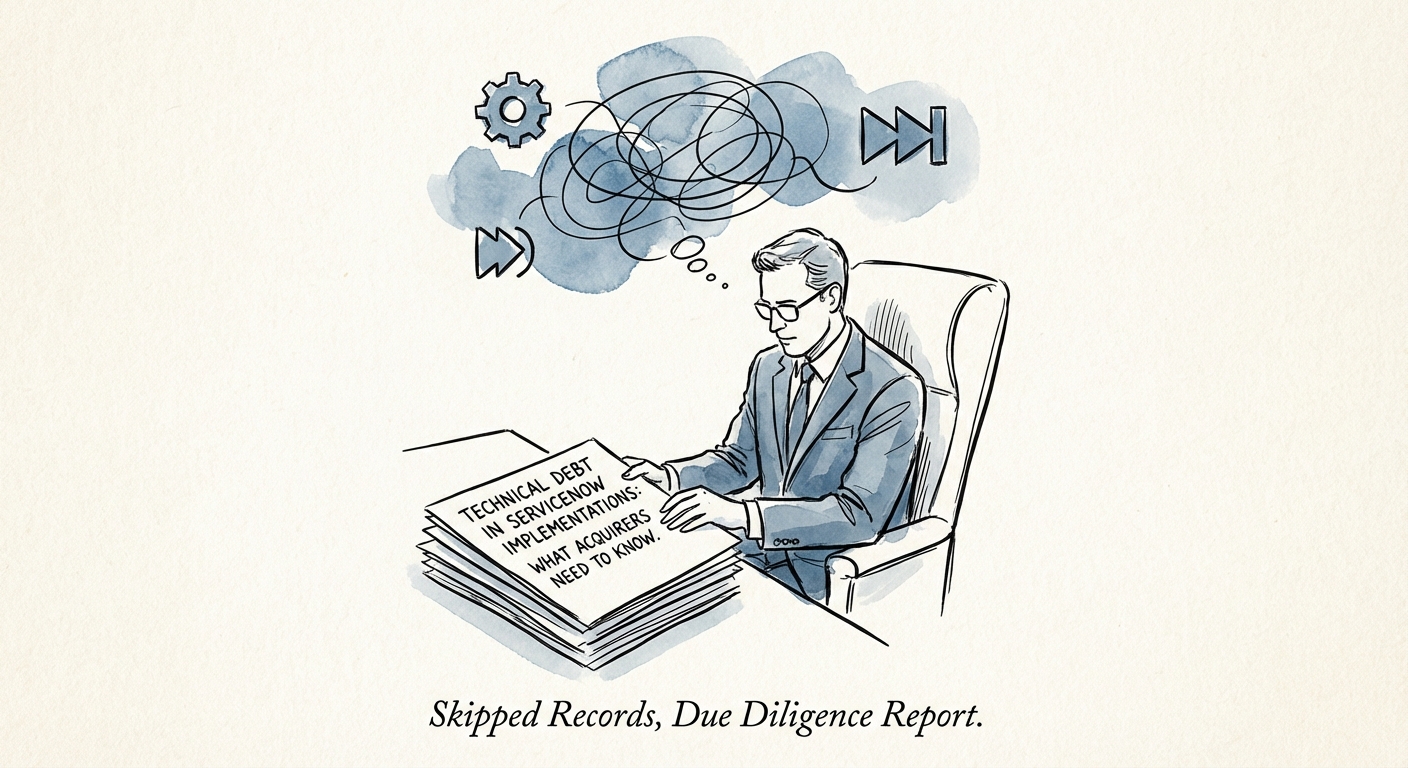
The 'Franken-Now' Discount: Why ServiceNow Technical Debt Is a Hidden Valuation Haircut
ServiceNow customizations are not assets; they are liabilities. Learn how to quantify 'Franken-Now' technical debt and adjust EBITDA before you sign the LOI.
31% of acquired codebases contain critical technical debt
BRIEF · REVENUE ARCHITECTURE
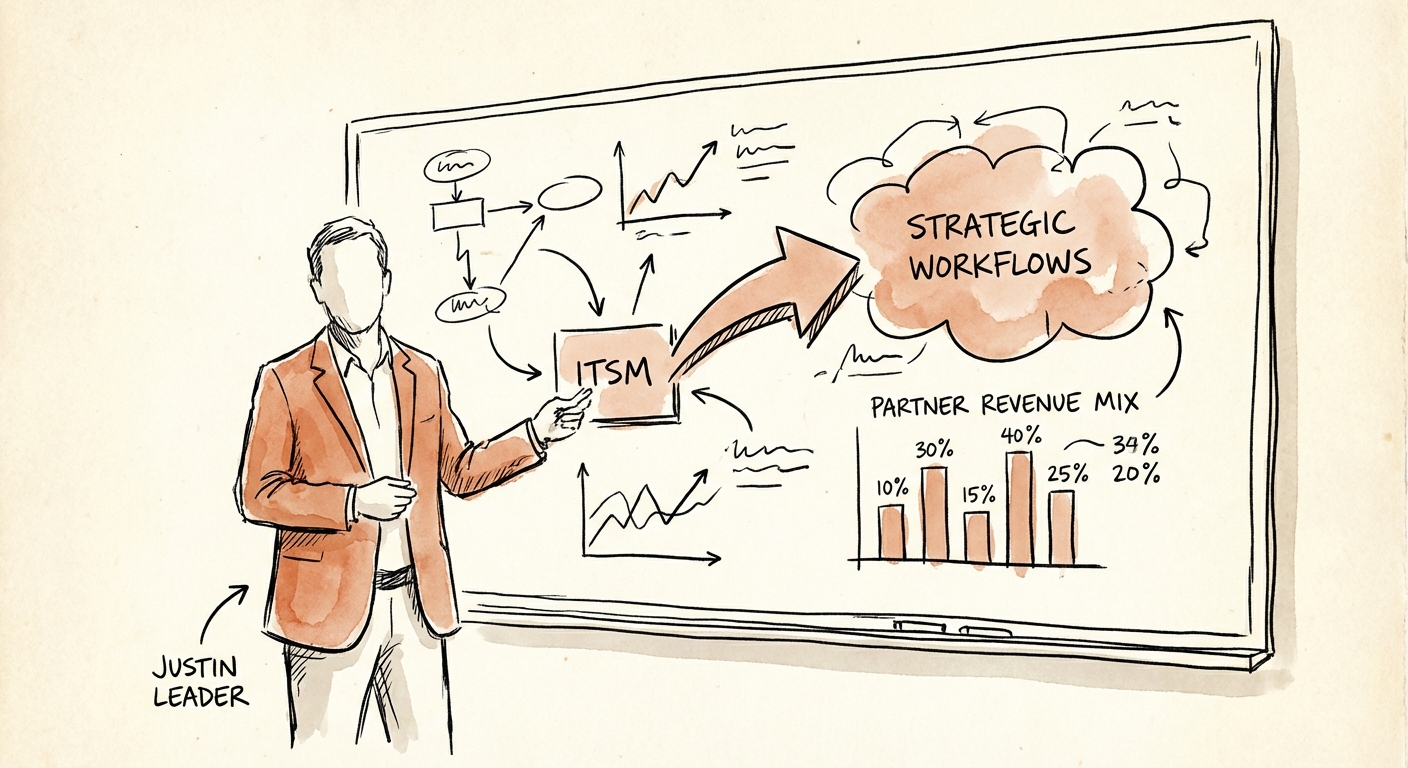
ITSM to Strategic Workflows: The ServiceNow Partner Evolution
For ServiceNow partners, ITSM is now a commodity. Learn why shifting to Strategic Workflows (CSM, HRSD) drives 14x EBITDA multiples and breaks the $10M revenue ceiling.
13.6x Potential EBITDA Multiple for Specialized Partners
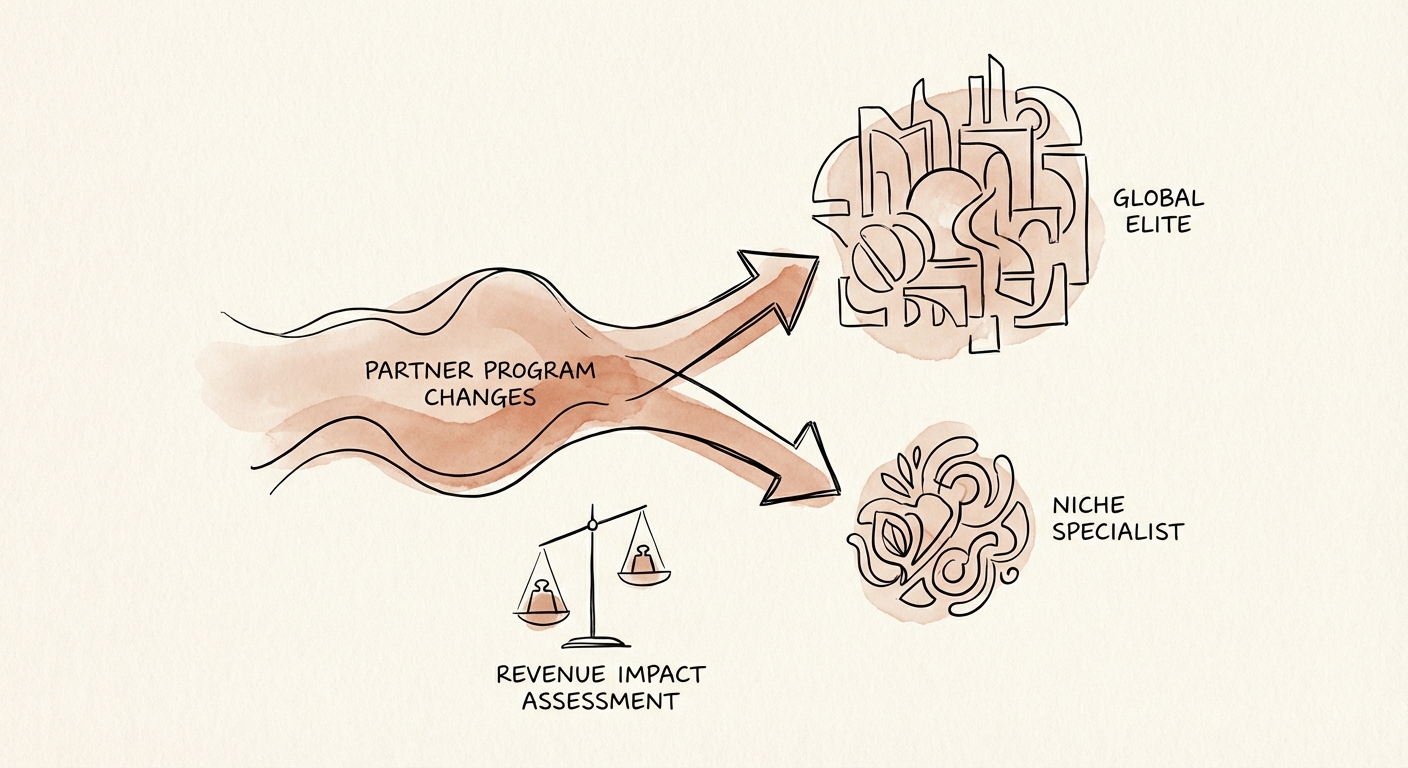
BRIEF · FINANCIAL INFRASTRUCTURE
The 2025 ServiceNow Partner Shakeout: Why 'Elite' Status Might Bankrupt Your Services Firm
ServiceNow's 2025 partner program overhaul reduces Elite tiers and demands AI specialization. Here is the revenue impact diagnostic for founders.
41% Reduction in Elite Partners
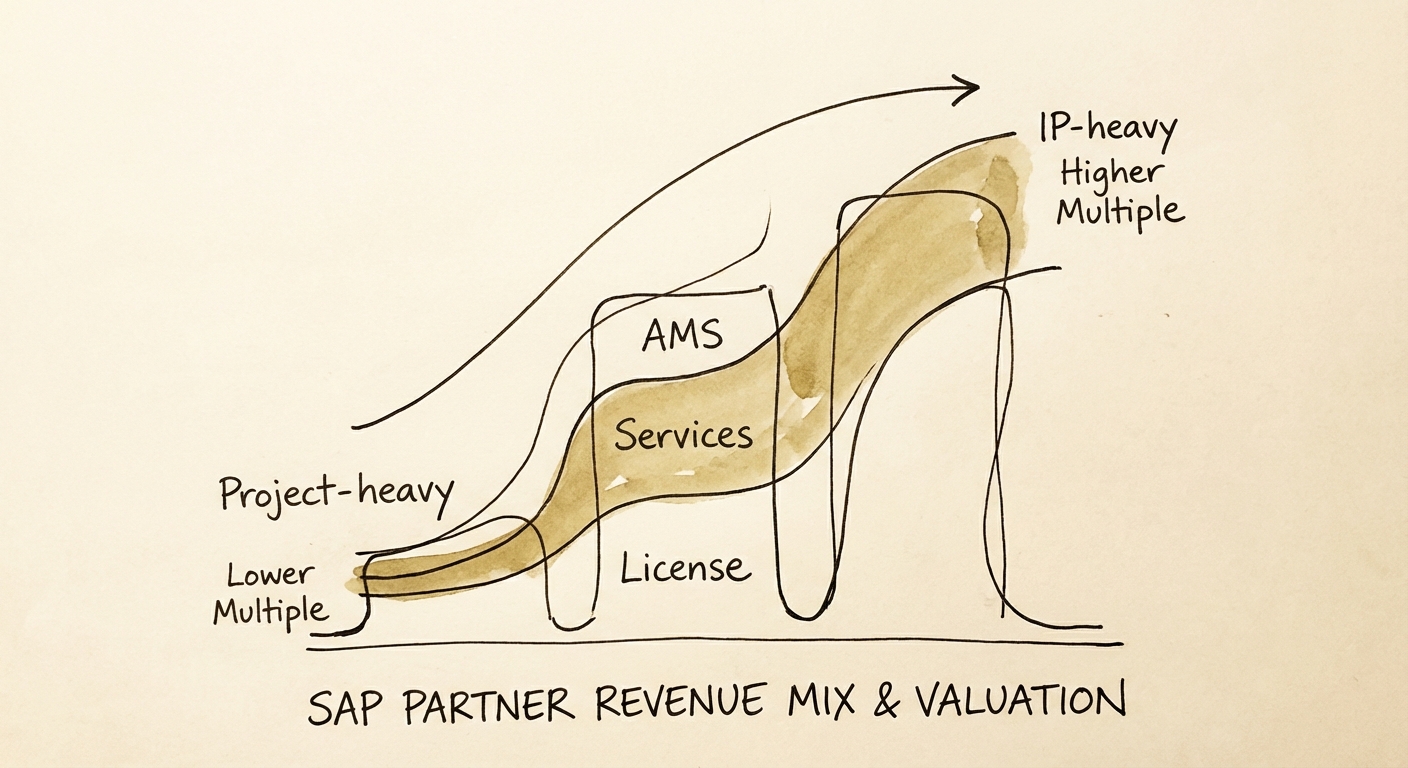
BRIEF · UNIT ECONOMICS
The 'Hamster Wheel' Diagnostic: Why Your SAP Revenue Mix Is Killing Your Valuation
Benchmarks for SAP partner revenue composition. Diagnose your valuation based on License, Services, and AMS mix. Move from 4x to 12x EBITDA.
12x Potential EBITDA Multiple
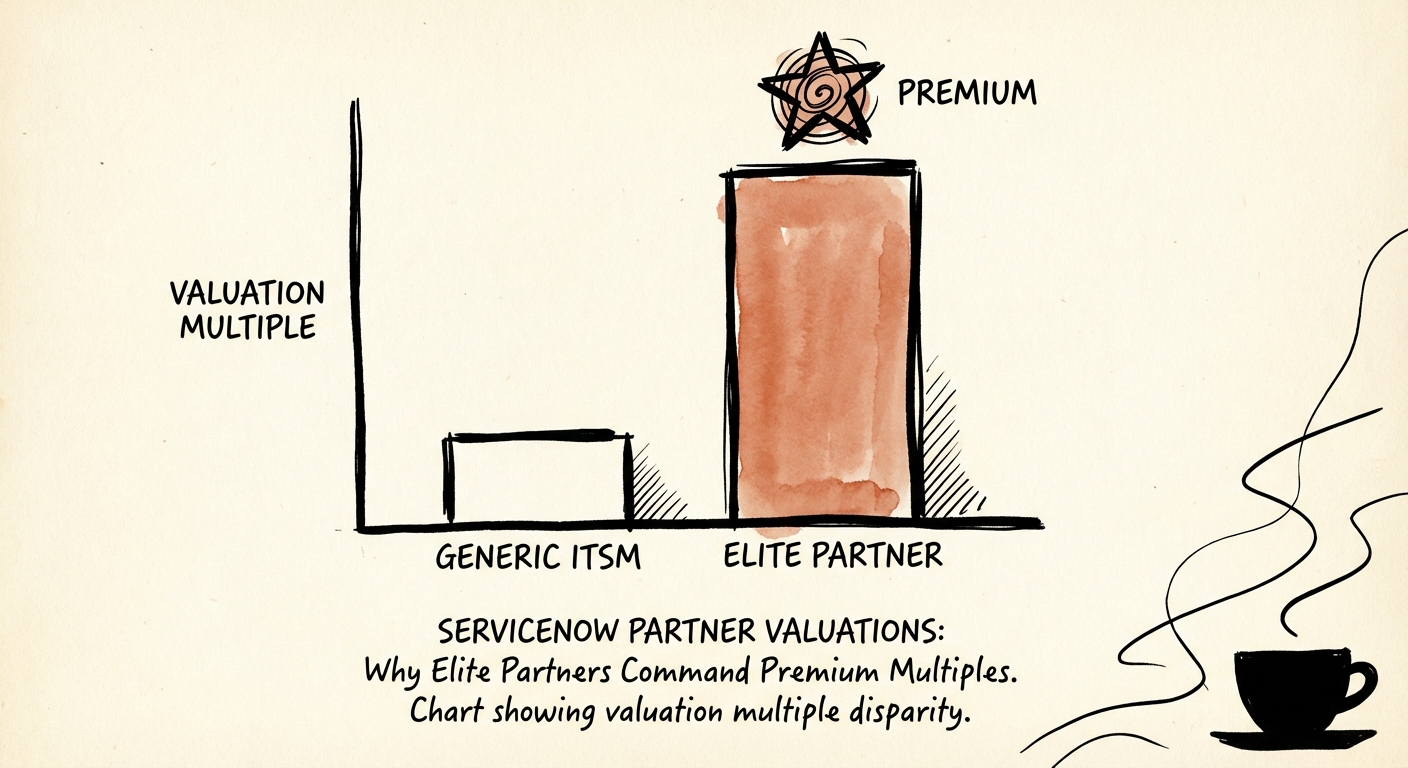
BRIEF · EXIT READINESS
ServiceNow Partner Valuations: Why Elite Partners Command Premium Multiples
ServiceNow Elite partners command 2.8x+ revenue multiples while generalists stall at 1x. Learn the valuation drivers: IP, managed services, and workflow specialization.
2.8x Top-Tier Revenue Multiple
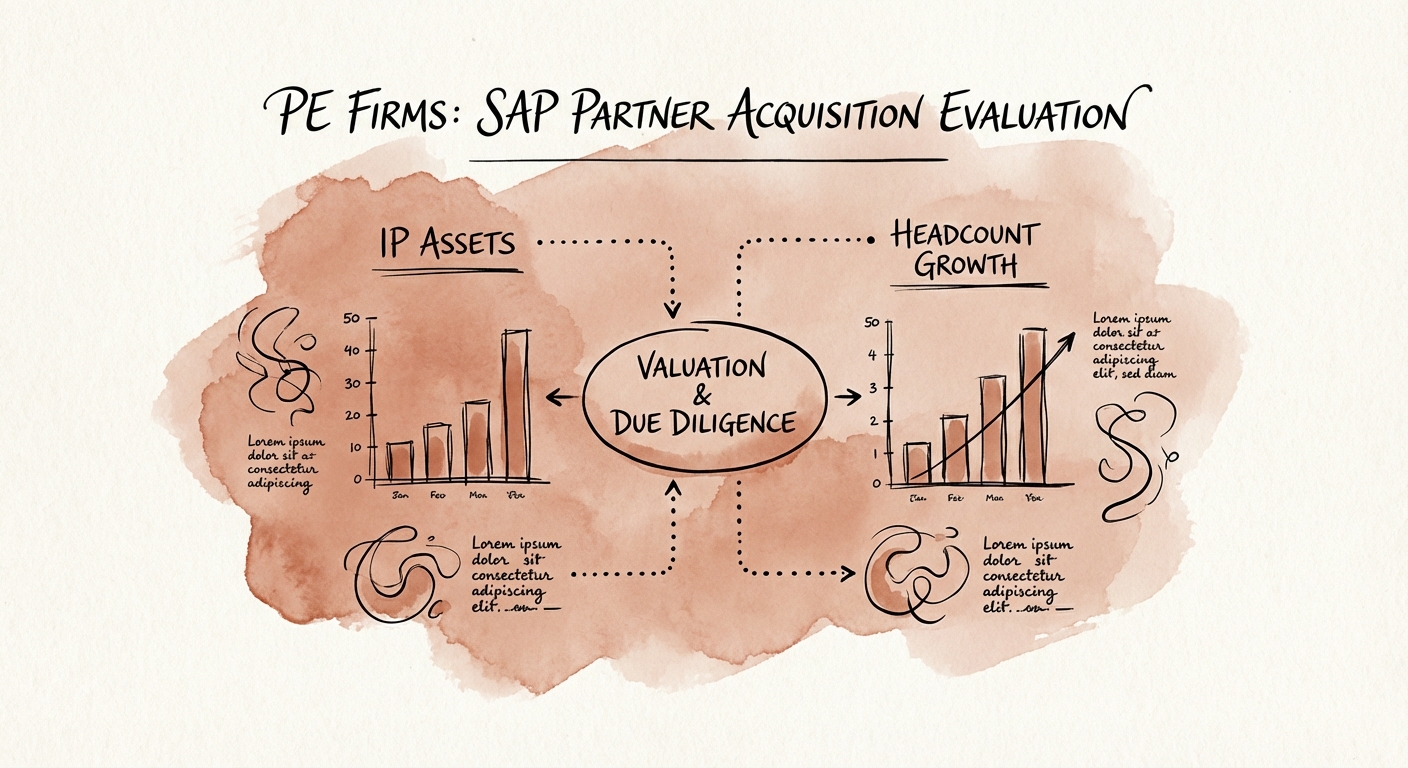
BRIEF · EXIT READINESS
SAP Implementation Partner Valuations: The "Body Shop" Discount vs. The IP Premium (2026 Guide)
A diagnostic framework for Private Equity firms evaluating SAP implementation partners. How to spot 'body shops,' value IP, and avoid the S/4HANA valuation trap.
12.8x Potential EV/EBITDA Multiple for IP-Led Firms
BRIEF · GTM EXECUTION
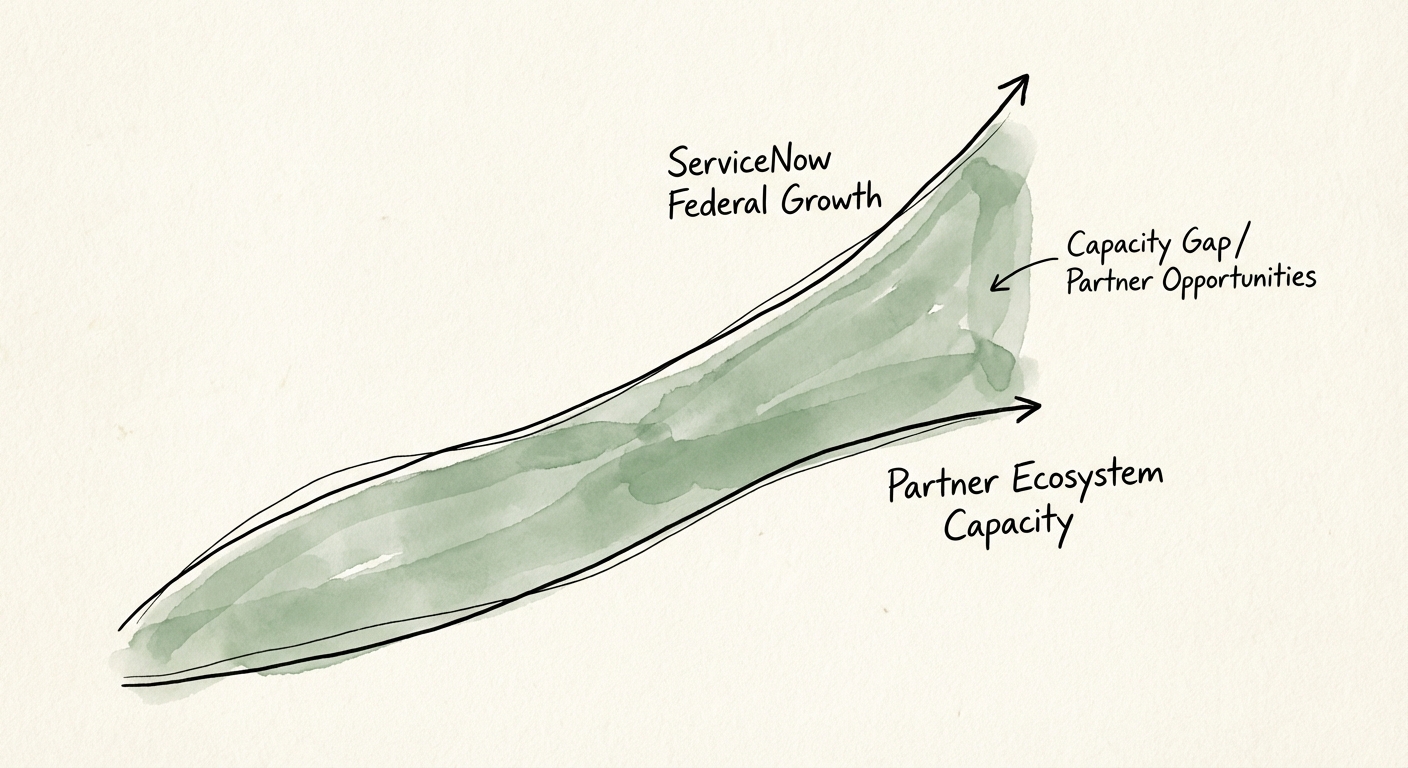
ServiceNow Federal Market Opportunity: The Partner Playbook
ServiceNow's OneGov agreement creates a federal modernization opening for partners. See how to pursue the market without overbuilding the FedRAMP path.
70% OneGov ITSM Pro Bundle Discount
BRIEF · TEAM & HIRING
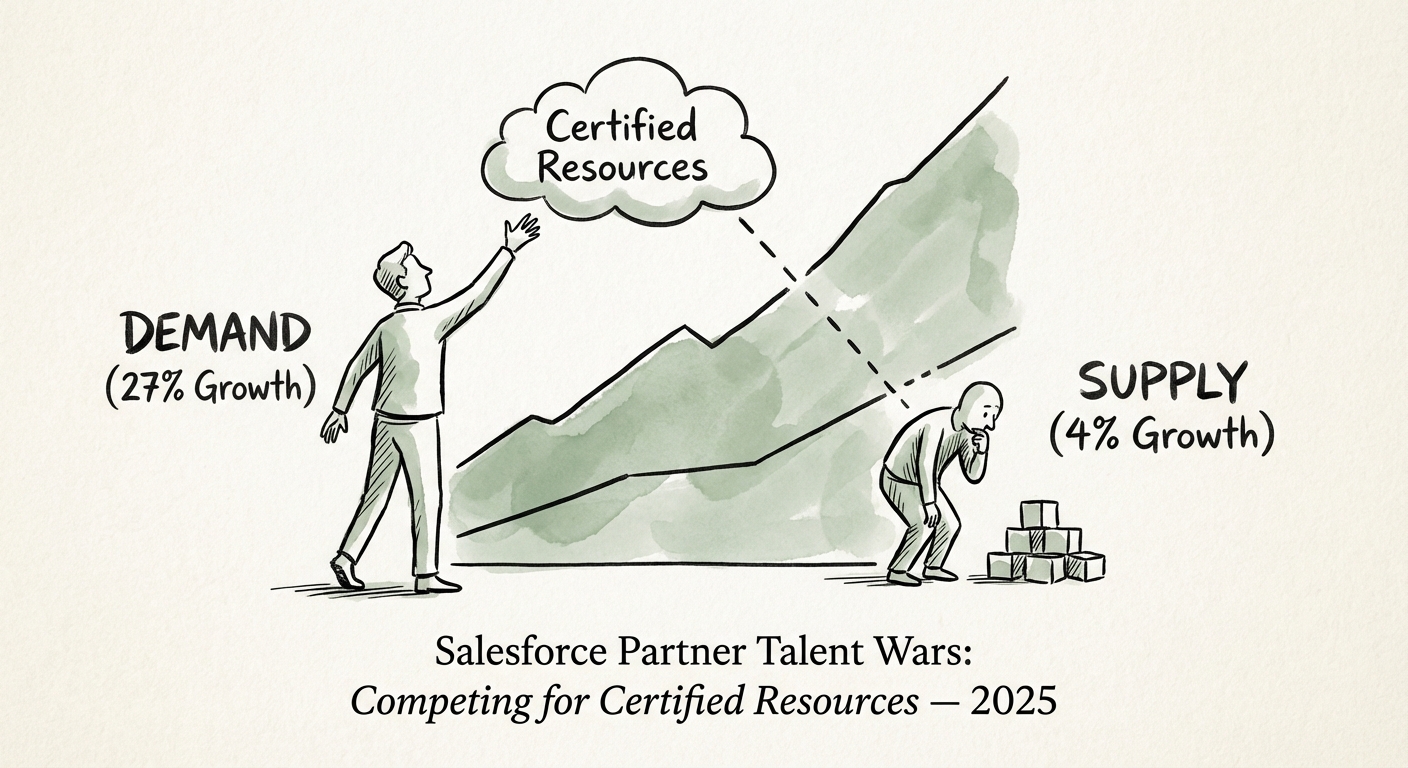
The Salesforce Partner Talent War: Why You Can't Buy Your Way to Scale
Data-backed guide for Salesforce Partners on winning the talent war. Salary benchmarks, attrition costs, and the 'Academy Model' for scaling past $10M revenue.
$300,000 Cost of Architect Turnover
BRIEF · EXIT READINESS
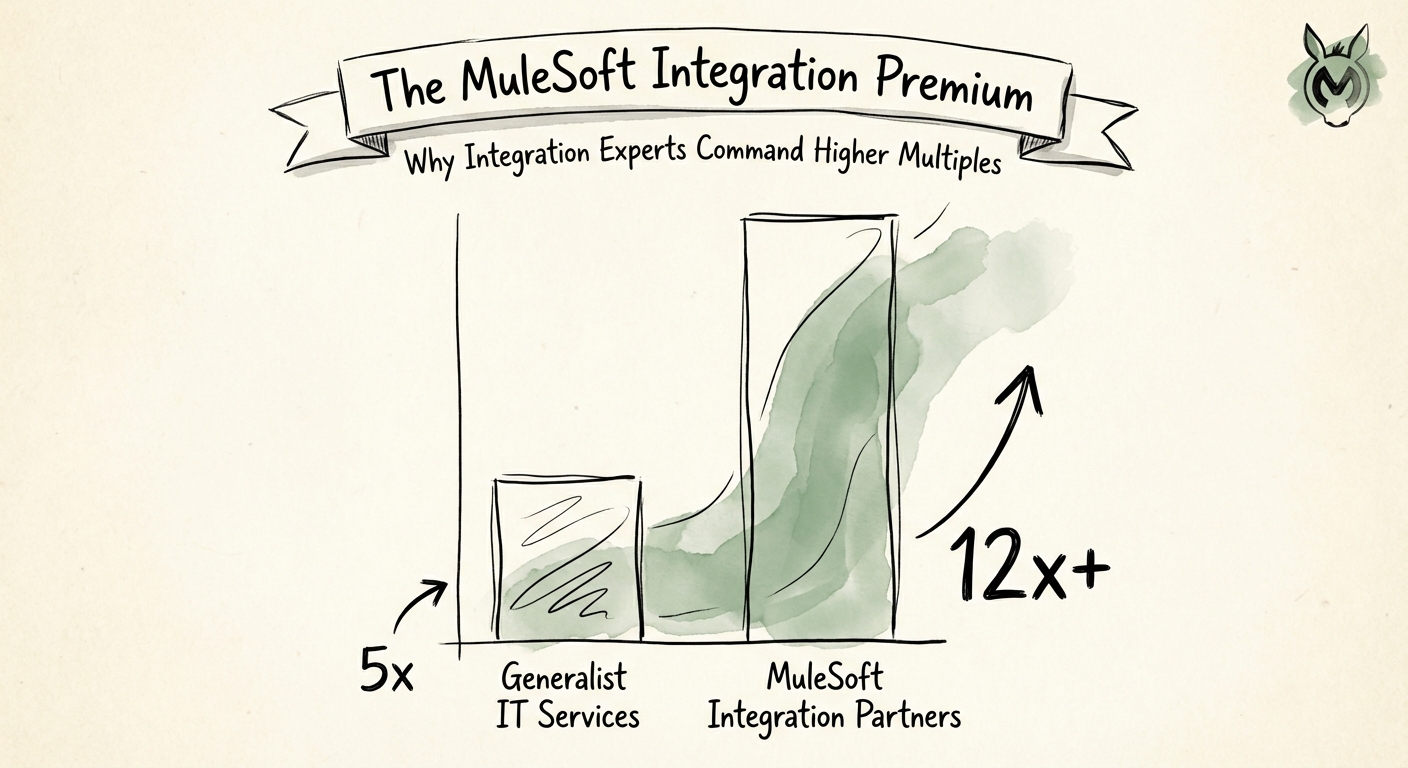
The MuleSoft Integration Premium: Why Integration Experts Command Higher Multiples
Why MuleSoft and Salesforce integration partners command 12x+ EBITDA multiples while generalist dev shops struggle at 5x. A valuation guide for IT services founders.
12x-14x EBITDA Multiple for Specialized Partners
BRIEF · EXIT READINESS
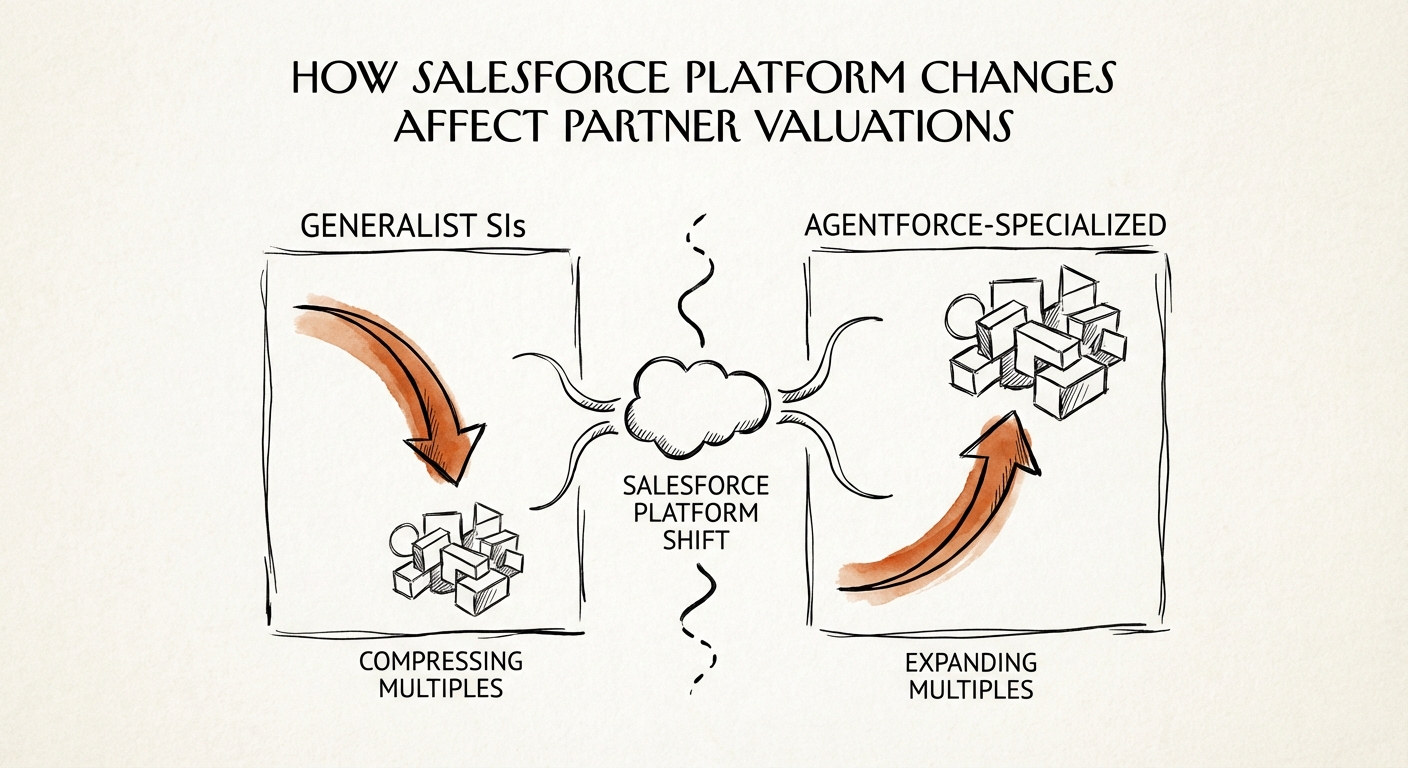
The Agentforce Discount: Why Traditional Salesforce SIs Are Losing 30% of Deal Value
Agentforce and Data Cloud are reshaping Salesforce partner valuations. Discover why traditional SIs face a 30% discount and how to pivot your portfolio for an AI-ready exit.
30% Valuation Discount for Legacy Service Models
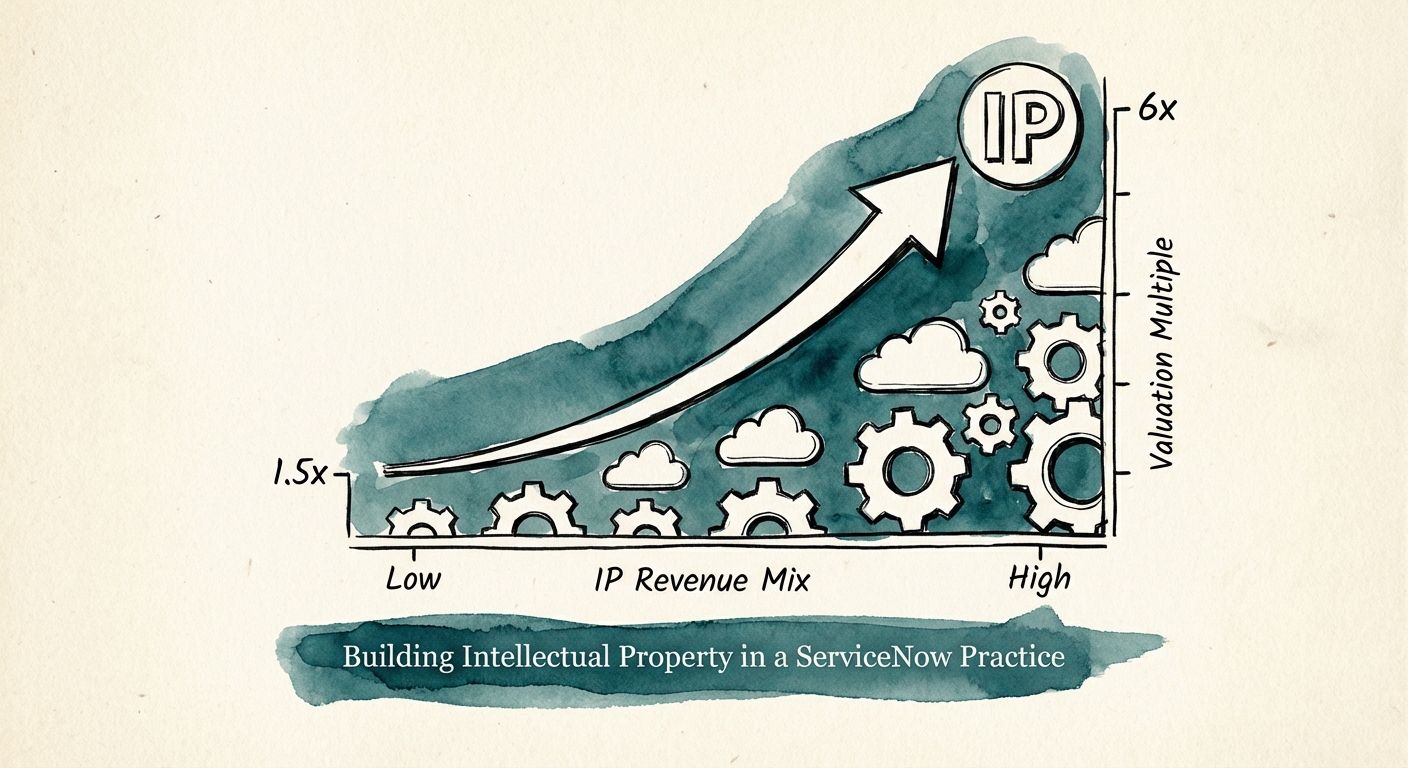
BRIEF · EXIT READINESS
The ServiceNow Trap: Why Your 'Elite' Status Won't Save Your Exit Multiple
Most ServiceNow partners are stuck in the 'services trap,' trading at 1.5x revenue. Learn how to harvest Intellectual Property (IP) to unlock 6x+ multiples and exit readiness.
300% Valuation Premium for IP-Enabled Firms
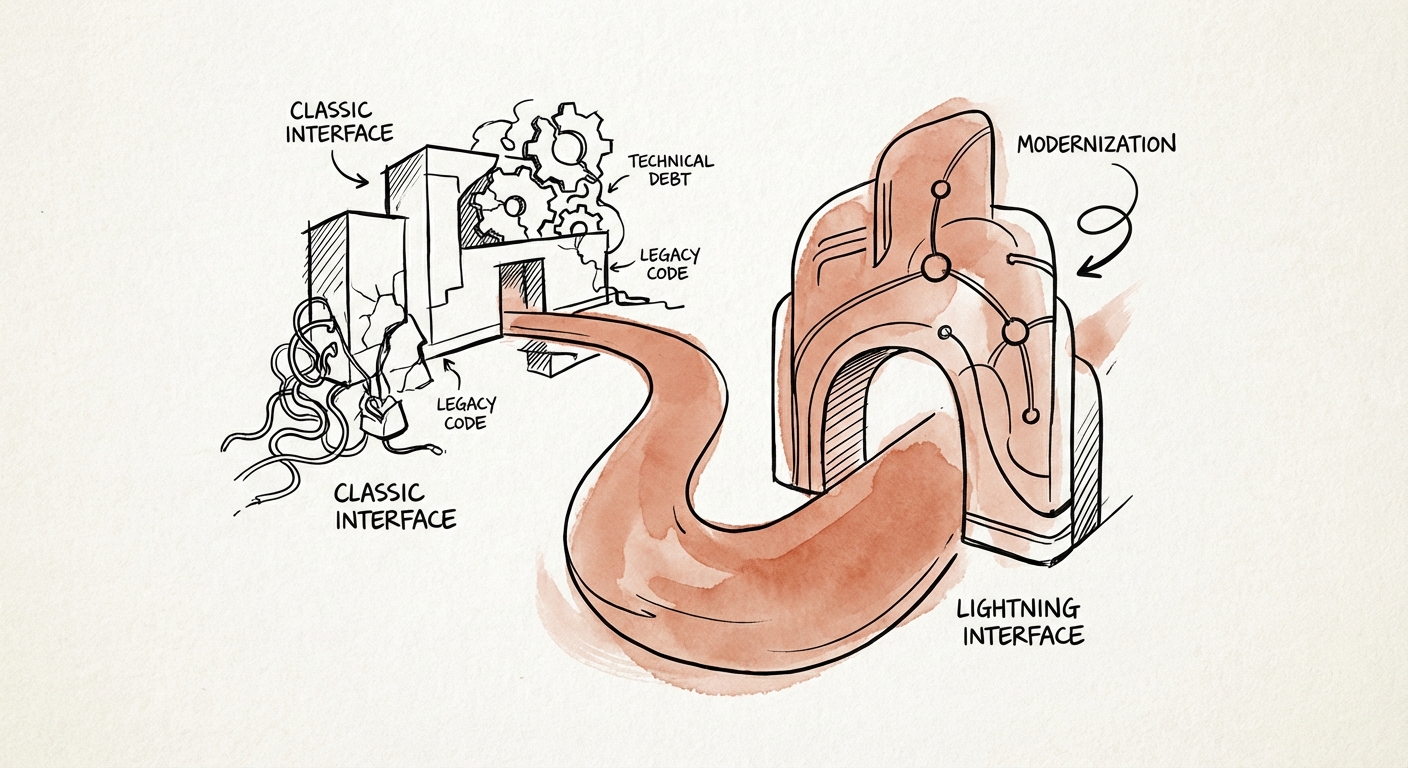
BRIEF · TECHNICAL DEBT
The 'Classic' Trap: Why Legacy Salesforce Instances Are a $2M CapEx Bomb Hidden in Plain Sight
Salesforce Classic is now a liability. Learn how to assess the $2M technical debt bomb in portfolio companies still running legacy CRM instances.
$500k+ Hidden Migration Cost
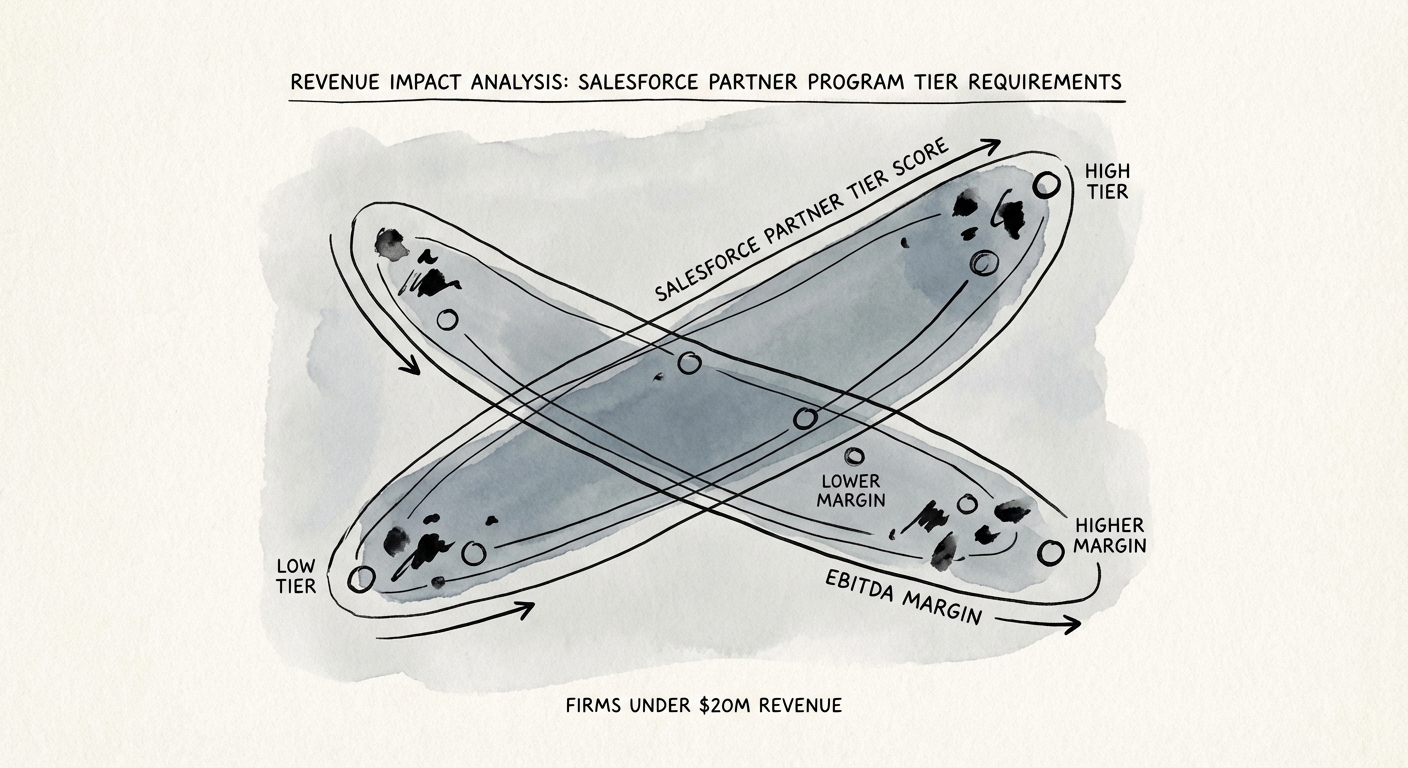
BRIEF · REVENUE ARCHITECTURE
The Summit Tier Trap: Why Chasing Salesforce Status Is Killing Your Margins
Is Summit status worth the cost? A diagnostic analysis of Salesforce's FY26 Partner Program requirements, Trailblazer Score changes, and the hidden margin impact of chasing tiers.
29% Margin Erosion
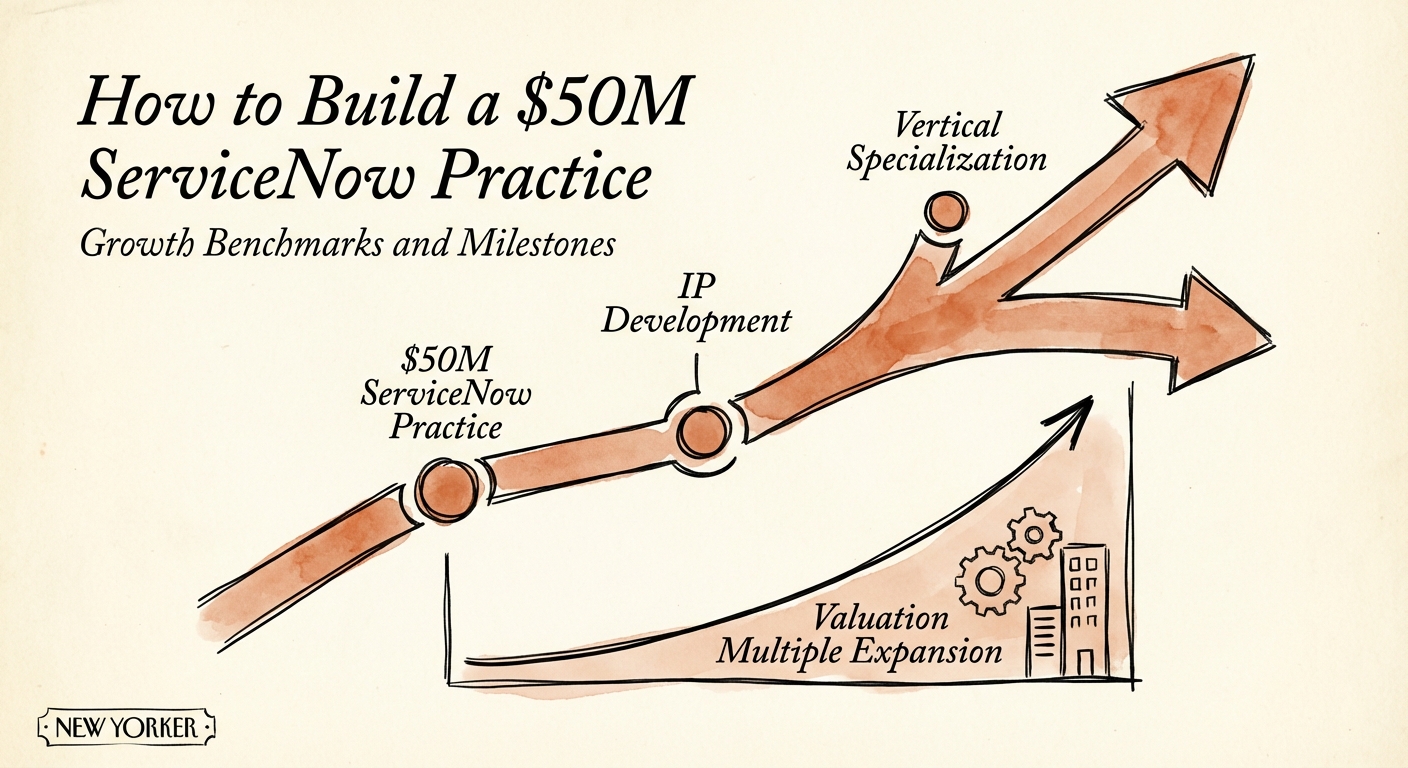
BRIEF · EXIT READINESS
How to Build a $50M ServiceNow Practice: Growth Benchmarks and Milestones
A diagnostic guide for ServiceNow partners scaling from $10M to $50M. Benchmarks for bill rates, utilization, EBITDA margins, and valuation multiples.
12x Top-Tier EBITDA Valuation Multiple
BRIEF · PROCESS DOCUMENTATION
The Transferability Premium: Why Documented Salesforce Practices Sell for 2x More
Buyers pay for systems, not heroes. Learn why documented Salesforce practices trade at a 2x premium and how to build a 'Transferability' roadmap in 90 days.
2x Valuation Multiple Premium
BRIEF · TEAM & HIRING
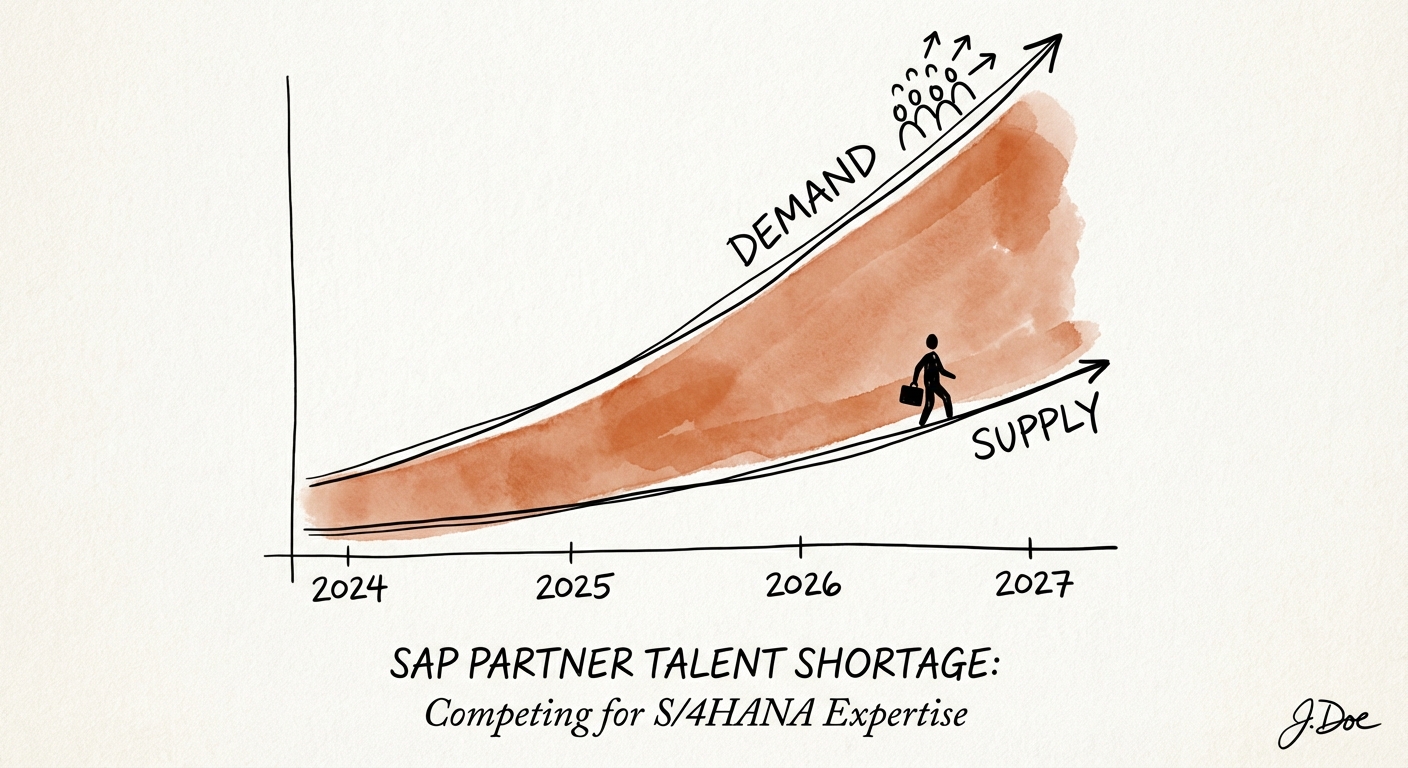
The SAP Talent "Apocalypse": Why You Can't Hire Your Way to S/4HANA Success
The SAP S/4HANA talent gap has hit a deficit of 40,000 experts. Learn why day rates are skyrocketing and how to build an 'Academy Model' to survive the 2027 deadline.
40,000 Global Deficit of SAP Experts
BRIEF · EXIT READINESS
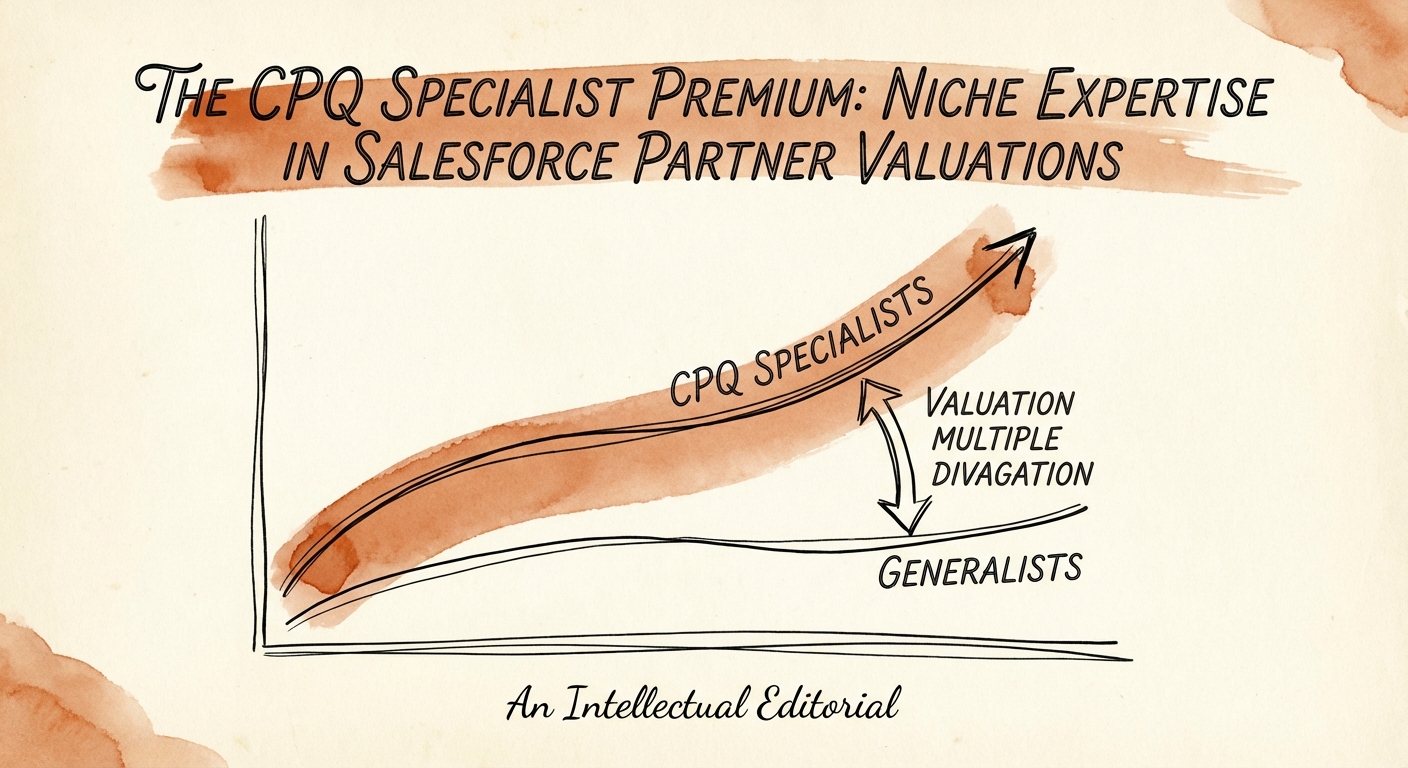
The CPQ Specialist Premium: Why Revenue Cloud Experts Command 14x Multiples
Generalist Salesforce partners trade at 8x EBITDA. CPQ and Revenue Cloud specialists command 14x. Here is the diagnostic on why niche expertise drives exit value.
14x EBITDA Multiple
BRIEF · PROCESS DOCUMENTATION
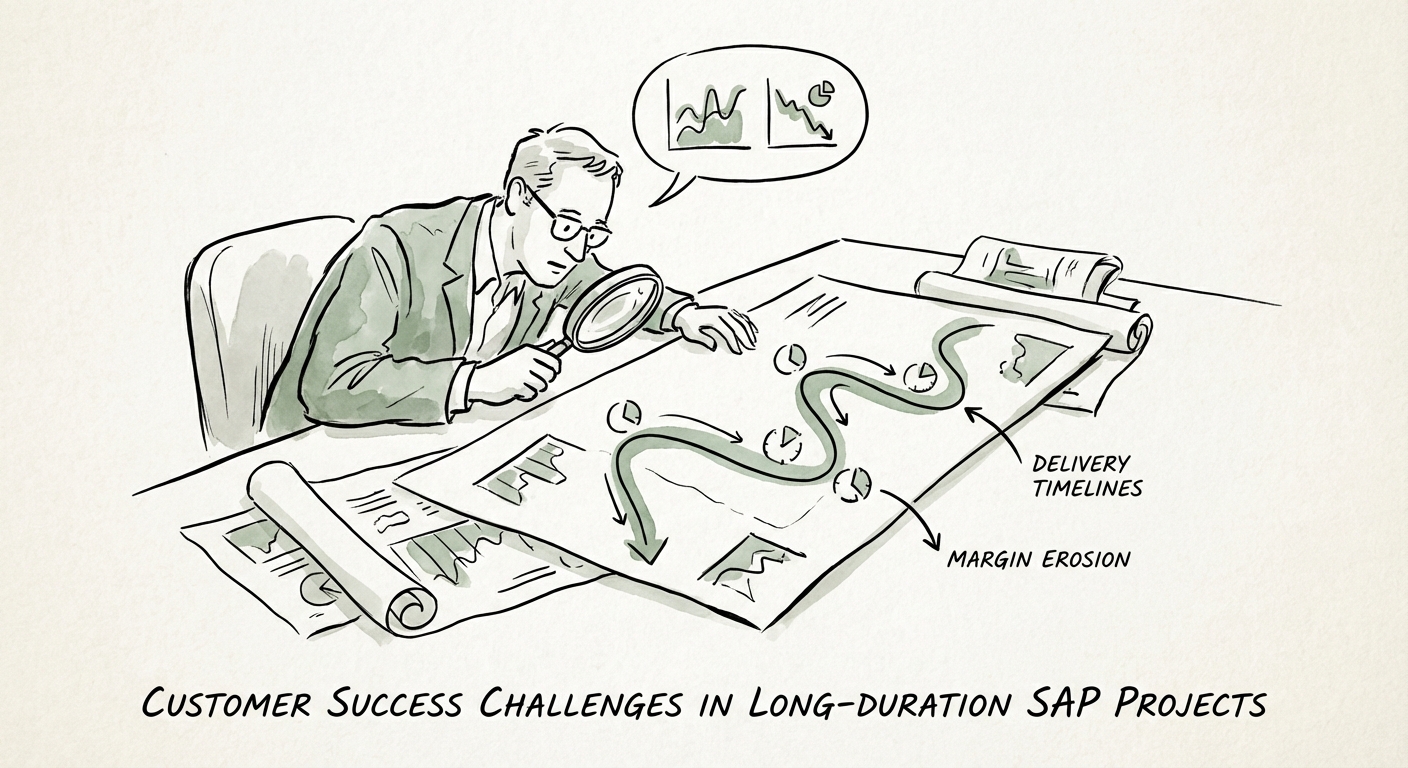
Customer Success Challenges in Long-Duration SAP Projects: The 'Delivery Drift' Diagnostic
Why 18-month SAP projects bleed EBITDA. A diagnostic guide for Service CEOs on stopping 'Delivery Drift' and fixing margin erosion through process documentation.
30% Average Schedule Overrun