BRIEF · UNIT ECONOMICS
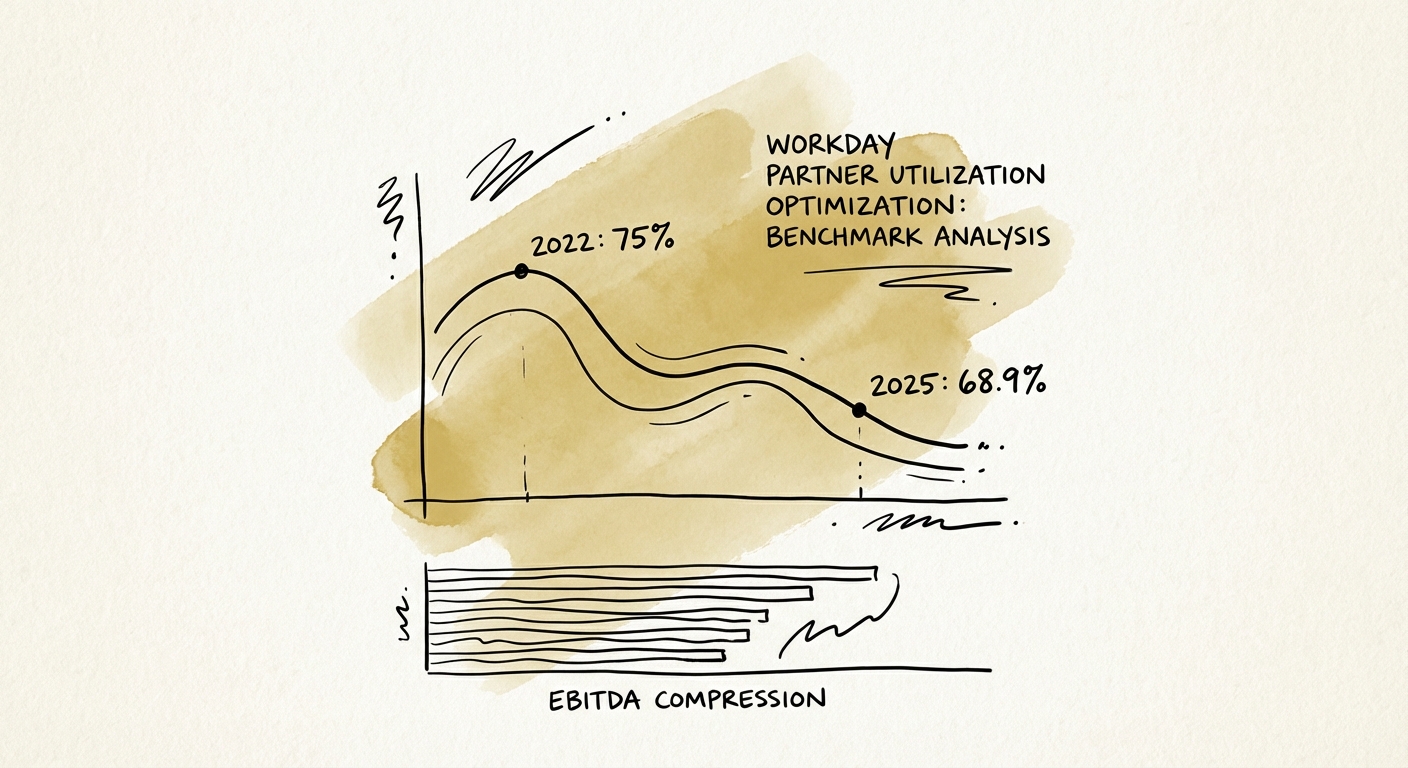
The Utilization Trap: Why Workday Partners Are Bleeding EBITDA at 69% Utilization
New 2025 SPI data reveals Workday partner utilization has dropped to 68.9%, crushing EBITDA to 9.8%. Here is the diagnostic playbook to fix your staffing mix.
68.9% Avg. Billable Utilization (2025)
BRIEF · UNIT ECONOMICS
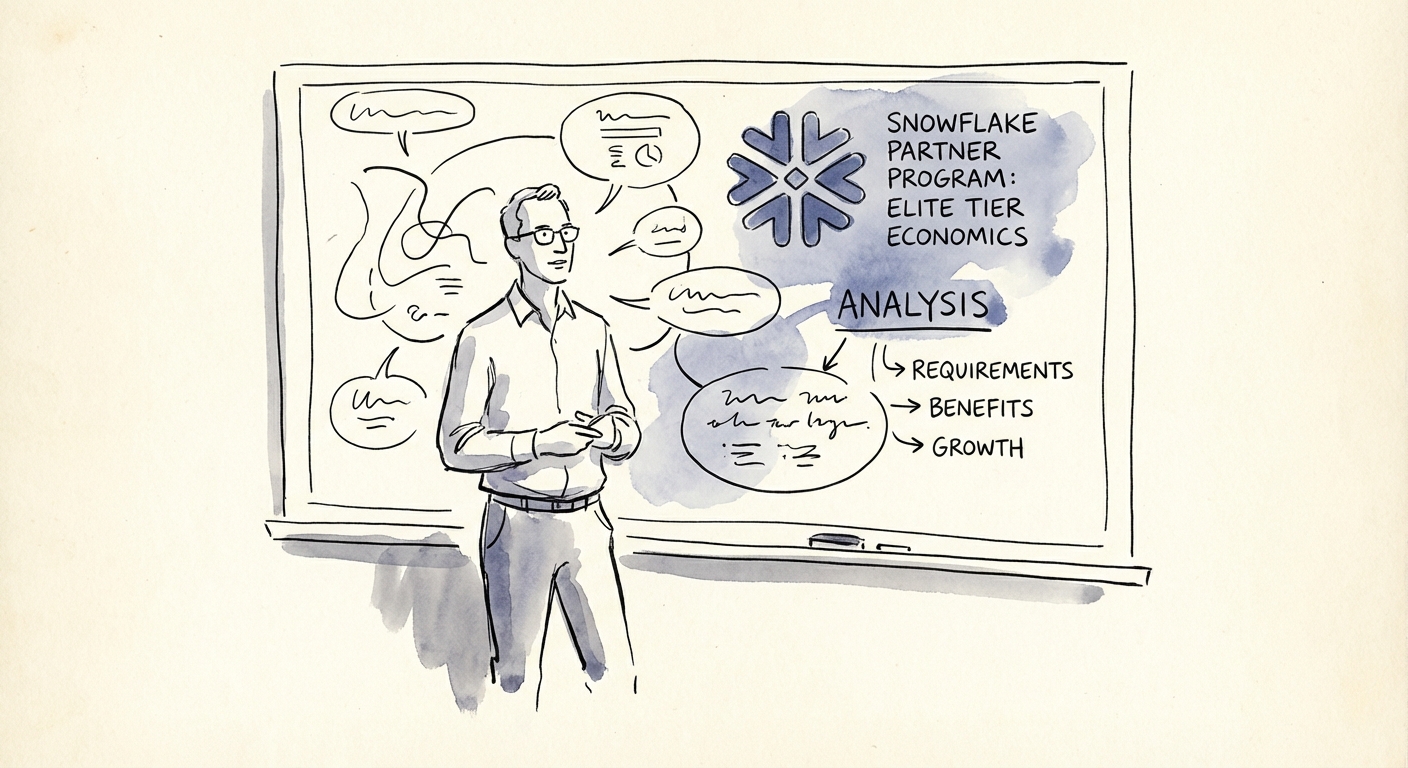
Snowflake Elite Partner Economics: The 22% Margin Tax You Didn't Budget For
Analysis of Snowflake Elite Partner economics for 2026. Why the 'Elite' tier costs 22% of EBITDA and how to pivot from low-margin implementation to high-value vertical IP.
22% EBITDA Erosion
BRIEF · REVENUE ARCHITECTURE
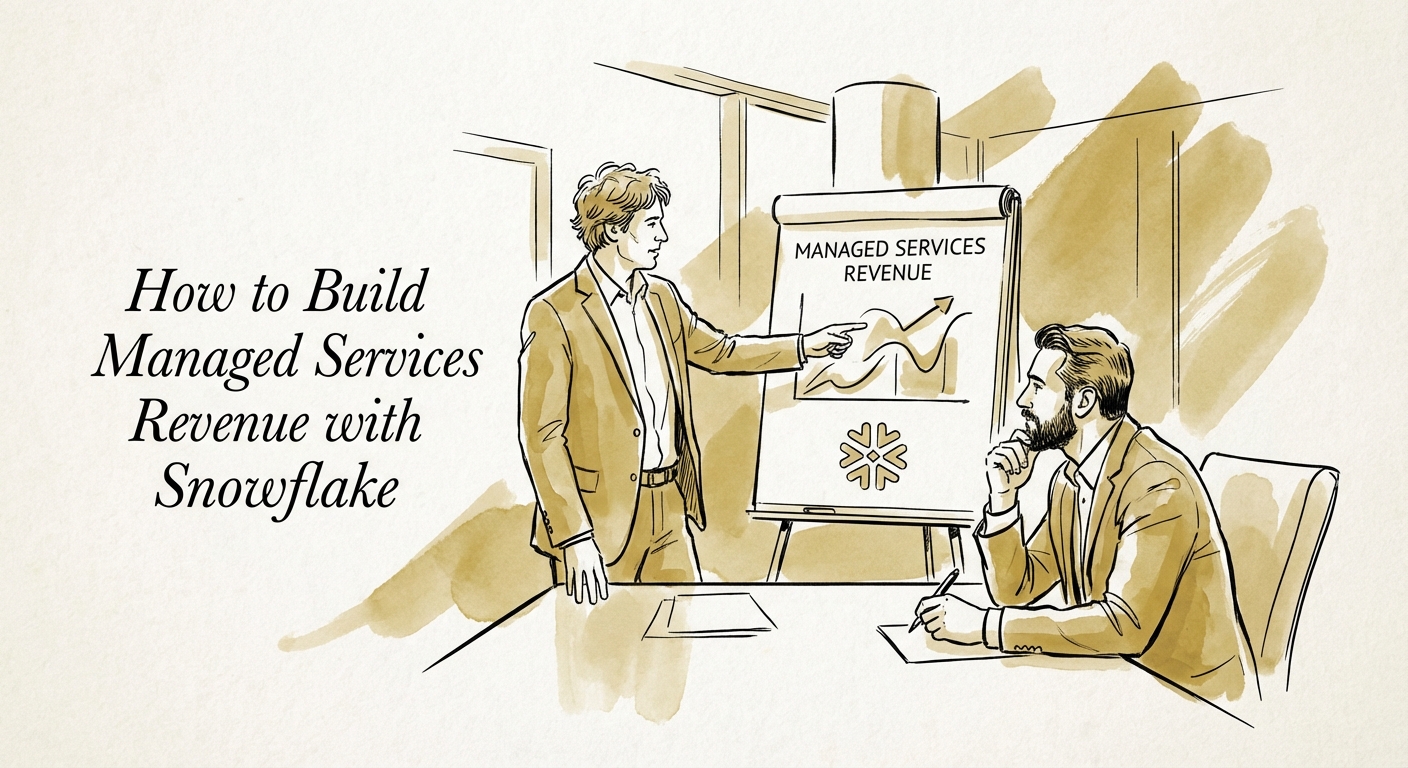
Snowflake Consultants: Why Your Best Customers Quietly Become Your Worst Risk
Snowflake bill shock kills consulting relationships. Here's how to turn credit consumption into recurring managed-services revenue your buyer values at a real multiple.
32% Cloud Spend Wasted (The MSP Opportunity)
BRIEF · TECHNICAL DEBT
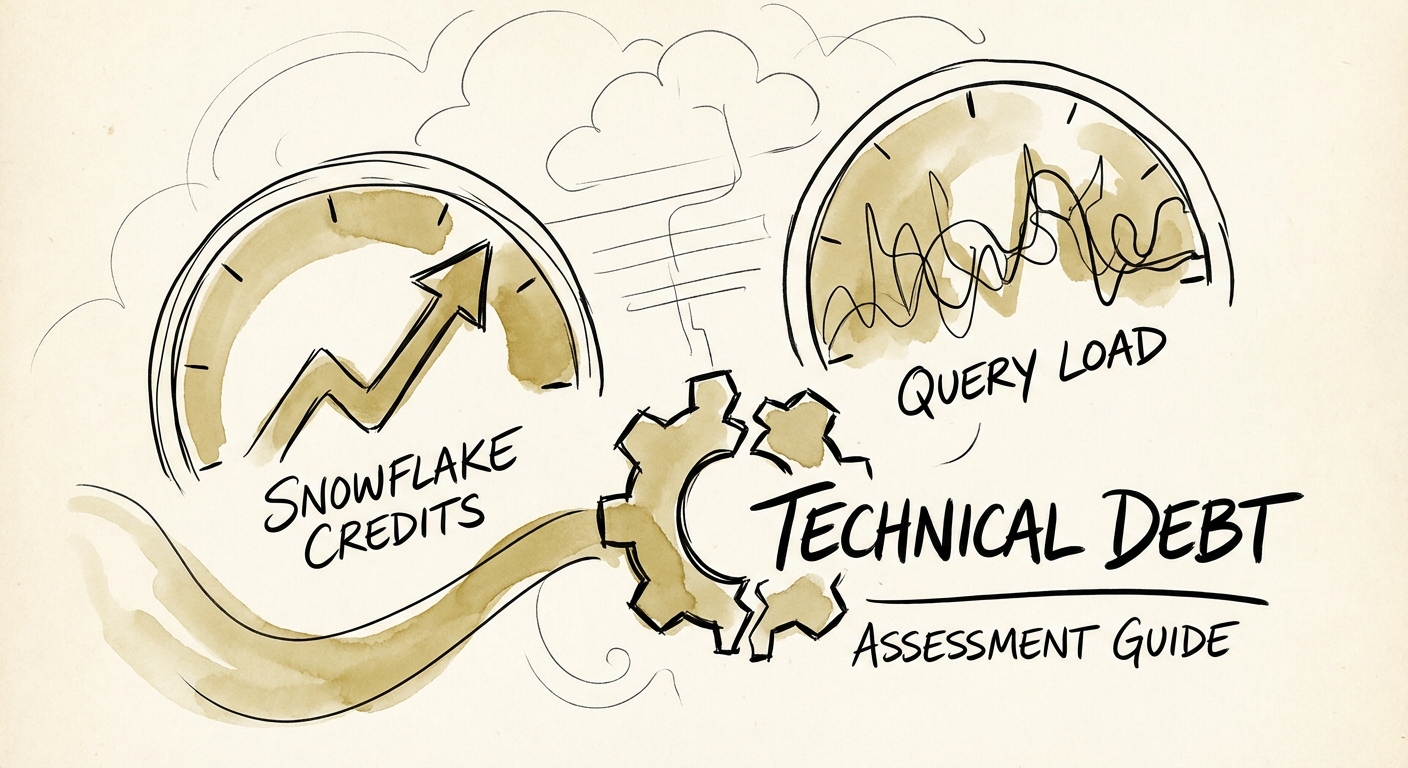
The 'Modern Data Stack' Trap: Why Your Snowflake Implementation Is a $2M Liability
73% of Snowflake implementations are wasting cash. Here is the 10-day technical due diligence framework for PE Operating Partners to spot 'lift and shift' liabilities and $2M cost traps.
40% Avg. Credit Waste in Lift-and-Shift Deploys
BRIEF · EXIT READINESS
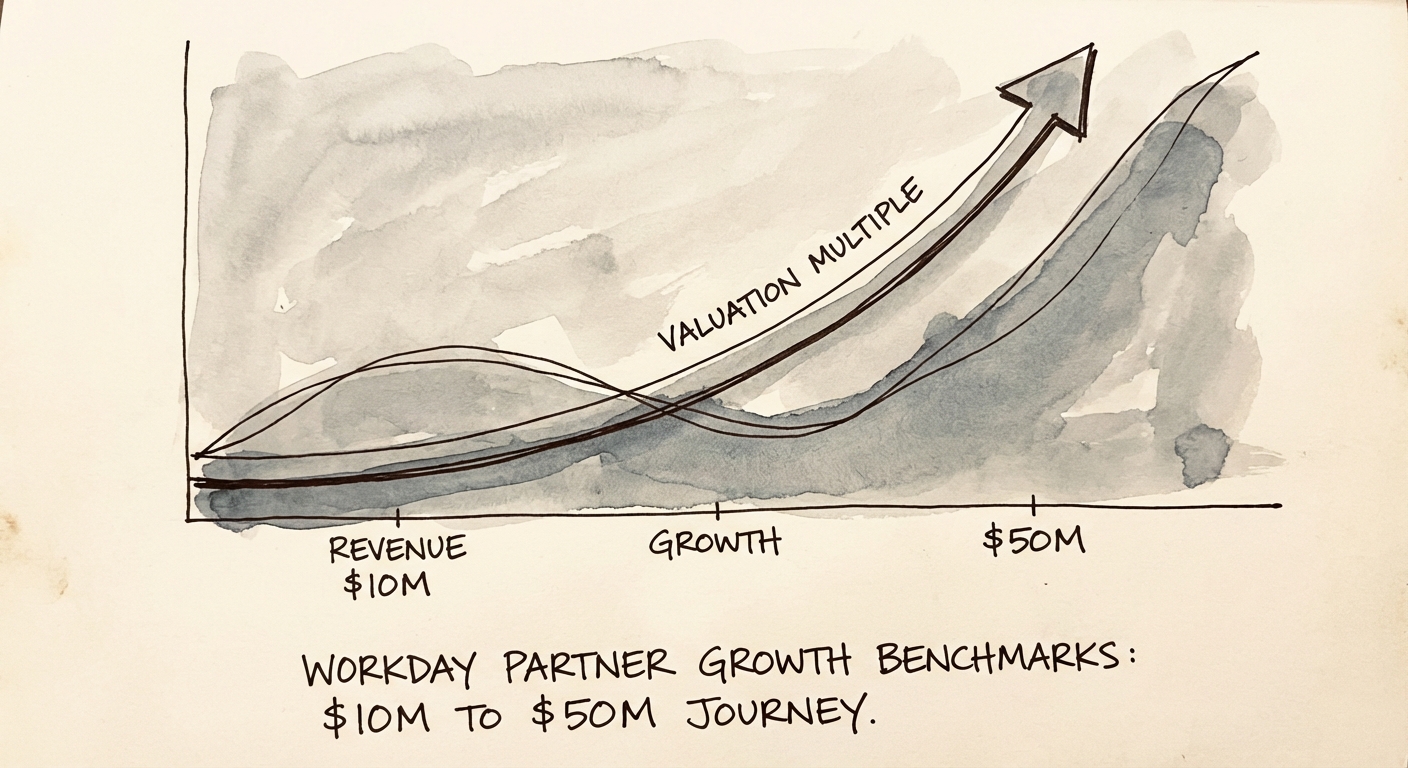
Workday Partner Growth Benchmarks: The Dangerous Journey from $10M to $50M
Benchmarks for scaling a Workday partner practice from $10M to $50M. Revenue per employee, EBITDA targets, and the specialization strategy that drives 12x exit multiples.
$225,000 Target Revenue Per Employee
BRIEF · MIGRATION & INTEGRATION
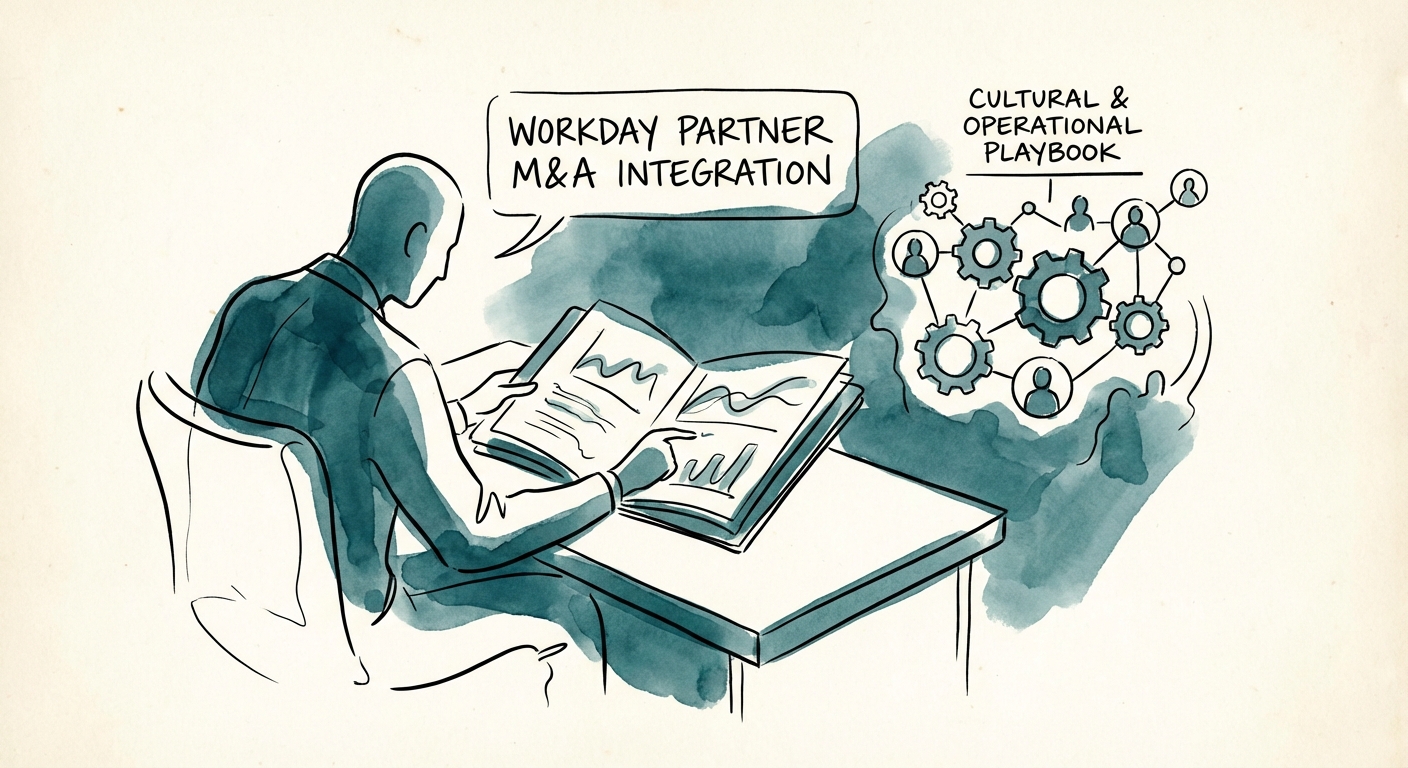
The 'Velvet Rope' Playbook: Why Workday Partner Integrations Fail (And How to Fix Them)
Workday partners face unique M&A risks. Learn why 33% of talent leaves post-acquisition and how to use the 'Ring-Fence' strategy to protect deal value.
33% Post-Acquisition Talent Attrition Rate
BRIEF · GTM EXECUTION
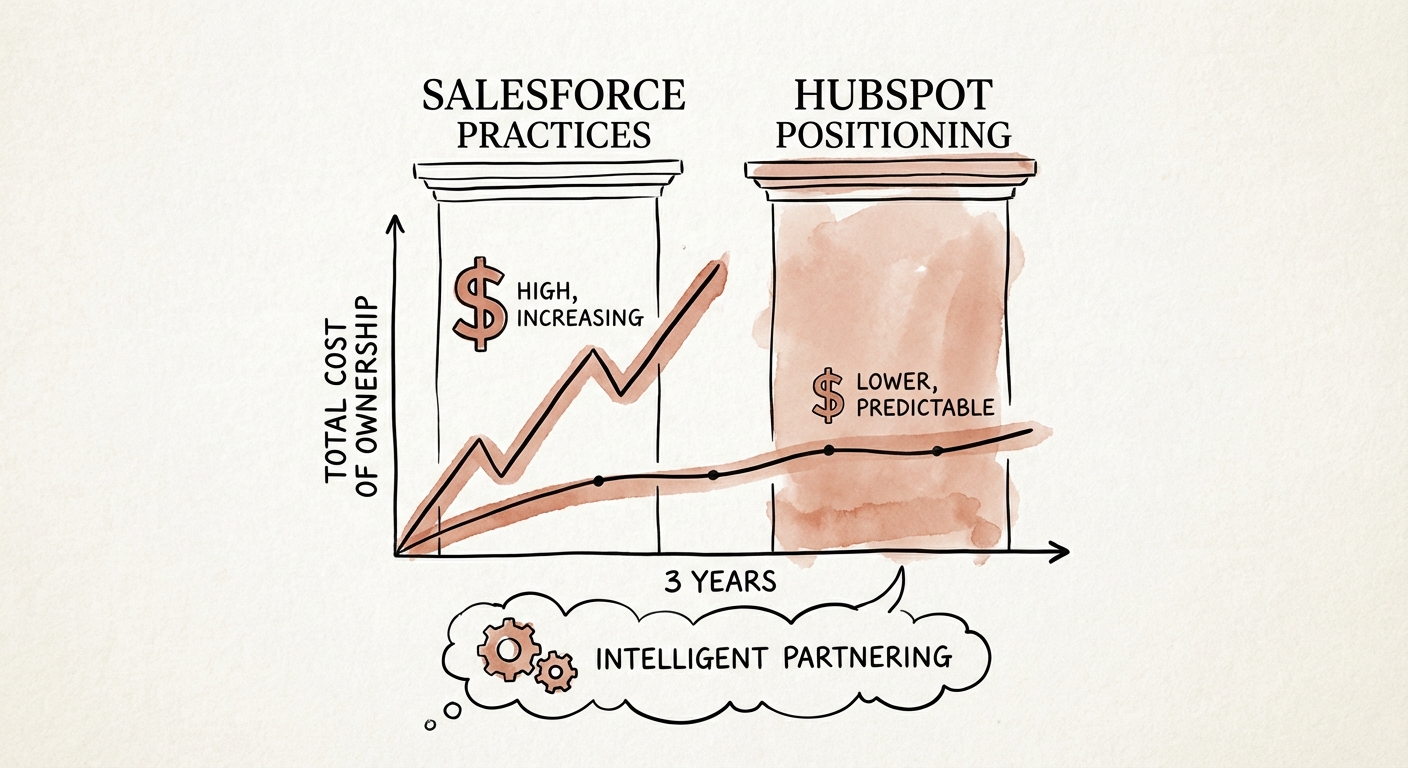
The 'Enterprise' CRM Trap: Why Salesforce Practices Are Bleeding Your Series B Budget
Stop paying the 'Complexity Tax.' A 2026 diagnostic comparing HubSpot vs. Salesforce implementation costs, partner incentives, and Total Cost of Ownership for Series B/C scale-ups.
70% Implementation Failure Rate
BRIEF · EXIT READINESS
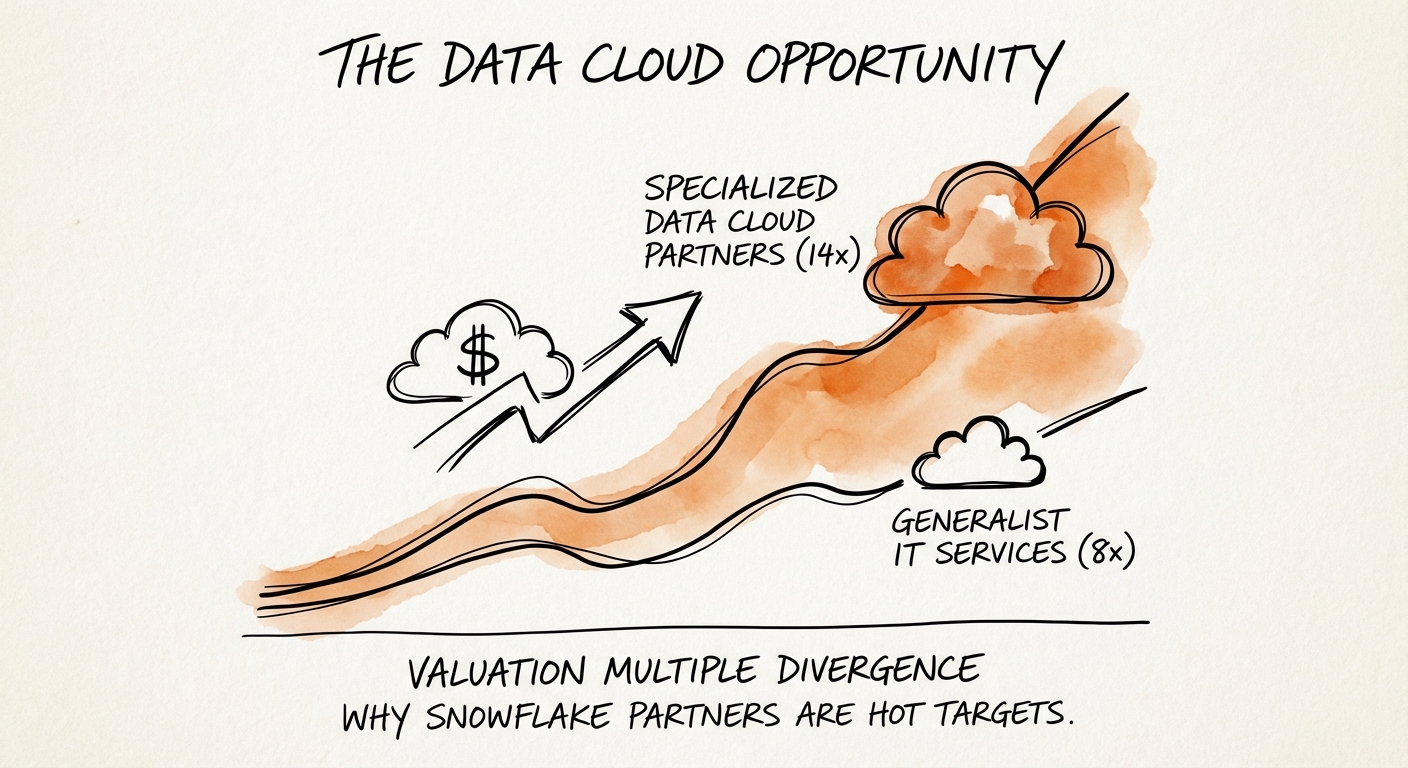
Why a Snowflake Partner's Best Asset Doesn't Show Up on the P&L
Two Snowflake partners can show identical revenue and EBITDA, yet one is worth 14x and the other 7x. The difference is consumption influence. Here's how to spot it.
14x EBITDA Multiple (Specialist)
BRIEF · EXIT READINESS
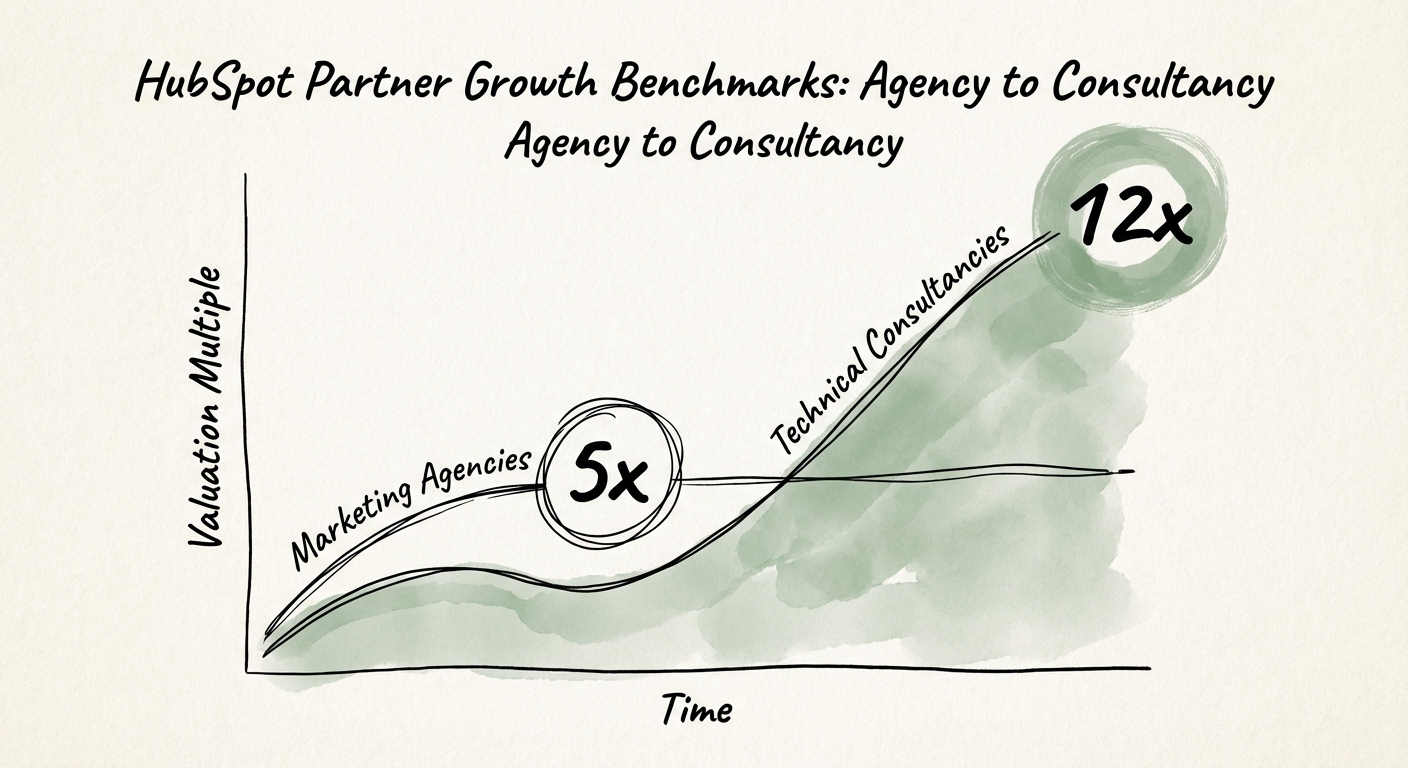
The Great Bifurcation: Why HubSpot "Agencies" Trade at 5x and "Consultancies" Trade at 12x
Are you a 5x HubSpot Agency or a 12x RevOps Consultancy? 2026 growth benchmarks, valuation multiples, and the pivot strategy for scaling partners.
12x EBITDA Multiple
BRIEF · EXIT READINESS
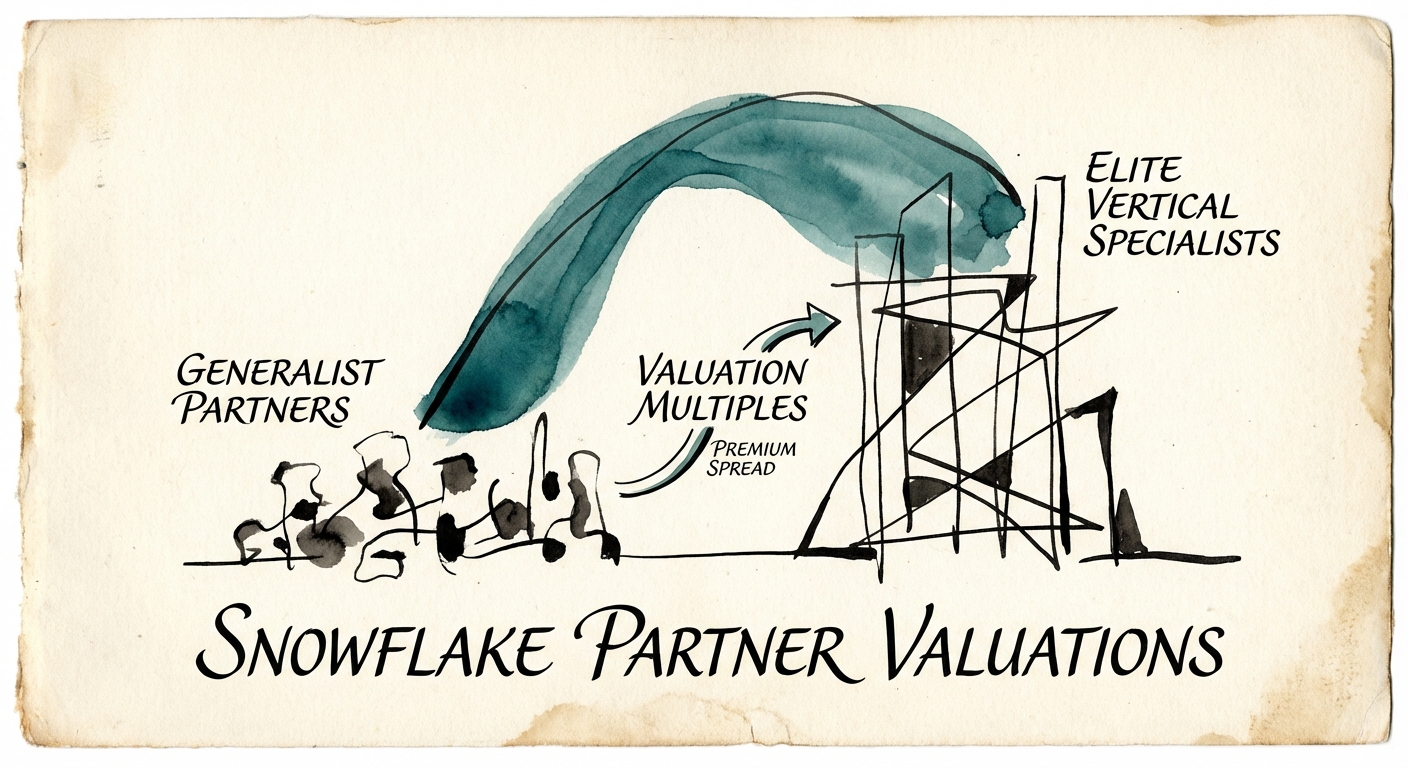
Snowflake Partner Valuations: The Gap Between "Body Shop" and "Data Product"
Why some Snowflake partners trade at 14x EBITDA while others struggle at 6x. A diagnostic guide for PE investors and founders on the 'Elite' premium.
14x EBITDA Multiple (Elite)
BRIEF · EXIT READINESS
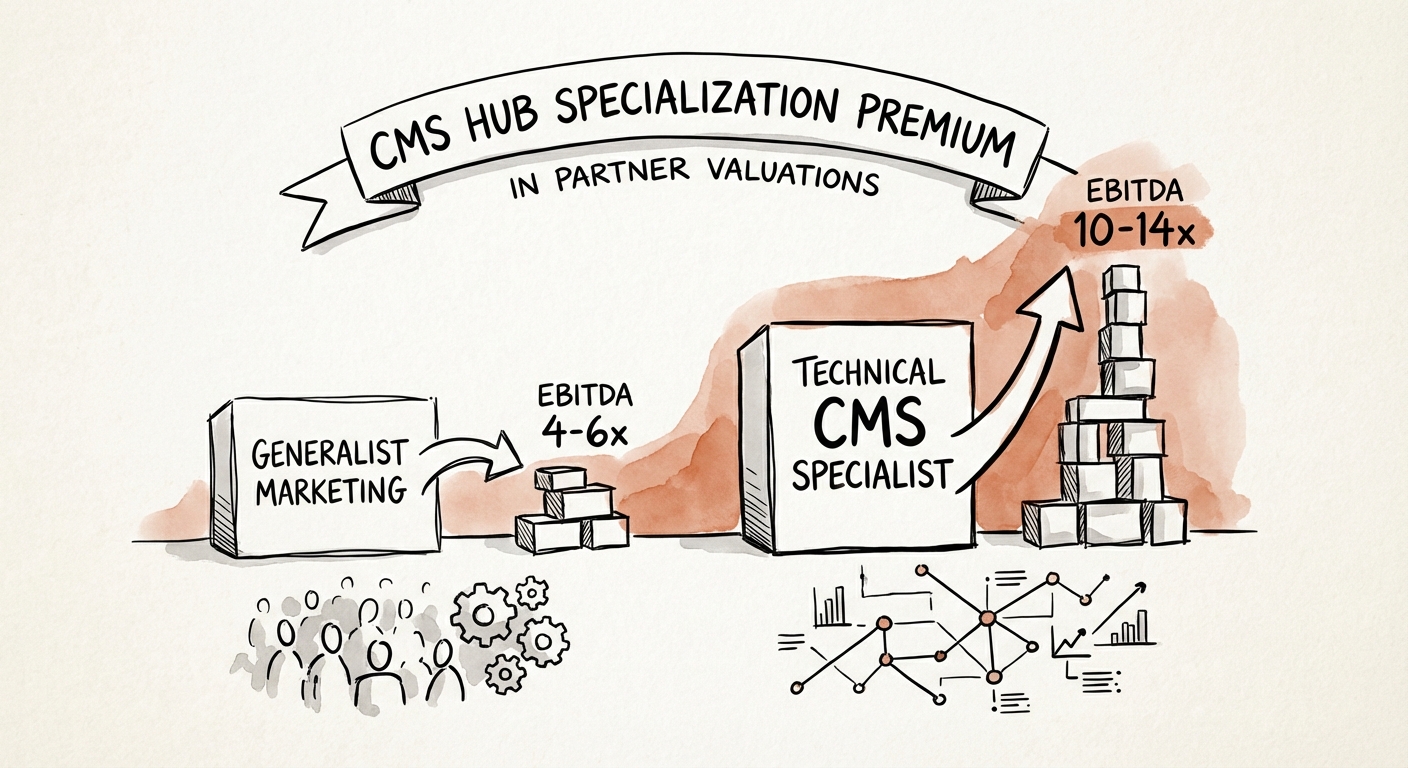
Two HubSpot Partners, Same Revenue, One Term Sheet: The Content Hub Divide
Two HubSpot partners booking $10M can be worth wildly different sums. Why Content Hub technical depth — HubDB, serverless, partitioning — drives a 12x EBITDA exit.
12x Target EBITDA Multiple
BRIEF · UNIT ECONOMICS
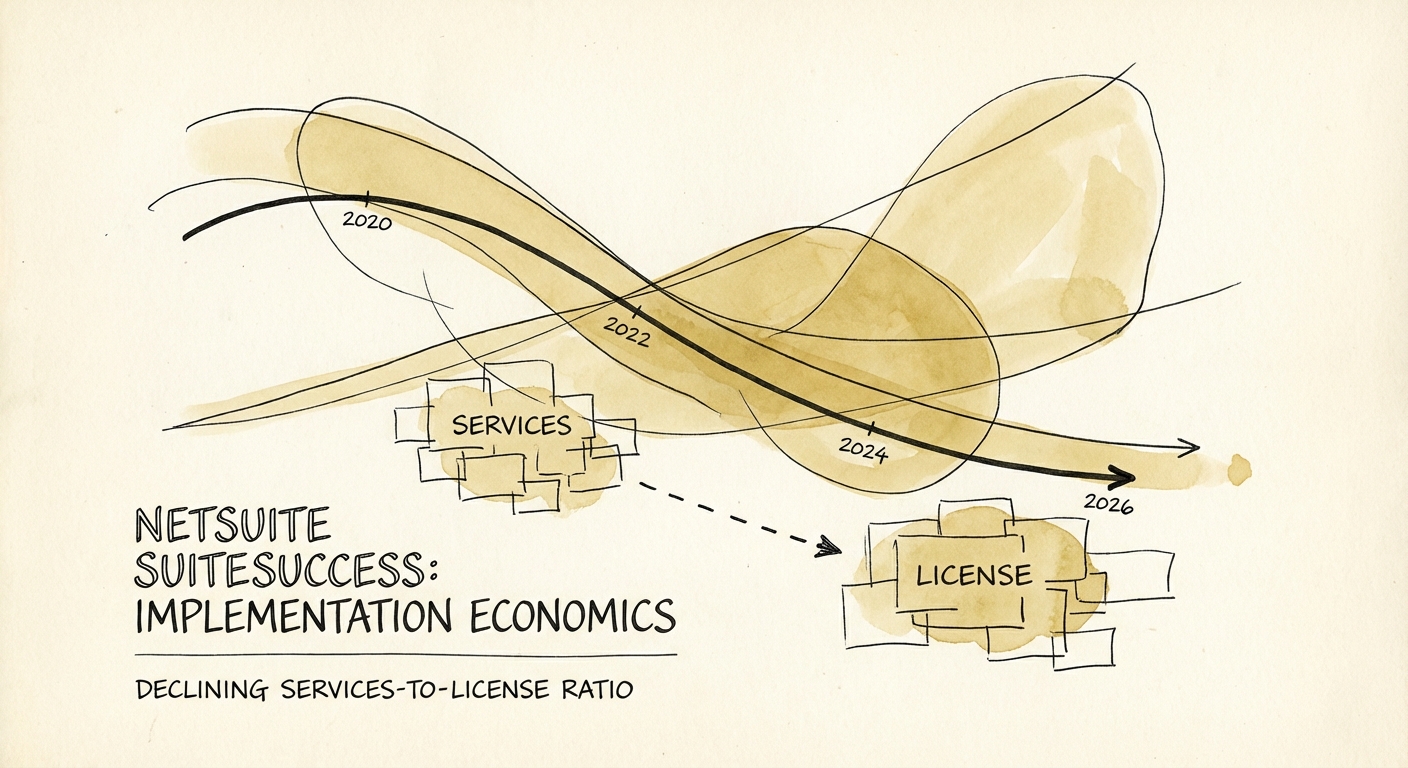
The SuiteSuccess Paradox: Why Your Implementation Margins Are Collapsing (And How to Fix Them)
SuiteSuccess accelerates go-lives but compresses service margins. Learn how to fix your unit economics and survive the shift to 'productized' services.
68.9% Avg. Billable Utilization (2025 SPI Benchmark)
BRIEF · UNIT ECONOMICS
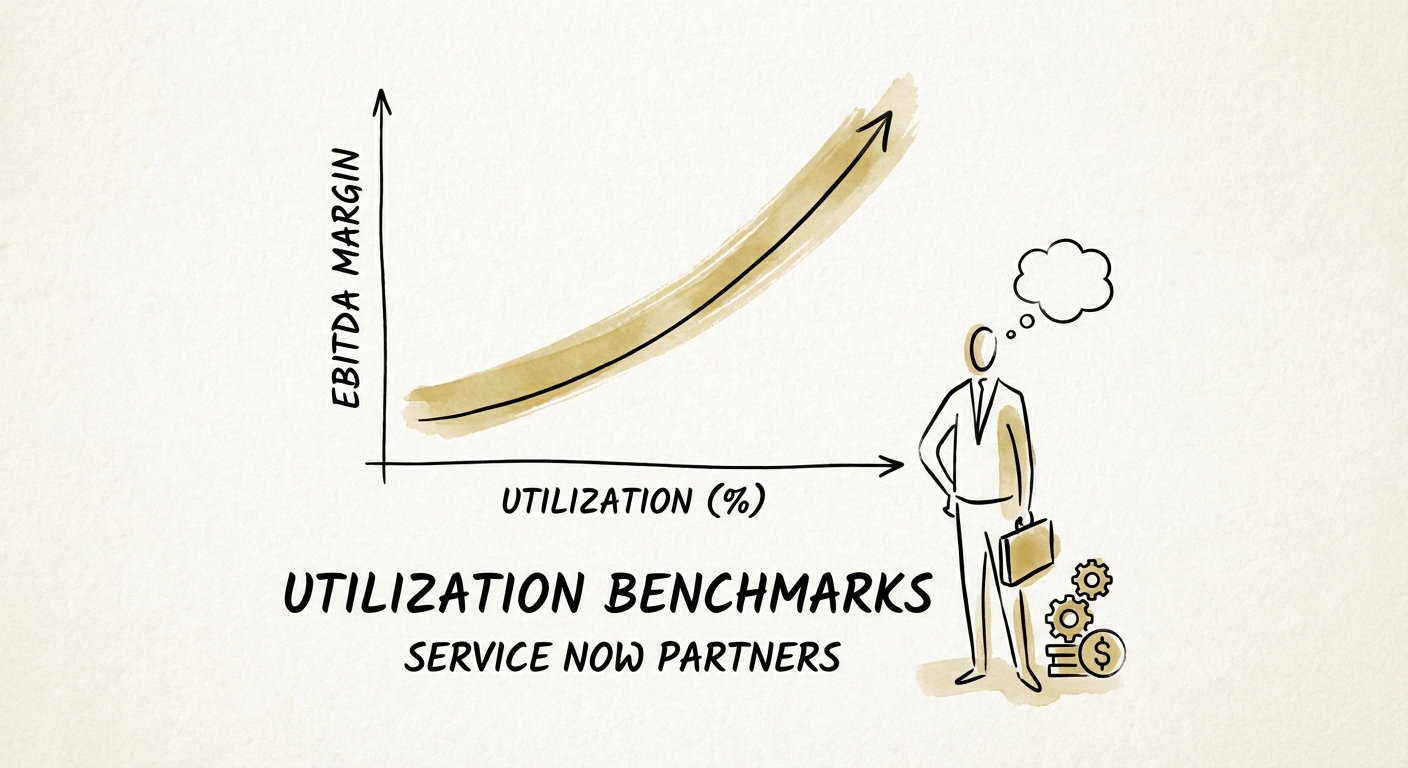
Utilization Benchmarks for ServiceNow Implementation Consultants: The Profitability Trap
New 2026 data: Average billable utilization for ServiceNow partners has dropped to 68.9%. See the role-based benchmarks for Architects vs. Consultants.
68.9% Avg. Billable Utilization (2025)
BRIEF · EXIT READINESS
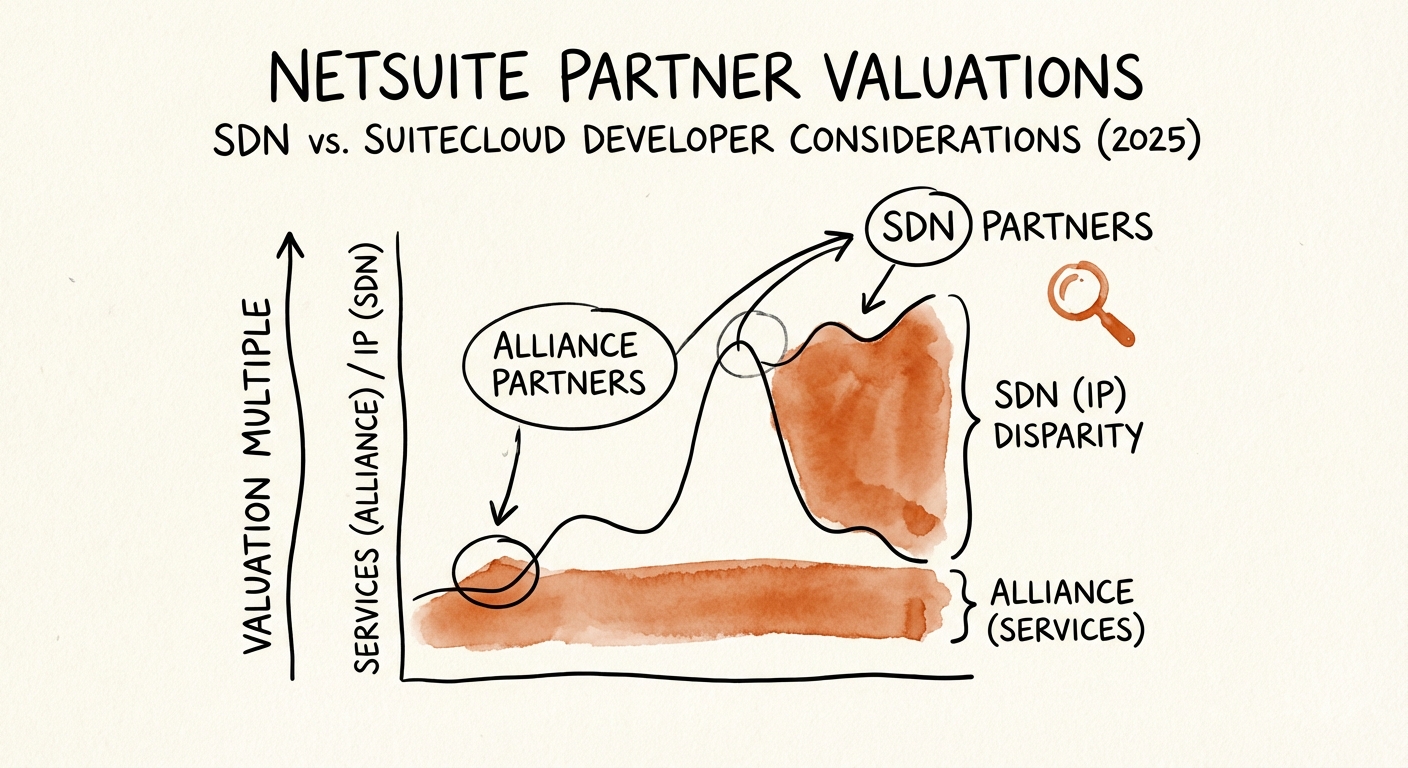
NetSuite Partner Valuations: The Multi-Million Dollar Gap Between SDN and Service Shops
Diagnostic guide for PE Operating Partners on NetSuite partner valuations. Why SDN IP commands 8x+ multiples while services lag at 1.5x, and how to bridge the gap.
8.5x Avg. Revenue Multiple (Tier 1 SDN)
BRIEF · EXIT READINESS
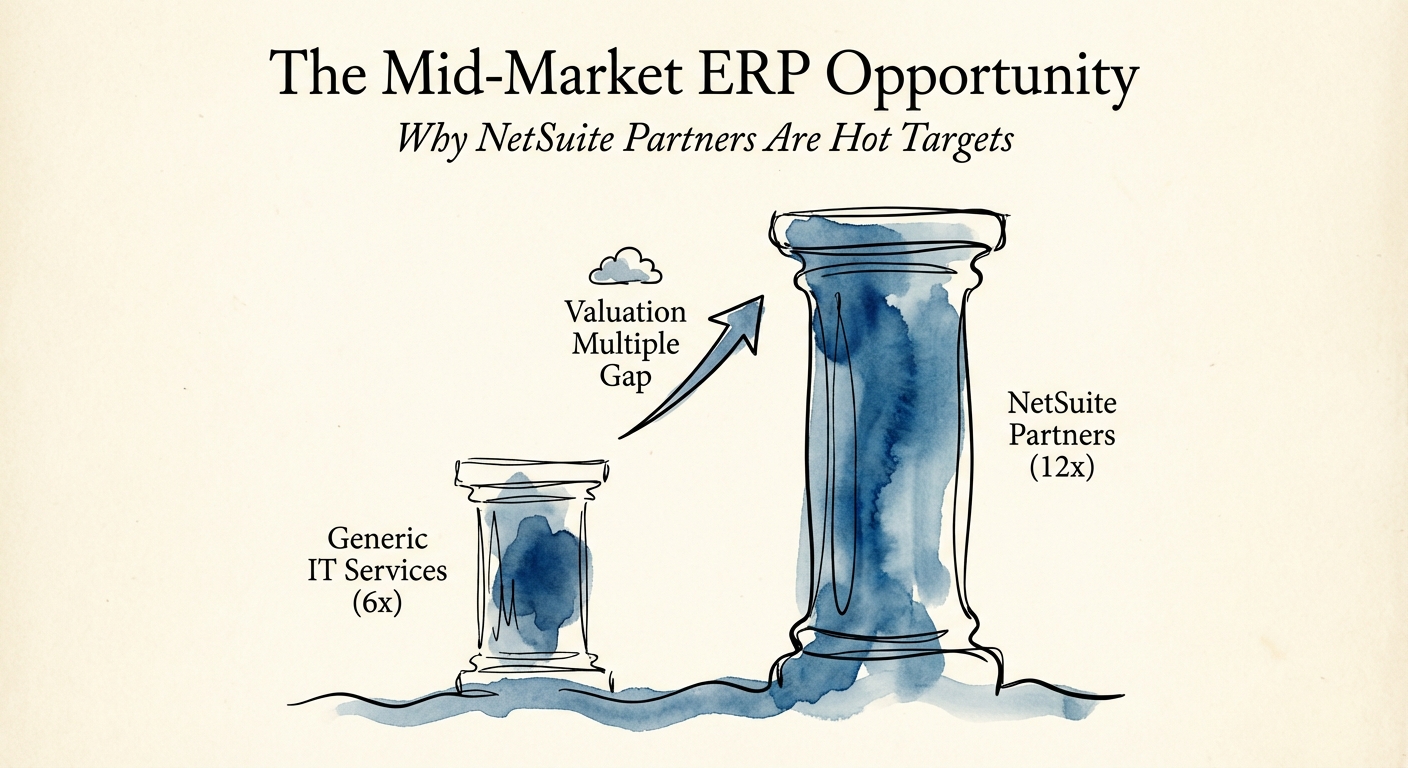
The Mid-Market ERP Opportunity: Why NetSuite Partners Are Hot Targets
NetSuite partners are top PE targets in 2026. Discover why valuations are hitting 12x EBITDA, the specific metrics driving the premium, and the 'Time & Materials' trap to avoid.
12.8x Median PE Multiple for High-Recurring IT Services
BRIEF · EXIT READINESS
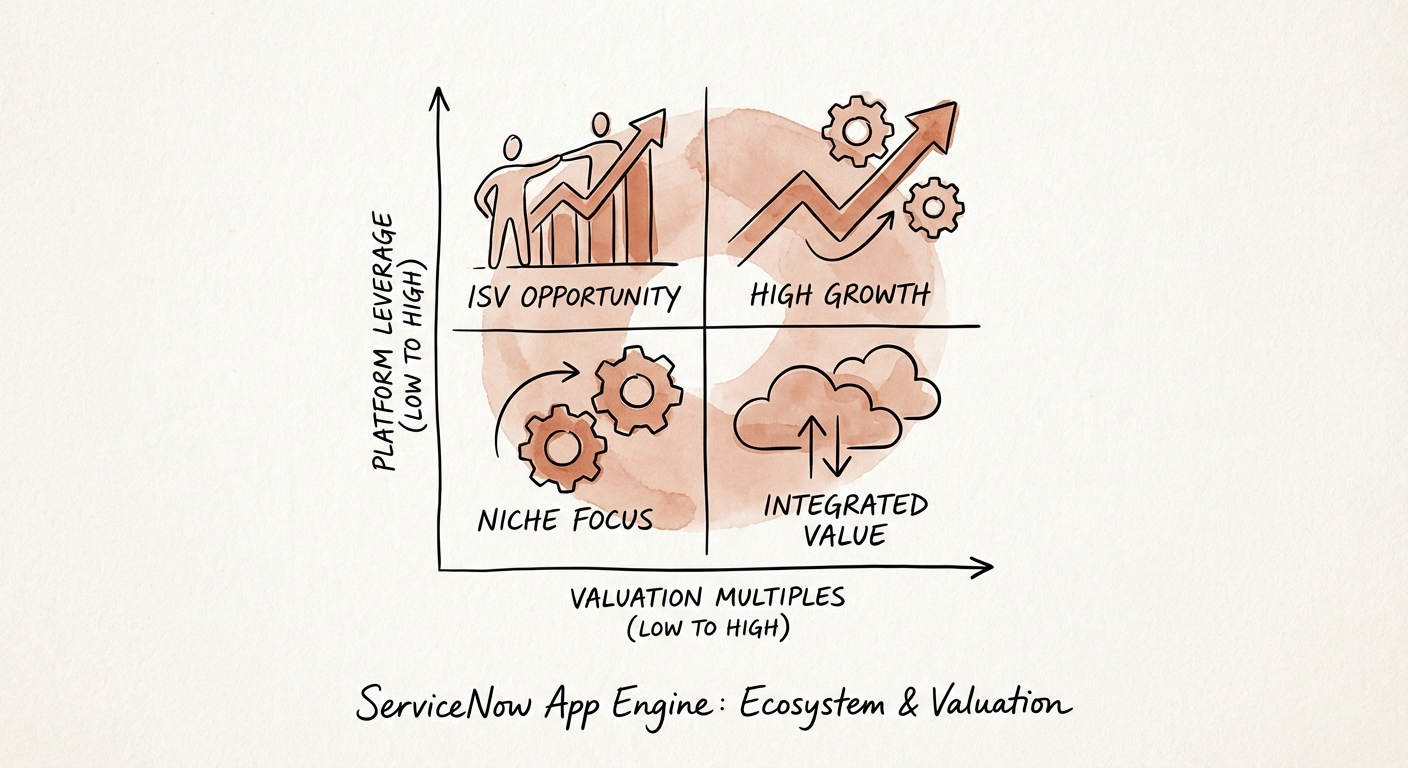
The Ecosystem Paradox: How ServiceNow ISVs Defend Valuation
Building on ServiceNow App Engine? Learn the valuation multiples, exit risks, and strategic benchmarks for 'Built on Now' ISVs in 2026.
Platform risk Primary Buyer Question

BRIEF · MIGRATION & INTEGRATION
The ServiceNow Integration Trap: Why "Buy and Build" Strategies Stall on Technical Debt
Why 60% of ServiceNow partner acquisitions fail to realize synergies. A diagnostic guide for PE Operating Partners on instance consolidation, technical debt, and talent retention.
40% Integration Budget Consumed by Technical Debt
BRIEF · EXIT READINESS
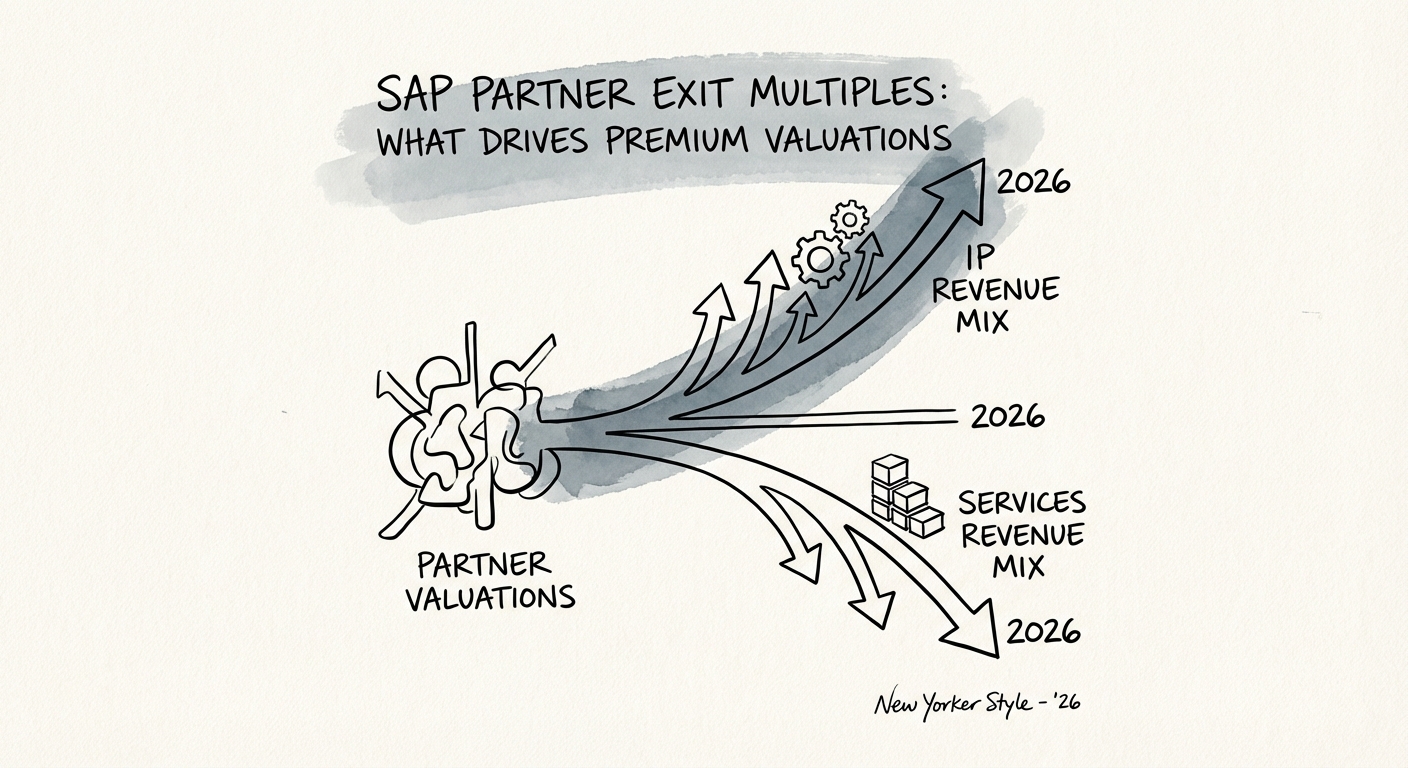
SAP Partner Exit Multiples: What Drives Premium Valuations in 2026
SAP partner valuation multiples have bifurcated in 2026. Discover why some firms trade at 13x EBITDA while others stall at 6x, and how 'Clean Core' IP drives premium exits.
13.0x Top-Quartile EBITDA Multiple
BRIEF · TEAM & HIRING
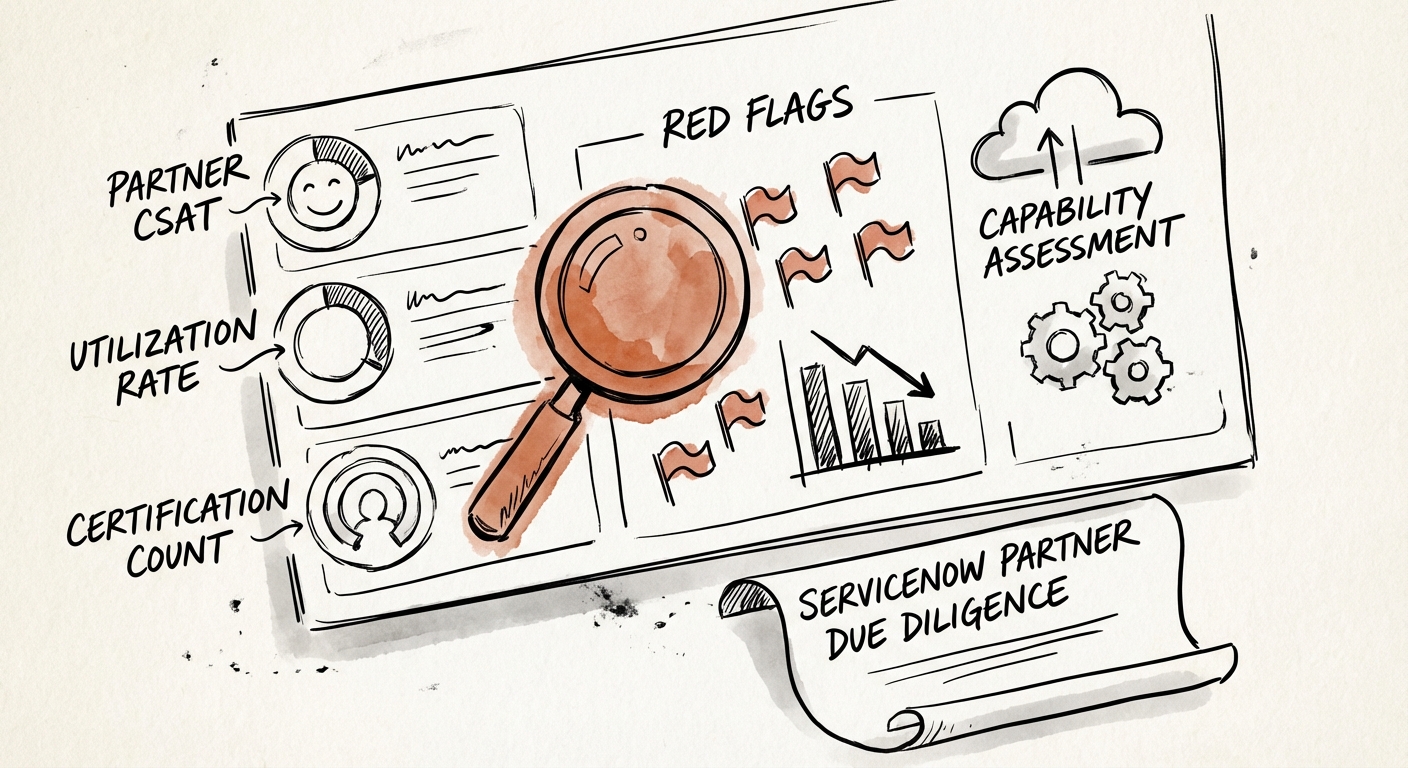
ServiceNow Partner Valuations: The "Elite" Trap in Due Diligence
ServiceNow Elite Partner status is a commodity, not a differentiator. Here is the due diligence framework to assess true delivery capability, talent density, and exit value.
4.2/5 Minimum CSAT for Elite Status
BRIEF · FOUNDER EXTRACTION
The $20M SAP Ceiling: How to Scale Your Practice Before the S/4HANA Rush
The SAP S/4HANA migration window is a once-in-a-generation opportunity. Learn why founder-led practices hit a $20M ceiling and how to operationalize for scale.
30,000 Legacy SAP Customers Needing Migration
BRIEF · GTM EXECUTION
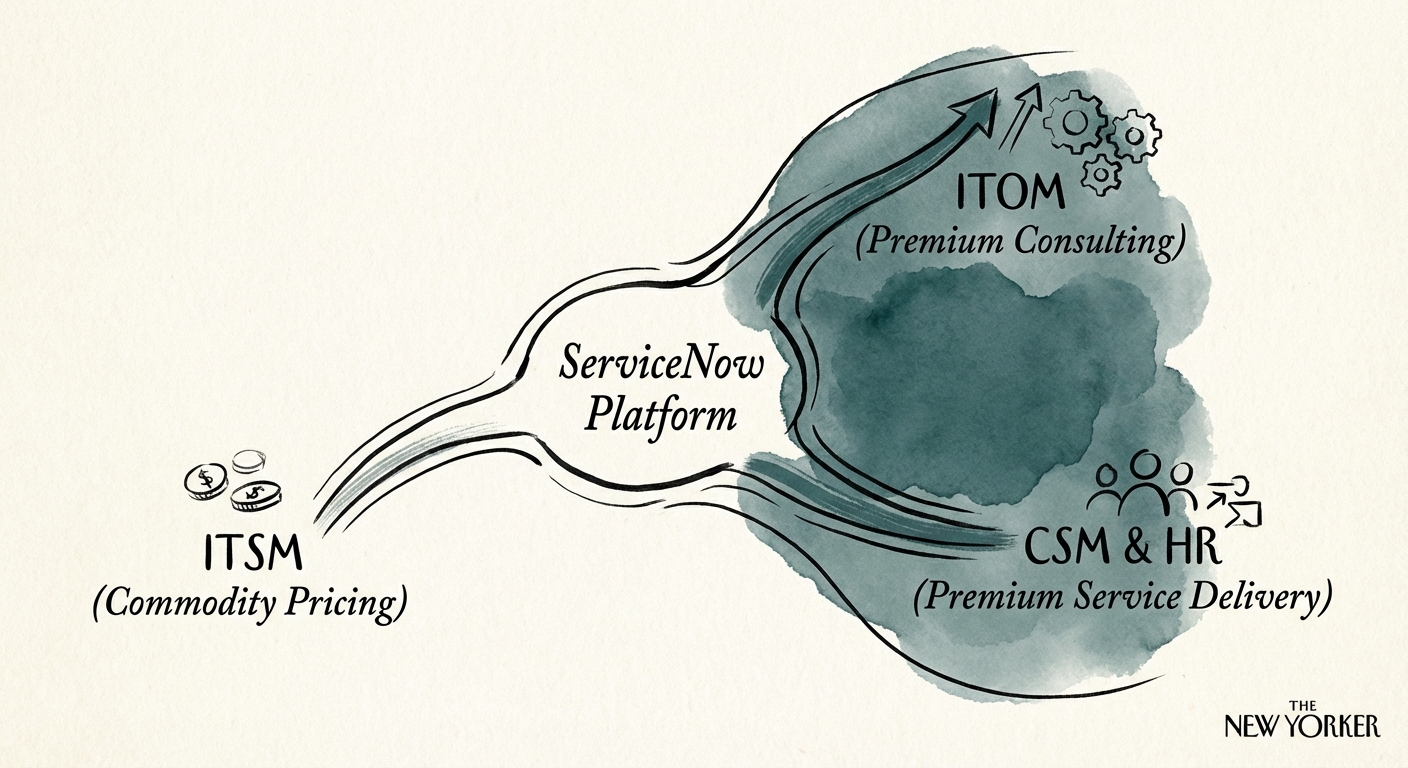
The Generalist Trap: Why ServiceNow Partners Stall at $15M (And How to Pick Your Lane)
Why generalist ServiceNow partners stall at $15M. A diagnostic guide on ITOM vs. CSM vs. HRSD specialization strategies to maximize EBITDA and exit valuation.
95% YoY Growth in Specialized Consulting Demand
BRIEF · PROJECT RECOVERY
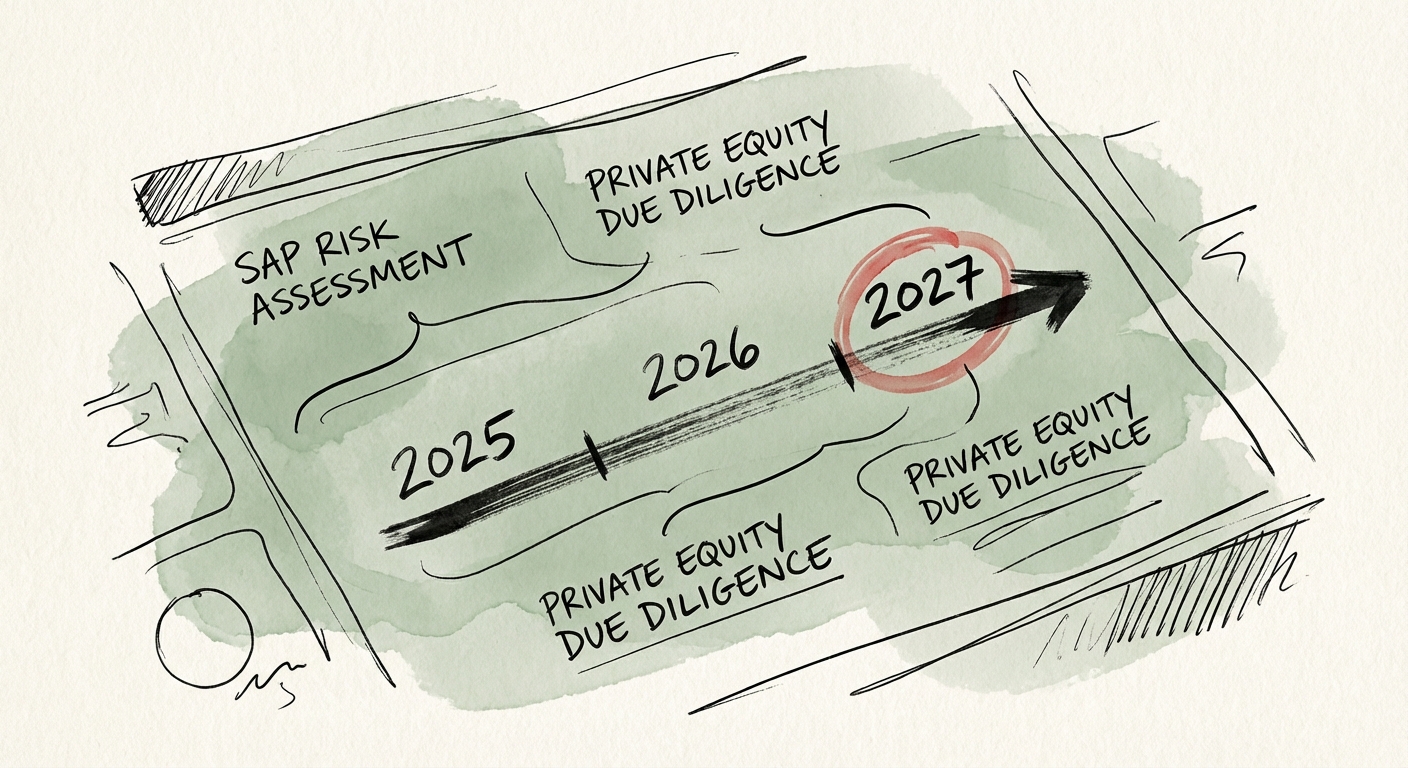
The SAP S/4HANA '2027 Cliff': A Due Diligence Diagnostic for Private Equity
The SAP S/4HANA 2027 deadline creates a massive hidden liability for PE buyers. Here is the operator's diagnostic to assess implementation risk and protect deal value.
215% Avg Cost Overrun
BRIEF · REVENUE ARCHITECTURE
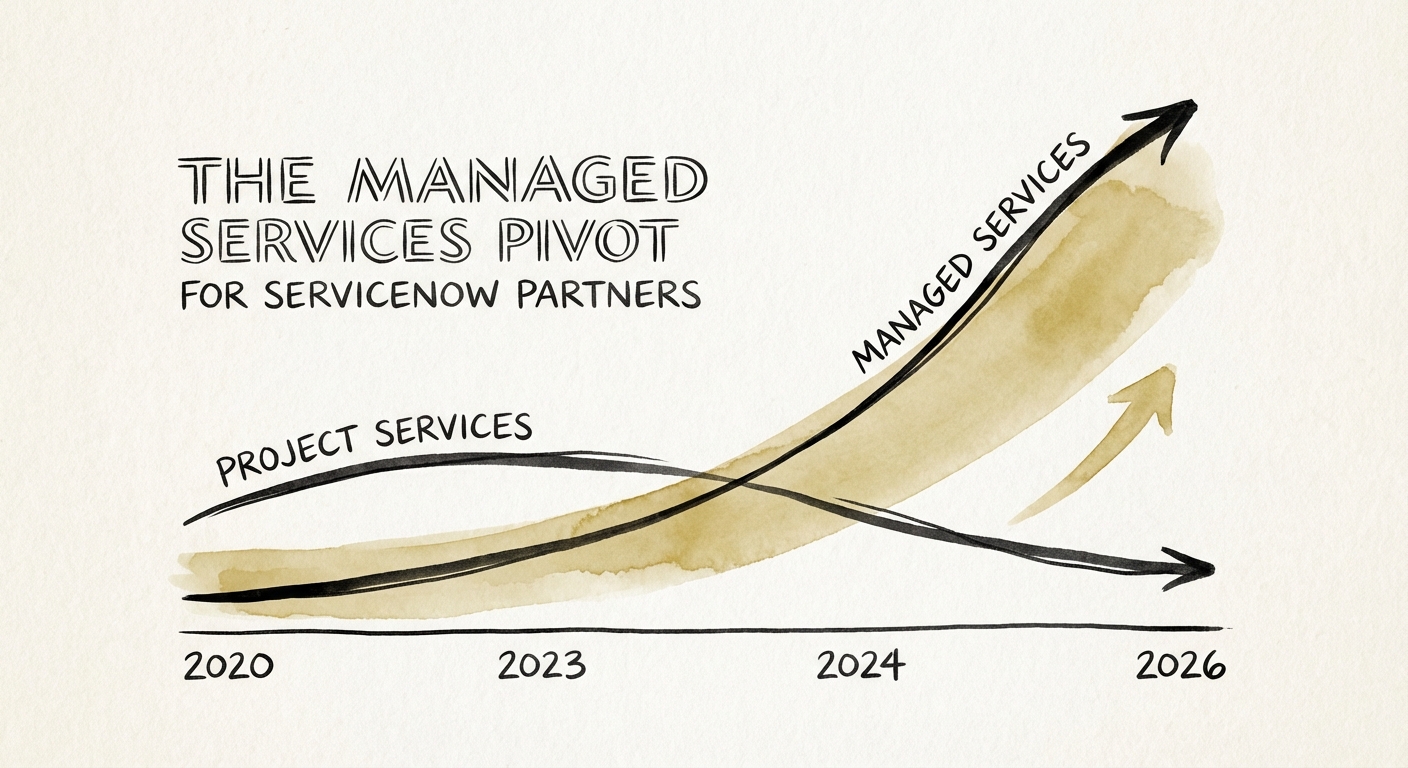
The Managed Services Pivot: Breaking the $20M Ceiling for ServiceNow Partners
A diagnostic guide for ServiceNow partners pivoting from project revenue to managed services. Learn why recurring revenue boosts valuations from 0.8x to 2.5x.
3x Valuation Multiple Uplift
BRIEF · GTM EXECUTION
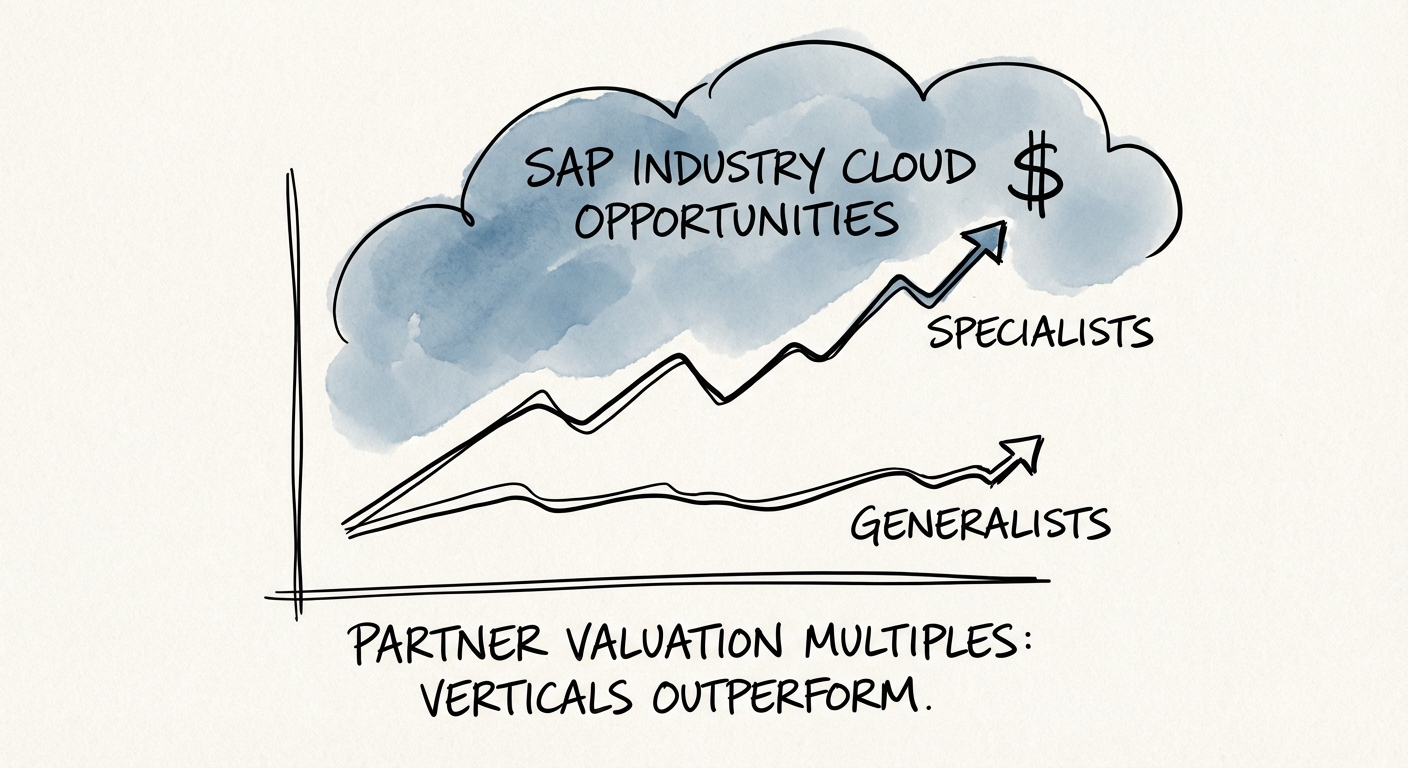
The 'Generalist' SAP Partner Is Dead: Why Industry Cloud Is Your Only Exit Strategy
Generalist SAP partners face rate compression. Discover why specializing in Industry Cloud on BTP drives 2x win rates and premium exit valuations.
150% Increase in Deal Volume for Industry Cloud Partners