BRIEF · EXIT READINESS
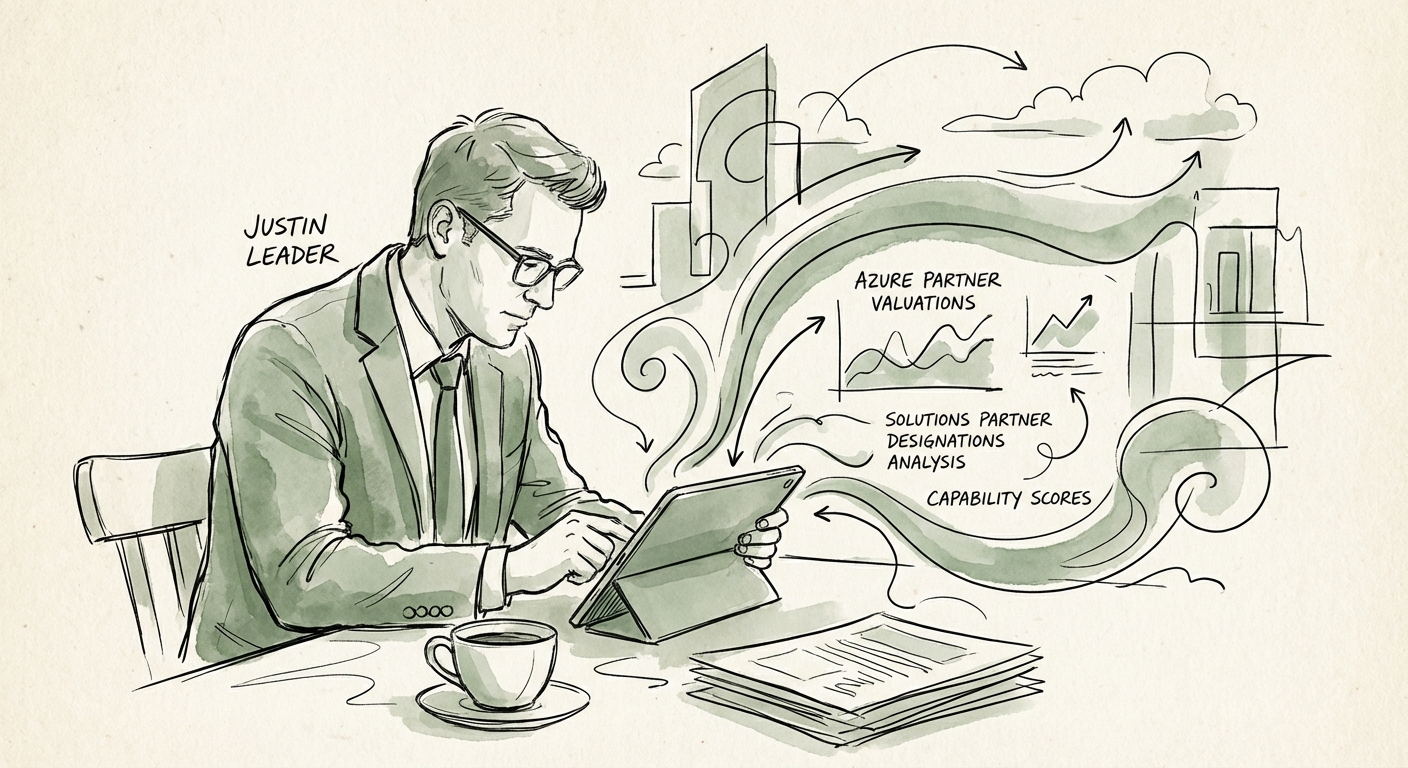
Azure Partner Valuations in 2026: The Partner Capability Score Hides Where the EBITDA Really Lives
A PE diligence read on Azure partners: why the 70-point Partner Capability Score, ACR growth, and audited Advanced Specializations decide 6x vs. 12x.
12x EBITDA Multiple for Specialized Azure Partners
BRIEF · UNIT ECONOMICS
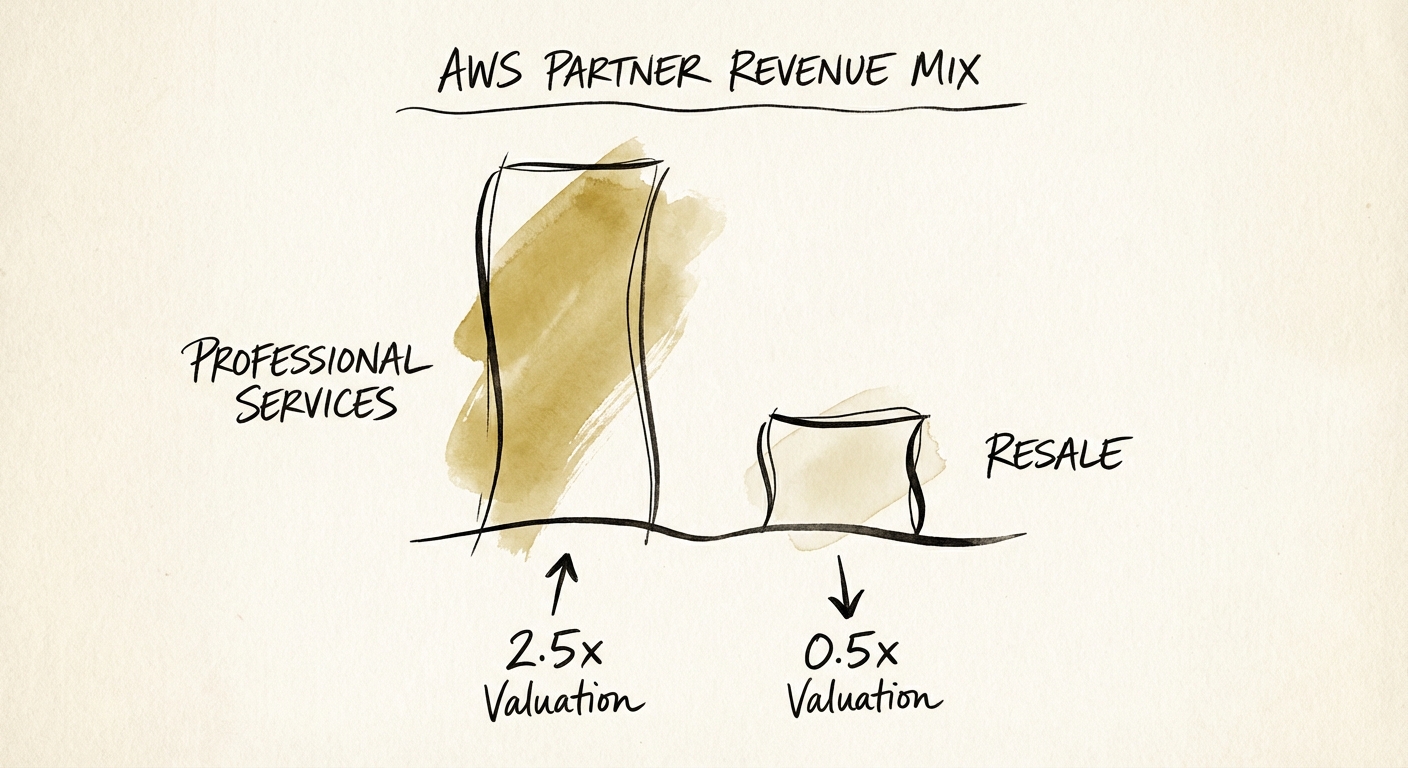
The Resale Trap: Why 50% of Your AWS Revenue Is Worth Zero to an Acquirer
Stop chasing empty revenue. Why AWS resale margins (<10%) are killing your valuation, and how to capture the $7.13 services multiplier instead.
$7.13 Services Revenue per $1 AWS Sold
BRIEF · GTM EXECUTION
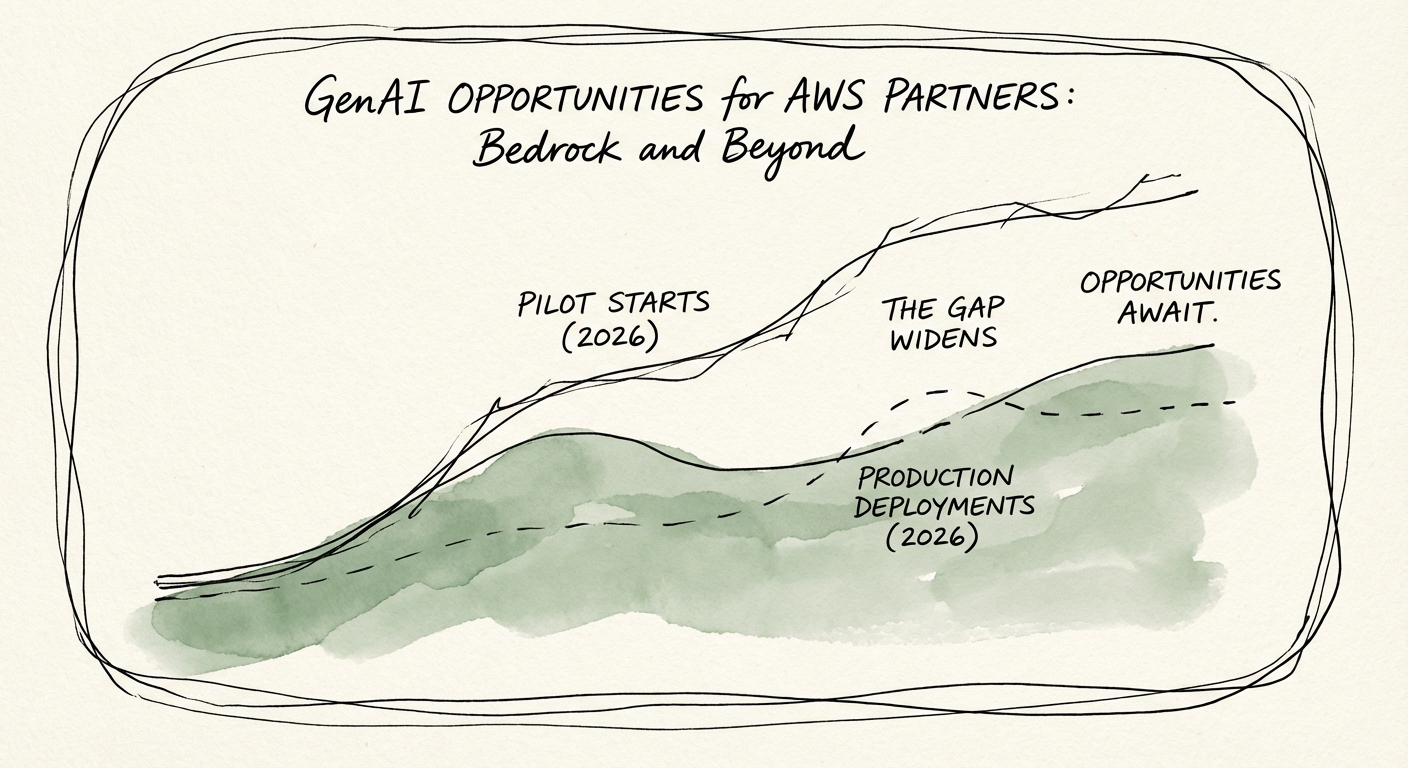
The $7.13 Multiplier Myth: Why Your GenAI Practice Is Stuck in 'PoC Purgatory'
New 2026 data reveals a $7.13 AWS partner multiplier, yet 30% of GenAI pilots fail. A diagnostic guide for AWS Partners to escape 'PoC Purgatory' and build profitable Agentic AI practices.
$7.13 AWS Partner Multiplier (2026)
BRIEF · EXIT READINESS
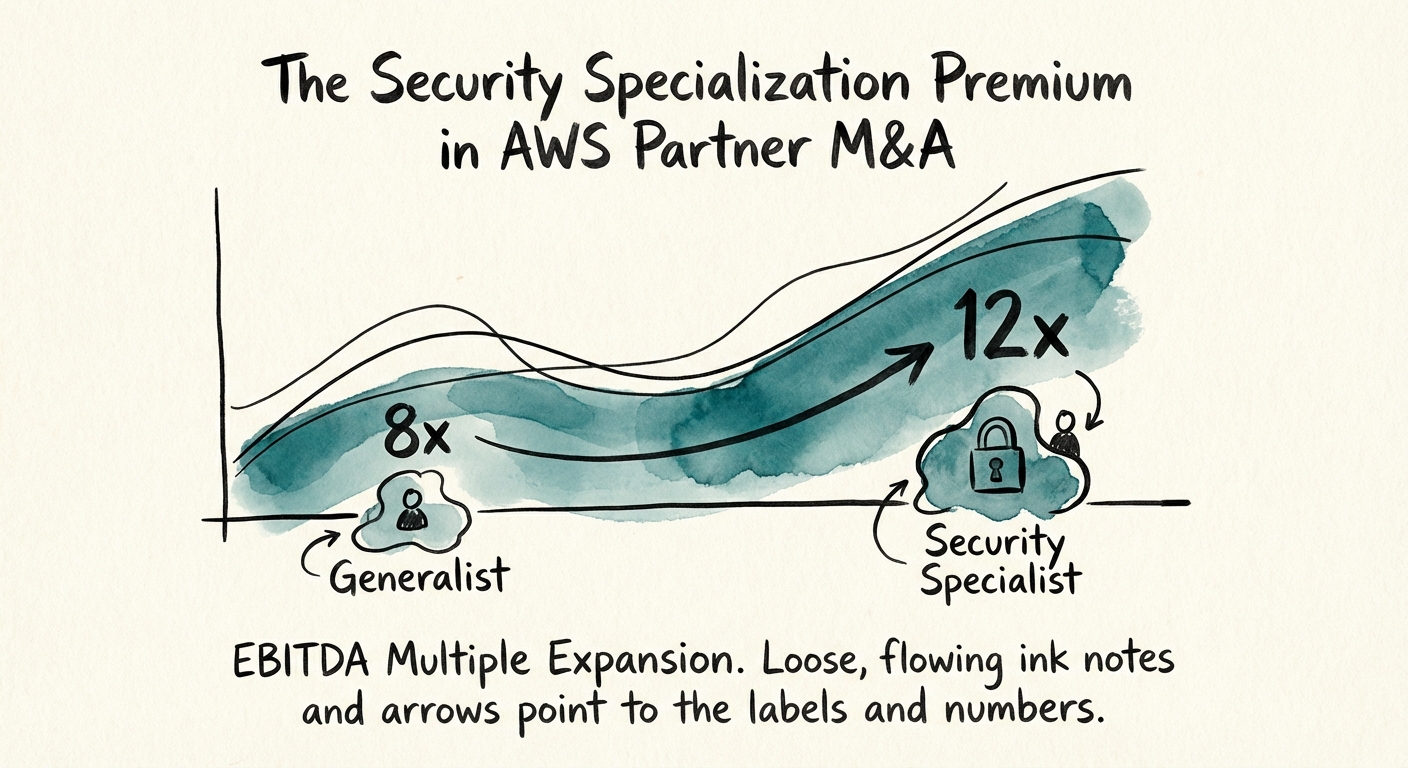
The Security Specialization Premium in AWS Partner M&A
Generalist AWS partners trade at 8x EBITDA. Security specialists trade at 12x. Here is the diagnostic data on the security premium in 2026 M&A.
12x EBITDA Security Specialist Valuation
BRIEF · FOUNDER EXTRACTION
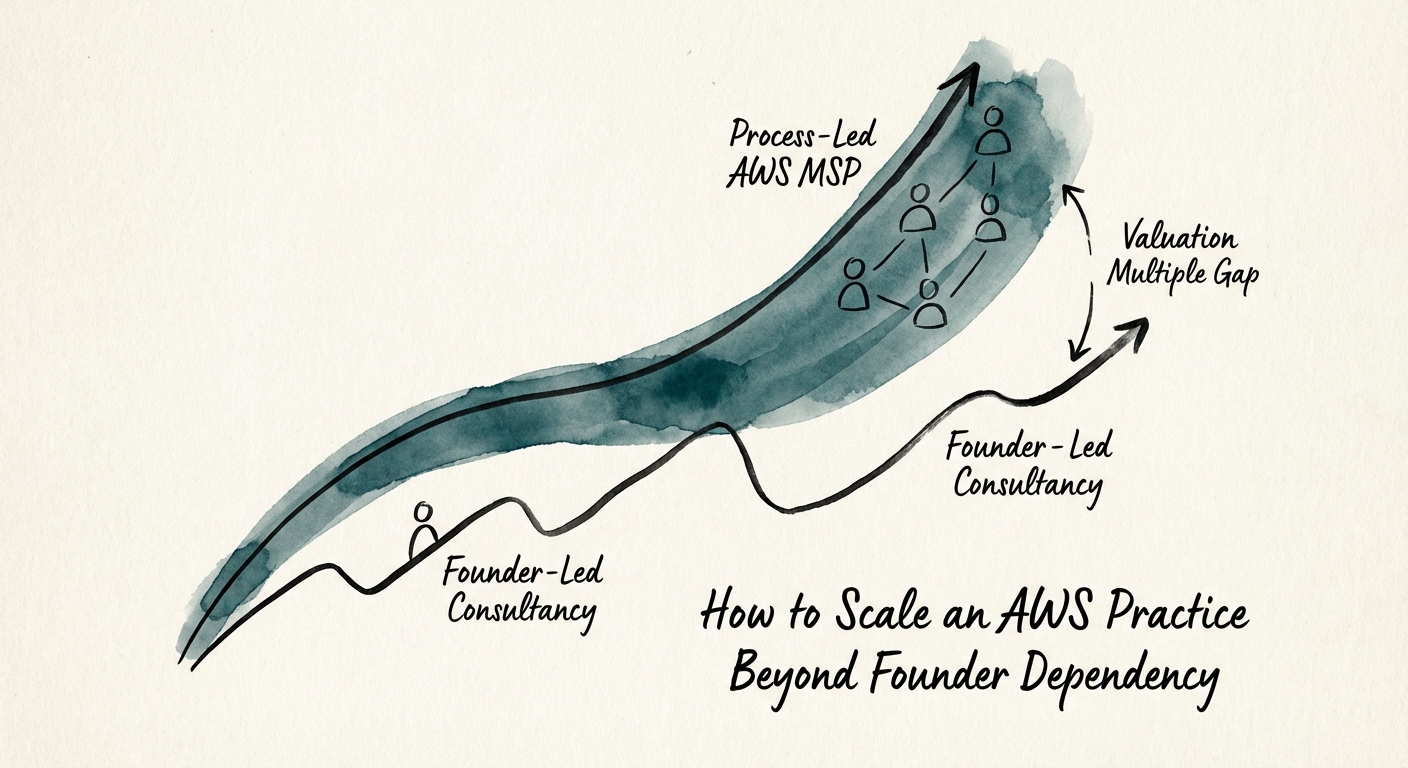
The $10M Wall: How to Scale Your AWS Practice Beyond Founder 'Heroics'
Stuck at $5M revenue? Here is the diagnostic playbook to scale your AWS practice beyond founder-led sales, increase valuation multiples, and capture the $7.13 ecosystem multiplier.
$7.13 Service Revenue Per $1 AWS Sold
BRIEF · UNIT ECONOMICS
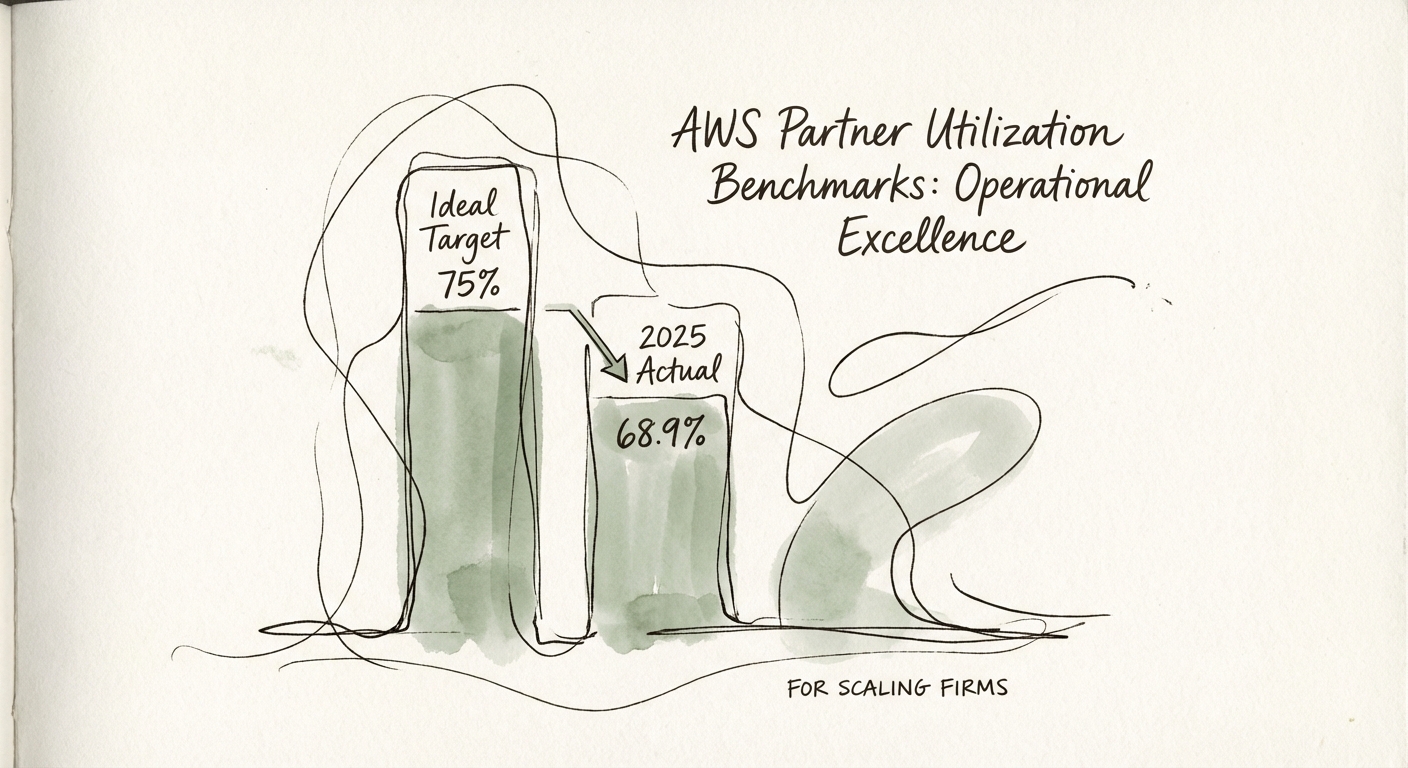
AWS Partner Utilization Benchmarks: Why 85% Is a Trap and 68.9% Is the Reality
New 2025 data reveals average AWS partner utilization has dropped to 68.9%. Learn why 75% is the new operational gold standard for founders.
68.9% Avg. Billable Utilization (2025)
BRIEF · EXIT READINESS
The Marketplace Multiplier: Why Your Next Exit Depends on 'Cloud GTM'
Why ISVs with >20% AWS Marketplace revenue trade at premium multiples. A diagnostic guide for founders to reduce CAC, shorten sales cycles by 40%, and unlock the 'Cloud Premium' before exit.
40% Reduction in Sales Cycle Length via Marketplace
BRIEF · TEAM & HIRING
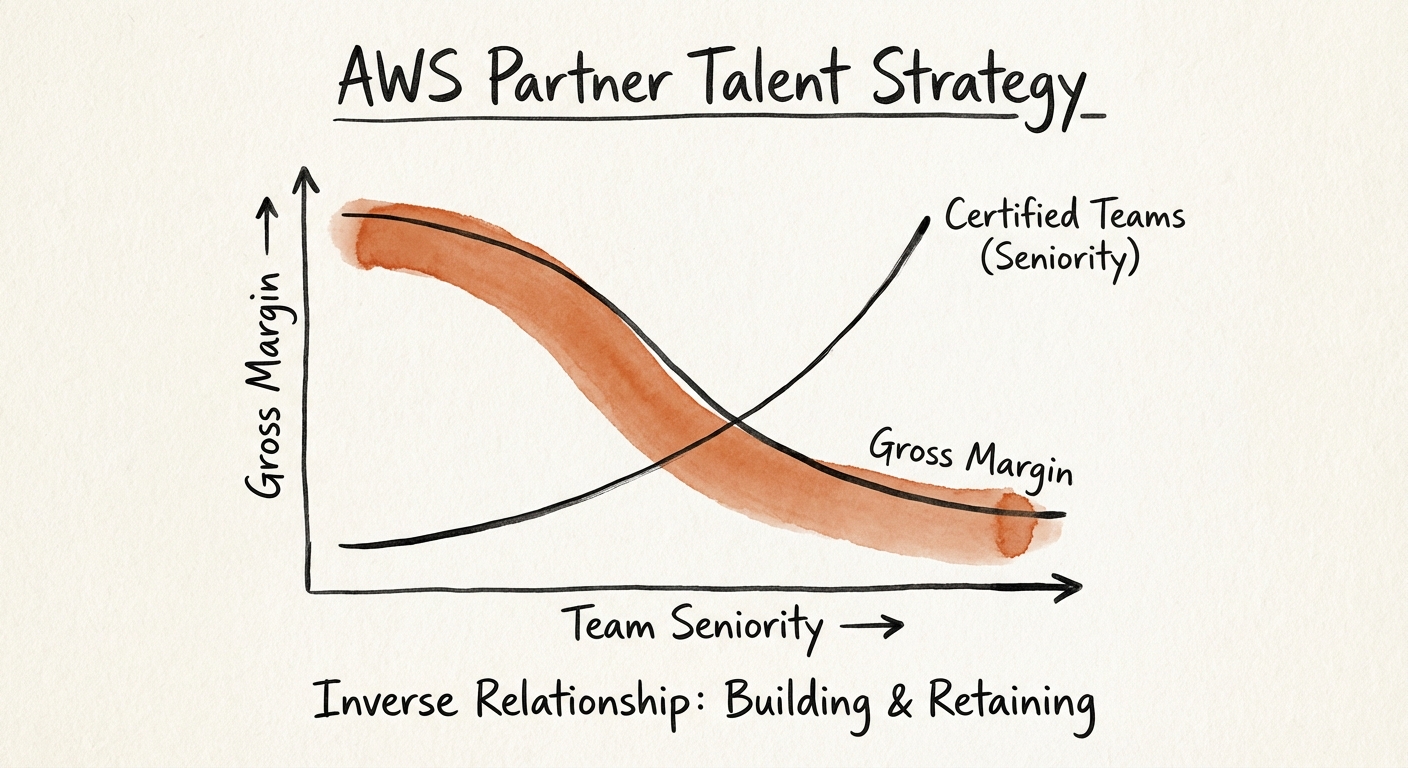
The 'Certified' Trap: Why Your AWS Talent Strategy Is Bleeding Margins
Stop overpaying for 'Paper Tigers.' A diagnostic guide for AWS Partners on building profitable, certified delivery teams without destroying margins.
$240,000 Cost of a Bad Senior Tech Hire
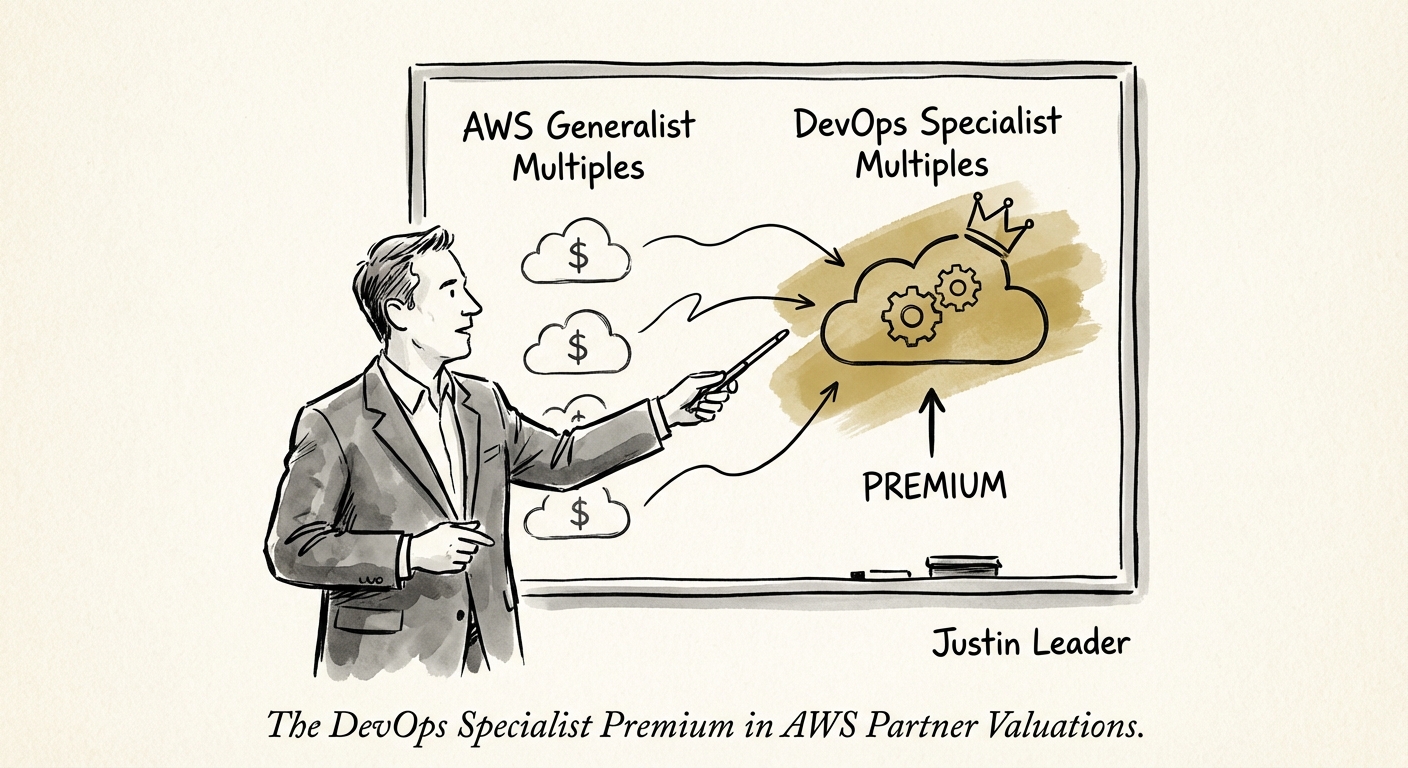
BRIEF · EXIT READINESS
The DevOps Specialist Premium: Why Generalist AWS Partners Are Trading at a 50% Discount
Why generalist AWS partners trade at 6x EBITDA while DevOps specialists command 12x. A diagnostic guide for founders on unlocking the specialization premium.
3.4x Higher Referral Conversion for Specialists
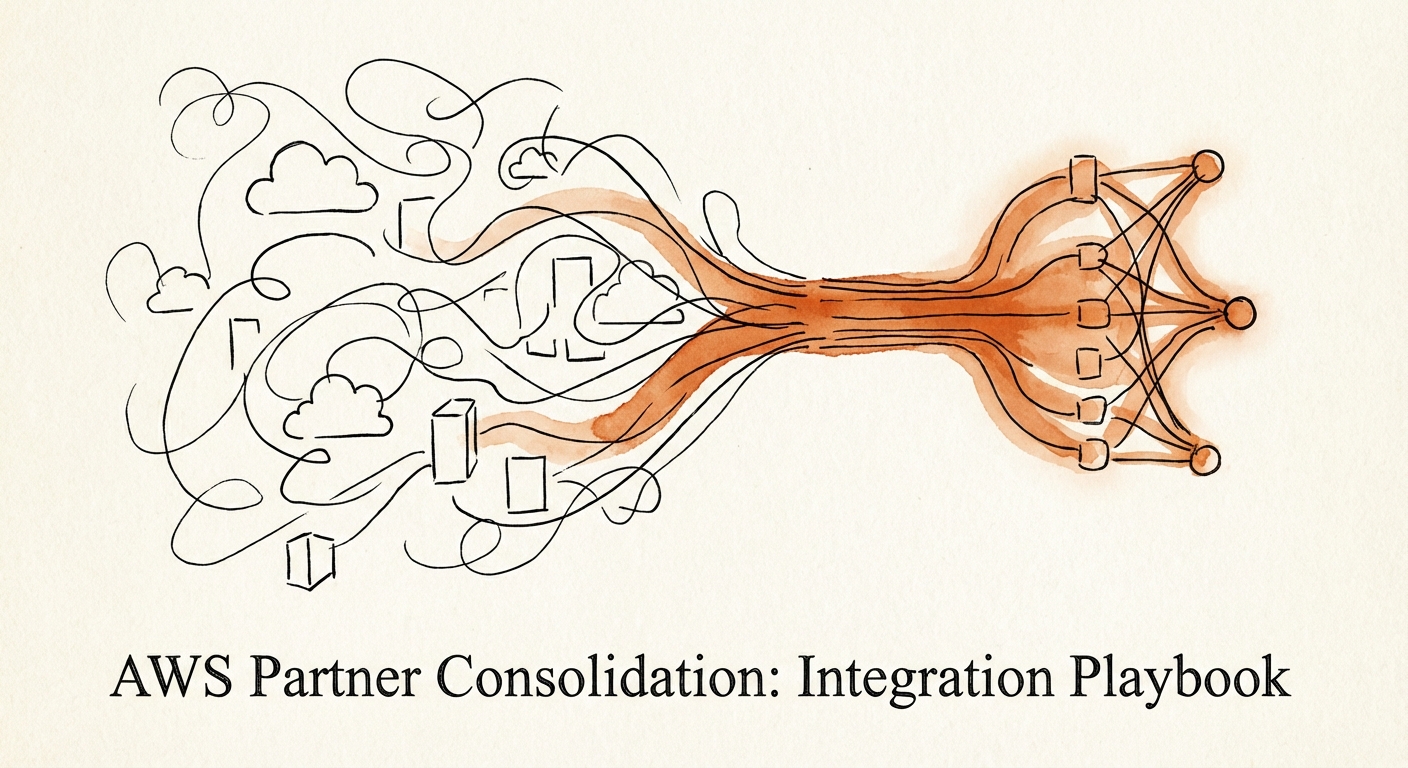
BRIEF · MIGRATION & INTEGRATION
AWS Partner Consolidation: The Integration Playbook That Saves Your Multiple
The 2026 guide for PE Operating Partners integrating AWS consultancies. How to protect the Premier Tier badge, retain certified talent, and capture the $7.13 ecosystem multiplier.
11.6x Avg. 2025 Tech Services EBITDA Multiple
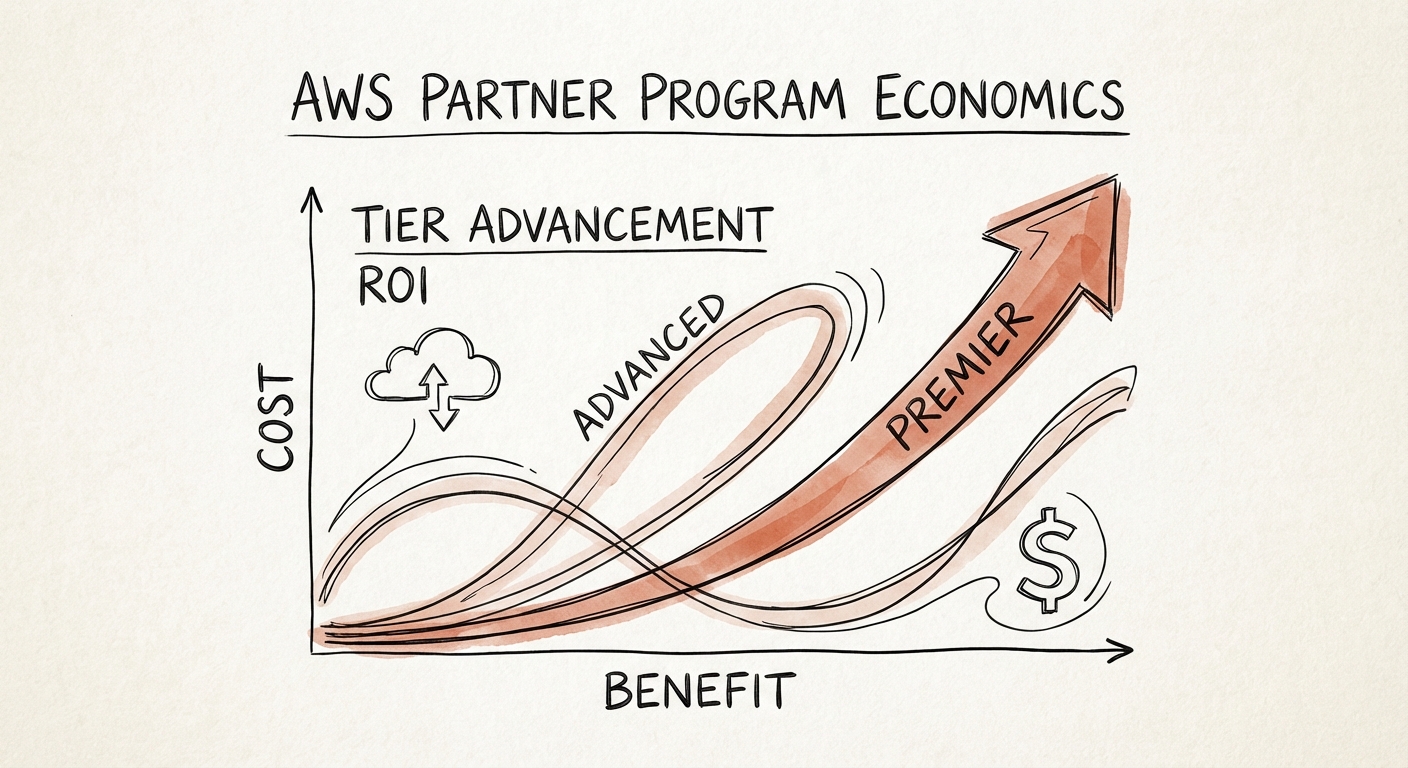
BRIEF · UNIT ECONOMICS
AWS Premier Tier Math: When the Badge Costs More Than the Pipeline It Unlocks
The jump from AWS Advanced to Premier costs a 30-engineer shop ~$250k in year one. Here's the certification-tax math, and the ACE Launched metric that actually pays it back.
$7.13 Service Revenue Multiplier per $1 AWS Spend
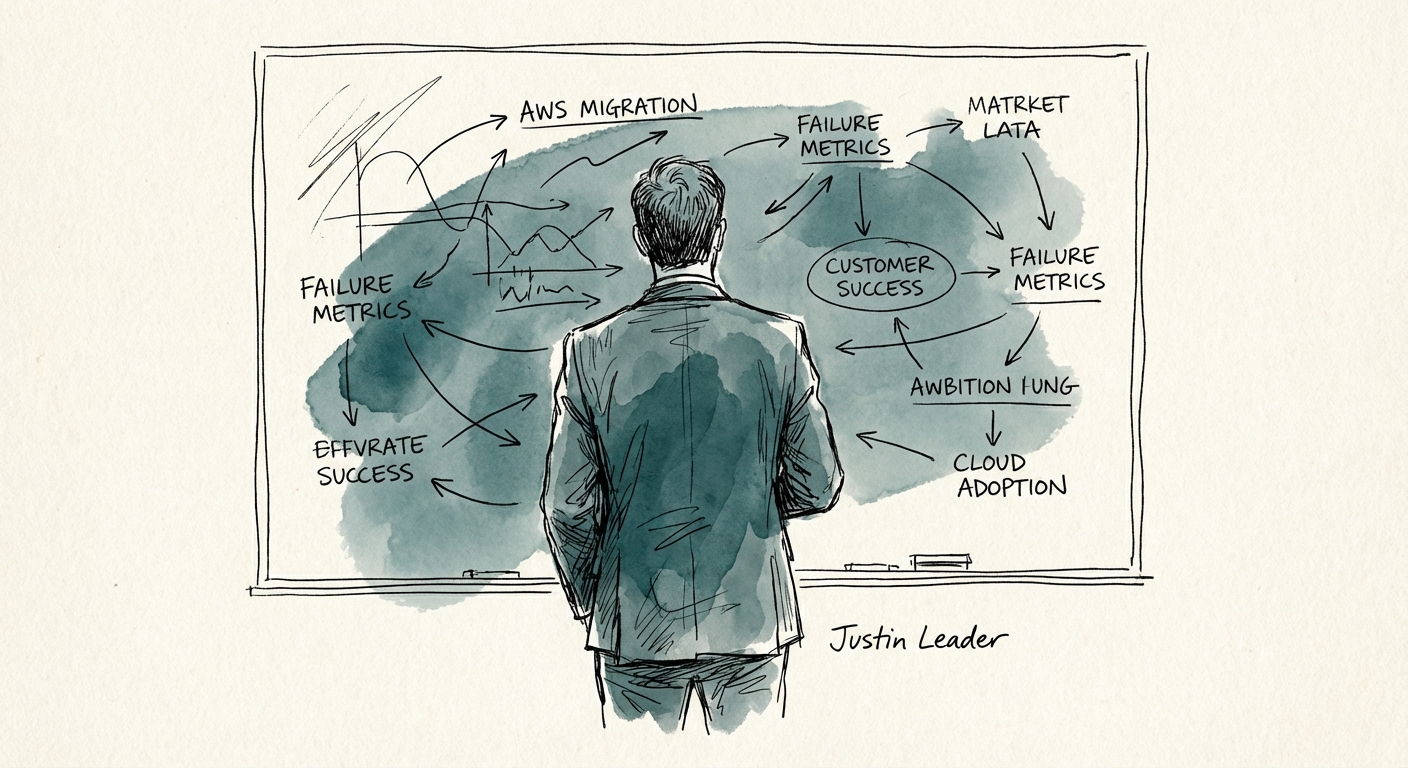
BRIEF · PROCESS DOCUMENTATION
Customer Success in AWS Migration Projects: Metrics That Matter
Stop measuring generic CSAT. Learn the 3 operational metrics that actually predict AWS migration success and drive 12x exit multiples for consulting firms.
83% Project failure rate without standardized data migration processes
BRIEF · EXIT READINESS
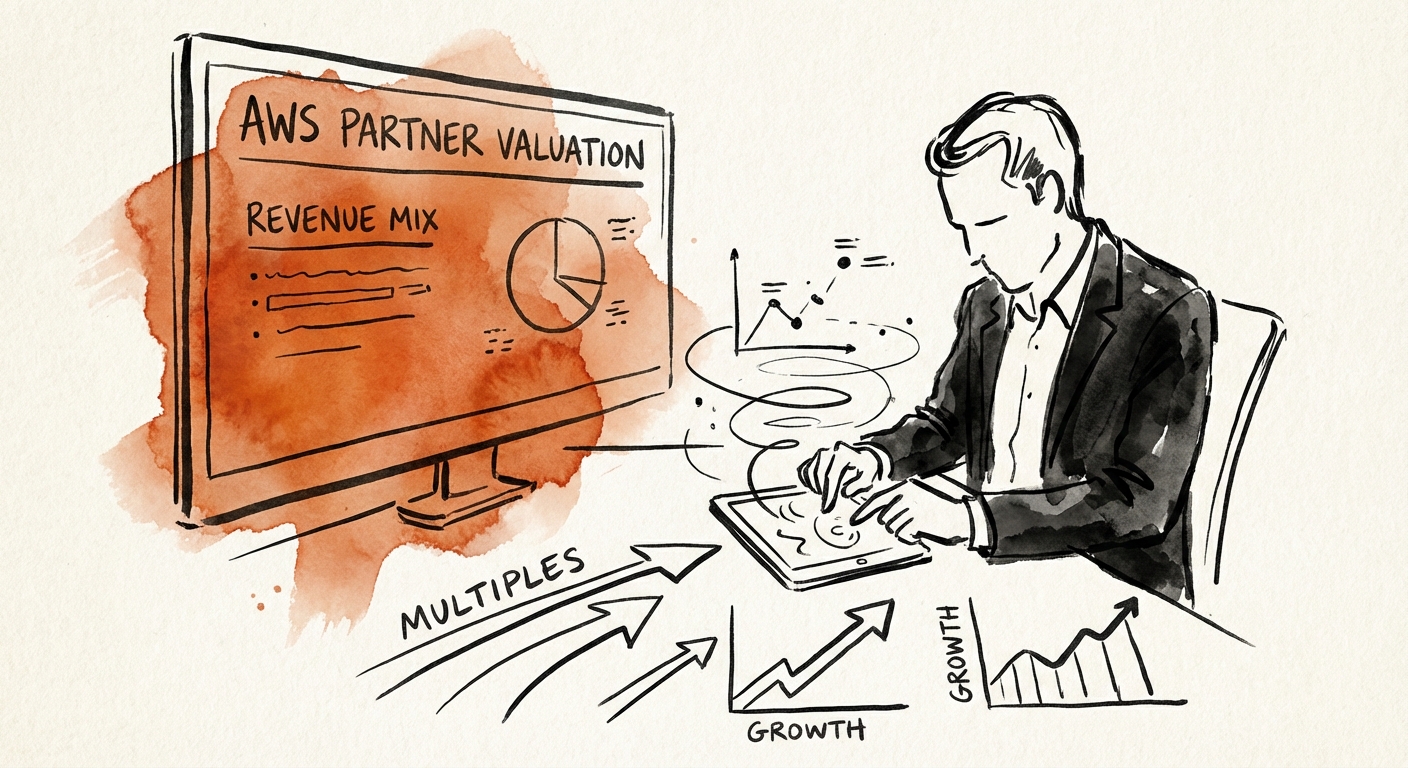
How PE Firms Evaluate AWS Partner Acquisitions: The 2026 Diagnostic
A diagnostic guide for PE Operating Partners on valuing AWS partners. Covers the $7.13 services multiplier, Marketplace premiums, and the specific QofE traps in 2026.
$7.13 Services Revenue Potential per $1 AWS Consumed
BRIEF · EXIT READINESS
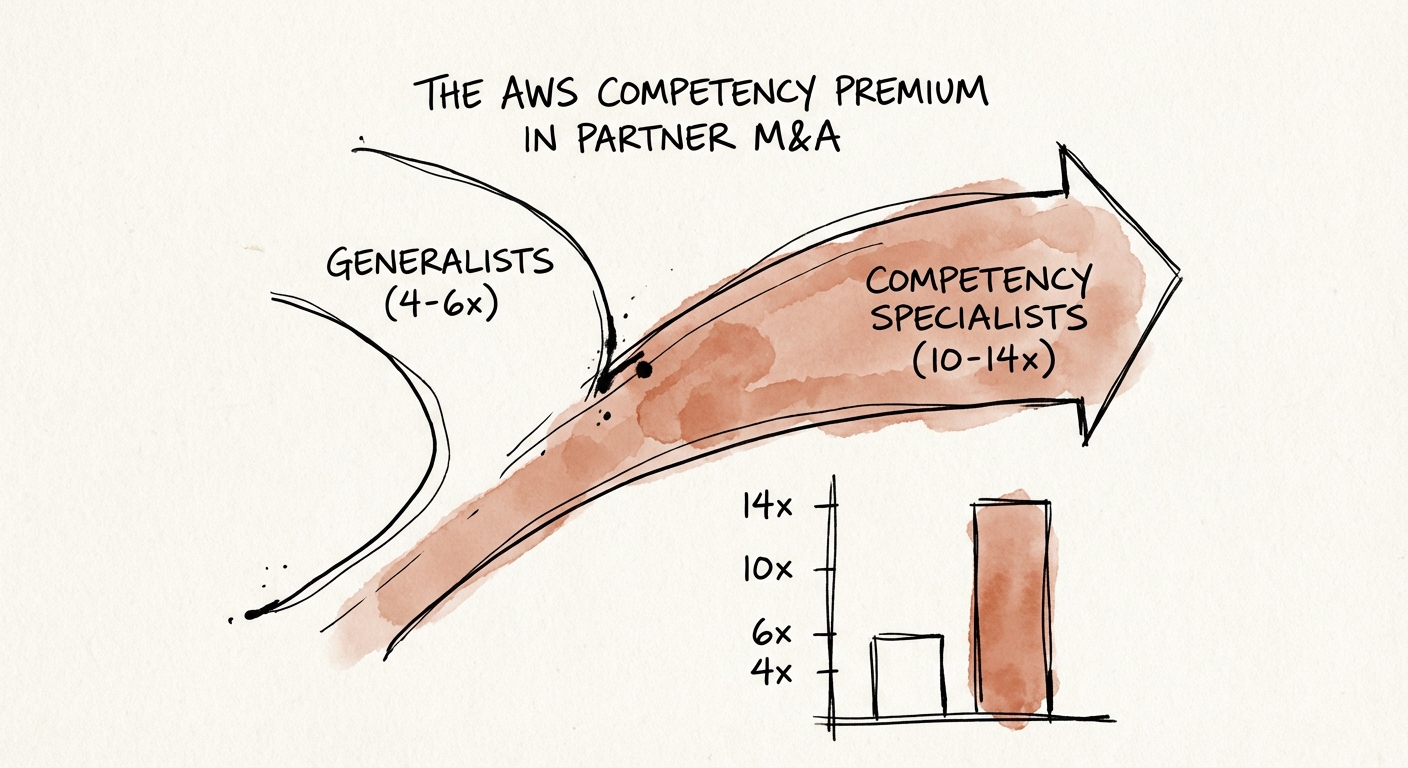
The AWS Competency Premium: Why Generalists Trade at 5x and Specialists Command 12x
Generalist AWS partners trade at 5x EBITDA. Specialists with 'Hard' Competencies trade at 12x. Here is the diagnostic on how to bridge the gap.
$7.13 Services Revenue per $1 AWS Consumed (Specialist)
BRIEF · TECHNICAL DEBT
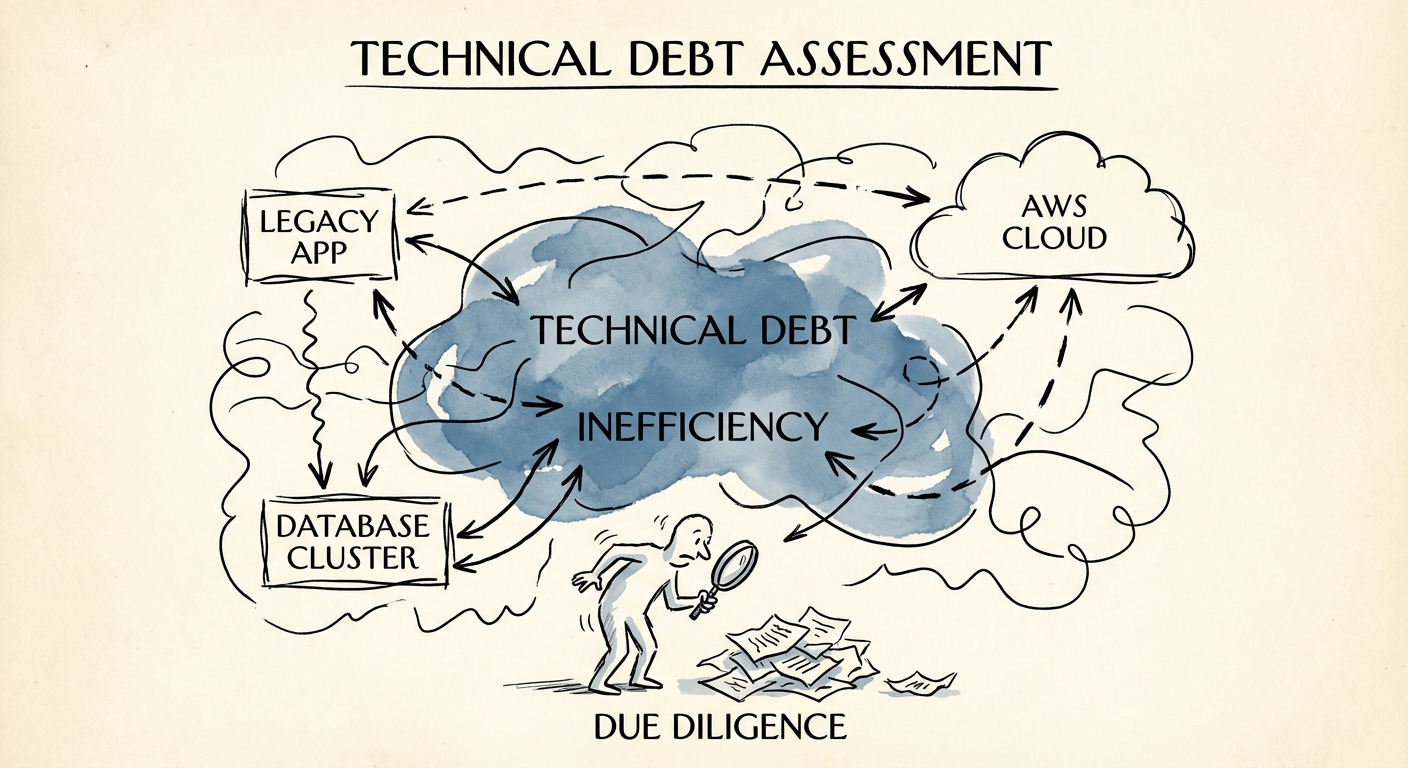
The AWS 'Lift and Shift' Discount: Why Your Target's Cloud Bill Is a $5M Valuation Haircut
High AWS costs aren't just OpEx—they're a sign of deep technical debt. Here's how to audit cloud architecture during due diligence to protect EBITDA.
32% Of Cloud Spend Wasted (2025)
BRIEF · EXIT READINESS
AWS Partner Valuations: The Multi-Million Dollar Gap Between 'Advanced' and 'Premier'
Why AWS Premier Tier partners trade at 14x EBITDA while Advanced partners stall at 8x. A diagnostic guide for PE investors and founders on valuation drivers, MAP funding, and the 2026 M&A landscape.
14x Premier EBITDA Multiple
BRIEF · UNIT ECONOMICS
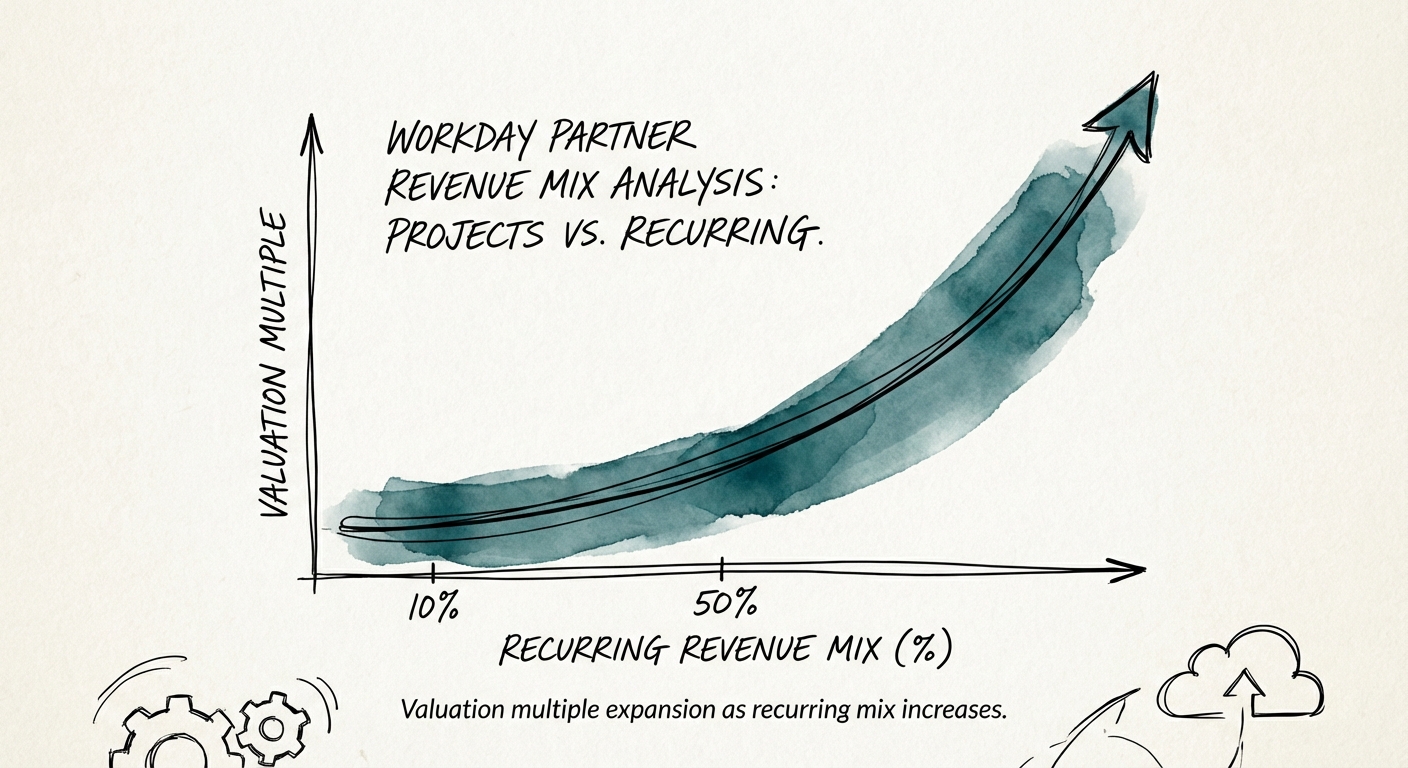
The 80/20 Trap: Why Your Workday Practice is Worth 50% Less Than You Think
Why Workday partners with >80% project revenue hit a valuation ceiling. Benchmarks for AMS revenue mix, margins, and the valuation gap between implementation shops and strategic advisors.
40% Target Recurring Revenue Mix
BRIEF · EXIT READINESS
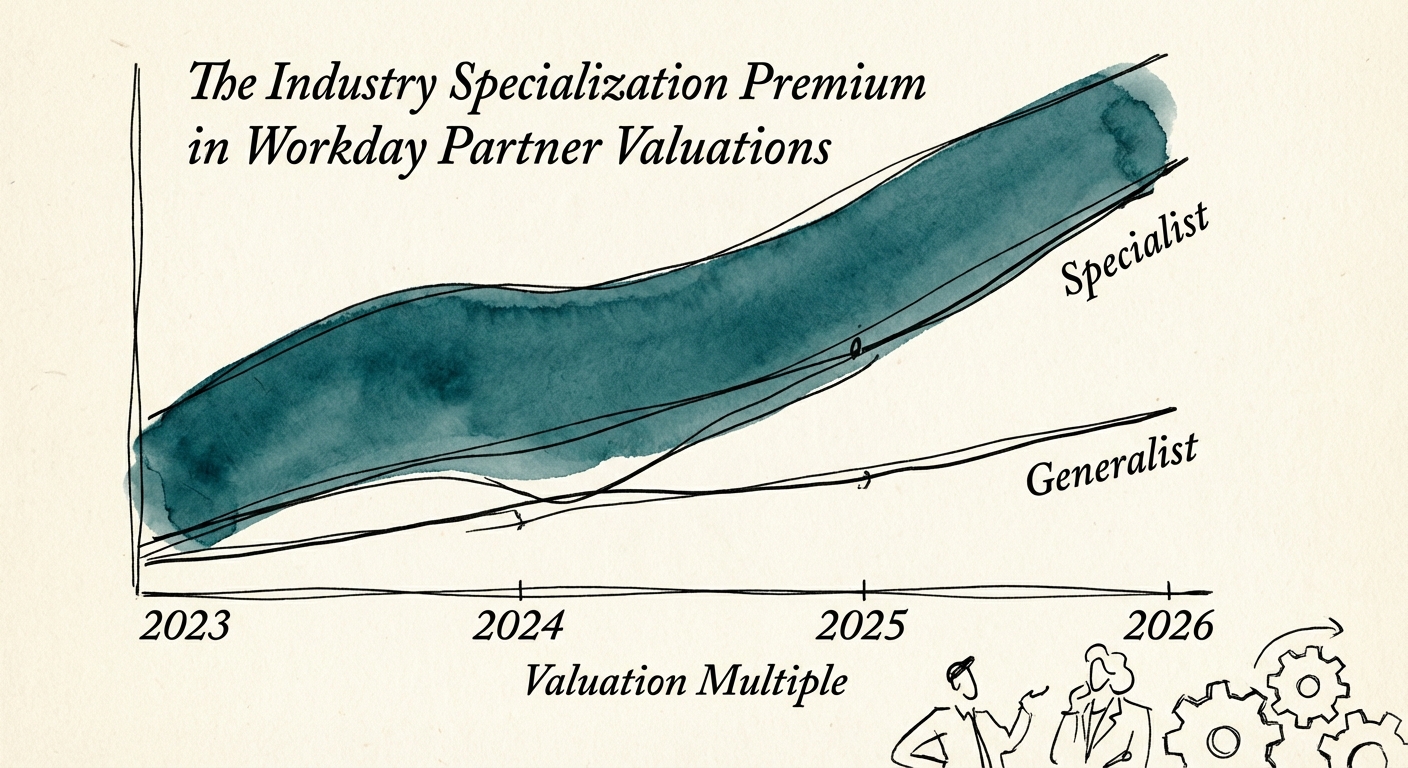
The Industry Specialization Premium: Why Workday Partners Are Bifurcating into 'Staffing Shops' and 'Strategic Assets'
Why generalist Workday partners trade at 7x EBITDA while industry specialists command 14x. A 2026 valuation guide for PE Operating Partners.
13.6x Specialist EBITDA Multiple
BRIEF · EXIT READINESS
The Velvet Rope: How to Position Your Workday Practice for a Premium Exit
Workday partners trade at a 40% premium, but only if they escape the 'body shop' trap. Here is the diagnostic guide for positioning your firm for a strategic exit.
40% Valuation Premium vs. Generalist SIs
BRIEF · REVENUE ARCHITECTURE
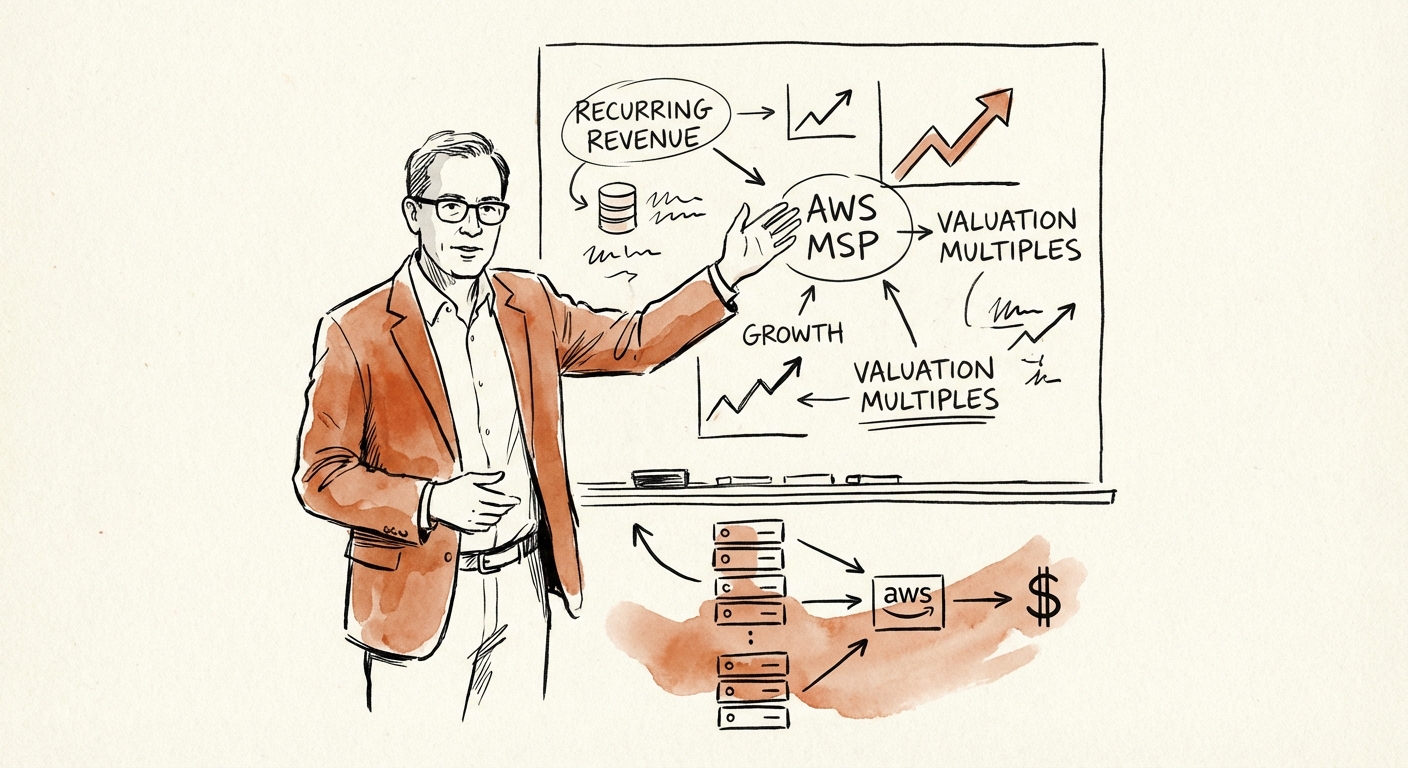
The AWS Resale Arbitrage Is Dead: How to Build a 10x EBITDA Managed Services Practice in 2026
The AWS resale arbitrage is dead. Discover the 2026 playbook for pivoting from low-margin resale to high-margin Managed Services (MSP) and unlocking a 10x EBITDA exit.
12x EBITDA Multiple Target
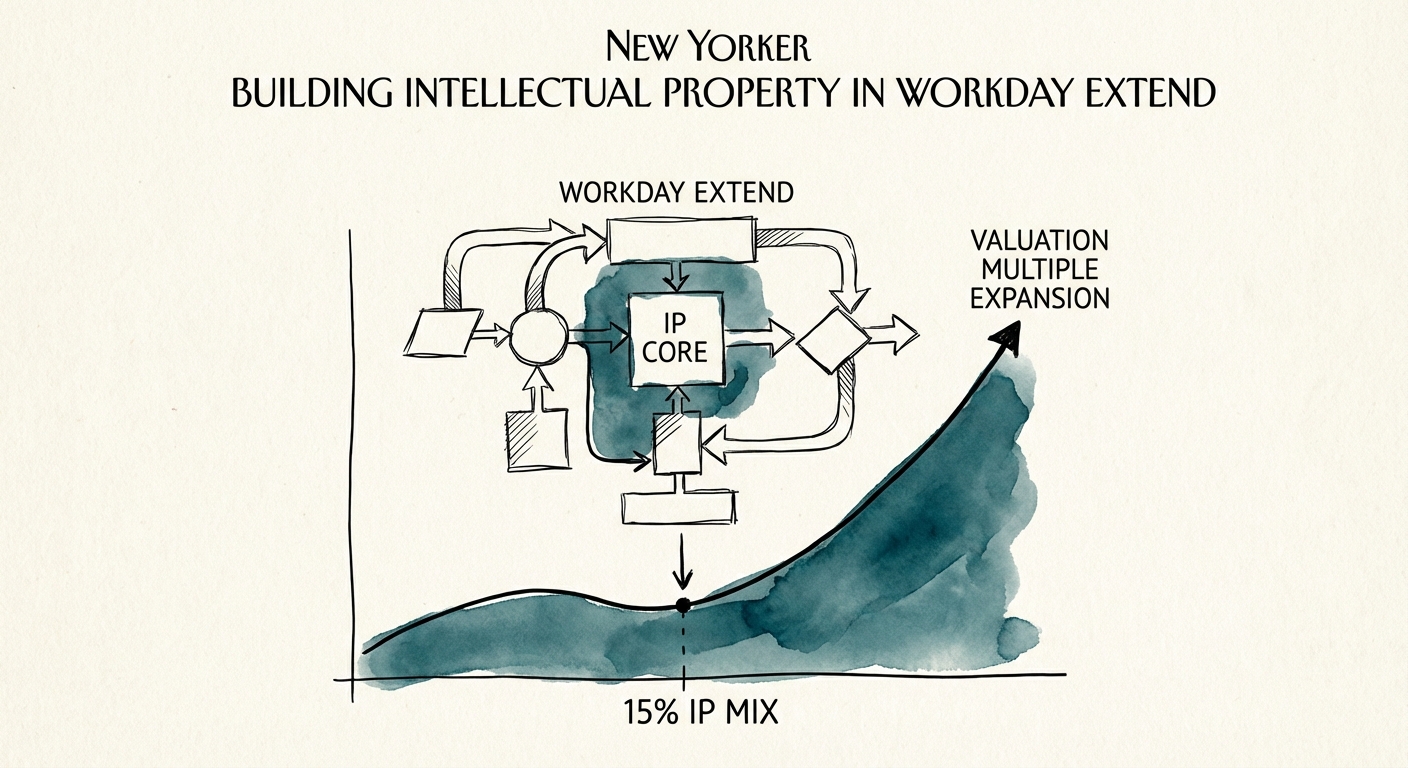
BRIEF · EXIT READINESS
The Workday Extend IP Playbook: Turning a 6x Service Shop into a 12x Platform Partner
Transform your Workday practice from a 6x service shop to a 12x platform partner. A CEO's guide to building, packaging, and monetizing Intellectual Property on Workday Extend.
15% Min. IP Revenue Mix for Valuation Step-Change
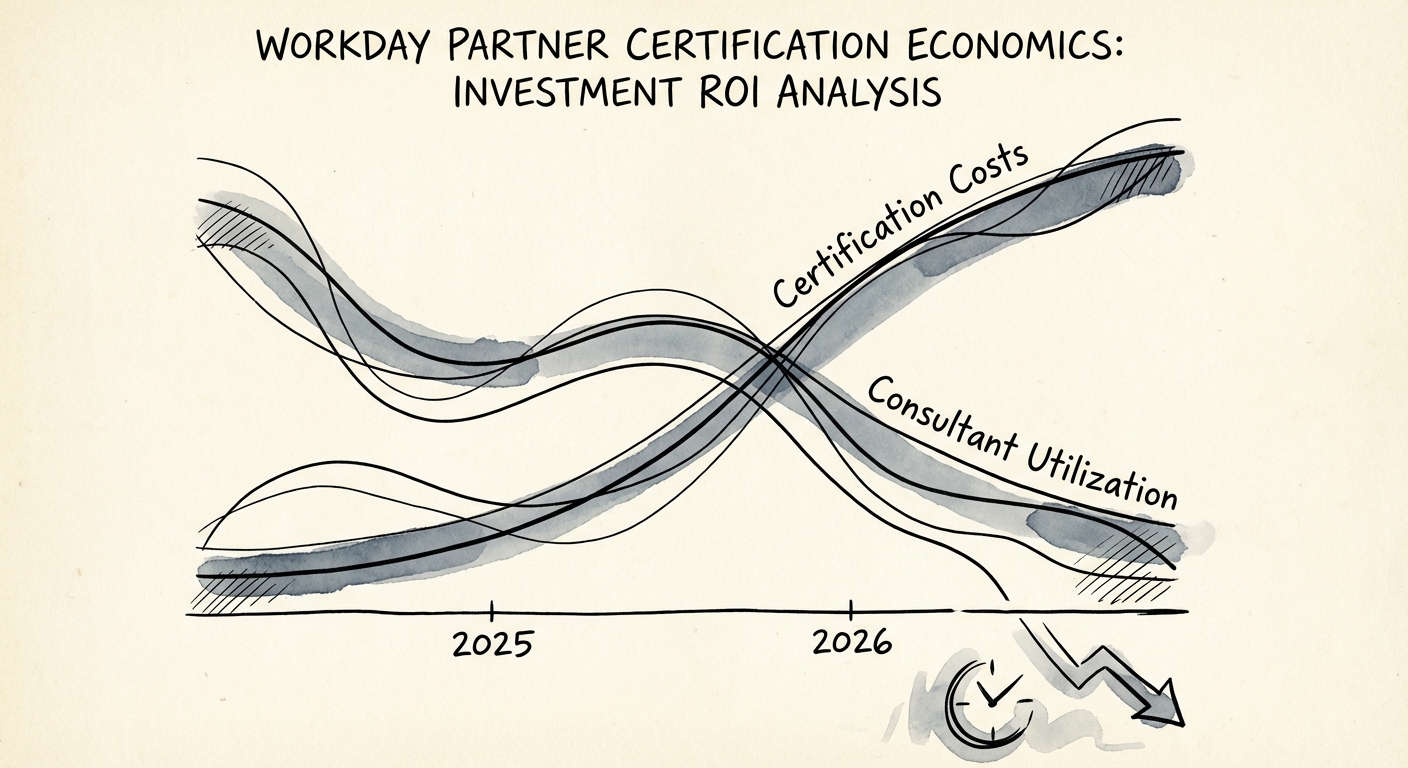
BRIEF · TEAM & HIRING
The Certification Paradox: Why Your Most 'Qualified' Workday Consultants Are Killing Your Margins
Workday certification costs have doubled while utilization rates fell to 68.9%. A diagnostic guide for Service Partners on calculating true ROI, avoiding the 'Paper Tiger' trap, and structuring high-margin teams.
68.9% Avg. Utilization Rate
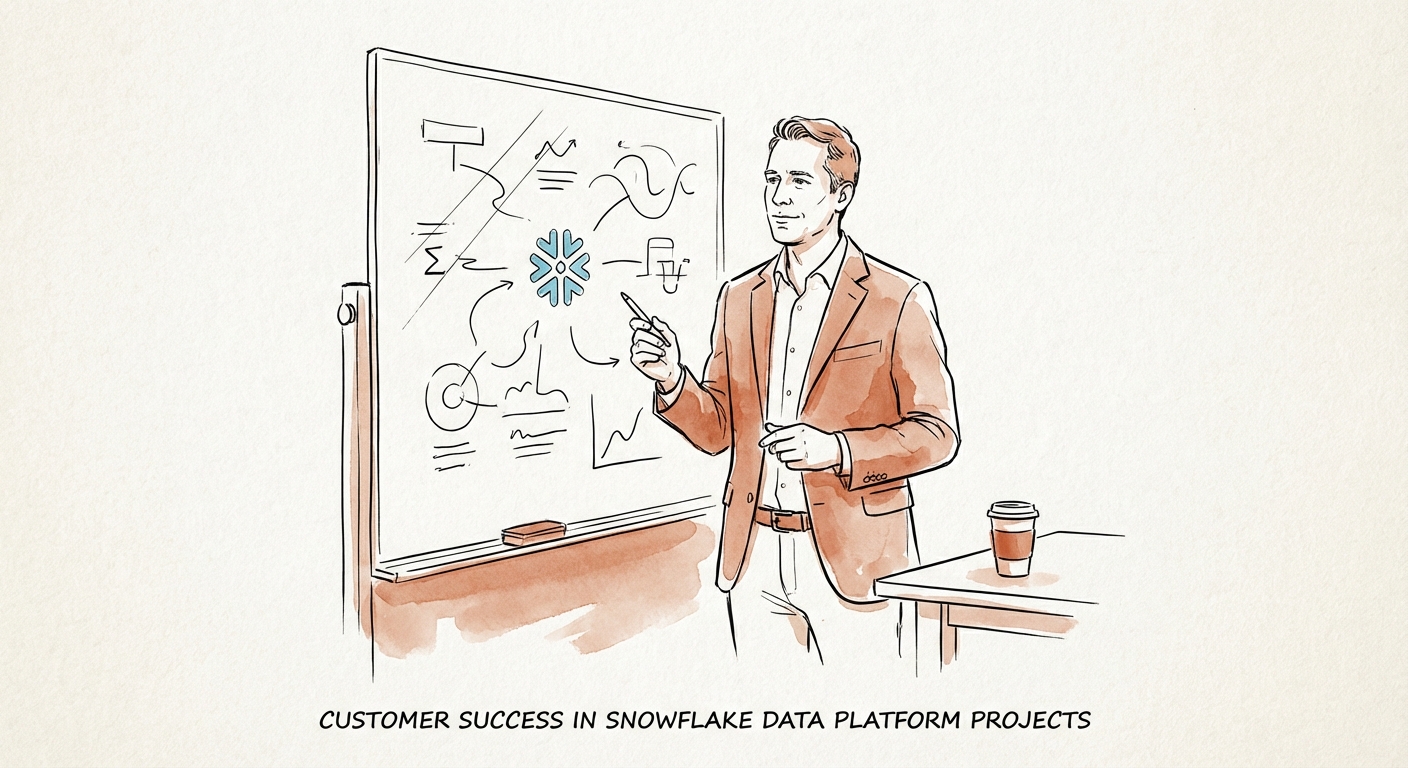
BRIEF · PROCESS DOCUMENTATION
The Snowflake Consumption Cliff: Why Data Projects Burn Cash
A diagnostic guide for executives on preventing Snowflake consumption drift, connecting workloads to business value, and choosing the right implementation partner.
Value mapping Core Governance Gap
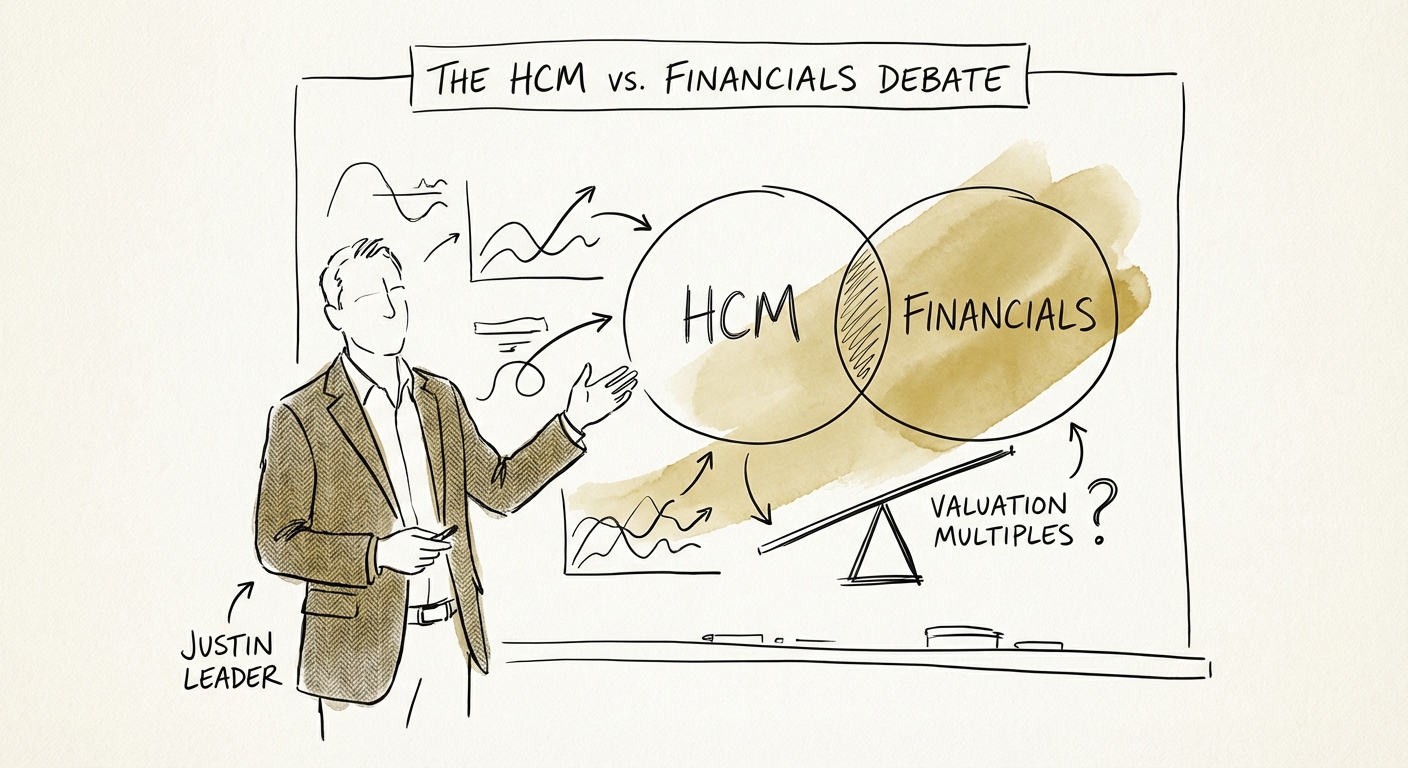
BRIEF · GTM EXECUTION
The HCM vs. Financials Valuation Gap: Why "Full Platform" Strategies Fail
Why Workday Financials practices trade at 12x while HCM shops stall at 6x. A diagnostic for founders deciding where to place their next $1M bet.
40% Valuation Premium for FINS Practices