BRIEF · AI VENDOR AND BUILD-VS-BUY
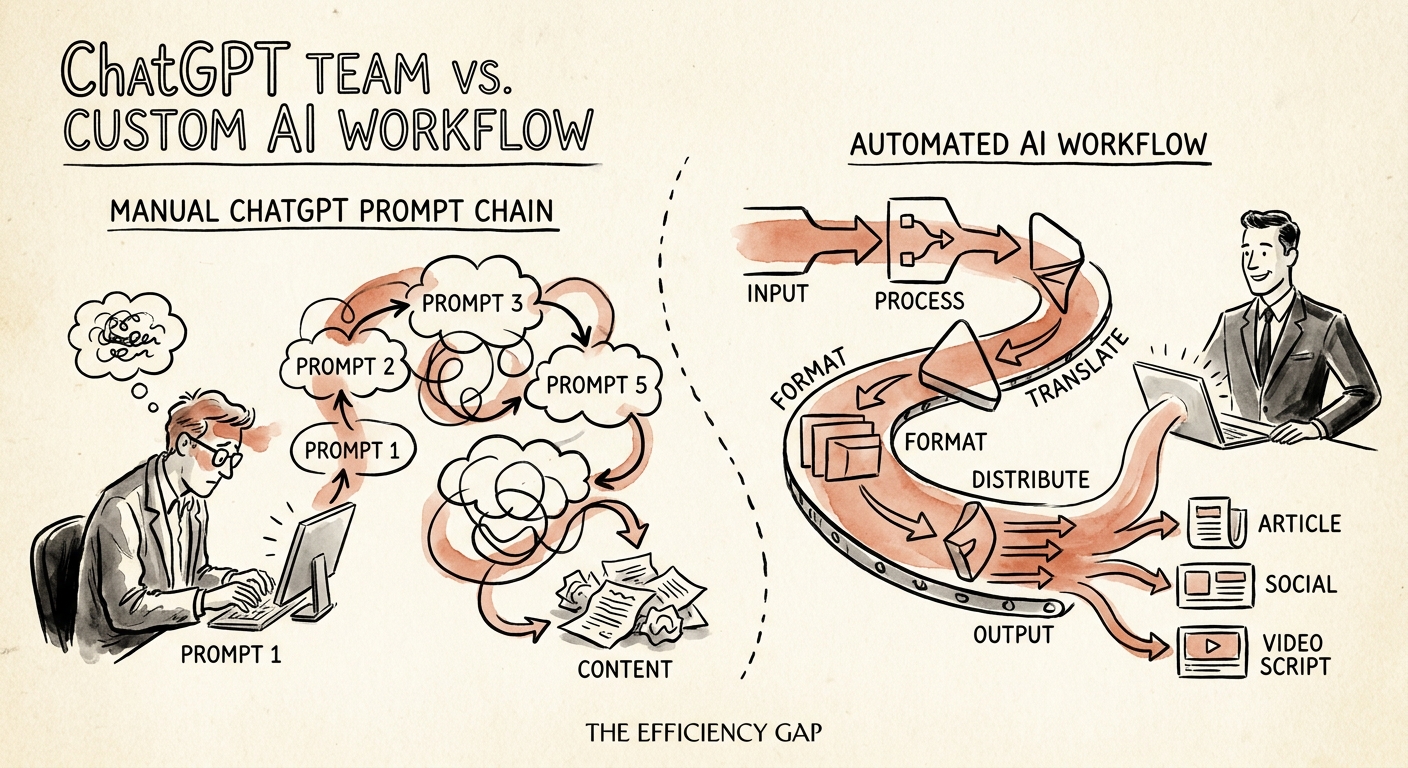
Content Repurposing With AI: ChatGPT Business or a Custom Workflow?
One webinar becomes 14 assets in an afternoon. Here is how a mid-market marketing team decides whether ChatGPT Business is enough or a governed workflow is worth building.
Claims approved-message lineage before channel reuse
BRIEF · AI VENDOR AND BUILD-VS-BUY
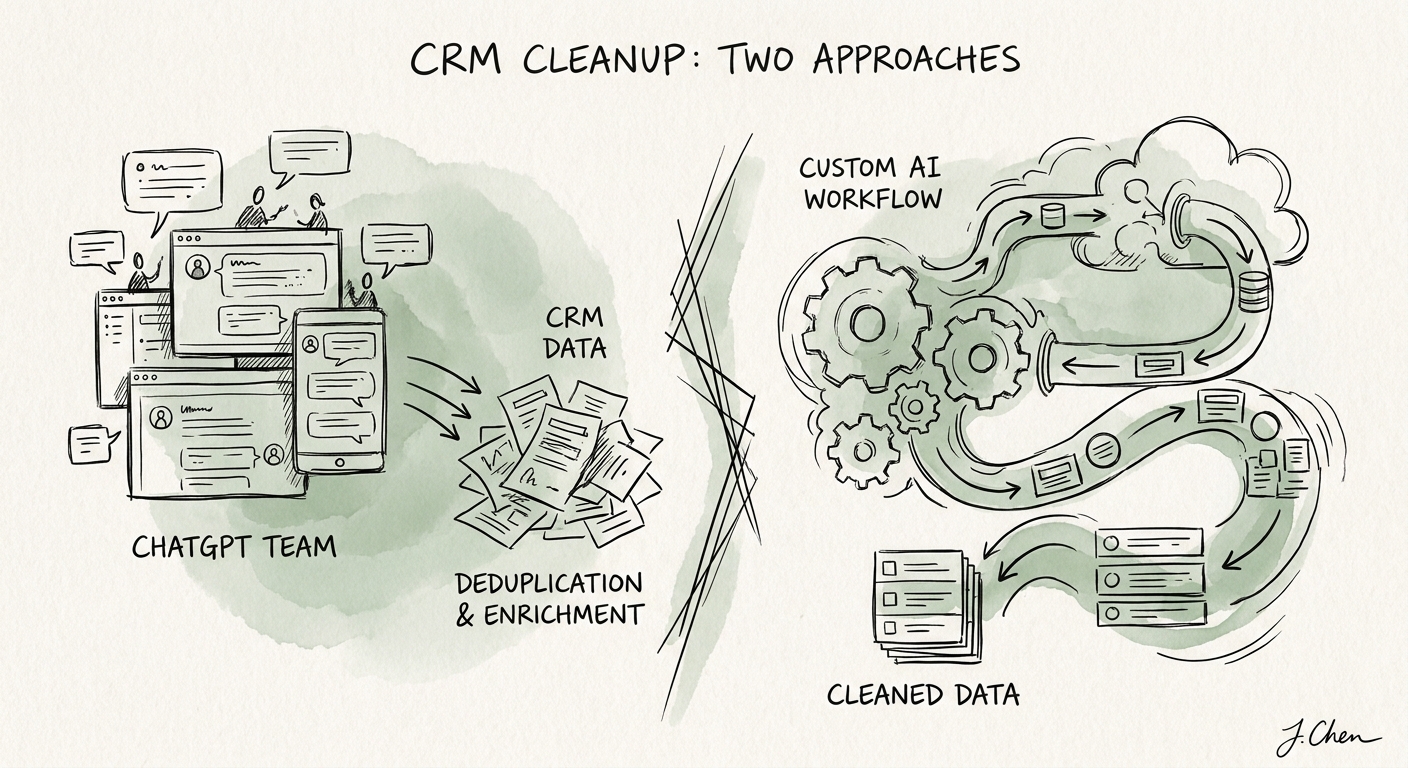
CRM Cleanup with AI: When ChatGPT Business Is Enough, and When It Quietly Breaks Your Forecast
A 50-300 person company's guide to CRM cleanup with AI: where ChatGPT Business is safe, and where a governed workflow protects ownership and forecast fields.
CRM safe field updates with owner approval and rollback trail
BRIEF · AI VENDOR AND BUILD-VS-BUY
Your AI Summarized 600 Support Tickets. The Roadmap Didn't Move.
A 50-300 employee company can summarize customer feedback in ChatGPT Business in an afternoon. Here's when that's enough and when you need a workflow with a quote trail.
Signal feedback themes tied to evidence and next action
BRIEF · AI VENDOR AND BUILD-VS-BUY
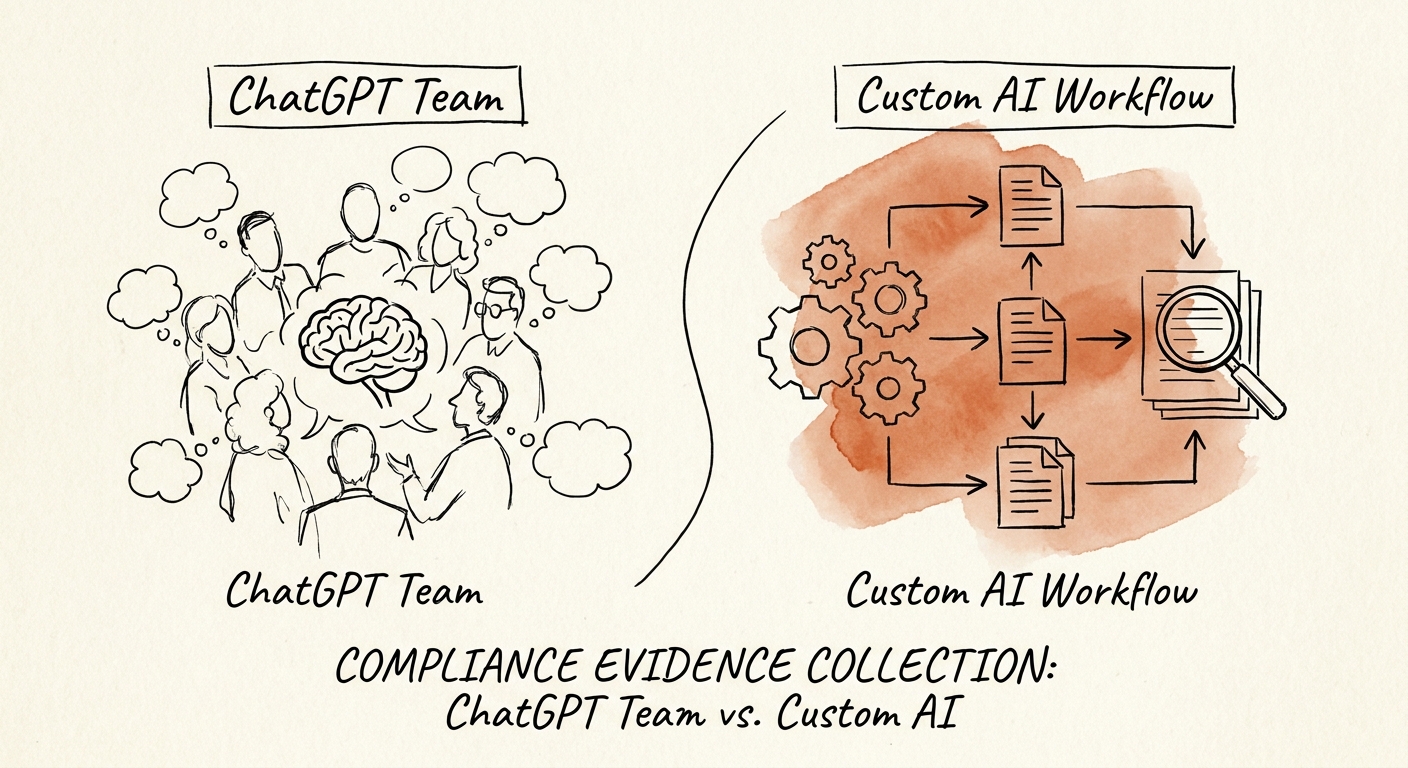
ChatGPT Business or a Custom Workflow for SOC 2 Evidence Collection?
An auditor will ask where each screenshot came from. Here is how a 50-300 person company decides if evidence collection belongs in ChatGPT Business or a built workflow.
Trace control evidence linked to source, owner, and exception status
BRIEF · AI MEASUREMENT AND ROI
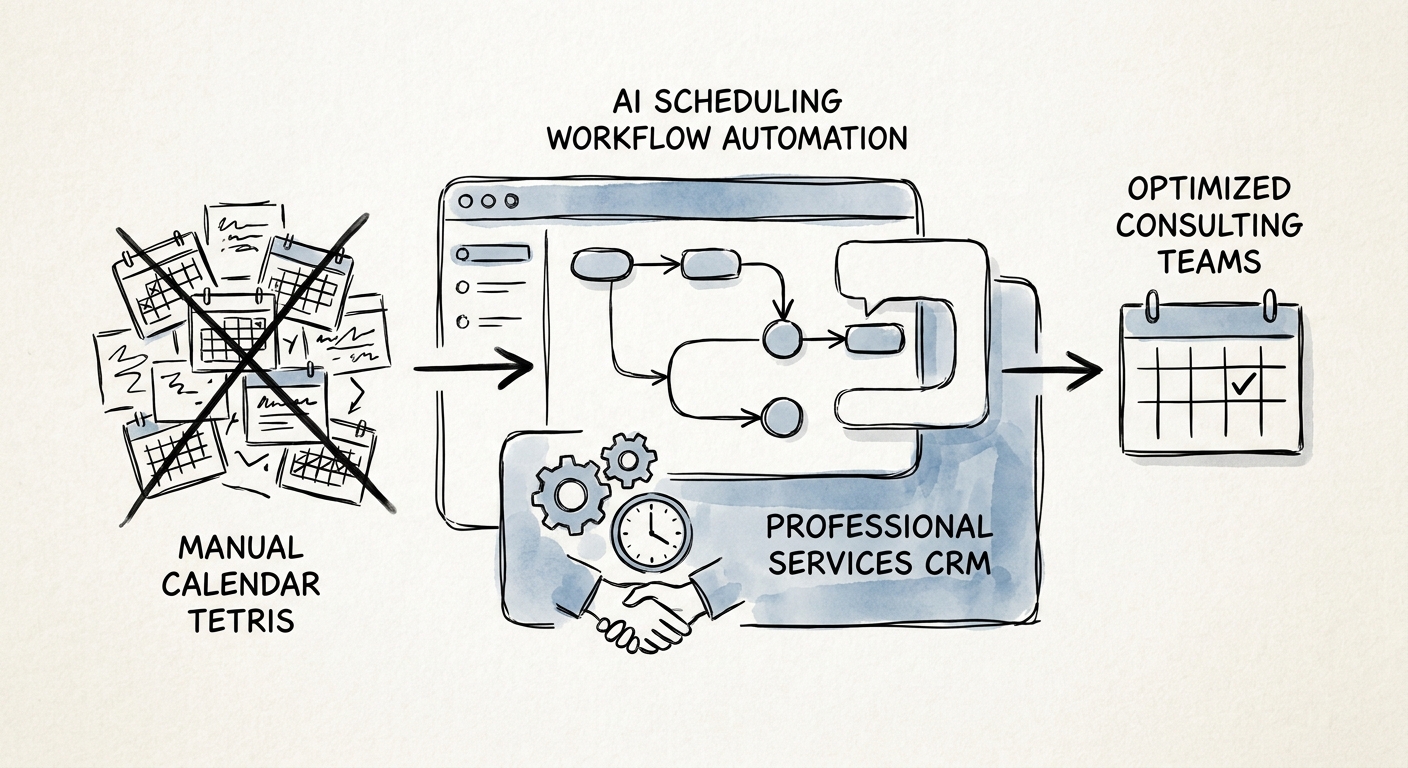
When Your Best Consultant Is Double-Booked: Scheduling AI for Software Implementation Firms
Your senior consultants are the bottleneck and the calendar is where deals slip. How to pilot scheduling AI in one delivery lane and prove it protects go-lives.
1 calendar lane One constrained scheduling lane before rollout
BRIEF · AI MEASUREMENT AND ROI
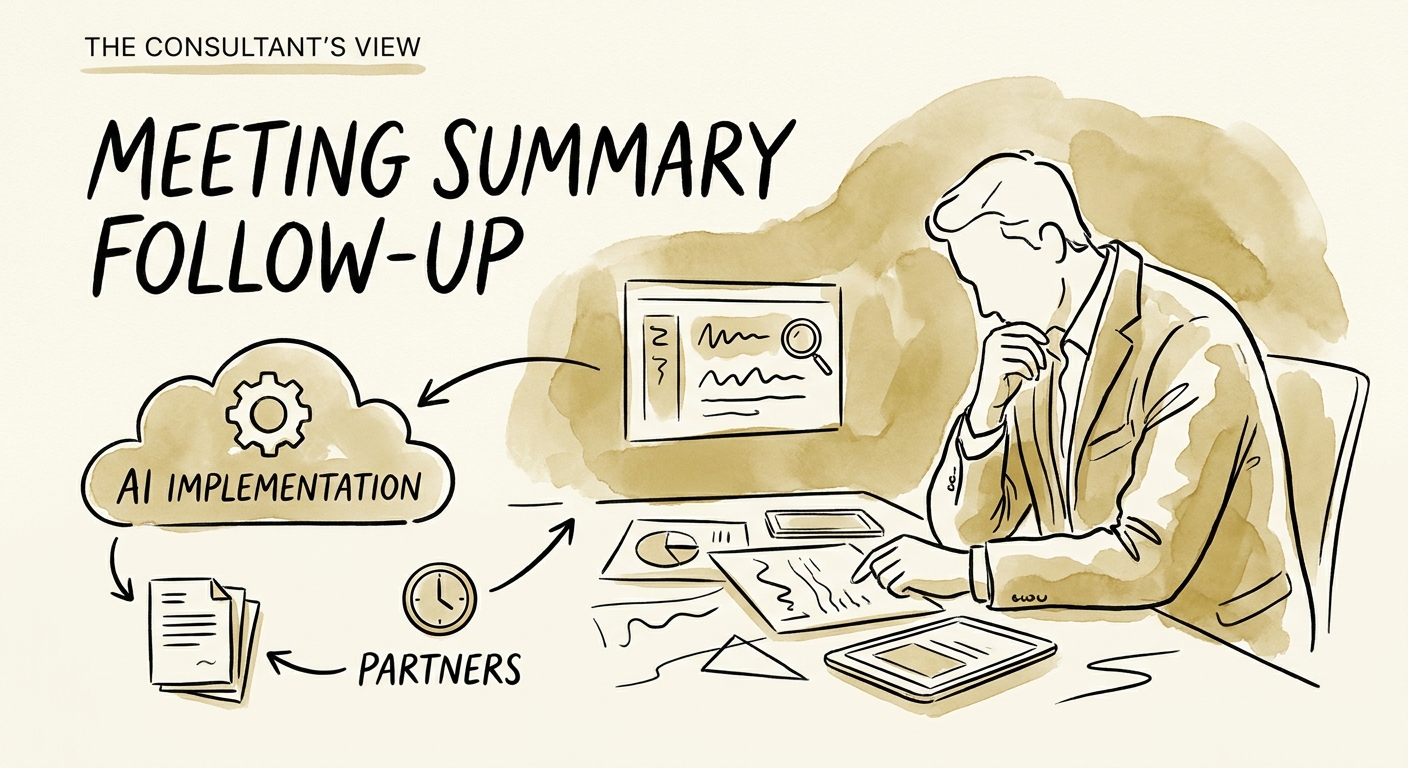
The Scope Change Nobody Logged: AI Meeting Follow-Up for Software Implementation Partners
For software implementation partners, the first AI win isn't tidier notes—it's catching the unlogged scope change before it eats your margin. Here's how to pilot it.
1 handoff One delivery handoff to prove workflow value
BRIEF · AI INDUSTRY USE CASES
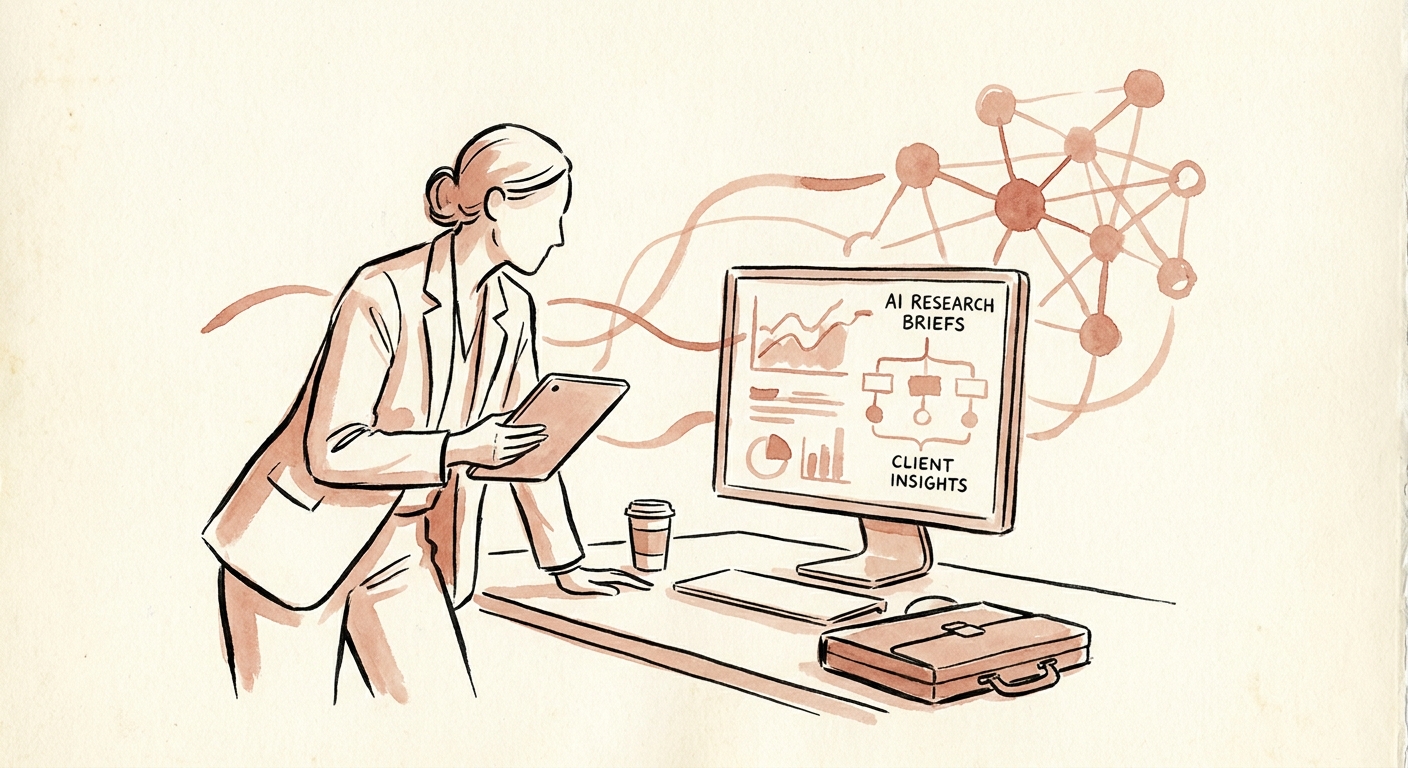
AI Account Research for Consulting Firms: From 90 Minutes of Tab-Hopping to a Partner-Ready Brief
How a consulting firm can use AI to build pre-call account briefs that cite their sources, respect client confidentiality, and earn the partner's first question.
4 account research controls before scale
BRIEF · AI VENDOR AND BUILD-VS-BUY
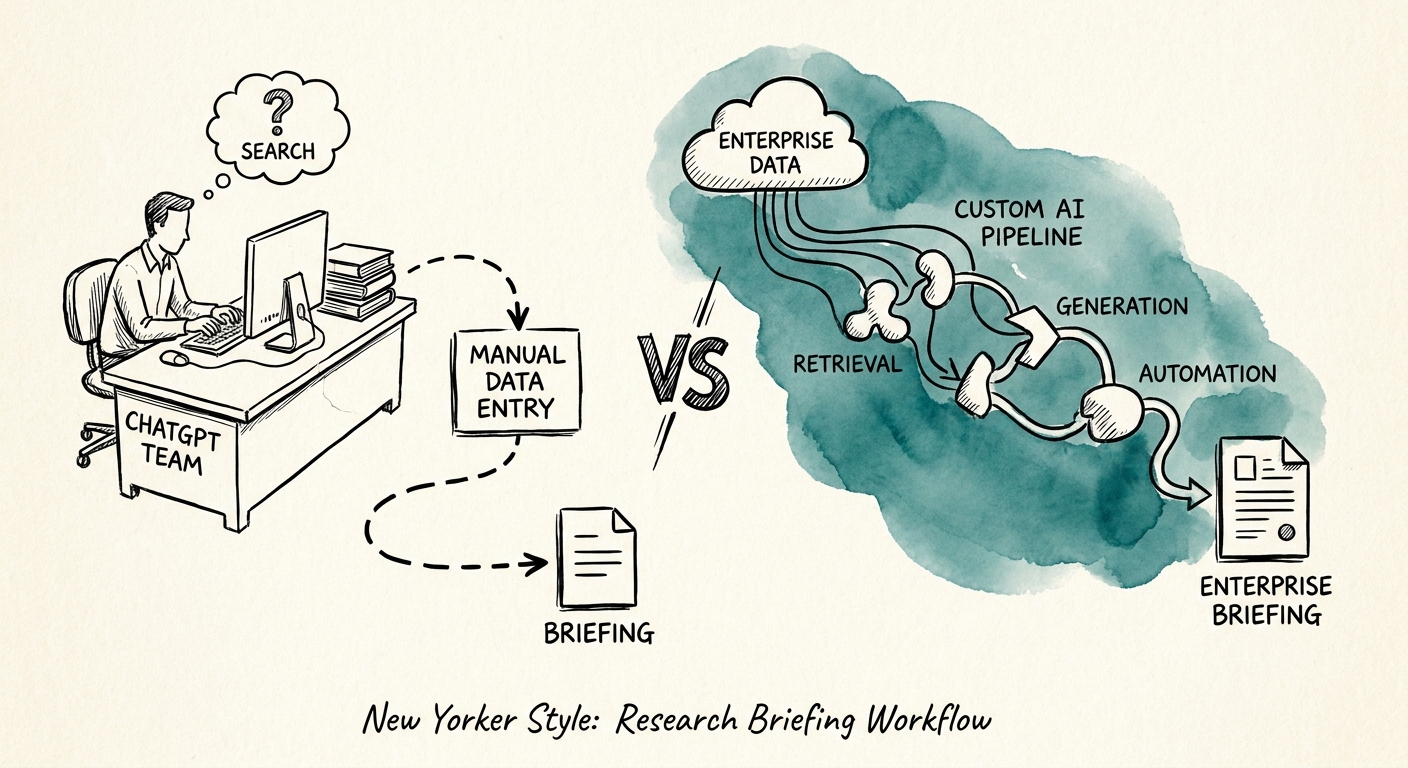
ChatGPT Team or a Custom Briefing Workflow? The Test Is Whether Anyone Acts on the Brief
A market brief from ChatGPT looks polished until a rep cites a stale number on a call. Here's when SMB teams should govern the briefing process instead.
2 paths to compare: assisted workspace and governed workflow
BRIEF · AI INDUSTRY USE CASES
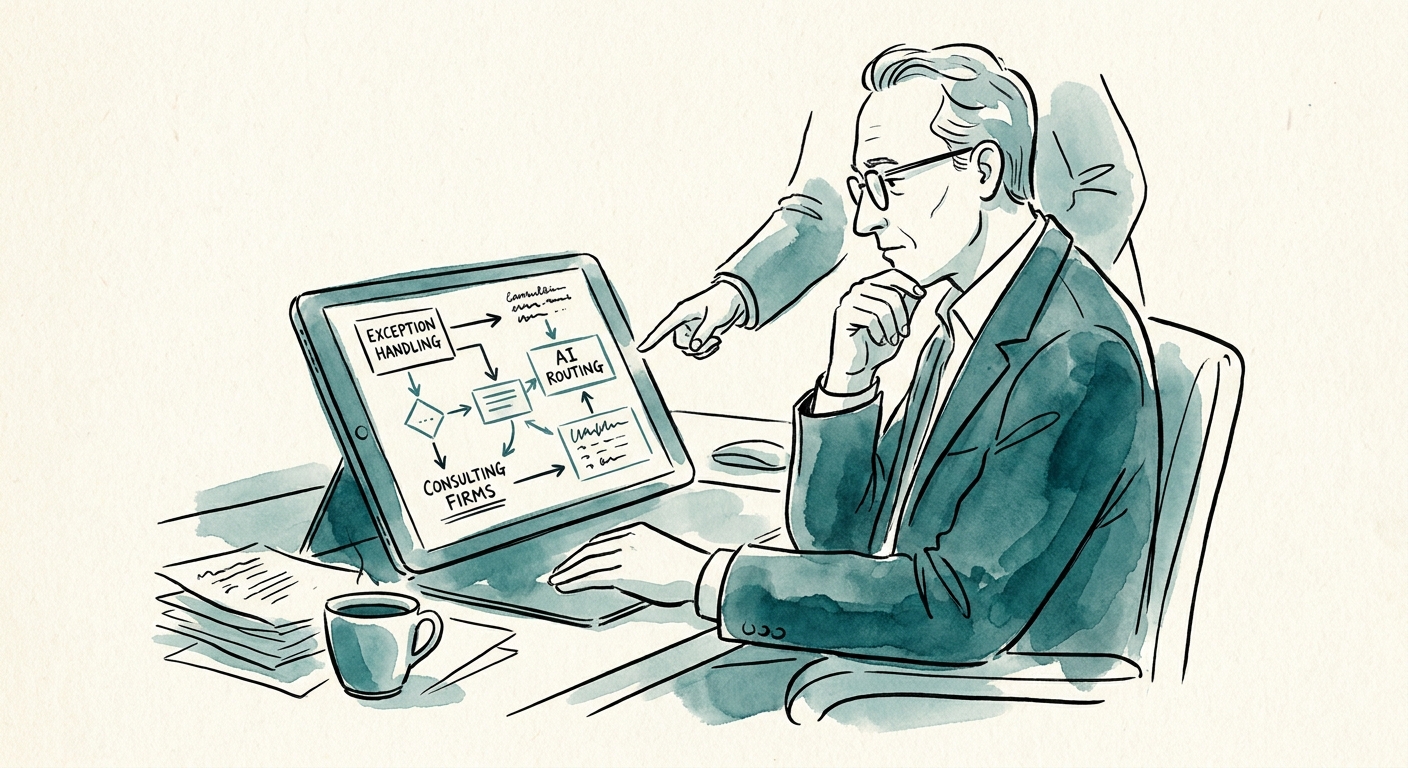
When Two Partners Both Need Your Best Architect Friday: AI Dispatch Exceptions for Consulting Firms
Two engagements, one senior consultant, a client call in 48 hours. How consulting firms can use AI to route staffing exceptions to the right owner before they escalate.
1 exception owner assigned before escalation
BRIEF · AI KNOWLEDGE SYSTEMS
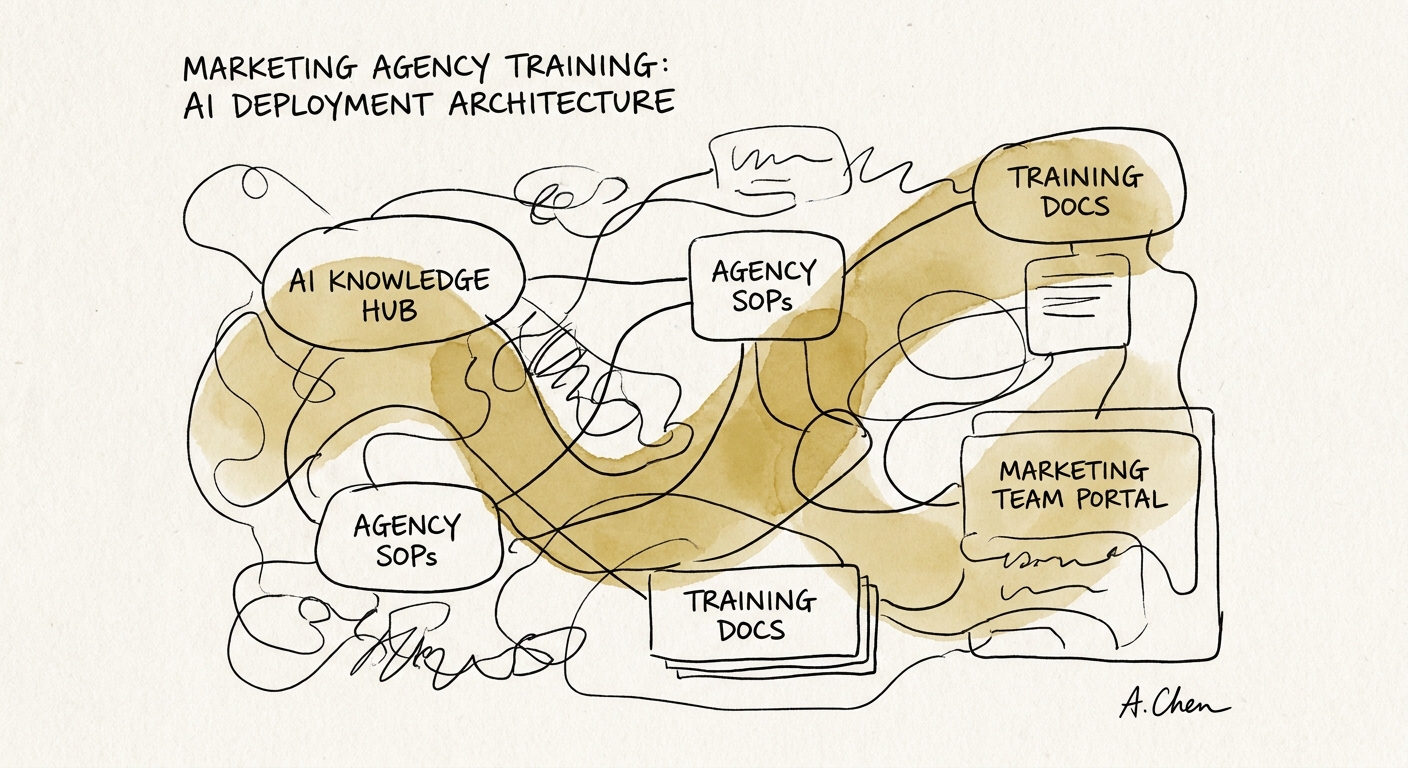
The Agency Onboarding Doc Nobody Can Find: An AI Knowledge System for Training Materials
Your agency's training docs exist — but no one can find the approved version fast enough. How to build a governed AI knowledge system that actually gets used.
32% AI use at 100-249 employee firms
BRIEF · AI KNOWLEDGE SYSTEMS
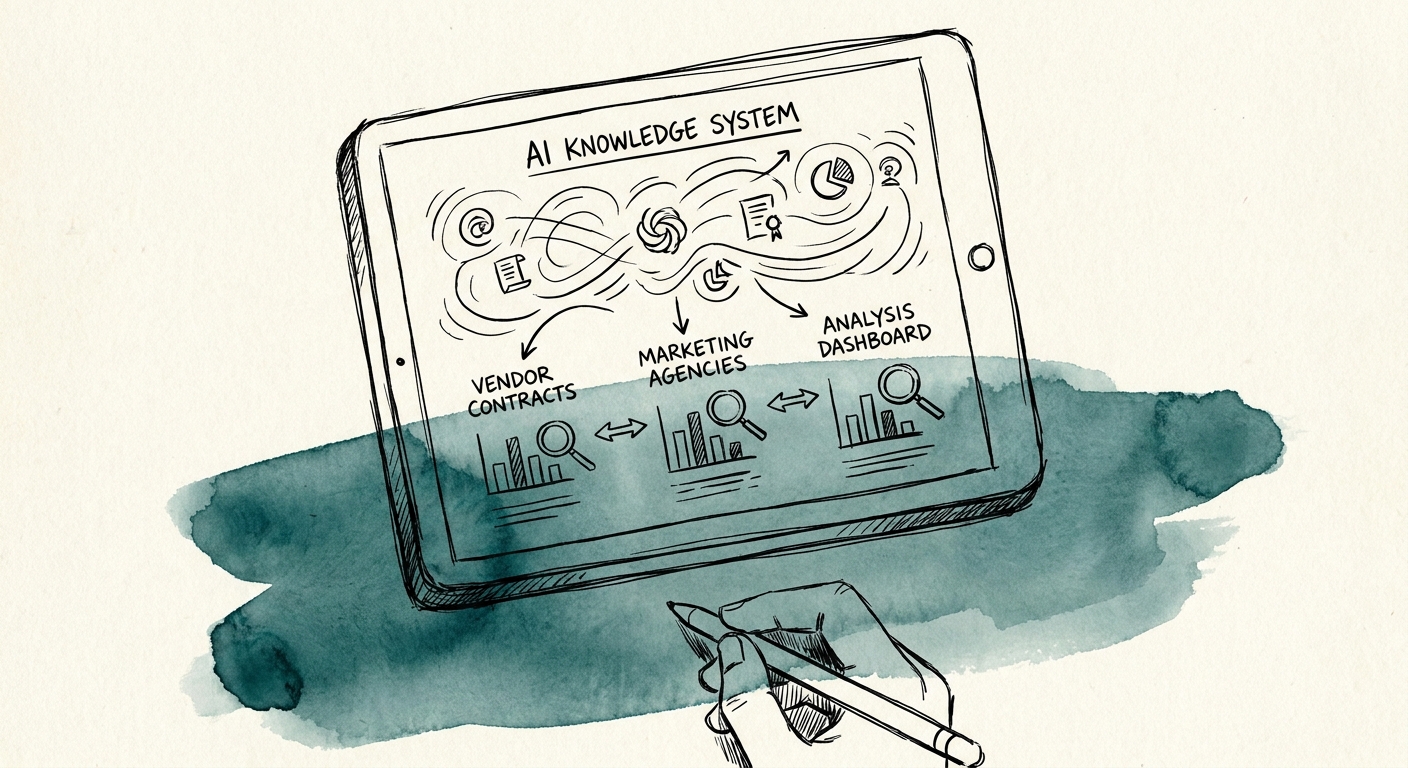
The Renewal You Missed: An AI Knowledge System for Your Agency's Vendor Contracts
Agencies lose money to stale rate cards, missed auto-renewals, and buried exclusivity clauses. Here's how to build a governed AI layer over your vendor contract library.
21% leaders with mature agent governance
BRIEF · AI KNOWLEDGE SYSTEMS
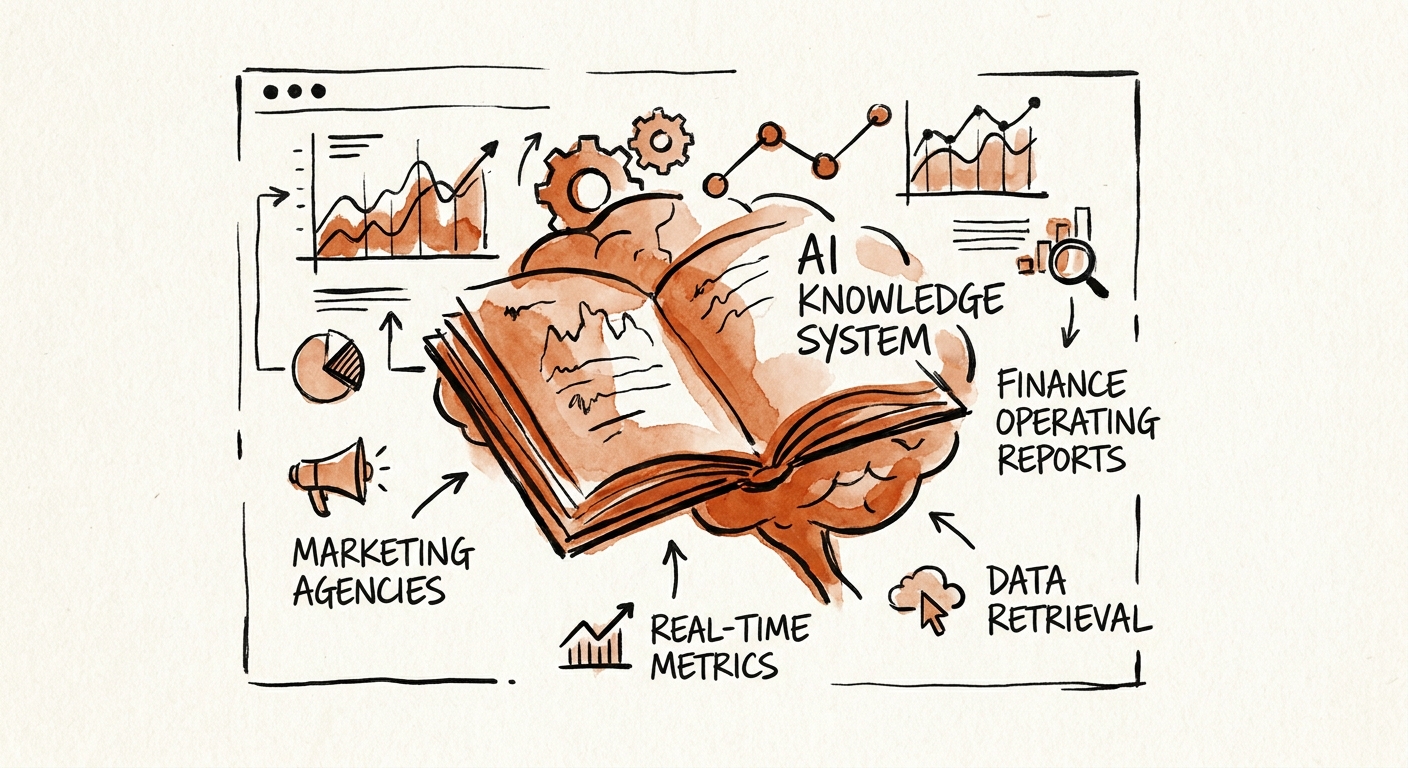
The Agency Finance Report Everyone Asks For and Nobody Can Find
Your agency's utilization, retainer burn, and client margin numbers exist — in someone's head. How to build a governed AI knowledge layer that surfaces the approved version.
32% AI use at 100-249 employee firms
BRIEF · AI WORKFLOW AUTOMATION
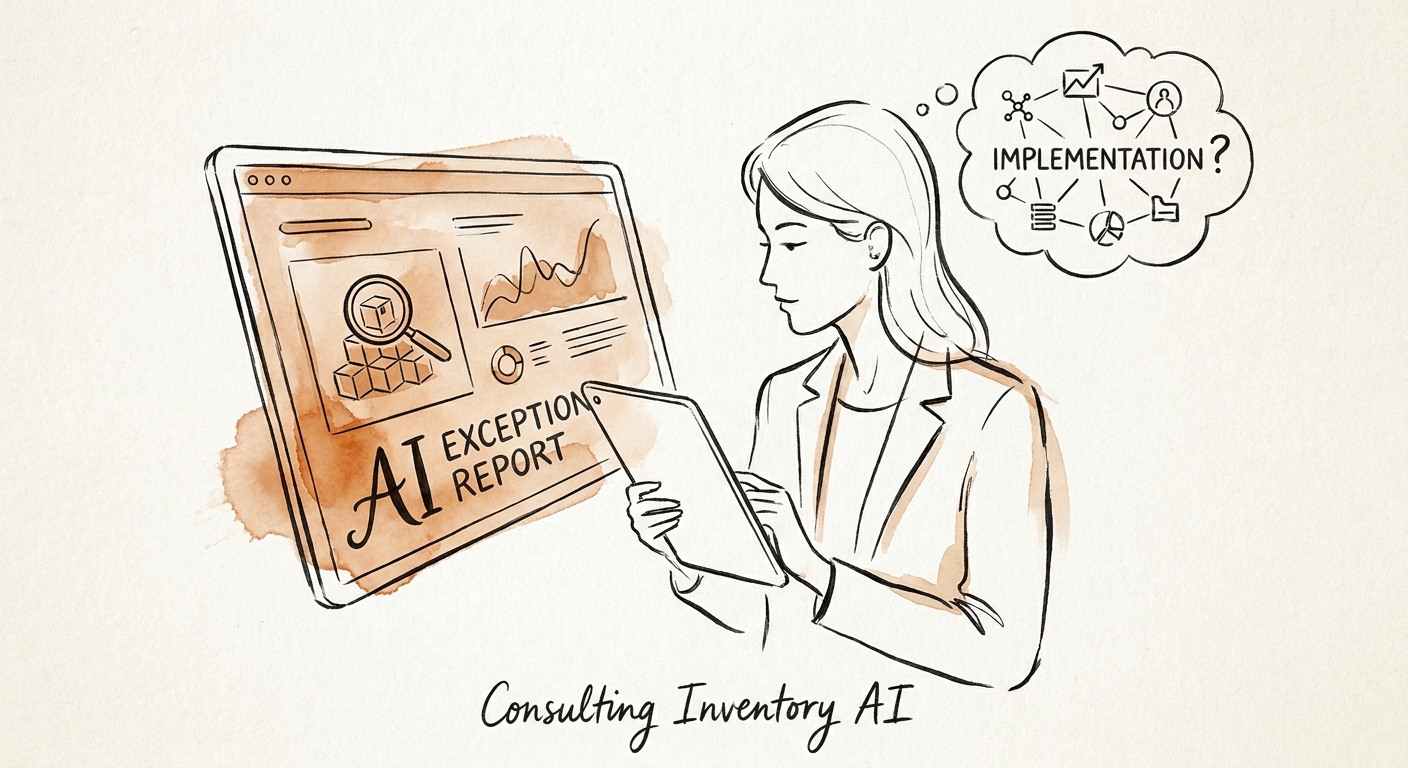
The Margin Leak Consulting Firms Find Too Late: AI Exception Reporting for Capacity and Licenses
In consulting, the costly exceptions are an over-allocated senior, an idle license, a project missing inputs. Build one AI exception queue that catches them early.
1 queue One exception queue before broader automation
BRIEF · AI FUNCTION USE CASES
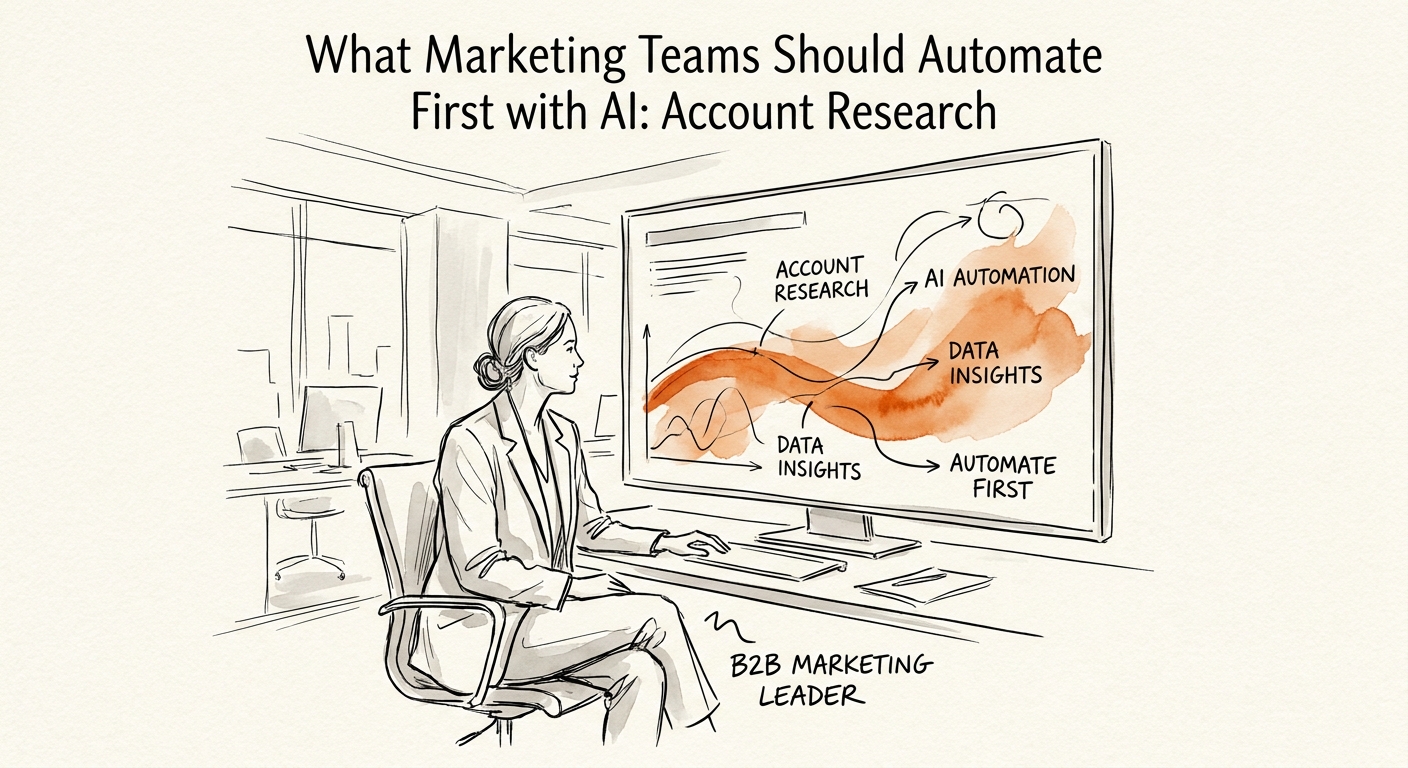
The First AI Workflow Marketing Should Build: Account Research That Sales Will Actually Trust
Why a B2B services marketing team should make account research its first AI build — and how to structure briefs so sellers stop ignoring them.
Source-linked briefs first marketing AI output
BRIEF · AI KNOWLEDGE SYSTEMS
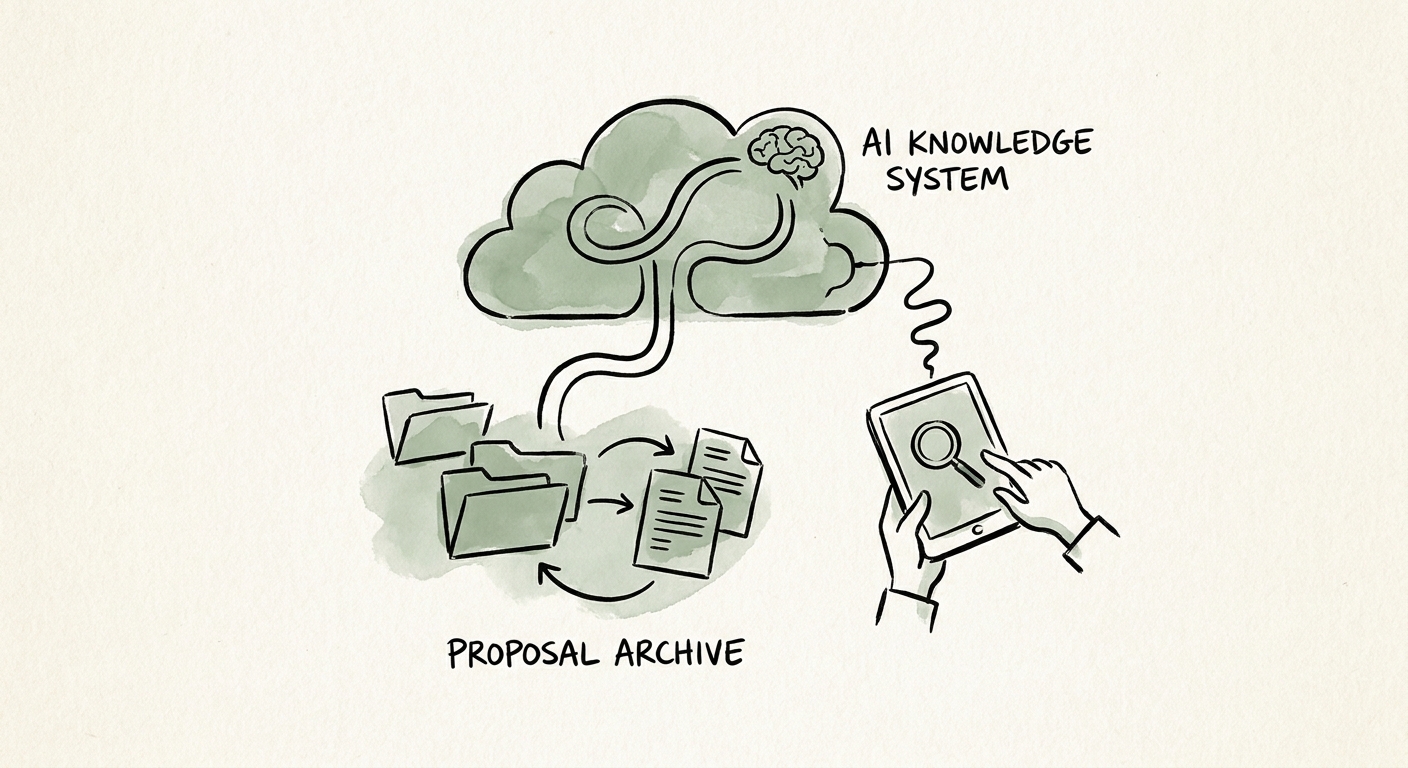
Your Agency's Proposal Archive Is a Liability Until AI Can Cite Its Sources
A marketing agency's old proposals are full of expired pricing and client-named results. Here's how to let AI reuse them without reselling a promise you can't keep.
32% AI use at 100-249 employee firms
BRIEF · AI KNOWLEDGE SYSTEMS
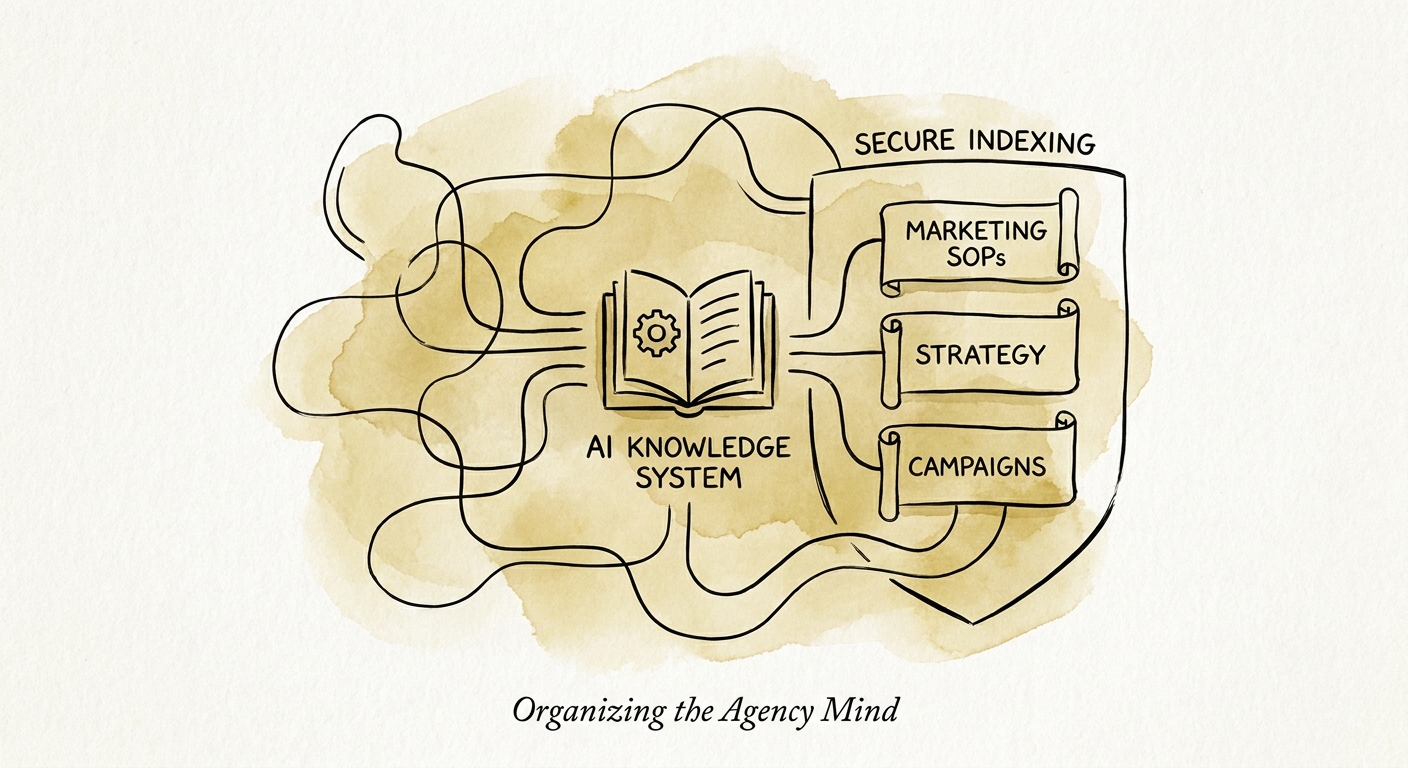
The Agency SOP Problem AI Can't Fix Until You Fix the Source
Three versions of the same onboarding SOP live in three Google Docs. Here's how agencies make AI answer process questions without spreading the wrong one.
34% Companies using AI to deeply transform the business
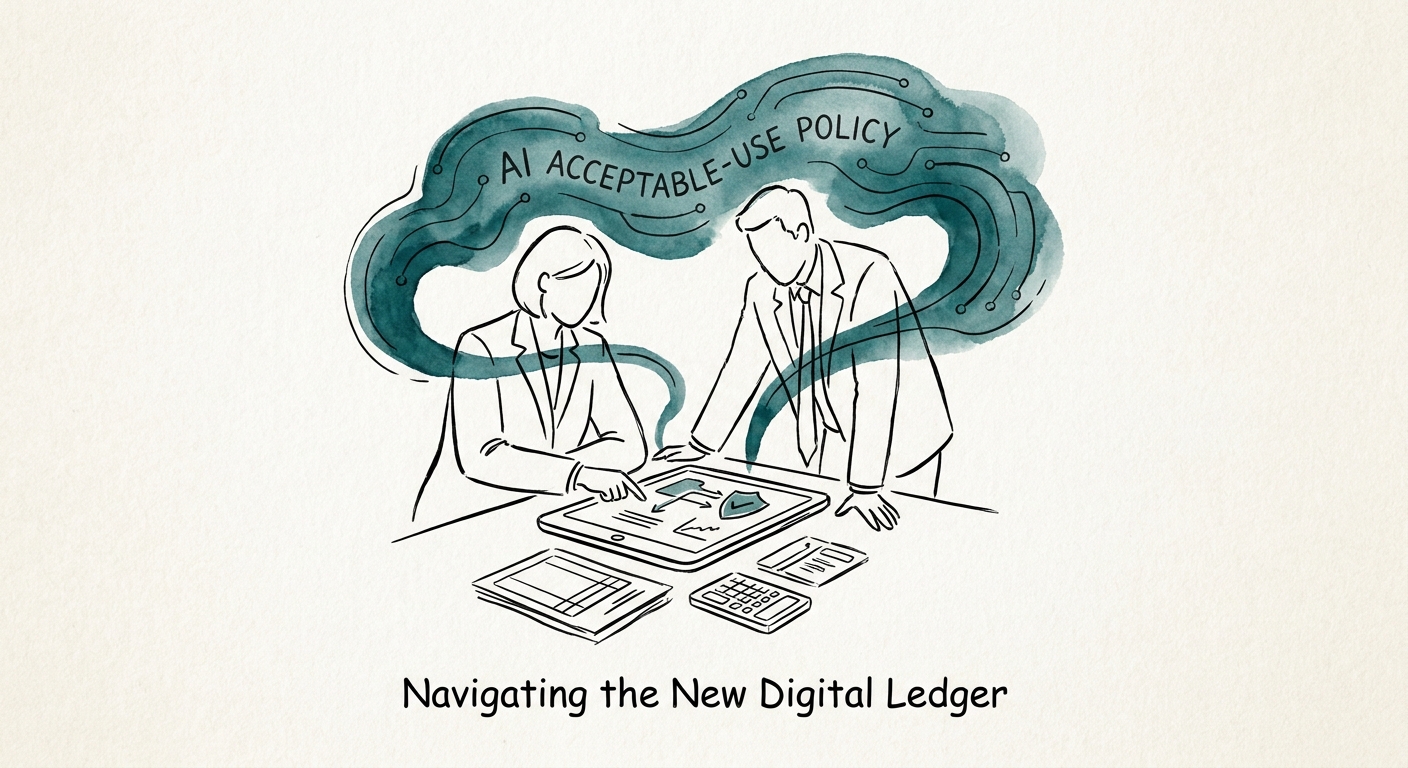
BRIEF · AI GOVERNANCE AND TRAINING
The AI Acceptable-Use Policy Every Accounting Firm Needs Before Busy Season
A one-page AI acceptable-use policy for accounting firms: what staff can draft, what never touches a public chatbot, and who signs off before it hits the file.
3 governance rules before broad workflow automation
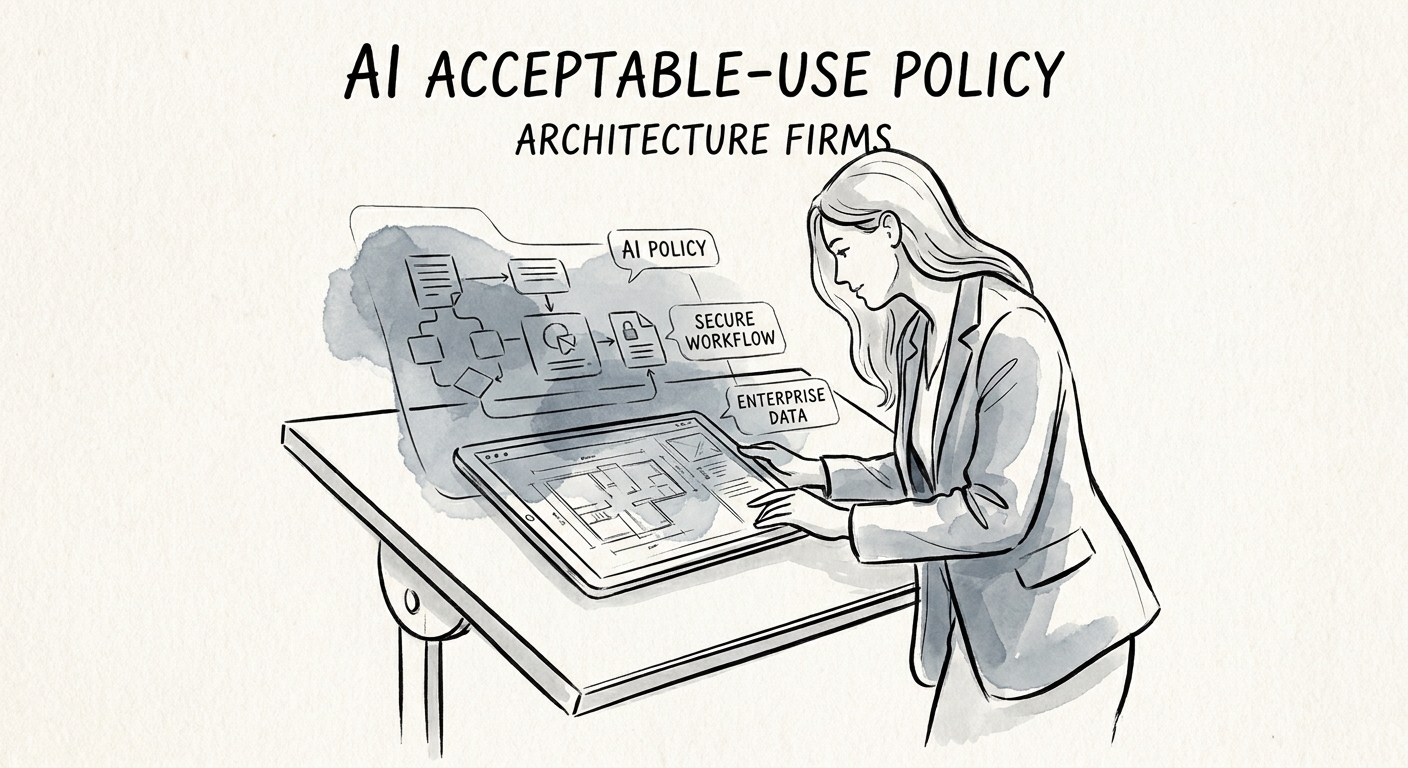
BRIEF · AI GOVERNANCE AND TRAINING
An AI Acceptable-Use Policy Architecture Firms Will Actually Follow
A practical AI acceptable-use policy for architecture firms: protect owner program data and unissued drawings, and keep code calls with a licensed reviewer.
3 governance rules before broad workflow automation
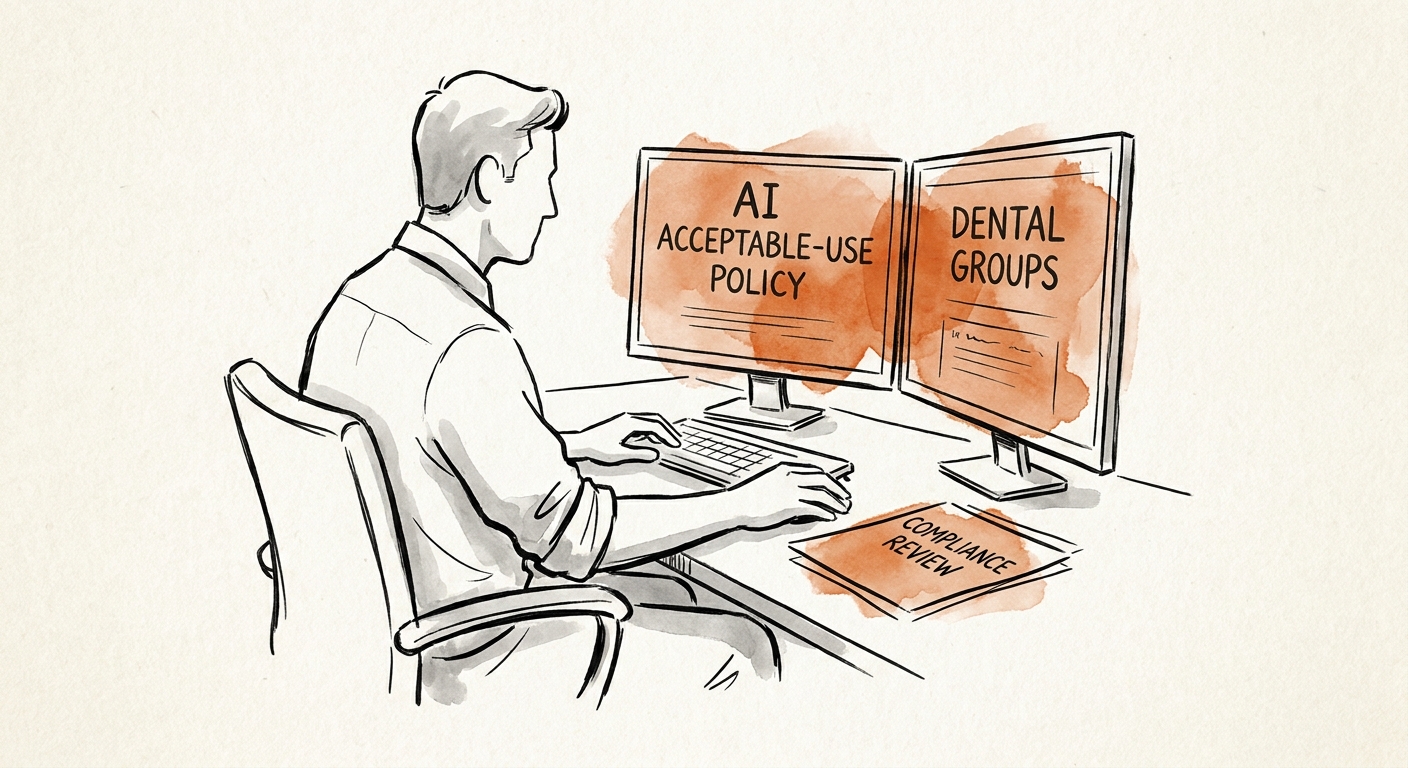
BRIEF · AI GOVERNANCE AND TRAINING
An AI Acceptable-Use Policy That Survives a Busy Front Desk (Dental Groups)
The AI rules a multi-location dental group actually needs: what front-desk and billing staff can paste into a chatbot, and what they never can.
3 governance rules before broad workflow automation
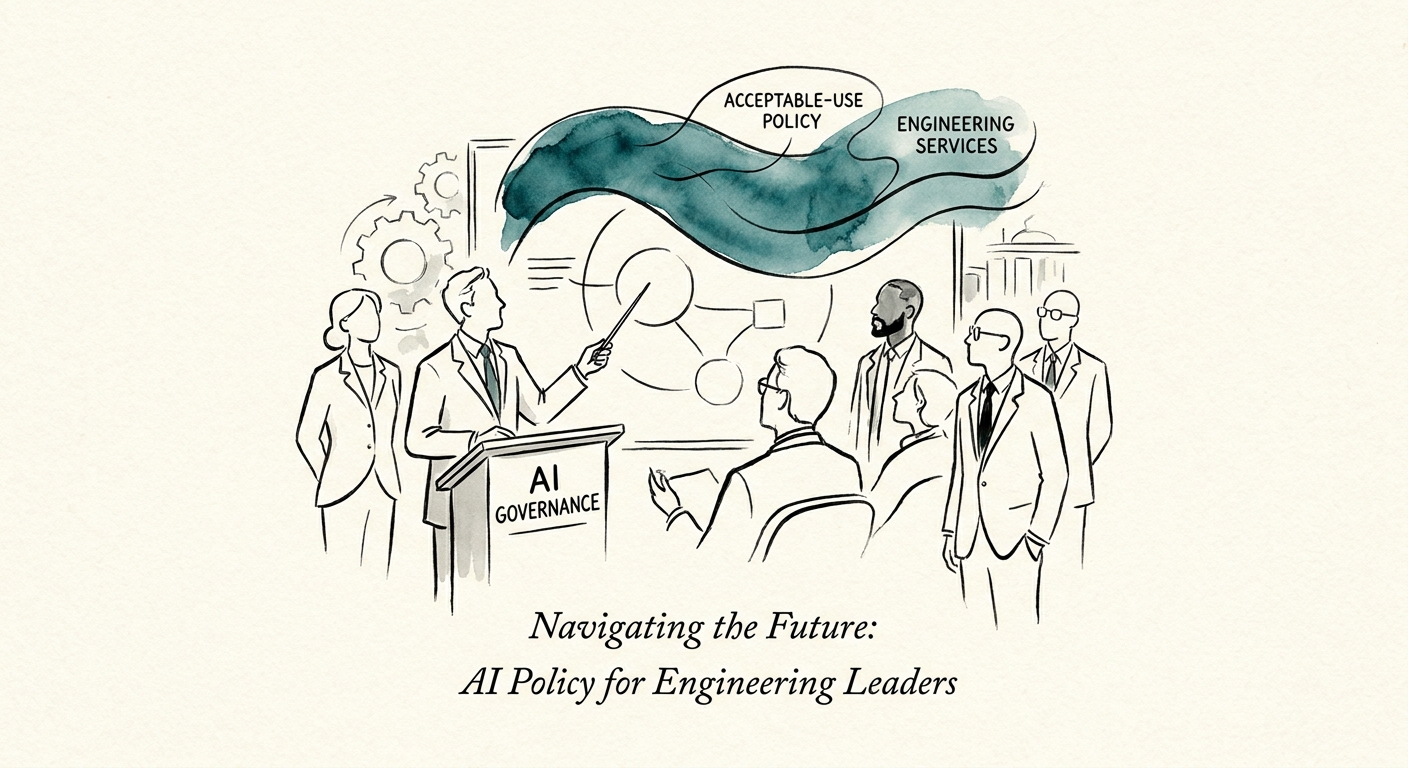
BRIEF · AI GOVERNANCE AND TRAINING
The AI Use Policy Your Stamping Engineer Will Actually Defend
A practical AI acceptable-use policy for engineering services firms: what AI can touch, what stays behind the stamp, and who owns the review.
3 governance rules before broad workflow automation
BRIEF · AI GOVERNANCE AND TRAINING
The AI Use Policy Your Front Desk and Billing Team Actually Need
A healthcare admin AI policy that survives a denial appeal and a scheduling note. What billing, intake, and front-desk staff can paste, and what they can't.
3 governance rules before broad workflow automation
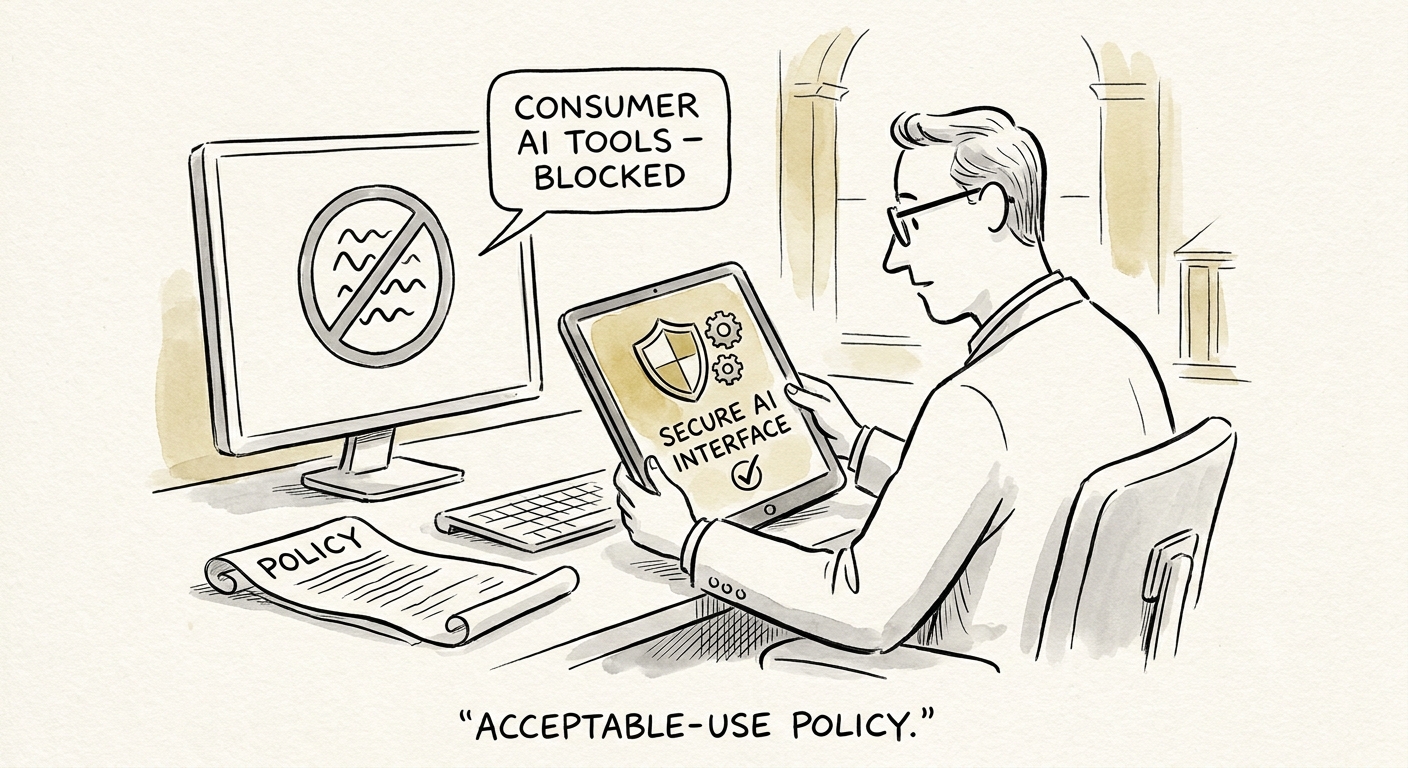
BRIEF · AI GOVERNANCE AND TRAINING
The AI Use Policy IT Services Firms Actually Need: What an Engineer Can Paste, and What Gets Someone Fired
An IT services AI policy that maps the real risk: a tier-2 engineer pasting a client's logs into ChatGPT. The allowlist, restricted-data list, and 90-day rollout.
3 governance rules before broad workflow automation
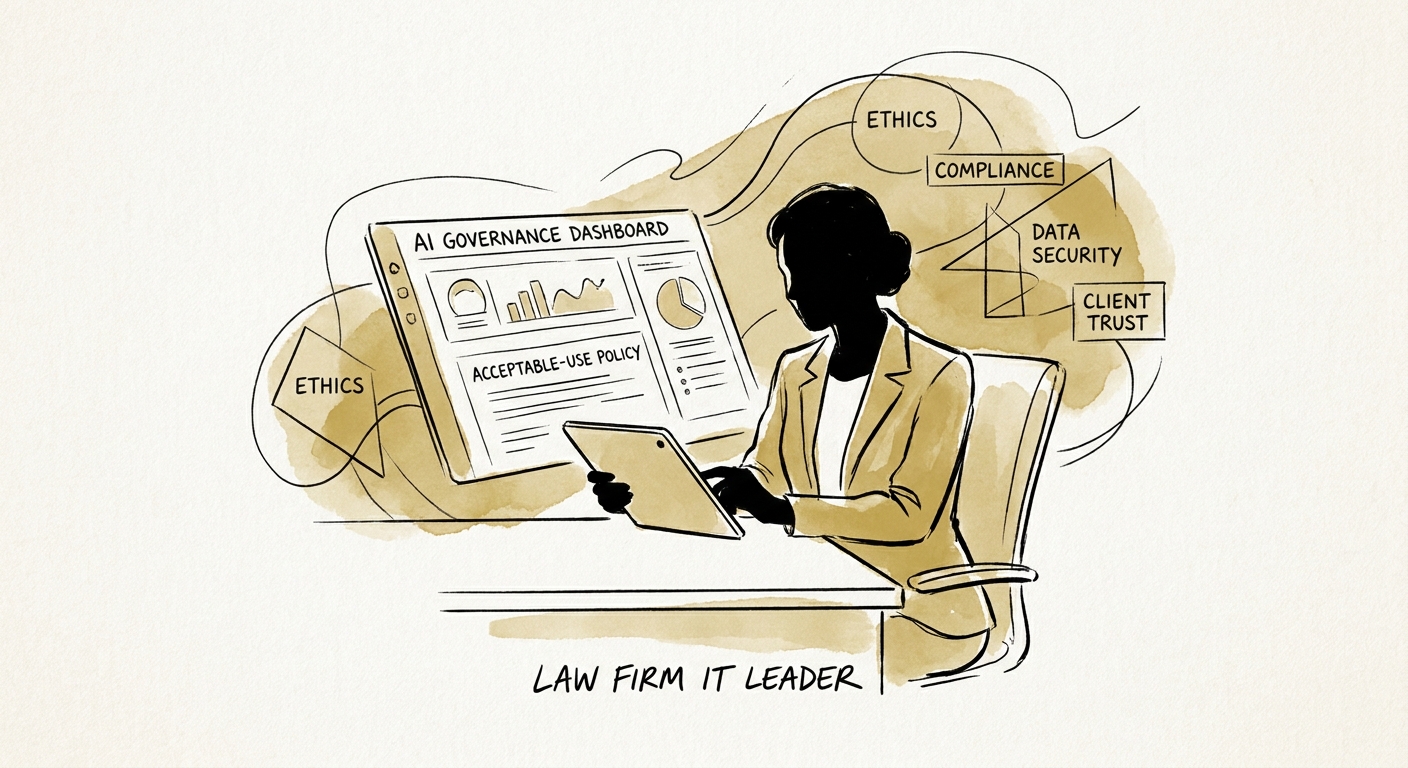
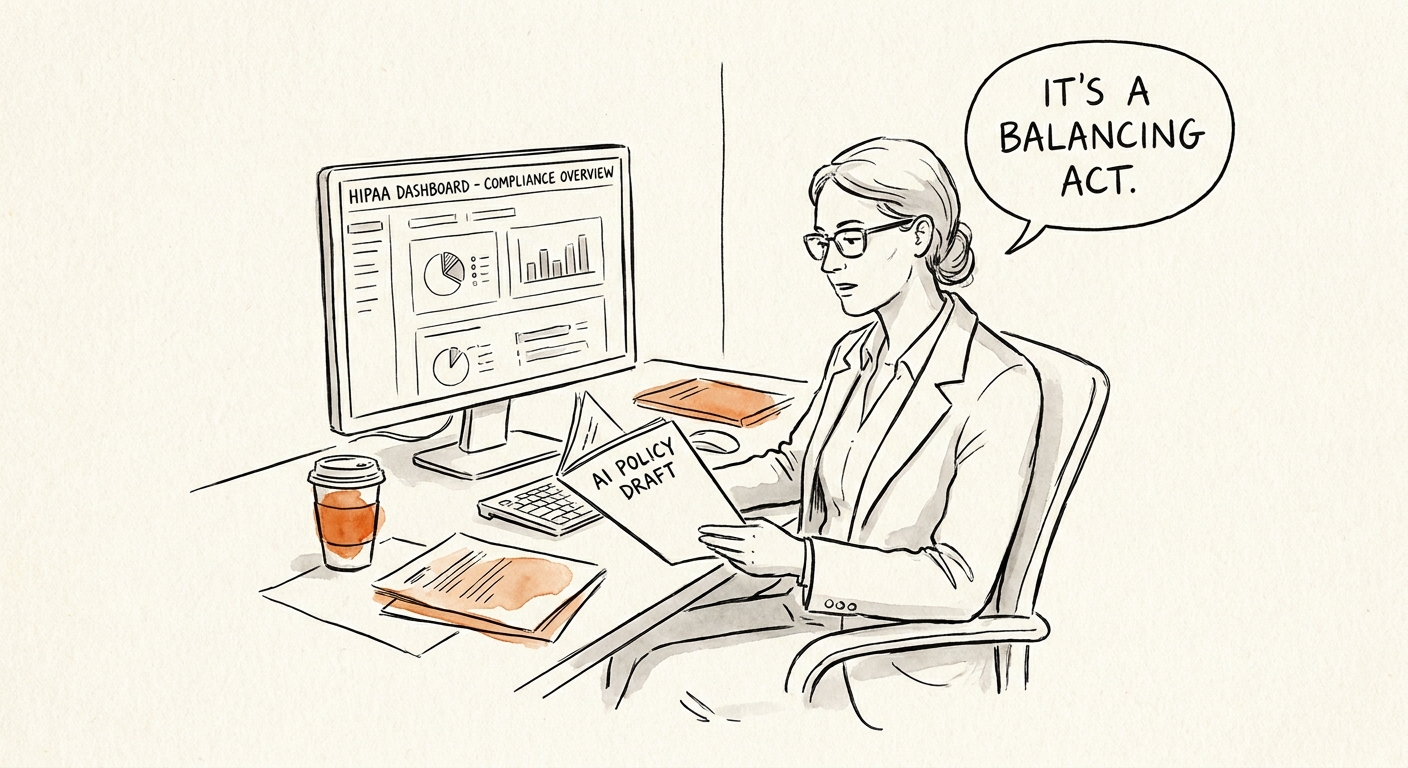
BRIEF · AI GOVERNANCE AND TRAINING
An AI Acceptable-Use Policy for Law Firms That Survives a Privilege Question
Most law-firm AI rules collapse the moment a paralegal pastes a deposition into a chatbot. Here is a policy that names matters, privilege, and reviewers.
3 governance rules before broad workflow automation
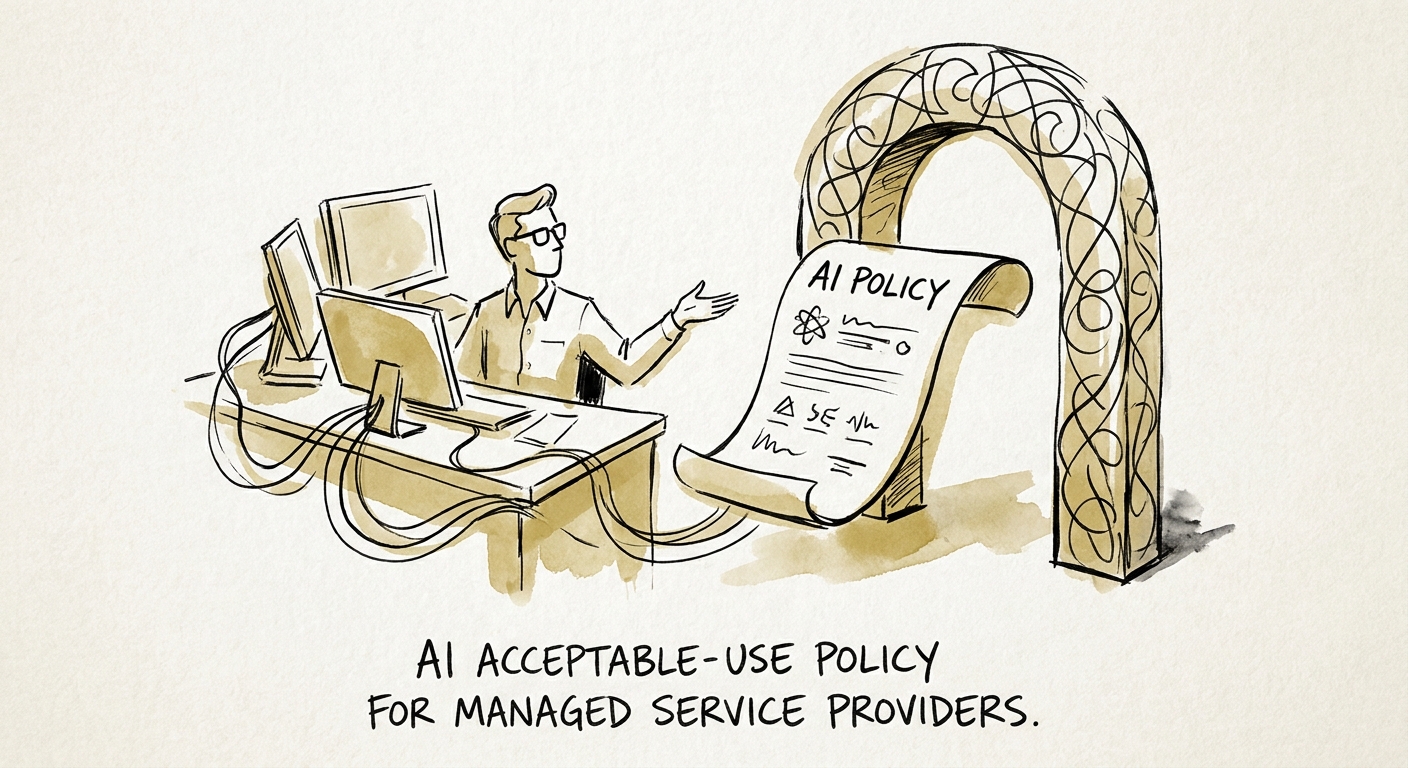
BRIEF · AI GOVERNANCE AND TRAINING
An AI Acceptable-Use Policy for MSPs: The Data You Hold Belongs to Someone Else
MSPs hold credentials and network maps for dozens of clients. Here's how to write AI usage rules that protect data you don't own — and ship in 90 days.
3 governance rules before broad workflow automation