BRIEF · AI VENDOR AND BUILD-VS-BUY
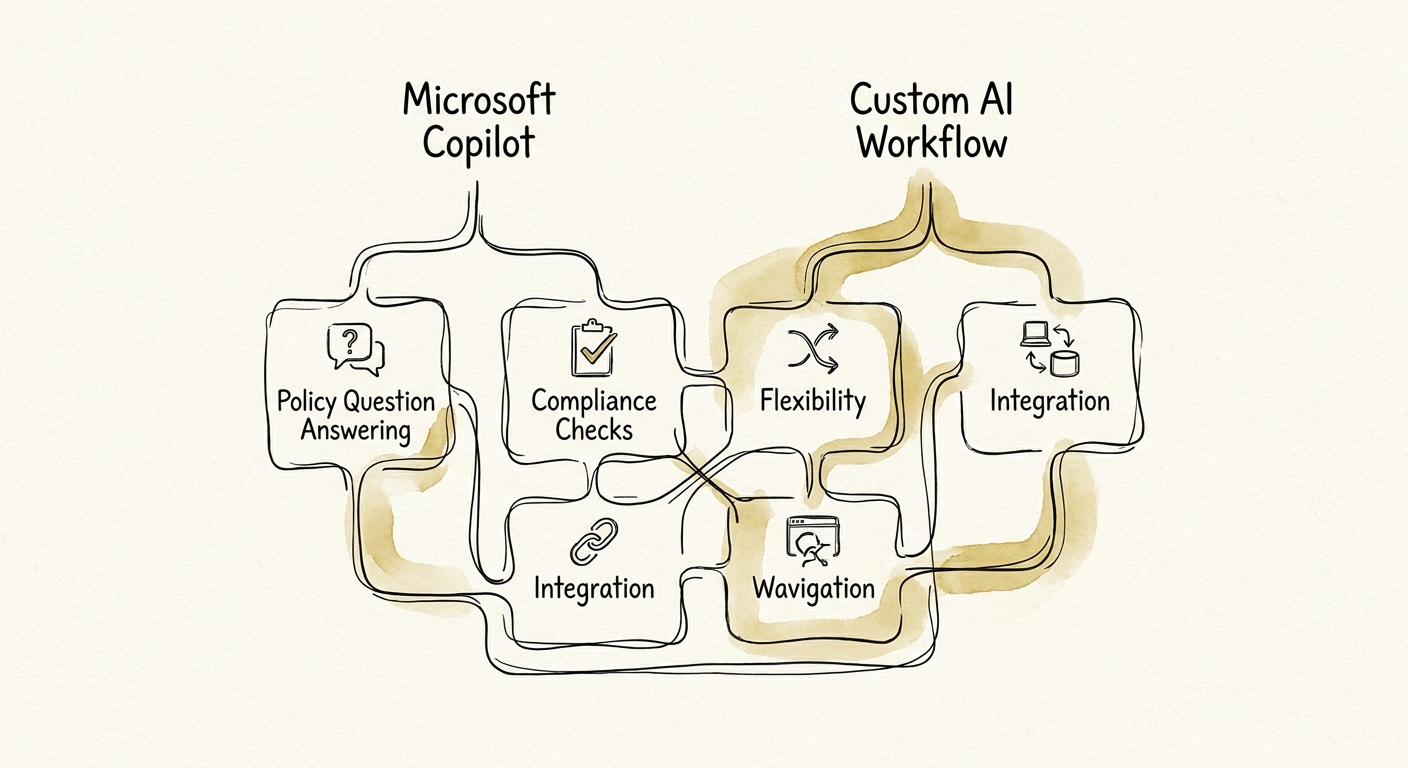
Microsoft 365 Copilot vs. a Custom Workflow for Answering Policy Questions
Why Microsoft 365 Copilot is great for HR research but risky as a self-serve policy answer engine — and when a 50-300 person company should build custom.
1 governed policy question answering workflow before broad AI rollout
BRIEF · AI VENDOR AND BUILD-VS-BUY
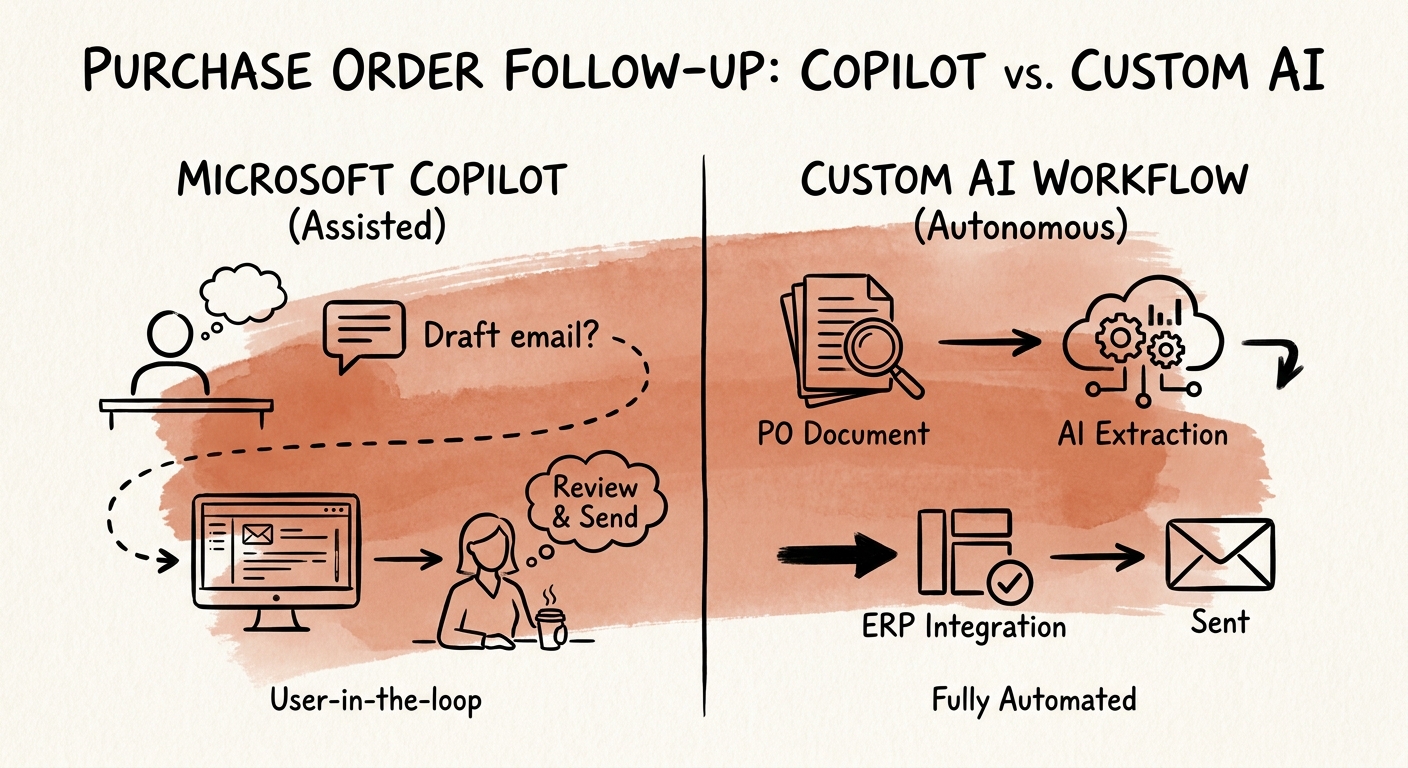
PO Follow-Up: When Copilot Is Enough and When You Need a Custom AI Workflow
A buyer chasing 60 open POs has two AI options. One drafts better supplier emails. The other watches the aging queue. Here is how to tell them apart.
1 governed purchase order follow-up workflow before broad AI rollout
BRIEF · AI VENDOR AND BUILD-VS-BUY
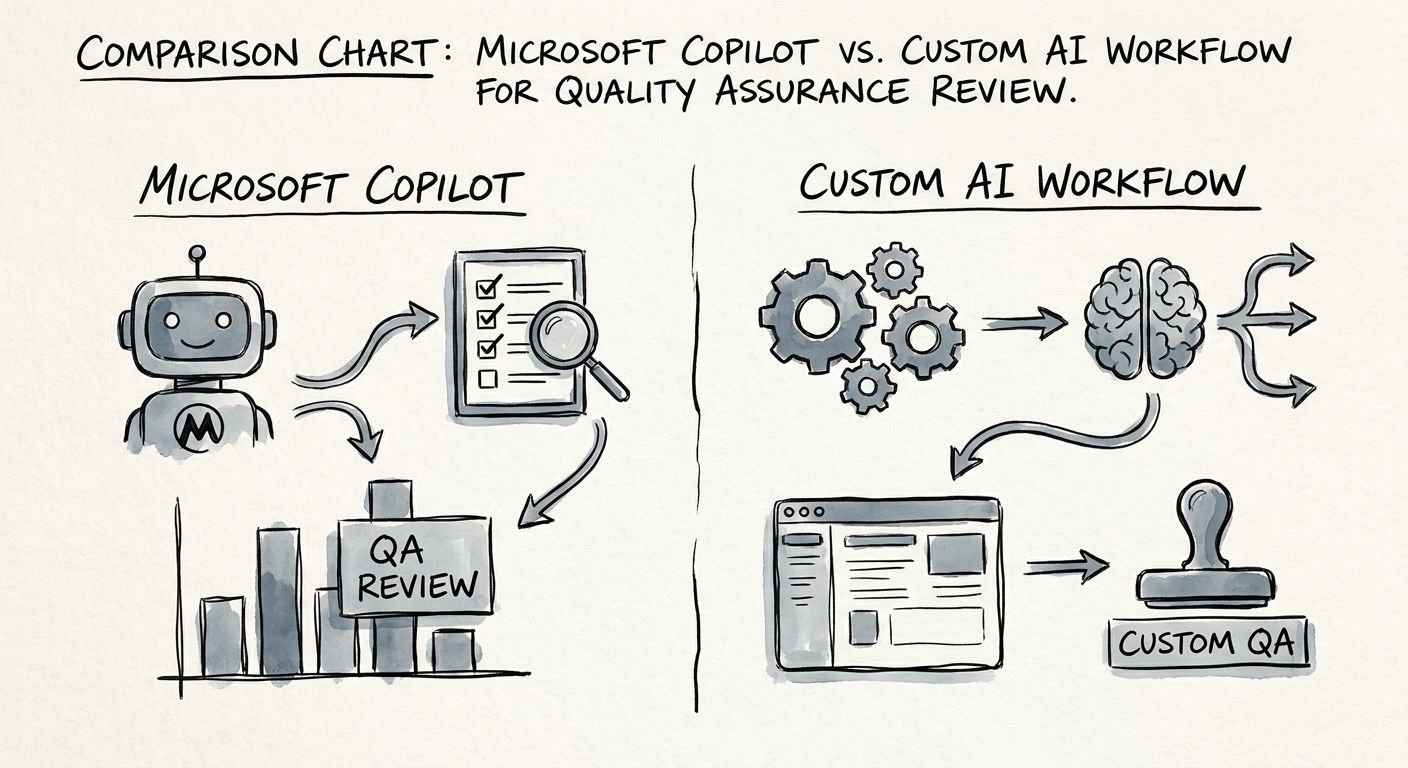
QA Scoring at Scale: Microsoft 365 Copilot vs a Custom AI Workflow
Two QA reviewers can score the same call seven points apart. Here's how 50-300 employee teams decide whether Copilot or a custom AI workflow fixes it.
1 governed quality assurance review workflow before broad AI rollout
BRIEF · AI VENDOR AND BUILD-VS-BUY
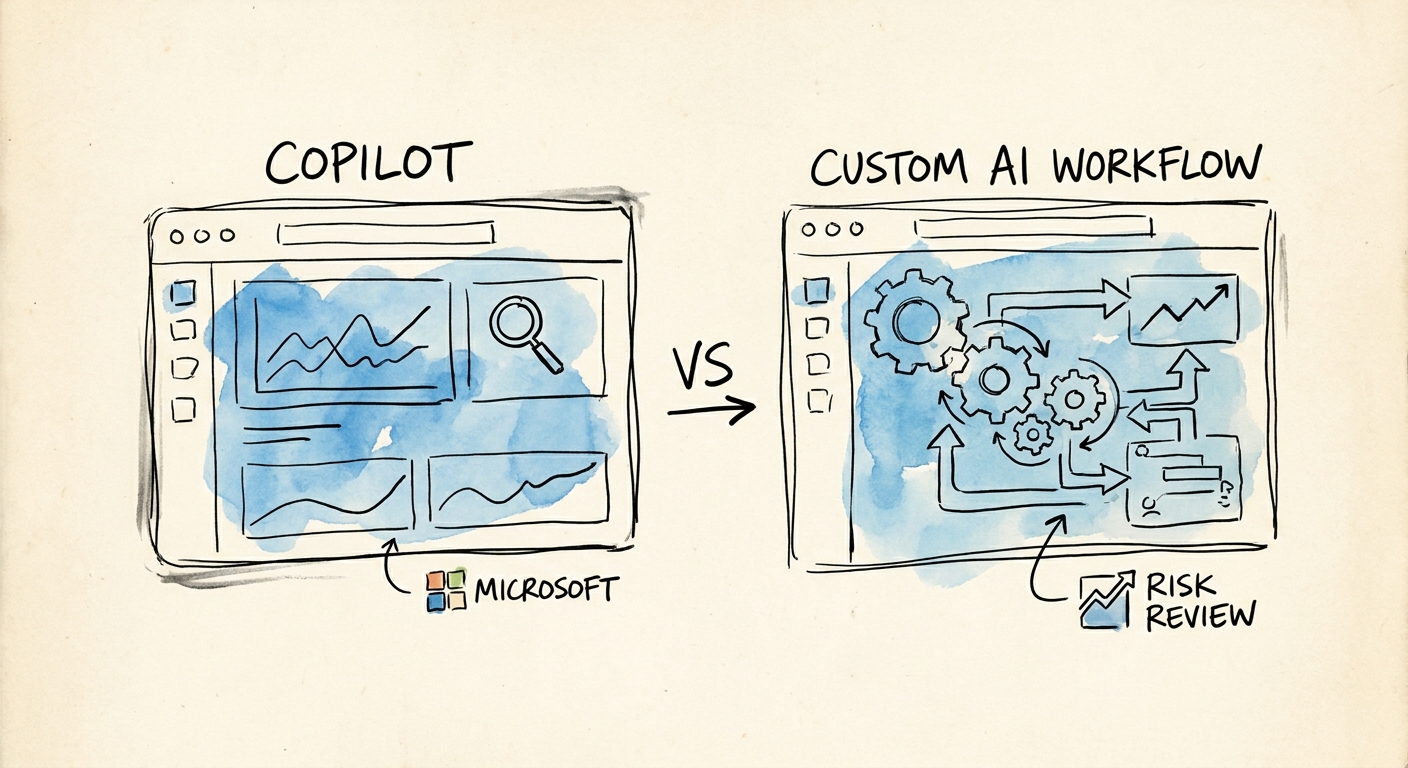
Renewal Risk Review: Should Copilot Flag Churn, or Should a Custom Workflow?
By the time a renewal lands in the forecast, the save window is closing. Where churn-signal detection belongs: Microsoft 365 Copilot or a custom AI workflow.
1 governed renewal risk review workflow before broad AI rollout
BRIEF · AI VENDOR AND BUILD-VS-BUY
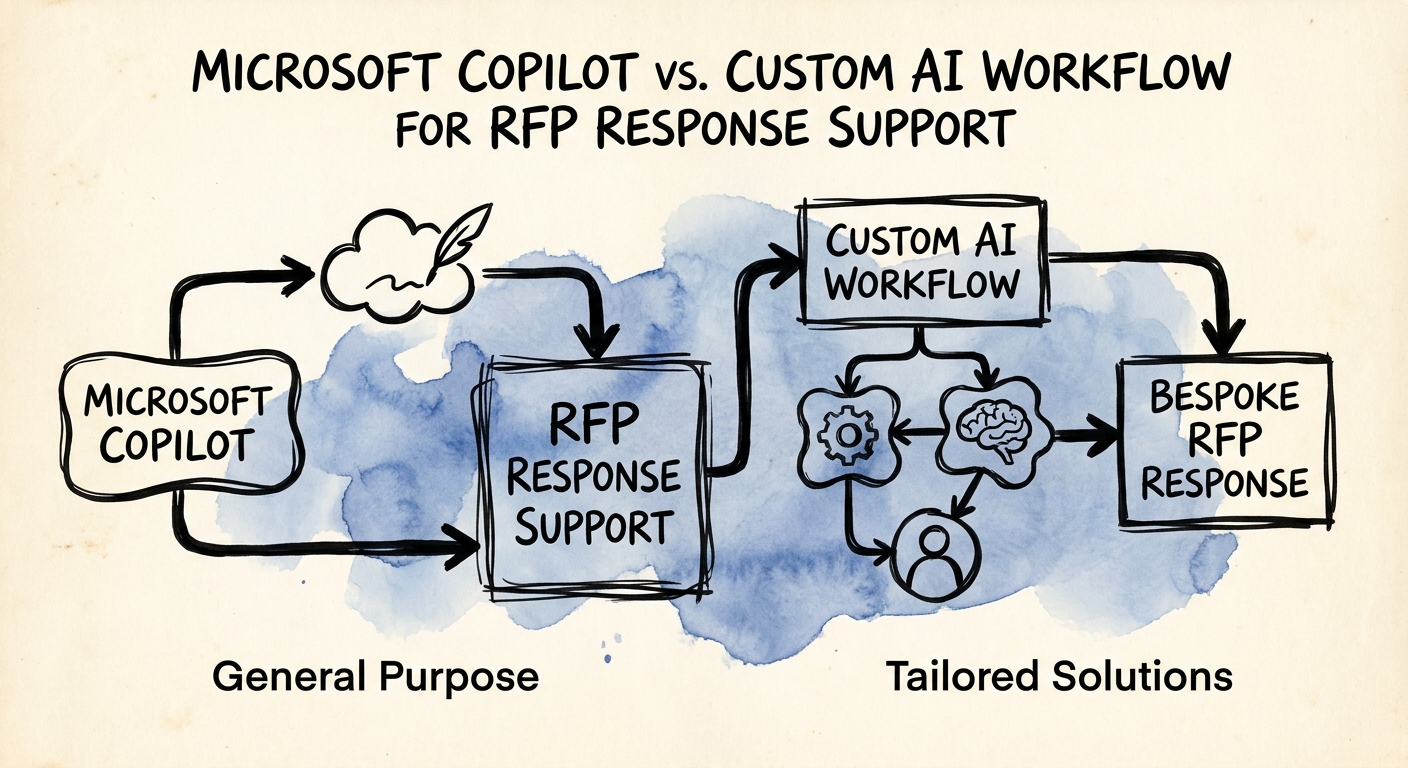
Microsoft Copilot vs Custom AI for RFP Response: Where Copilot Helps and Where It Commits You to Things You Can't Deliver
A 200-question RFP is due Friday. Here's where Microsoft 365 Copilot saves your proposal team hours, and where it quietly commits you to a SLA legal never signed off on.
1 governed RFP response support workflow before broad AI rollout
BRIEF · AI VENDOR AND BUILD-VS-BUY
SOP Documentation: When Copilot Is Enough and When You Need a Custom AI Workflow
A 50-300 person company has the same SOP saved four ways. Here's how to decide what Copilot drafts and what a governed AI workflow has to own.
1 governed SOP documentation workflow before broad AI rollout
BRIEF · AI VENDOR AND BUILD-VS-BUY
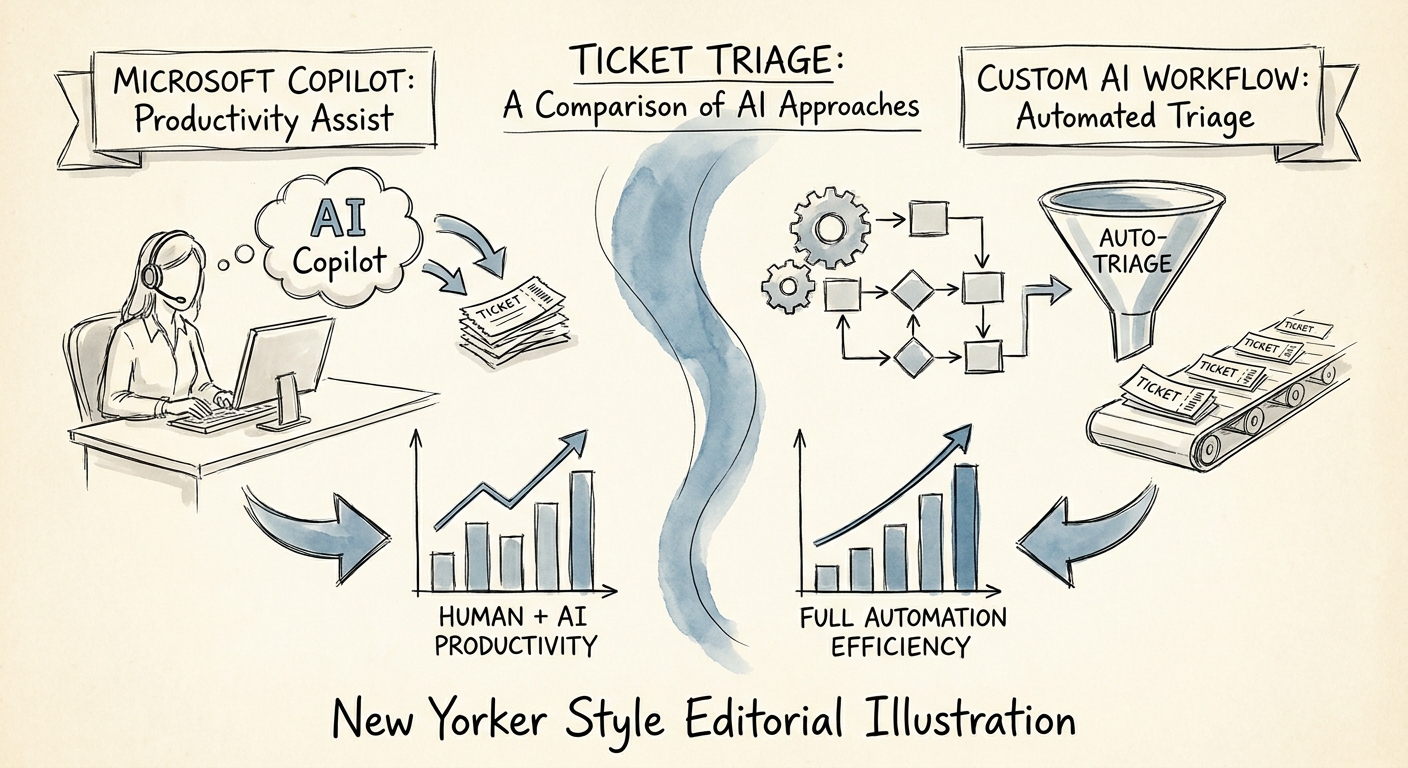
Ticket Triage: Where Copilot Stops and Custom AI Has to Start
Copilot drafts replies. It can't watch an SLA clock or route by customer tier. Here's the exact line where a 50-300 person support team needs custom AI.
1 governed ticket triage workflow before broad AI rollout
BRIEF · AI VENDOR AND BUILD-VS-BUY
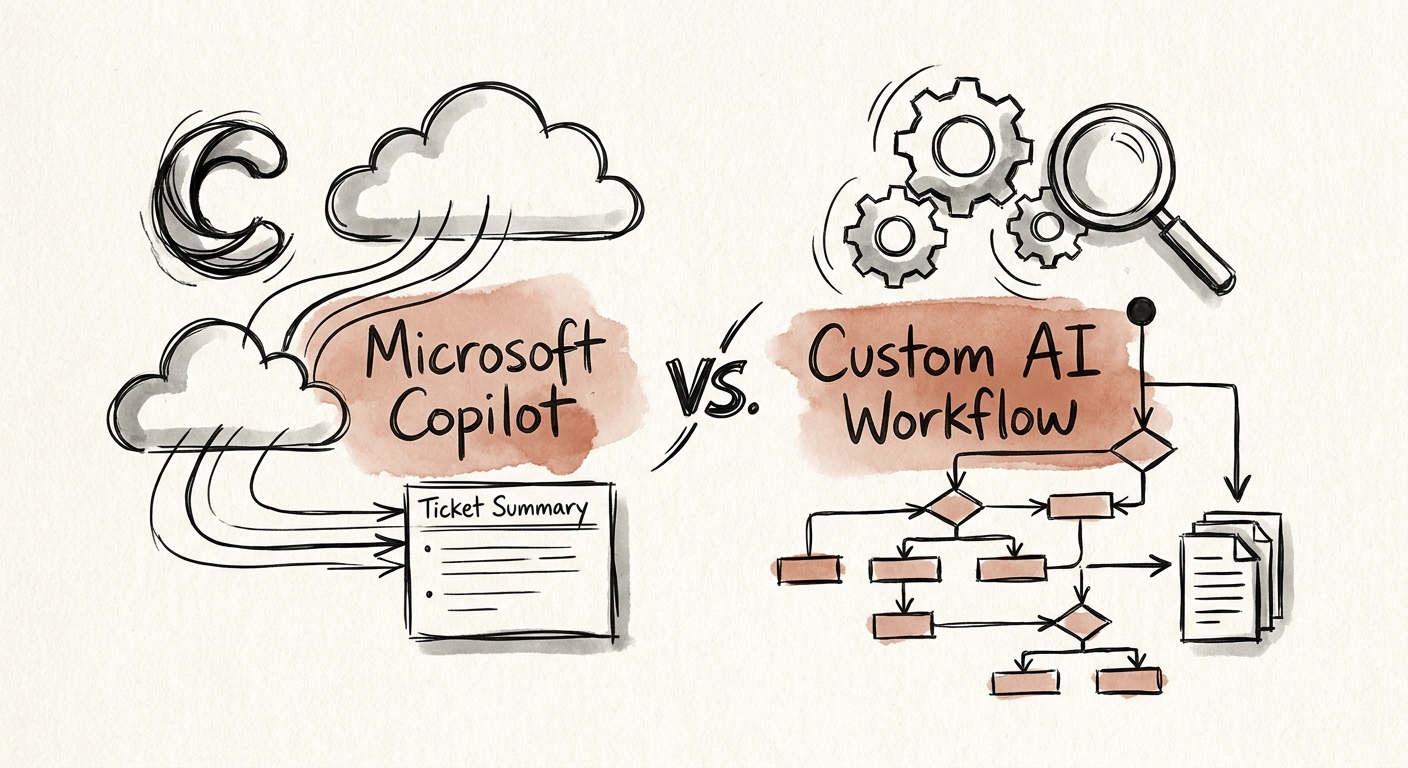
Vendor Ticket Summaries: When Copilot Is Enough and When You Need a Custom AI Workflow
Your ERP vendor went quiet for 11 days and nobody noticed. Here's how 50-300 person companies decide whether Copilot or a custom AI workflow owns vendor tickets.
1 governed vendor ticket summaries workflow before broad AI rollout
BRIEF · AI VENDOR AND BUILD-VS-BUY
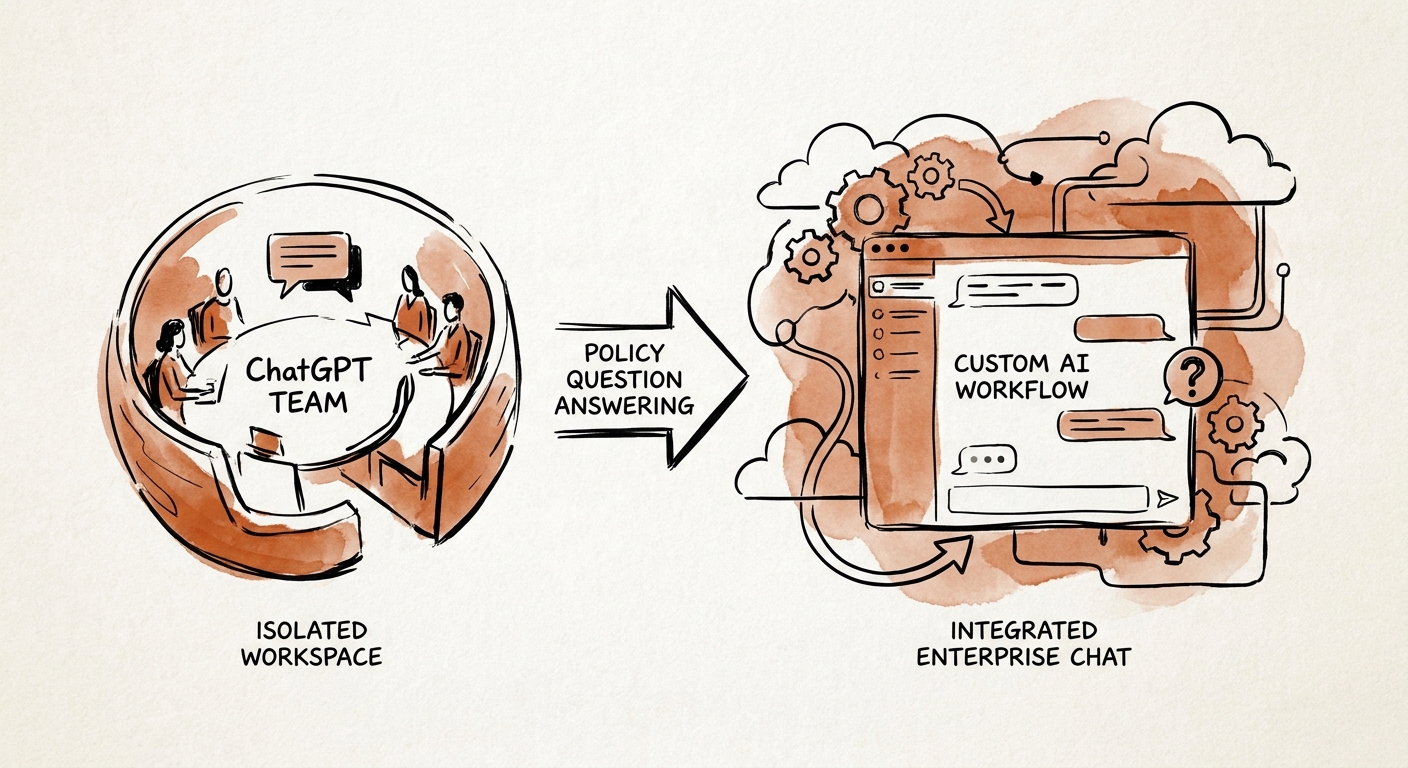
Policy Q&A With AI: When ChatGPT Business Is Enough, When It Isn't
When a 50-300 person company asks AI "can I expense this?" or "how much PTO do I have?" here's when ChatGPT Business answers safely and when you need to build.
Policy answers cite approved sources and route ambiguity
BRIEF · AI VENDOR AND BUILD-VS-BUY
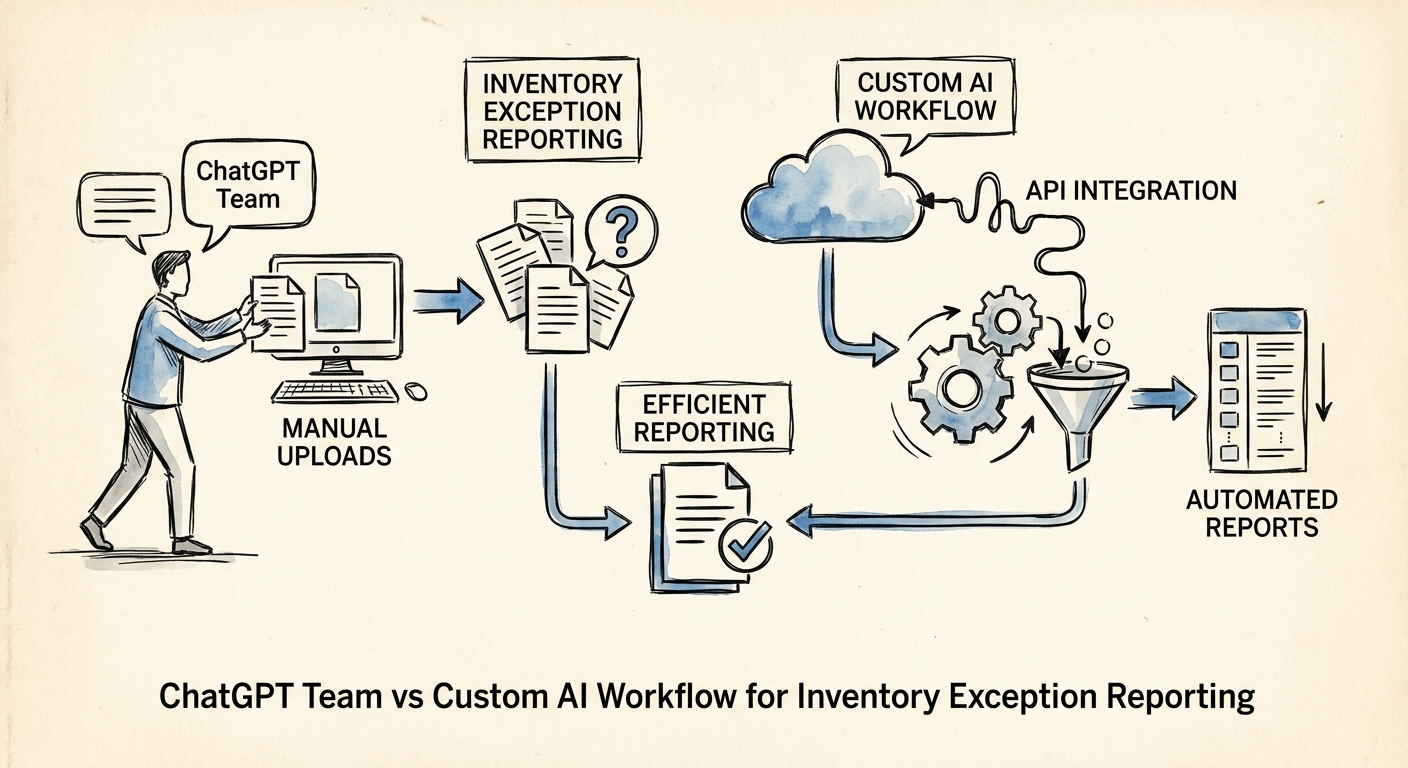
Inventory Exception Reporting: When ChatGPT Business Stops and a Custom Workflow Starts
A 50-300 person company has 140 open inventory exceptions on Monday. Here's how to decide which ones ChatGPT Business can touch and which need a real workflow.
Stock exceptions tied to demand, PO, and working-capital impact
BRIEF · AI VENDOR AND BUILD-VS-BUY
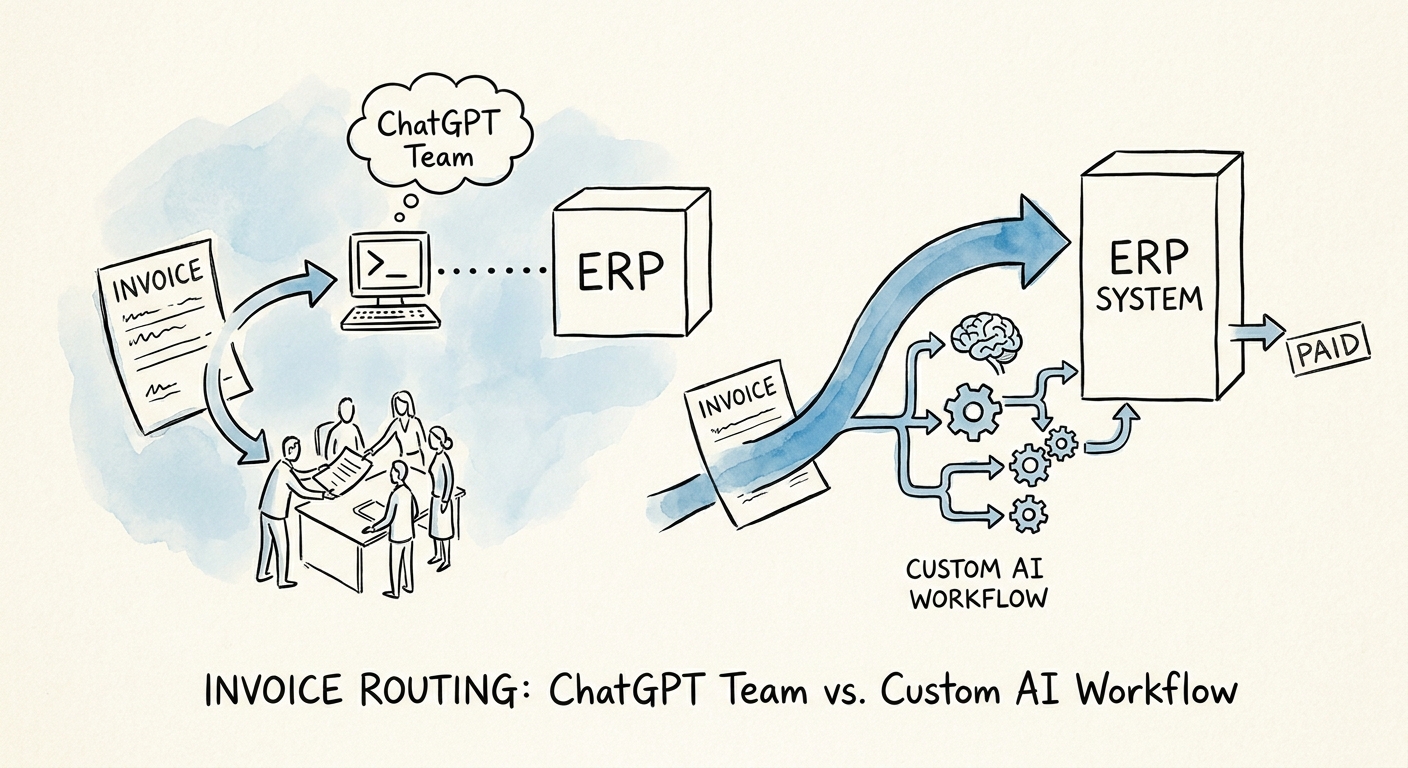
Invoice Routing in ChatGPT Business vs a Custom AP Workflow: Where the Line Is
A duplicate payment to a spoofed vendor is a routing failure, not a typo. How a 50-300 person AP team decides what belongs in ChatGPT Business and what needs a real workflow.
AP invoice route tied to vendor, PO, approver, and GL code
BRIEF · AI VENDOR AND BUILD-VS-BUY
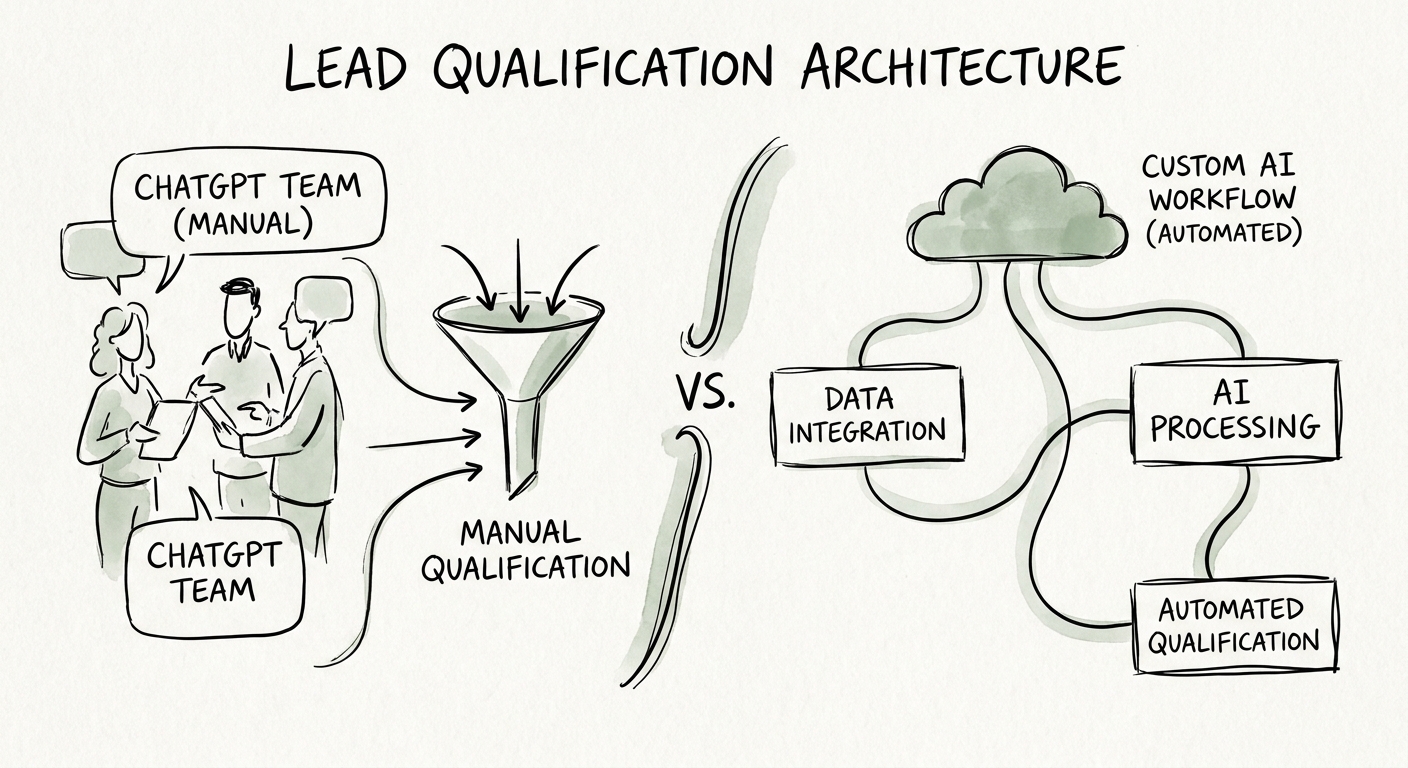
ChatGPT Business or a Custom Workflow for Lead Qualification: The Test Is Whether Sales Touches the Lead
For a 50-300 person company: when lead qualification belongs in ChatGPT Business and when it needs a custom workflow that sales actually trusts and acts on.
MQL qualification reasons tied to source and sales acceptance
BRIEF · AI VENDOR AND BUILD-VS-BUY
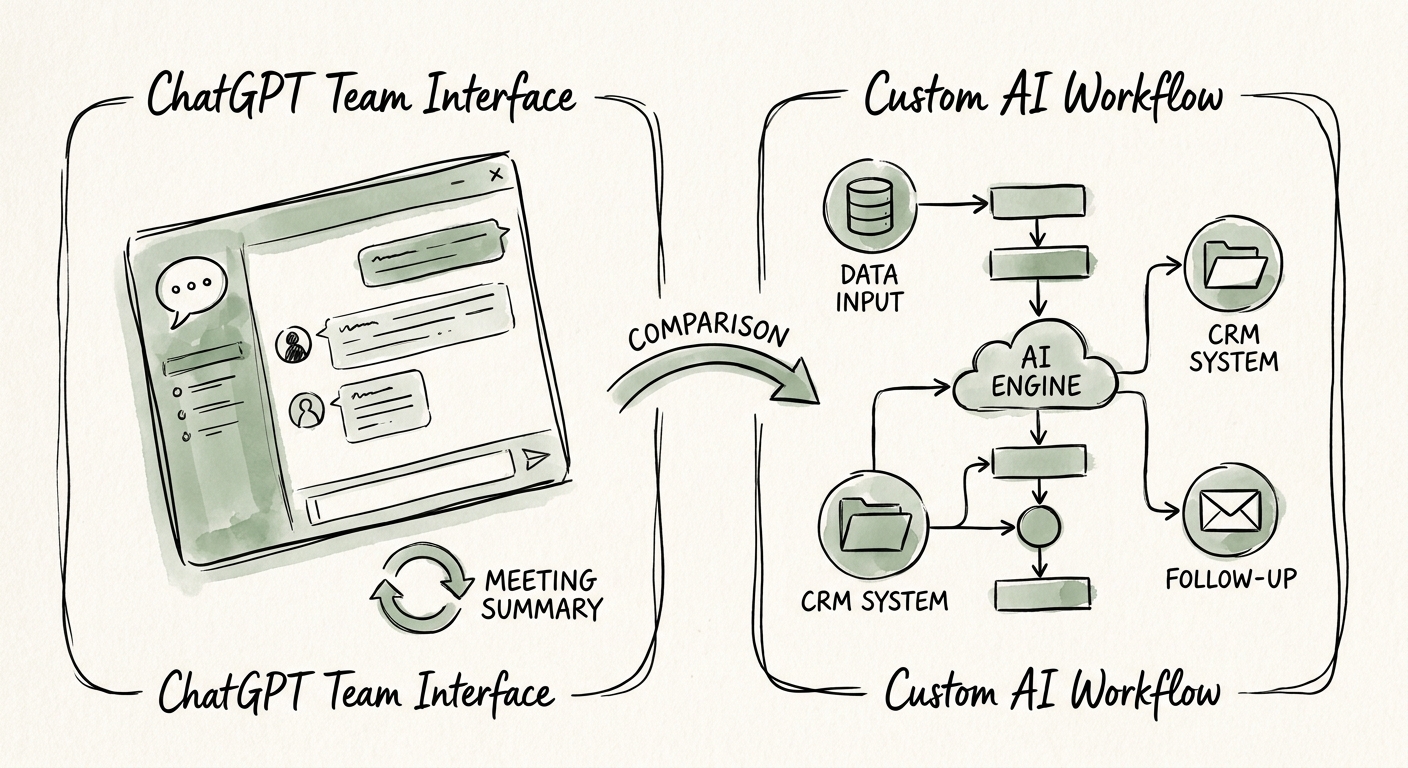
Meeting-Summary AI: When ChatGPT Business Is Enough and When You Need to Build
A 50-300 employee guide to deciding whether meeting summary follow-up stays in ChatGPT Business or needs a custom workflow that captures real commitments.
Action commitments captured with owner, consent, and next step
BRIEF · AI VENDOR AND BUILD-VS-BUY
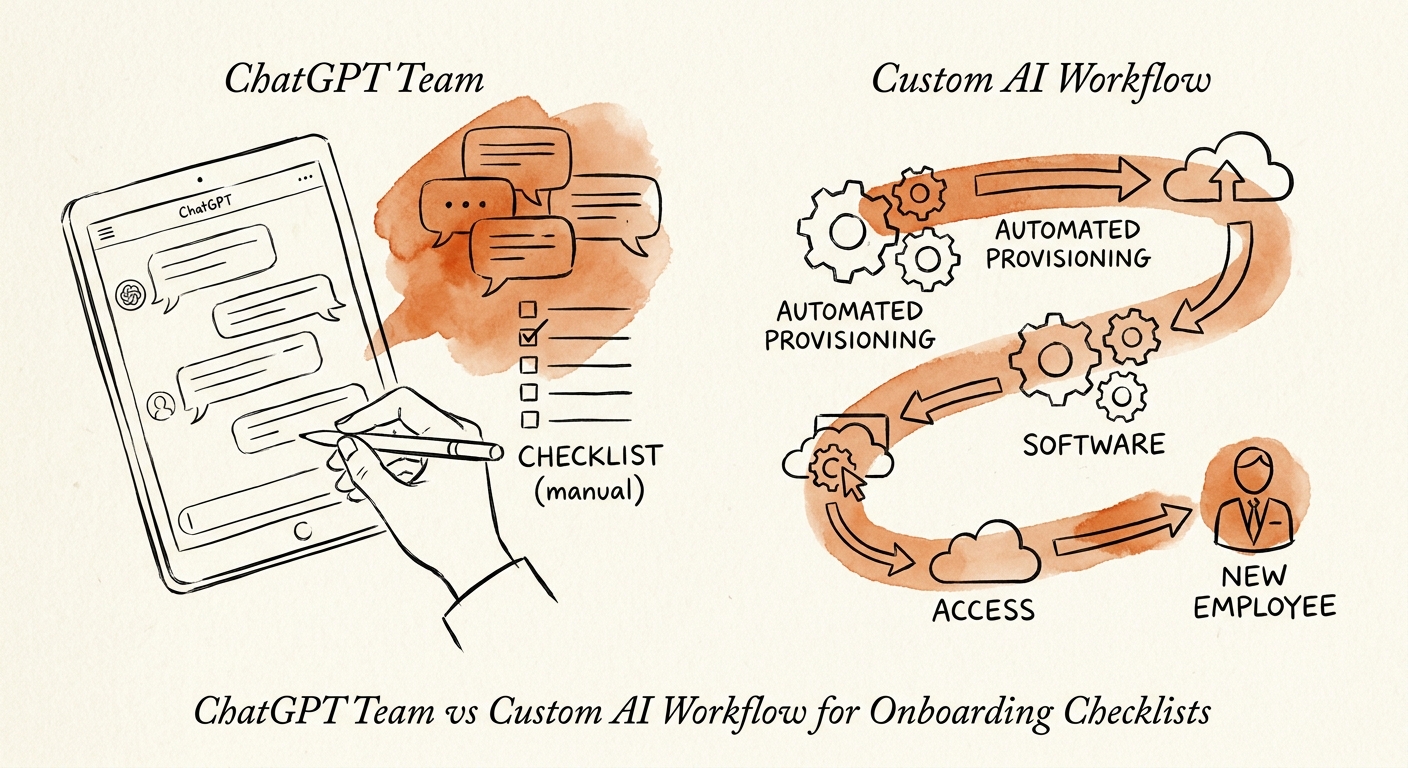
Onboarding Checklists: When ChatGPT Business Is Enough, and When You Need a Real Workflow
An onboarding checklist that no system reads is a to-do list. Here's how a 120-person company decides what stays in ChatGPT Business and what becomes a workflow.
Launch checklist gates tied to provisioning, training, and go-live
BRIEF · AI VENDOR AND BUILD-VS-BUY
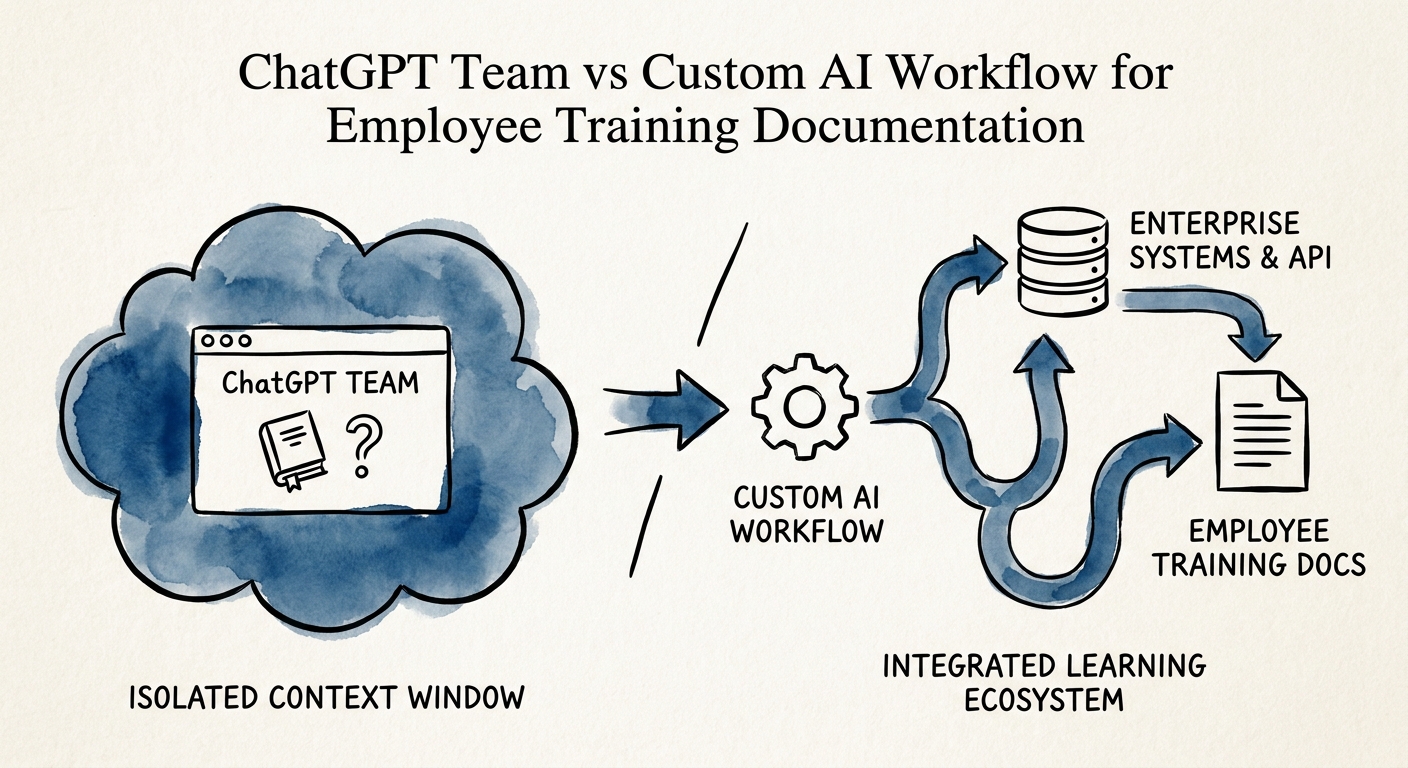
Your AI Wrote a Beautiful Training Module From a Dead SOP
A services team taught new hires from a procedure that changed two quarters ago — and AI made it look polished. Here's when to build instead of chat.
SOP approved versions tied to training and change logs
BRIEF · AI VENDOR AND BUILD-VS-BUY
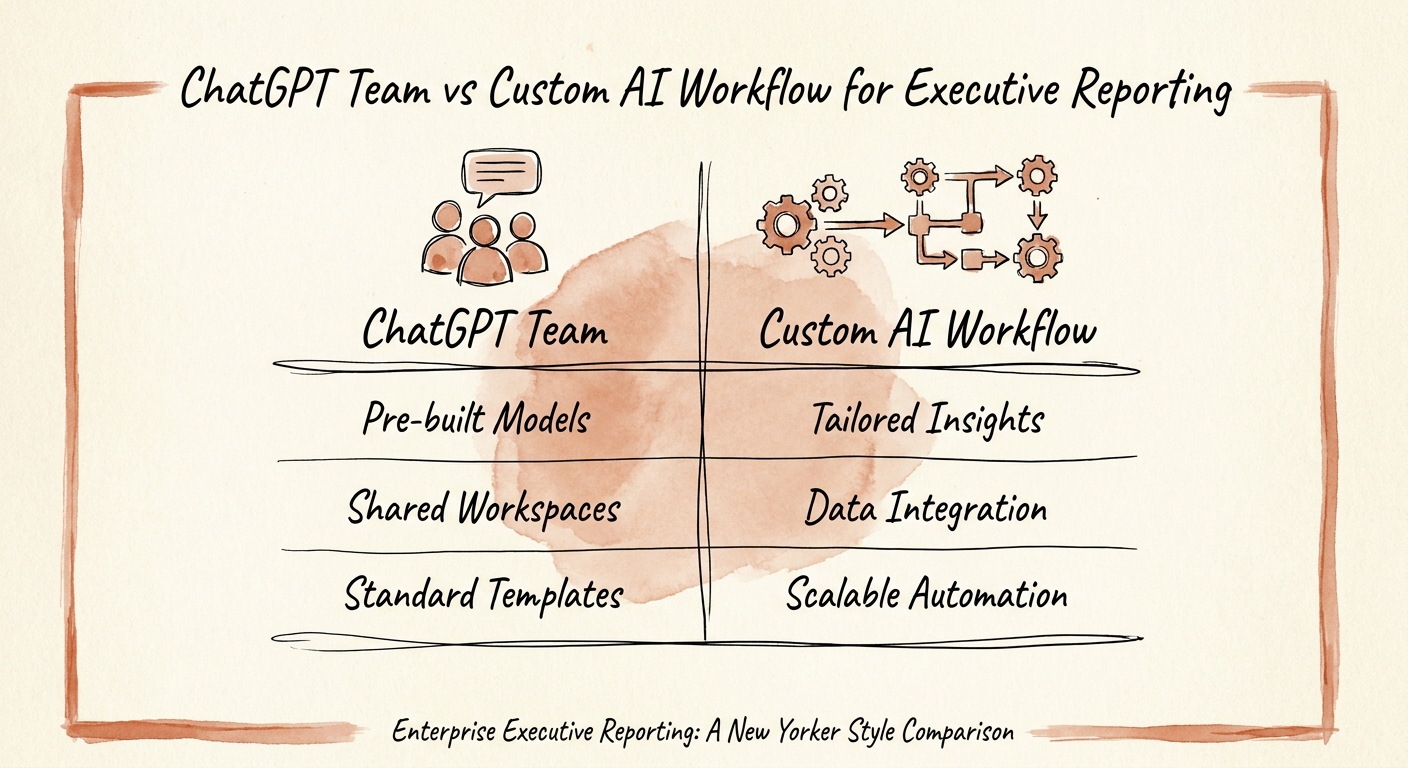
ChatGPT Business vs. a Custom AI Workflow for Board and Executive Reporting
A board packet AI can write a beautiful narrative on top of three different definitions of "ARR." Here's when ChatGPT Business is fine and when you need a governed workflow.
Board KPI lineage and narrative signoff before distribution
BRIEF · AI VENDOR AND BUILD-VS-BUY
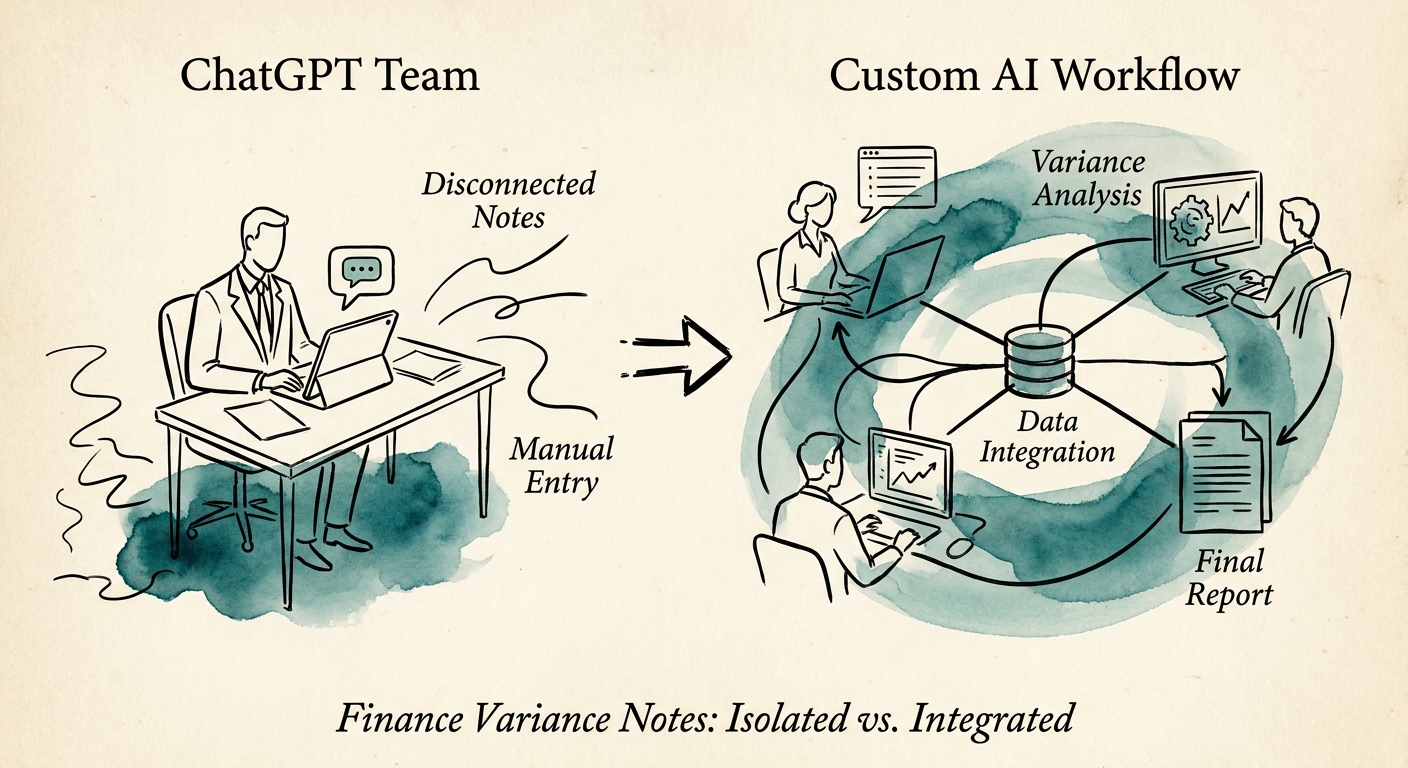
Variance Notes by Day 5: ChatGPT Business or a Built Finance Workflow?
Why a controller's variance commentary often breaks the AI build-vs-buy choice — and how a 50-300 person finance team decides between ChatGPT Business and a workflow.
Close variance commentary tied to ledger, budget, and owner review
BRIEF · AI VENDOR AND BUILD-VS-BUY
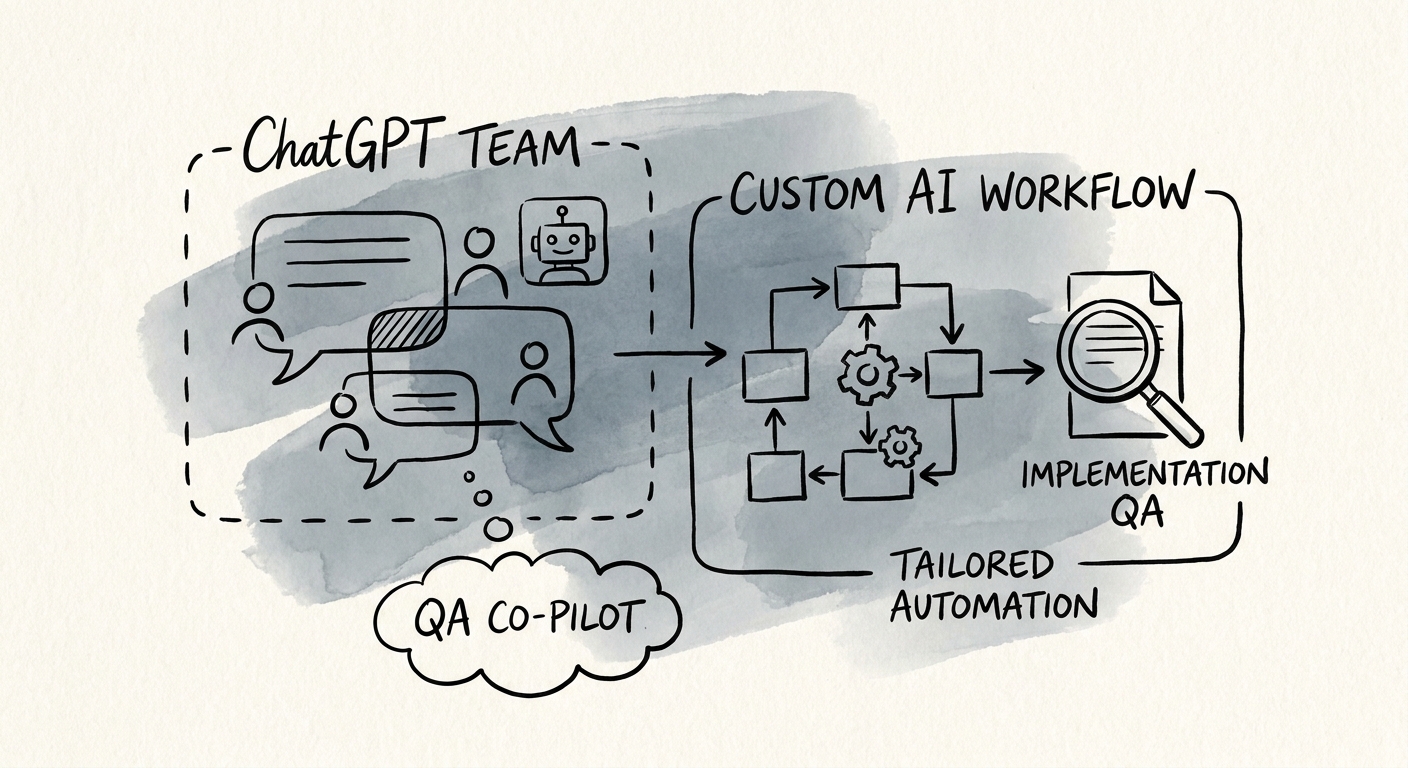
ChatGPT Business or a Custom Workflow for Implementation QA? Let Defect Leakage Decide
A go-live slipped because a "passed" test had no evidence behind it. Here's how to decide whether implementation QA belongs in ChatGPT Business or a built workflow.
QA defect evidence tied to acceptance and go-live gates
BRIEF · AI VENDOR AND BUILD-VS-BUY
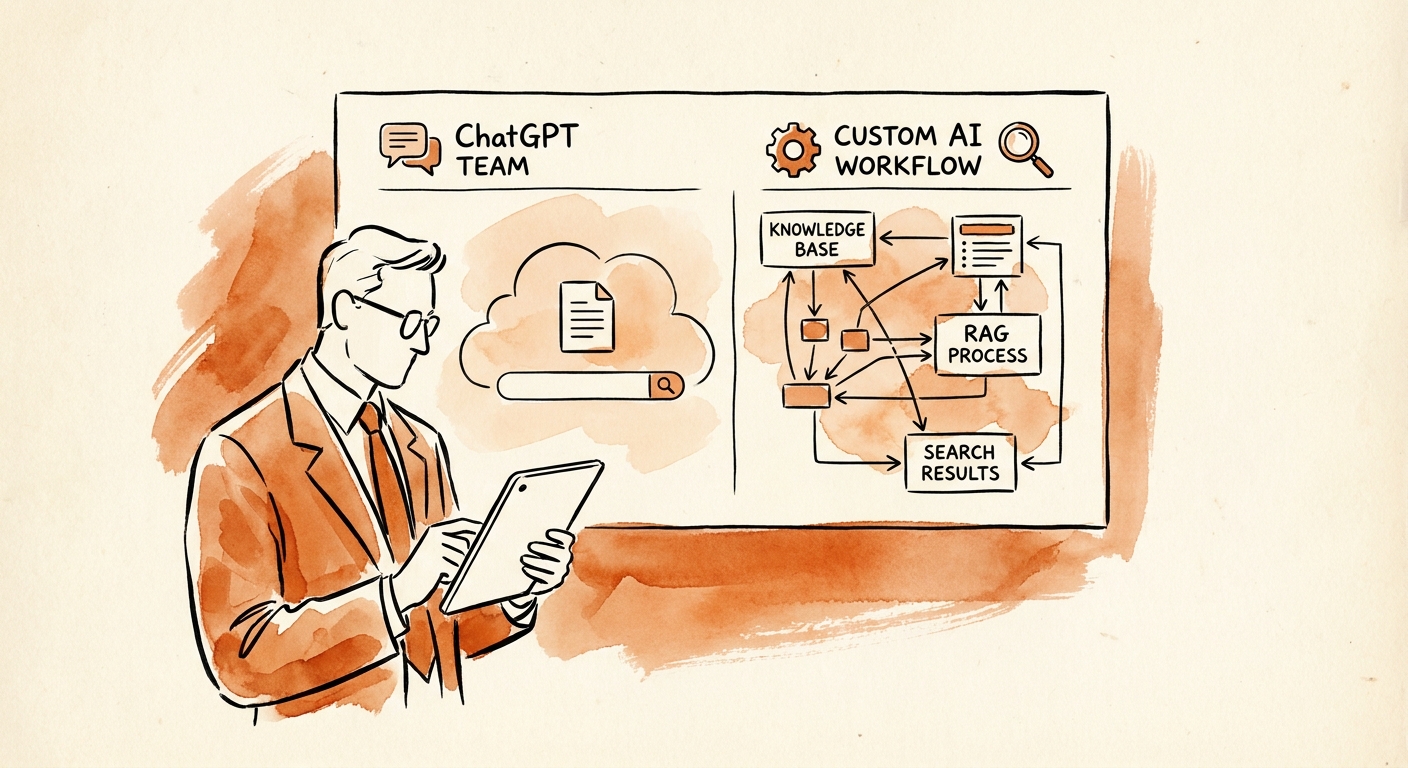
ChatGPT Business or a Custom Workflow for Internal Knowledge Search? Start With the Stale-Answer Problem
A 50-300 person company has the same SOP saved four times. Here's how to decide whether internal knowledge search belongs in ChatGPT Business or a custom workflow.
Source answers cite current approved documents by permission
BRIEF · AI VENDOR AND BUILD-VS-BUY
ChatGPT Business or a Custom Workflow for Customer Onboarding? Watch the Handoff, Not the Kickoff Deck
The deal closed, then went quiet for nine days. Here's how to decide whether onboarding belongs in ChatGPT Business or a governed custom workflow.
Value handoff tasks tied to first-value milestones
BRIEF · AI VENDOR AND BUILD-VS-BUY
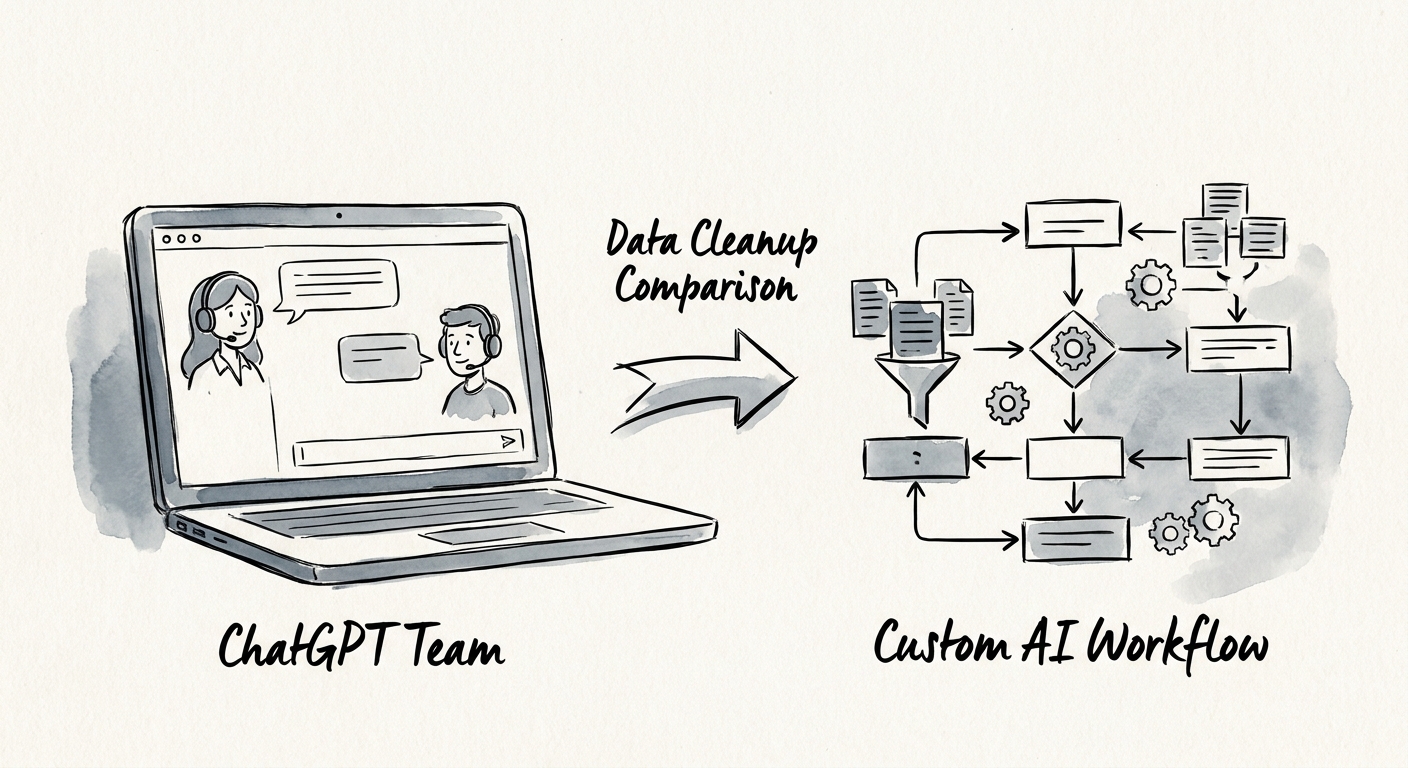
ChatGPT Business vs Custom AI Workflow for Data Cleanup
Data cleanup rewrites the records your business runs on. Here's how a 50-300 person company decides between ChatGPT Business and a governed workflow.
Data source conflicts resolved before automated writeback
BRIEF · AI VENDOR AND BUILD-VS-BUY
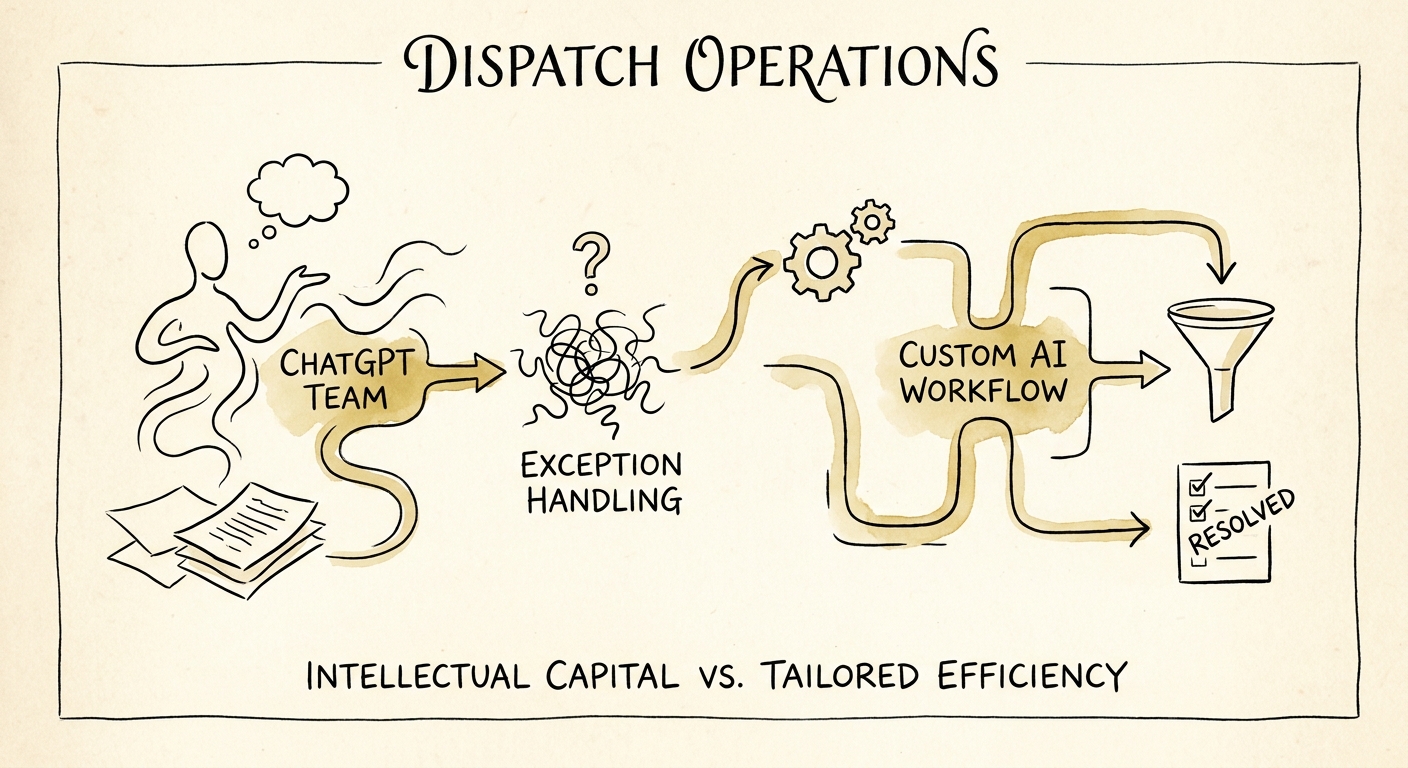
ChatGPT Business vs. a Custom Workflow for Dispatch Exceptions: Which One Actually Saves the SLA?
A technician no-shows at 9:40 for a 10 AM window. Here is how a 50-300 person service company should decide whether AI drafts the apology or actually re-routes the job.
Dispatch exception routing tied to SLA and capacity rules
BRIEF · AI VENDOR AND BUILD-VS-BUY
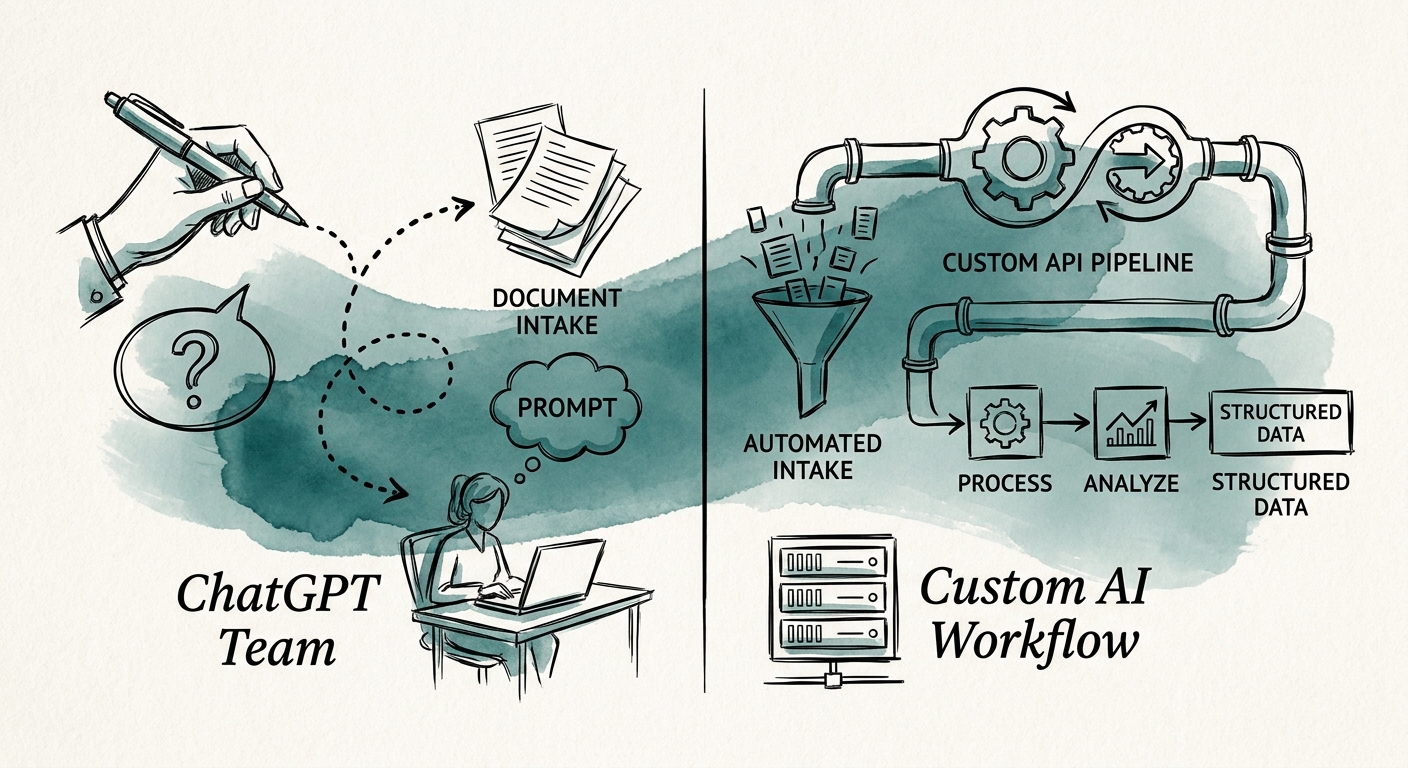
ChatGPT Business or a Custom Workflow for Document Intake? The Posting Line Decides
A 50-300 person company drowning in invoices and contracts: when document intake belongs in ChatGPT Business and when it needs a governed extraction workflow.
Intake field confidence routed before system posting
BRIEF · AI VENDOR AND BUILD-VS-BUY
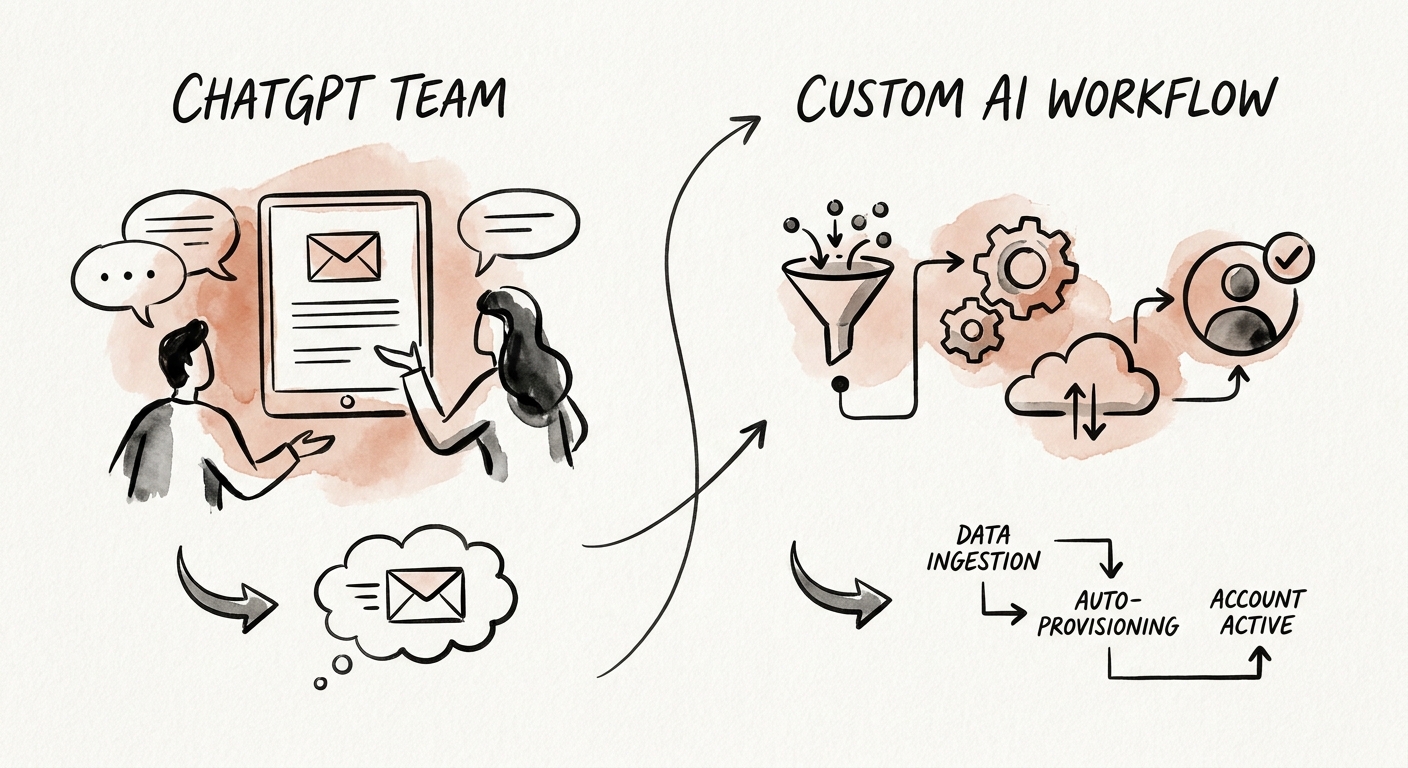
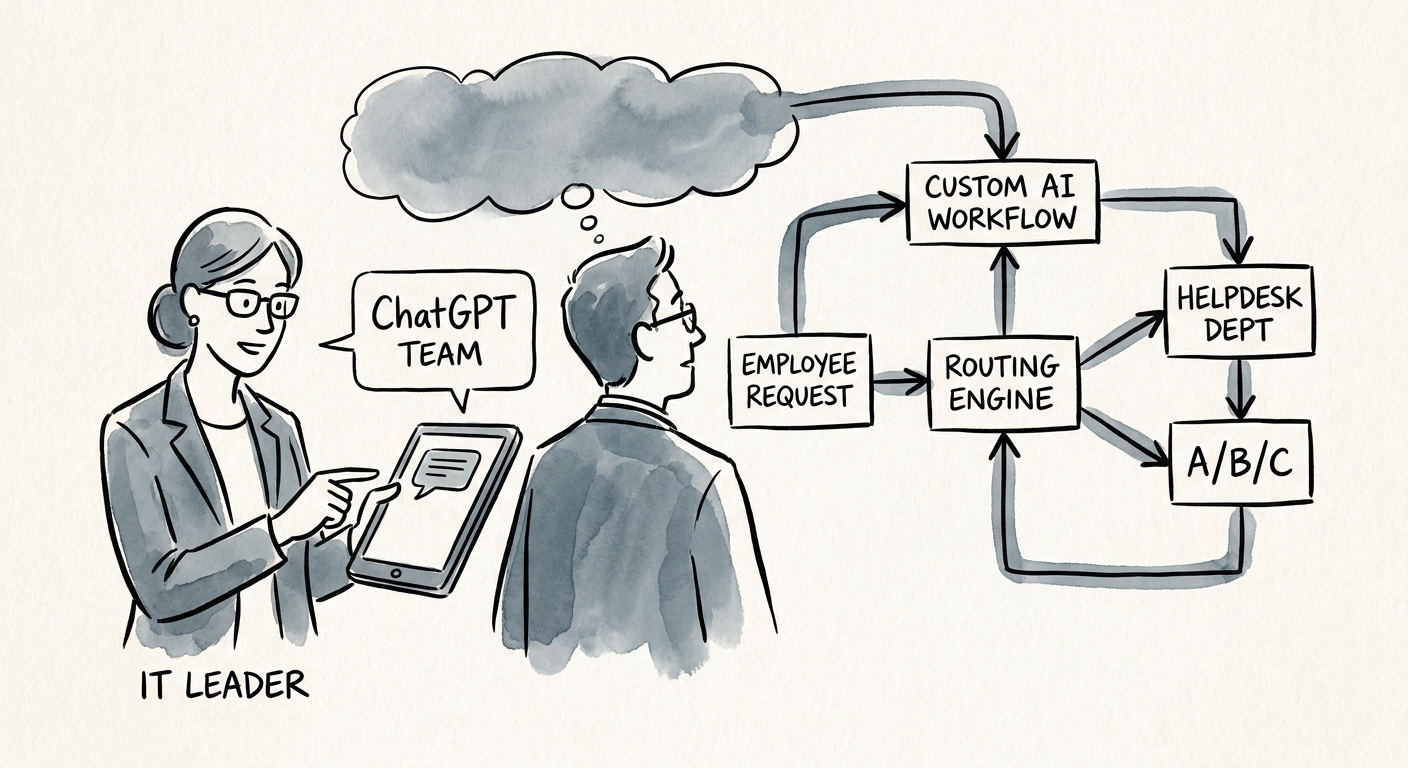
ChatGPT Business vs. a Custom Workflow for Internal Employee Helpdesk Routing
"Where do I report my new manager?" and "Reset my VPN" need different handling. How 50-300 person companies decide what employee helpdesk routing belongs in ChatGPT Business.
HR/IT sensitive requests routed by permission and policy