BRIEF · AI TRANSFORMATION STRATEGY
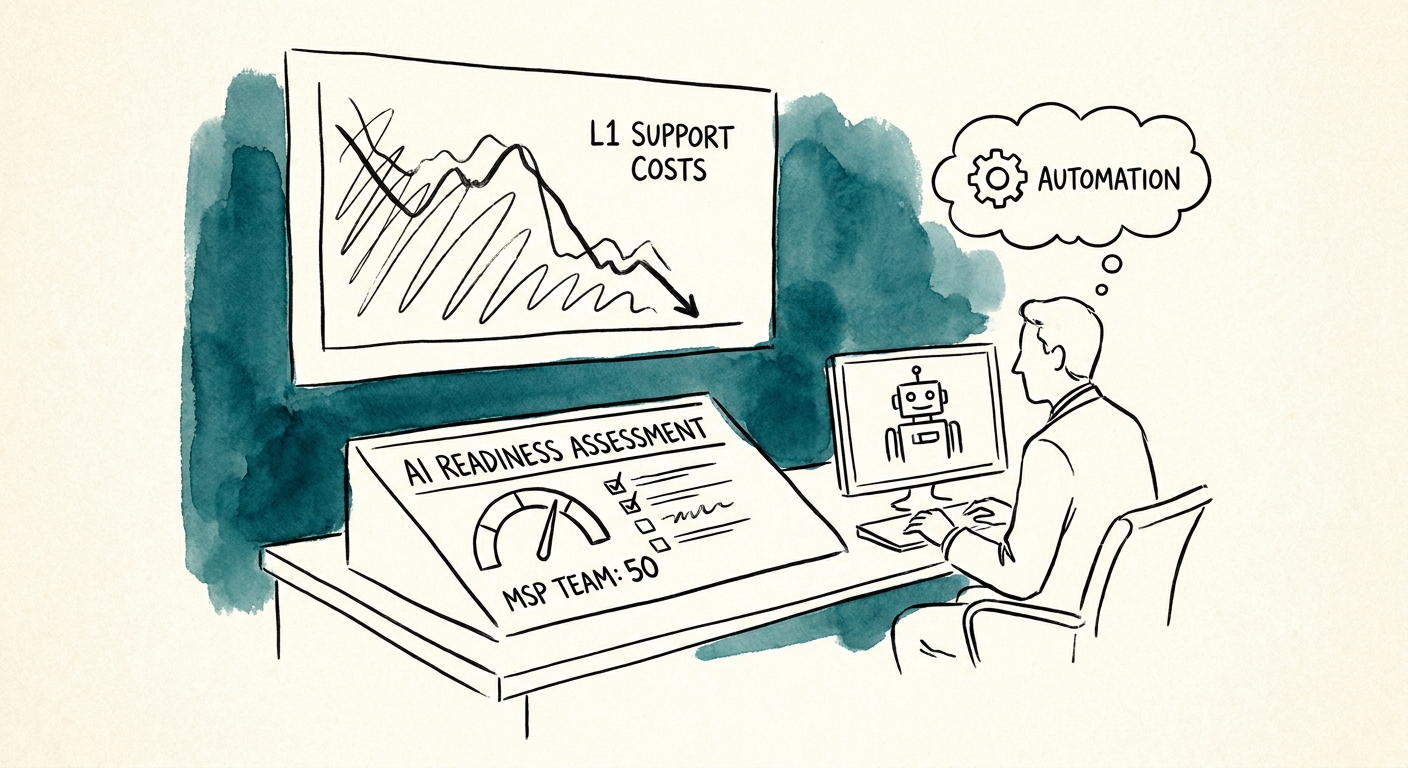
The AI Readiness Test for a 50-Person MSP: Read Your Ticket Queue, Not the Hype
A 50-tech MSP doesn't fail at AI on model quality. It fails on messy ticket categories and tribal escalation logic. Here's the readiness test that matters.
8 readiness checks before service-desk AI rollout
BRIEF · AI FUNCTION USE CASES
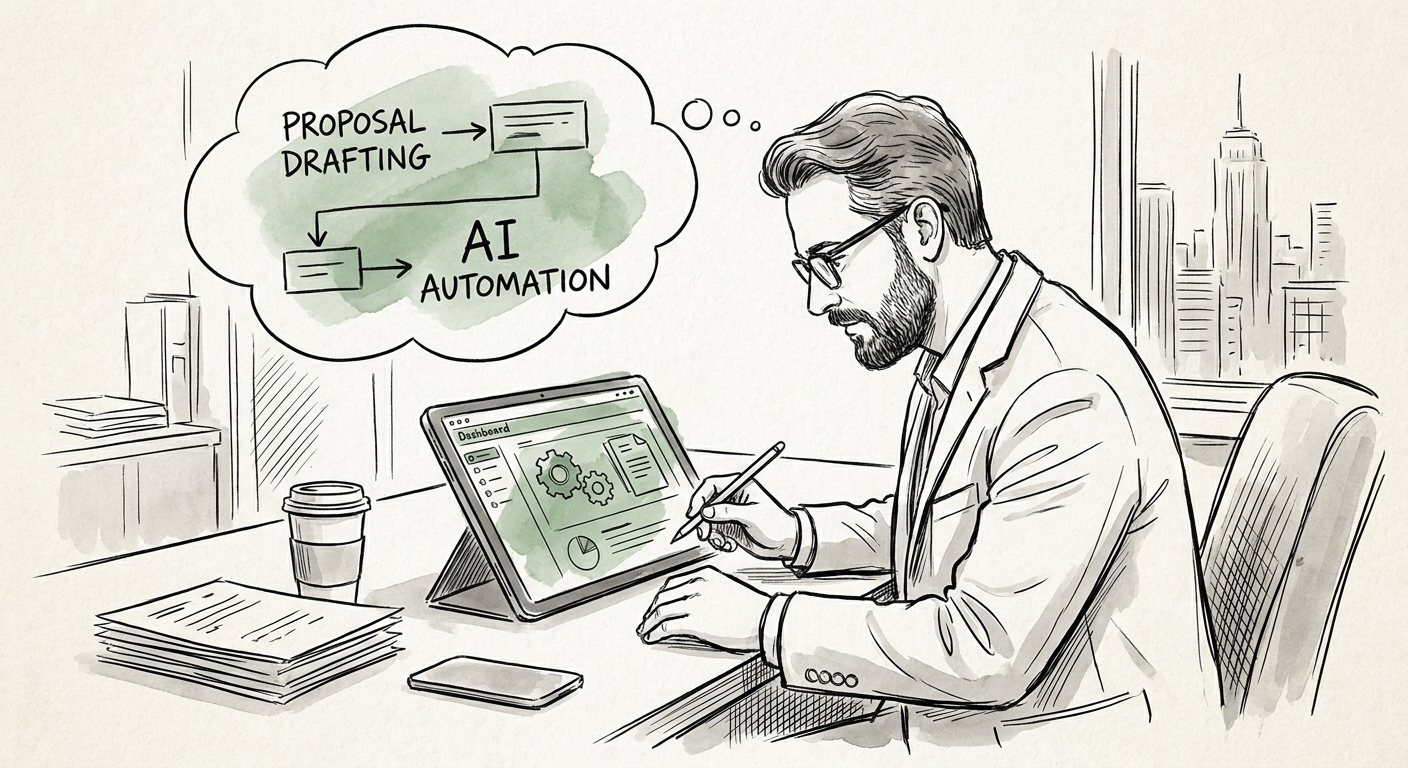
The First Thing Sales Should Hand to AI Is the Proposal Draft (Carefully)
A proposal is a sales pitch and a half-signed contract at once. Here is how B2B services and tech sales teams put AI on the first draft without breaking delivery.
4 review gates before proposal AI rollout
BRIEF · AI WORKFLOW AUTOMATION
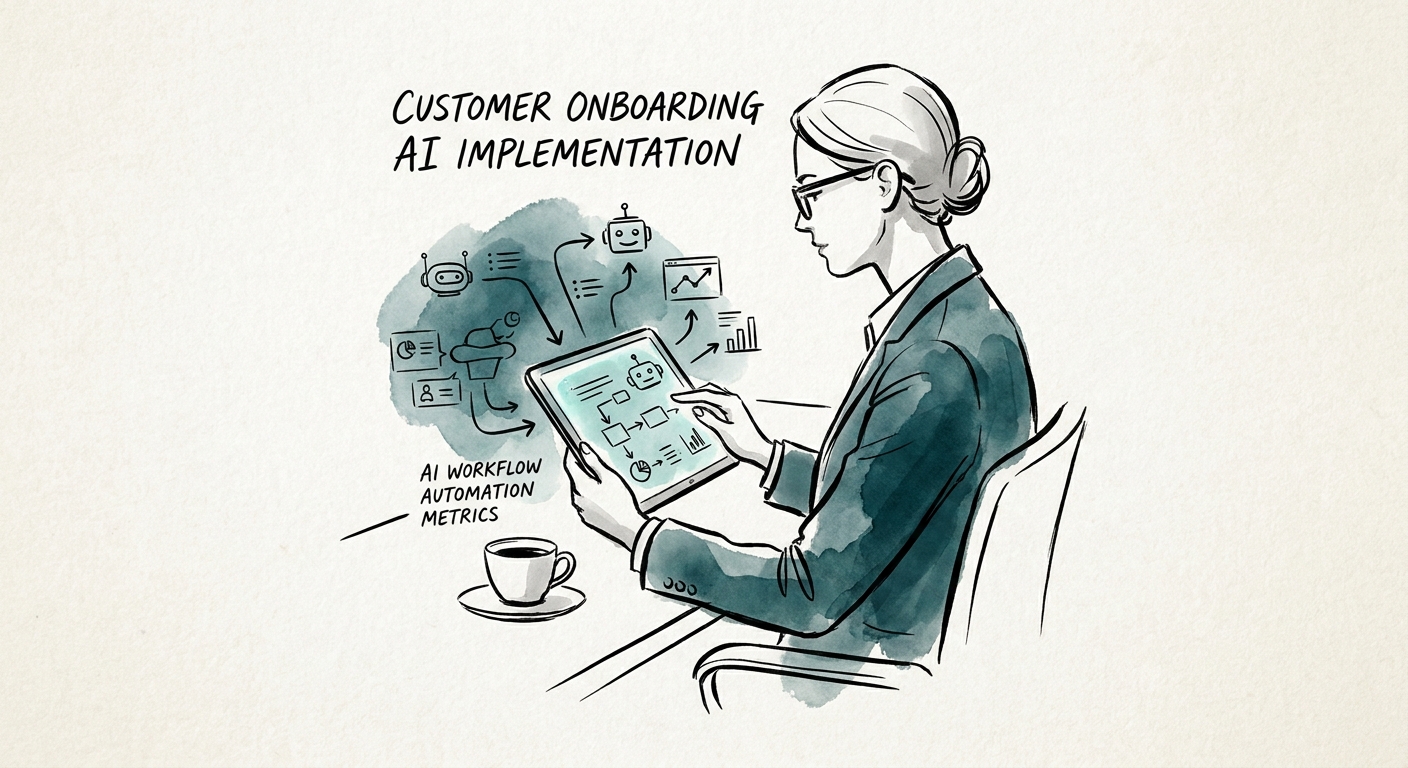
AI for Client Onboarding at Consulting Firms: Fix the Intake Gap, Not the Summary
Most consulting onboarding fails on missing intake, not slow drafting. How firms can use AI to close scope gaps, control client docs, and start delivery week one clean.
6 intake controls before onboarding AI launch
BRIEF · AI WORKFLOW AUTOMATION
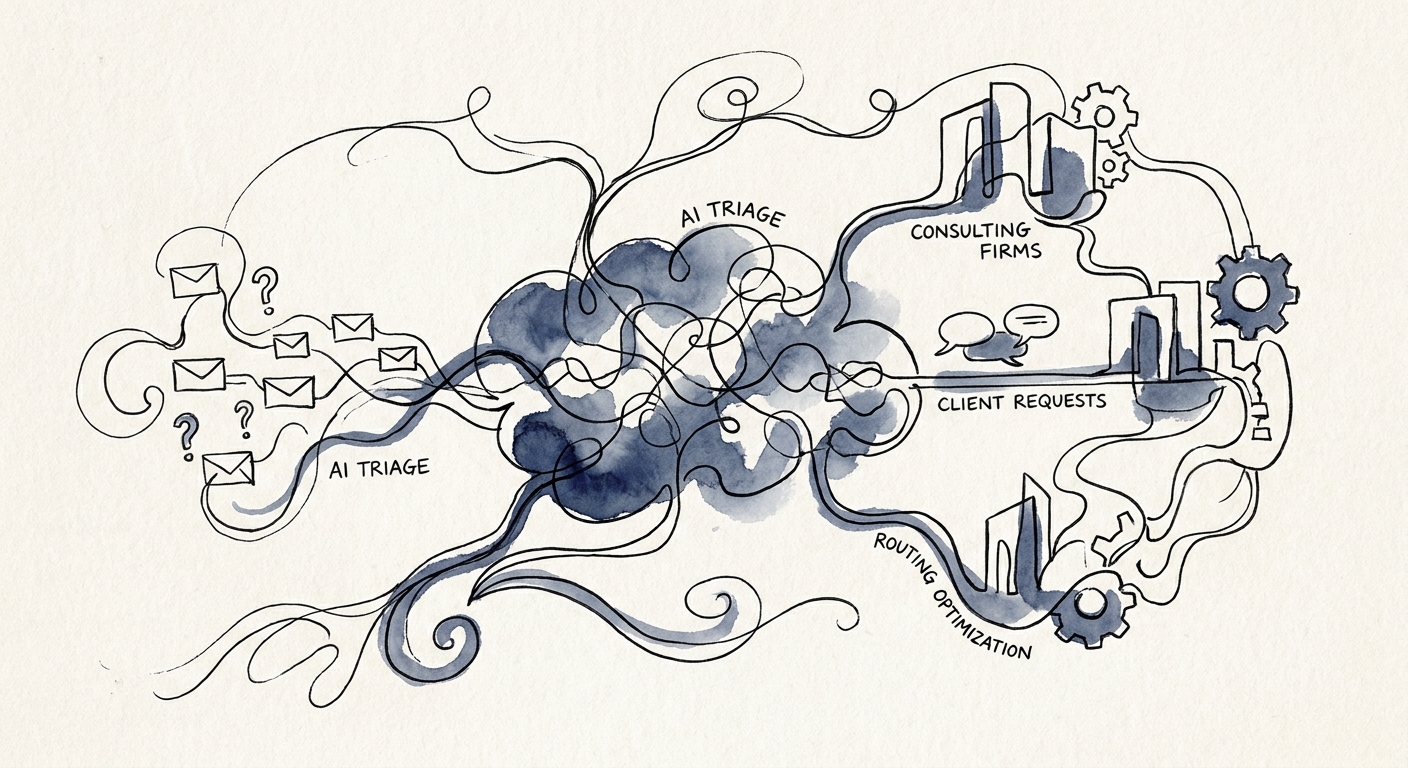
AI Ticket Triage for Consulting Firms: Route the Account, Not Just the Ticket
In a consulting firm, a ticket is rarely just a ticket. Here's how to wire AI triage that reads client tier and scope before it routes, without burning trust.
5 routing controls before ticket triage AI launch
BRIEF · AI WORKFLOW AUTOMATION
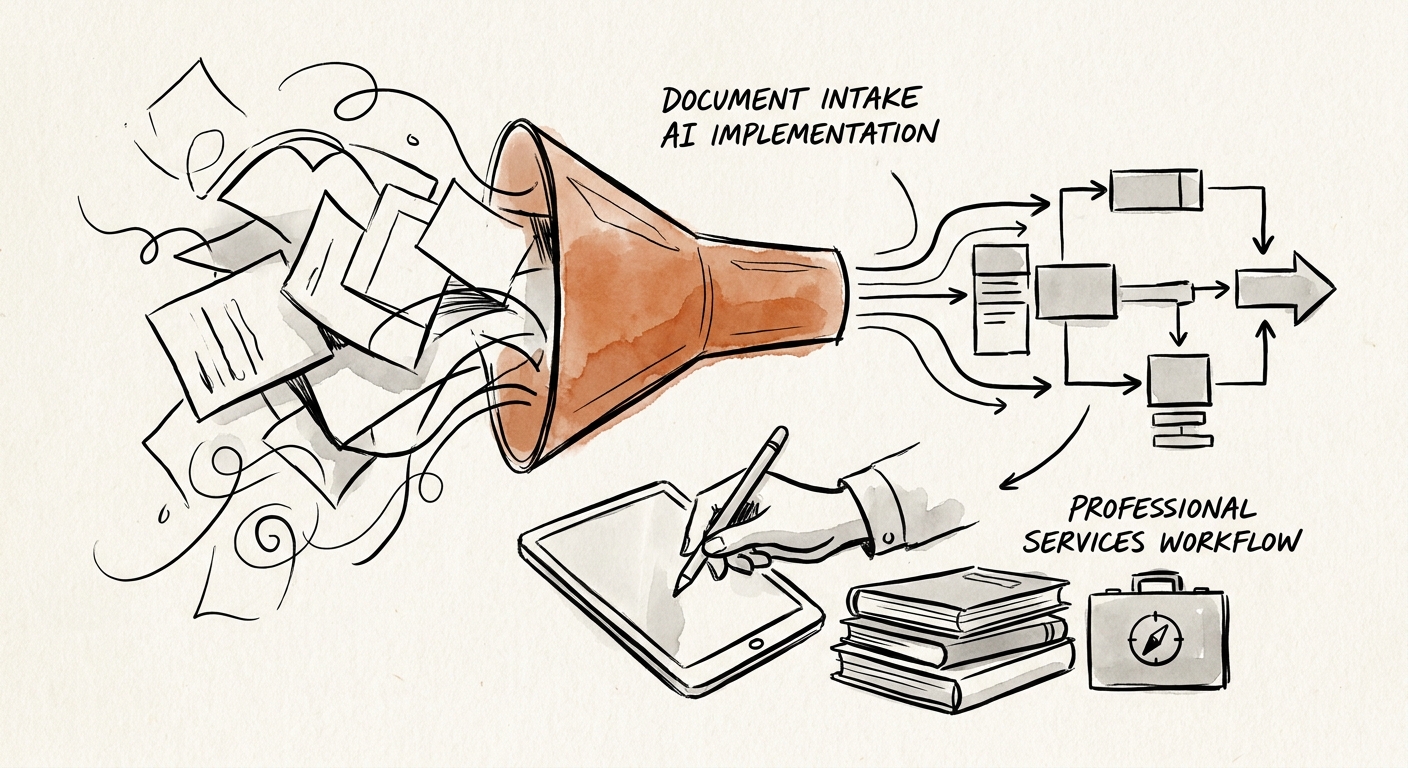
Document Intake AI for Professional Services: Start With One Document Type, Not the Whole Inbox
A practical playbook for professional services firms automating client document intake: pick one document family, keep every field traceable, and measure cleaner packets.
6 intake controls before production launch
BRIEF · AI VENDOR AND BUILD-VS-BUY
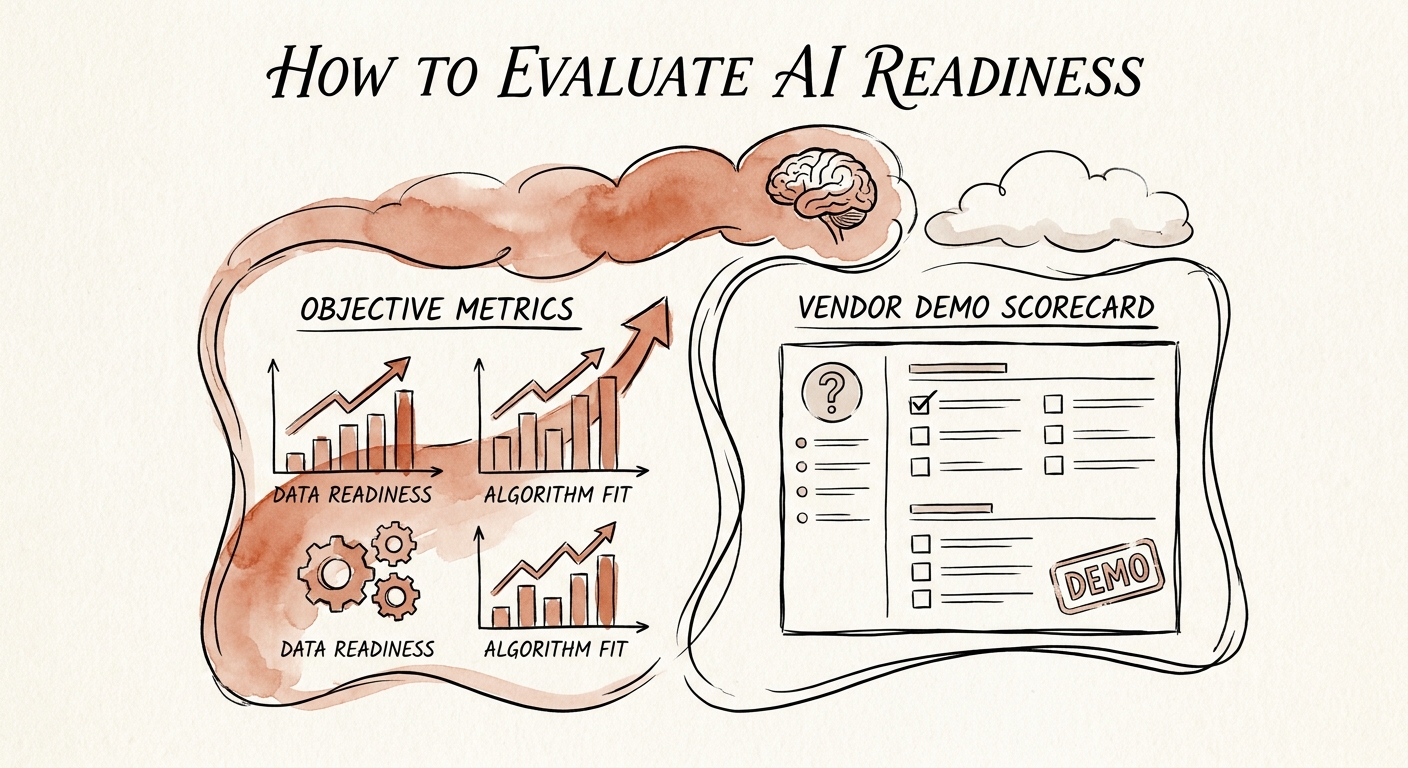
How to Read an AI Readiness Assessment Like the Person Paying for It
A buyer's field guide to judging an AI readiness assessment by what it commits to, not the demo that sells it. Five things the document must name.
5 questions to ask before a vendor demo
BRIEF · AI INDUSTRY USE CASES
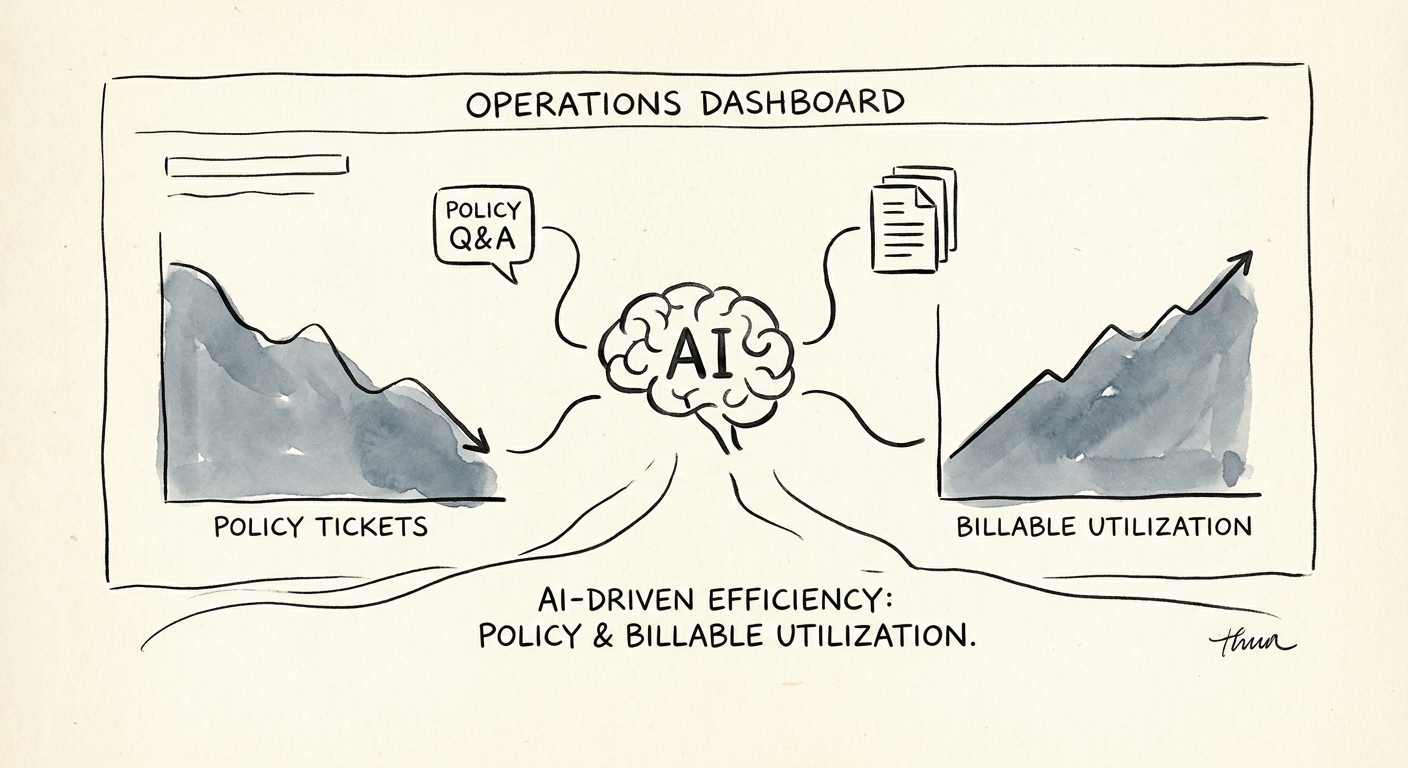
Policy Q&A AI for Professional Services Firms: Stop Interrupting the Partner
A second-year associate asks a partner the same policy question for the fourth time this week. Here is how to put firm policy behind a governed AI assistant without leaking client data.
5 implementation gates before rollout
BRIEF · AI FUNCTION USE CASES
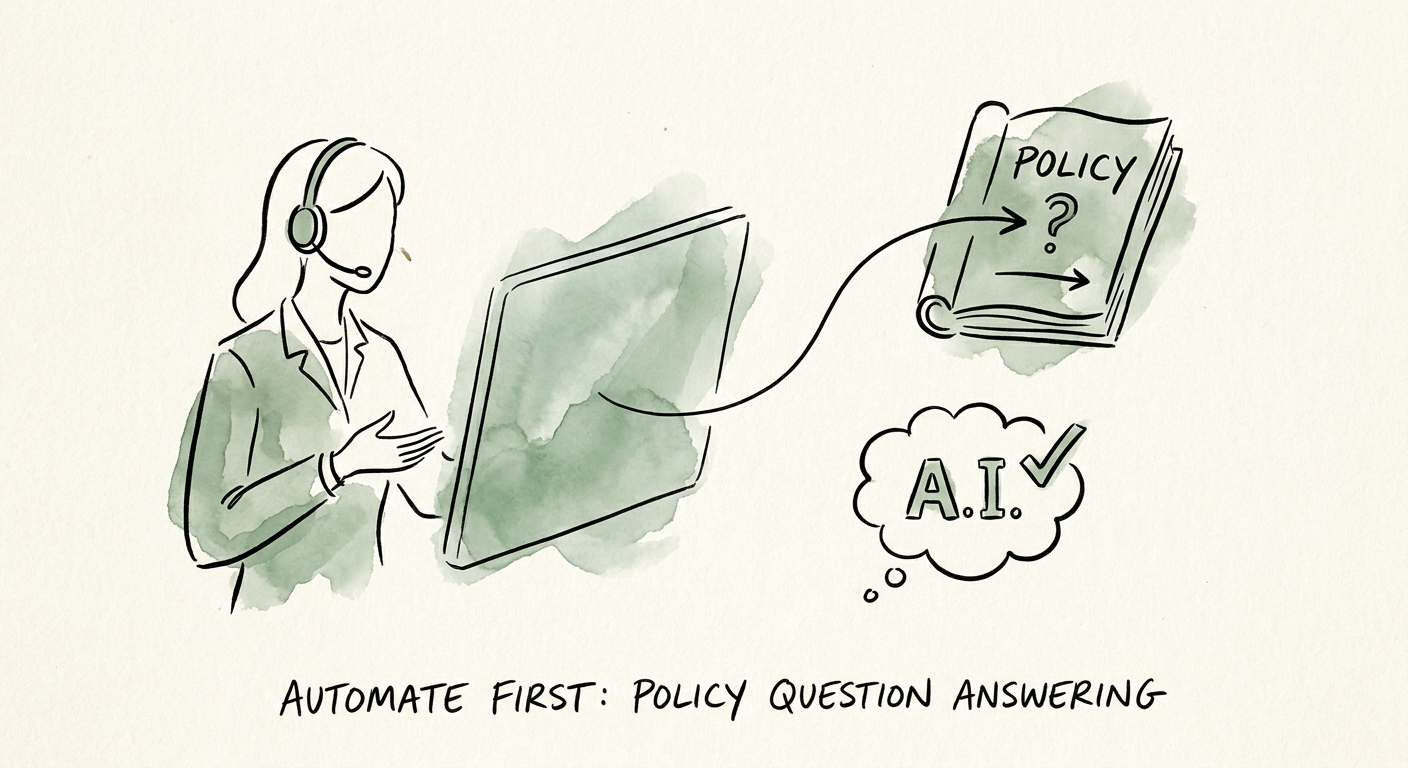
Customer Service AI: Answer the Agent First, Not the Customer
Why the first AI win in B2B customer service is answering your agents' policy questions — refunds, SLAs, exceptions — long before any customer sees a bot.
4 policy Q&A launch controls
BRIEF · AI GOVERNANCE AND TRAINING
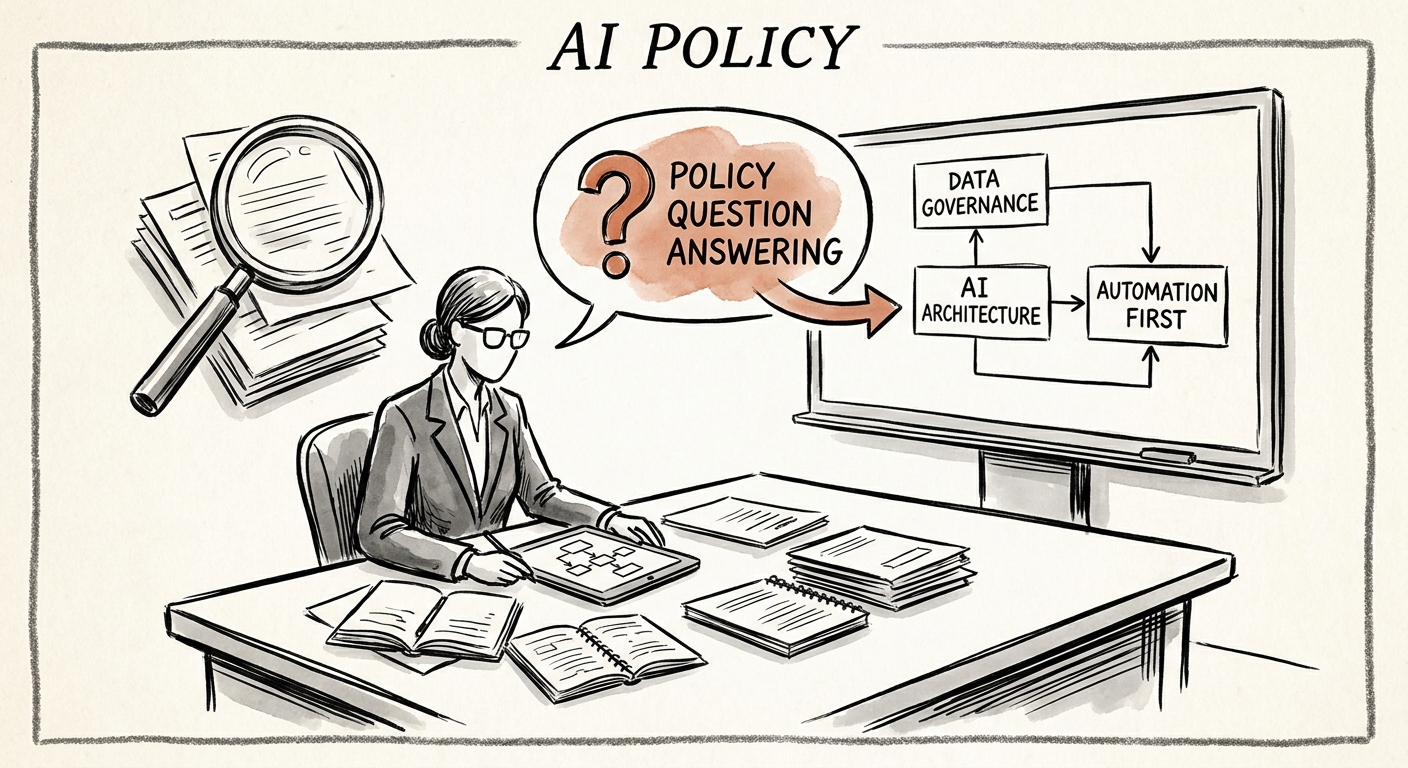
The First AI Workflow for IT and Data Teams: Answering the "Am I Allowed To" Questions
IT and data teams field the same access, classification, and acceptable-use questions weekly. Here's how to make policy Q&A your first safe, governed AI workflow.
4 controls before policy Q&A automation
BRIEF · AI GOVERNANCE AND TRAINING
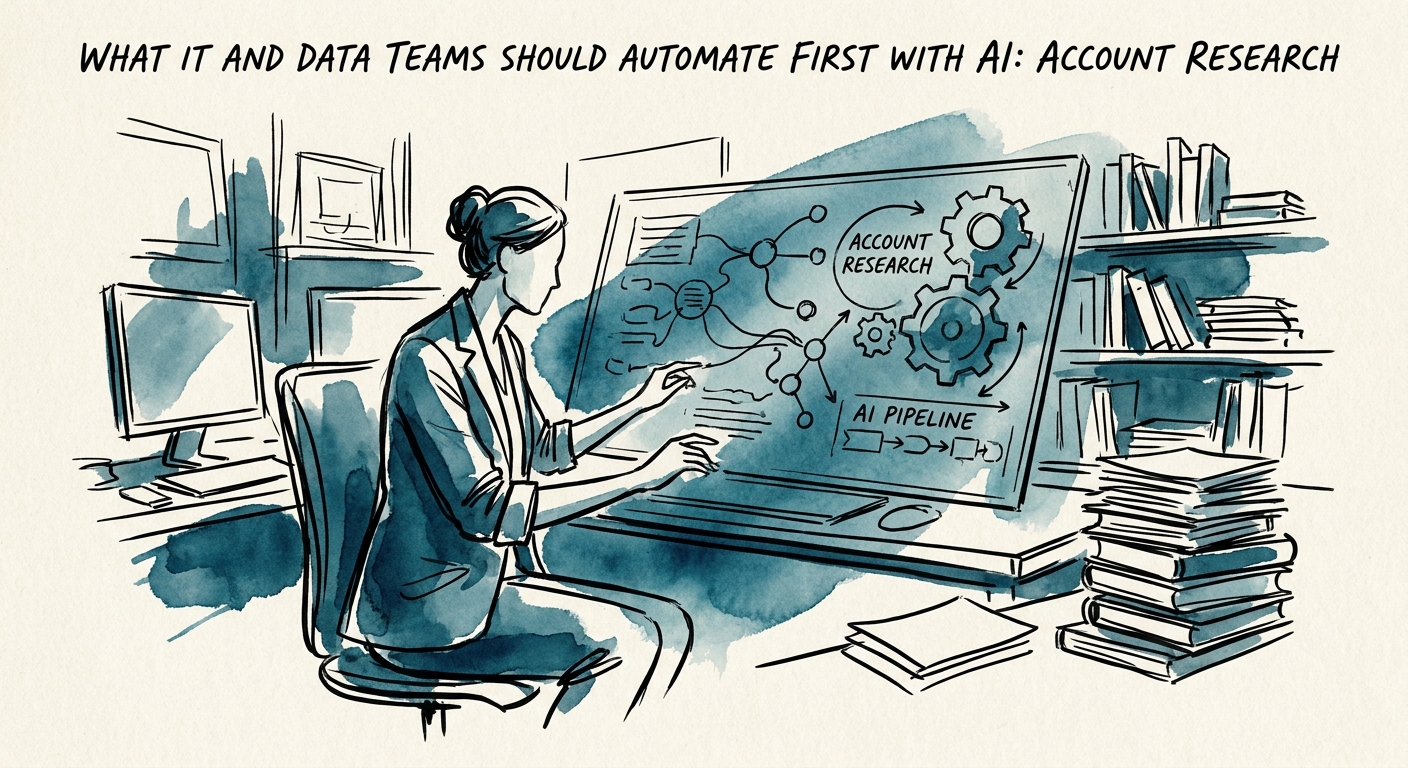
If You Own the Data Pipes, Automate Account Research First
Why IT and data teams should make AI account research their first project — and the source-layer, permission, and review work that decides if it holds up.
3 source layers to govern before launch
BRIEF · AI GOVERNANCE AND TRAINING
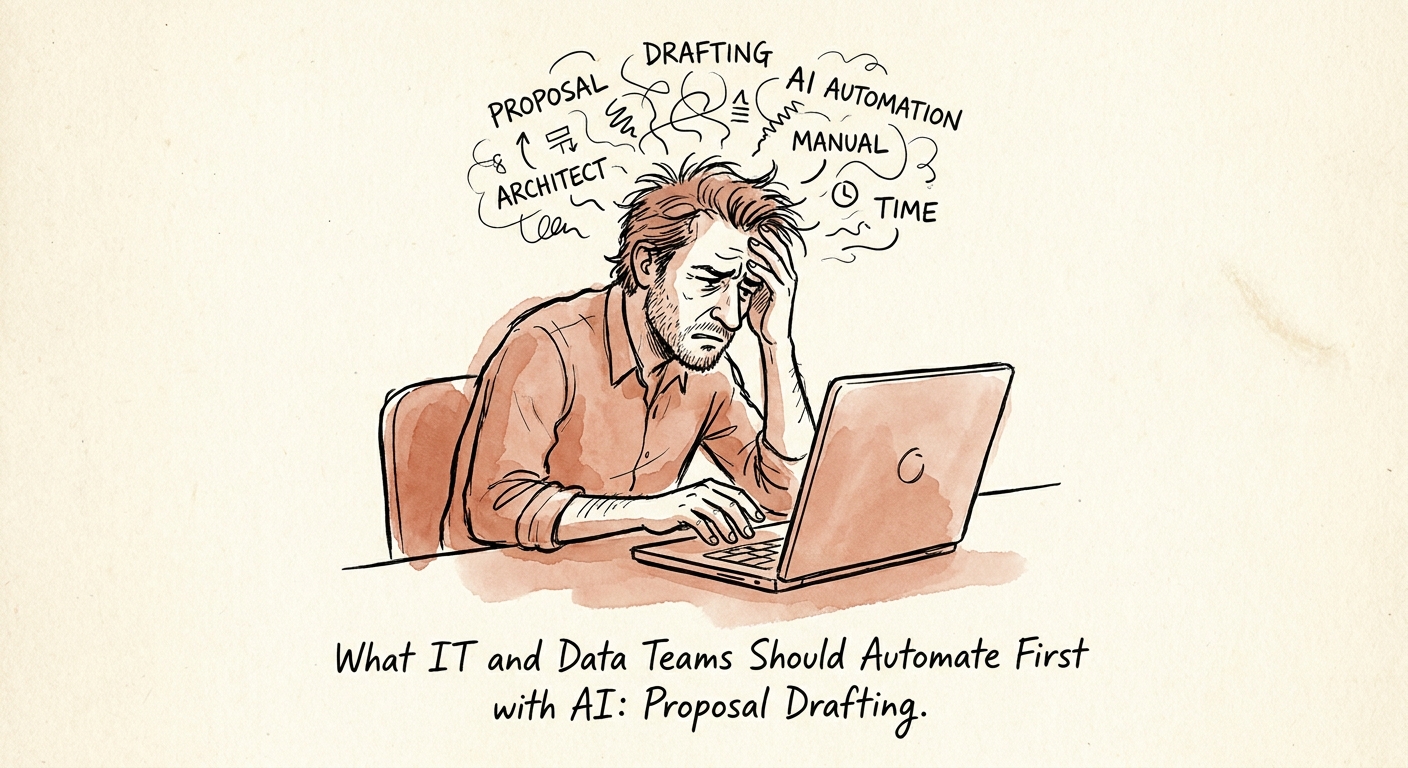
The First AI Project IT Should Own: The Technical Half of Every Proposal
When AI drafts the security and architecture sections of proposals, IT owns whether the claims are true. Here is how to govern that, starting with one source library.
4 technical controls for proposal drafting AI
BRIEF · AI WORKFLOW AUTOMATION
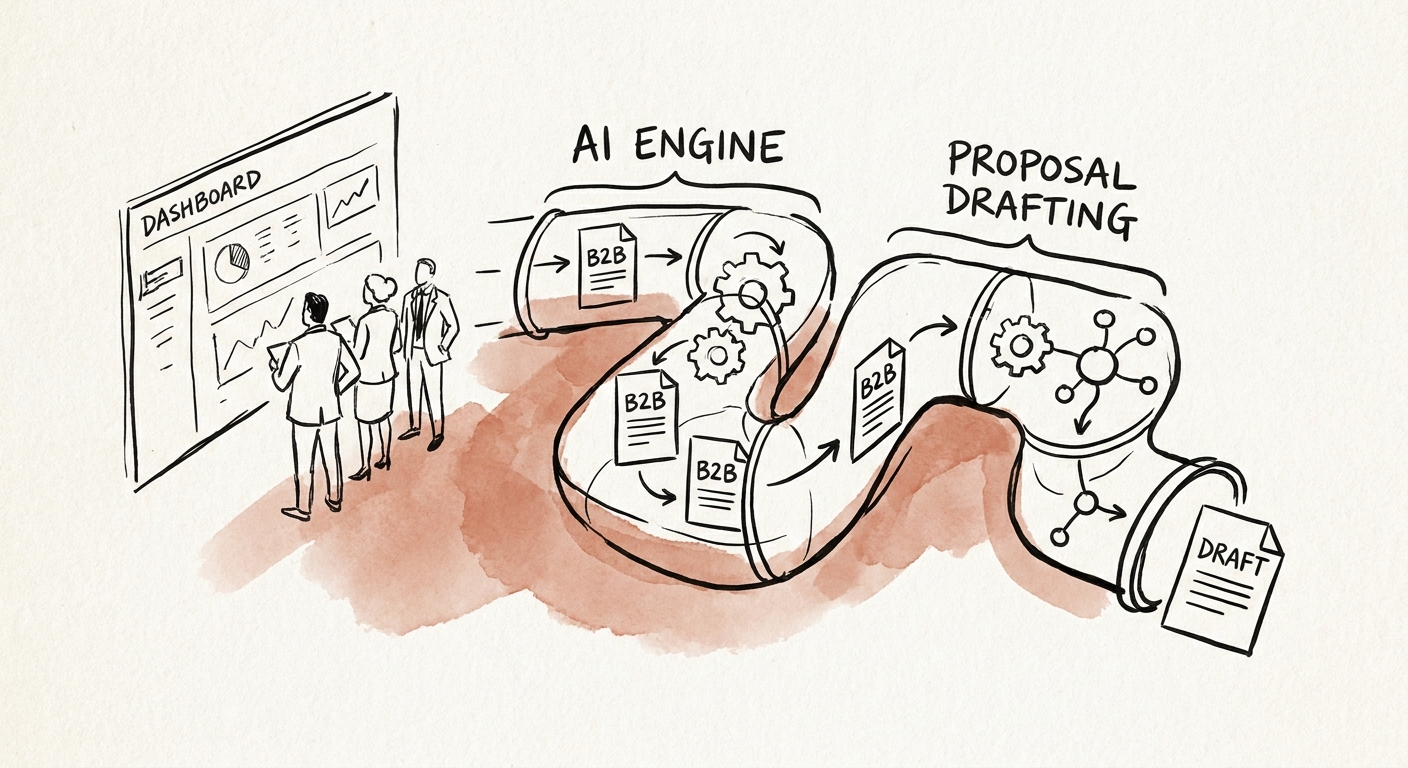
Why Proposal Drafting Is the Right First AI Job for Services Operations
For services and tech-services ops teams, proposal drafting is a strong first AI use case — if you wire it to delivery capacity, not just draft speed. Here's how.
5 proposal workflow controls before launch
BRIEF · AI VENDOR AND BUILD-VS-BUY
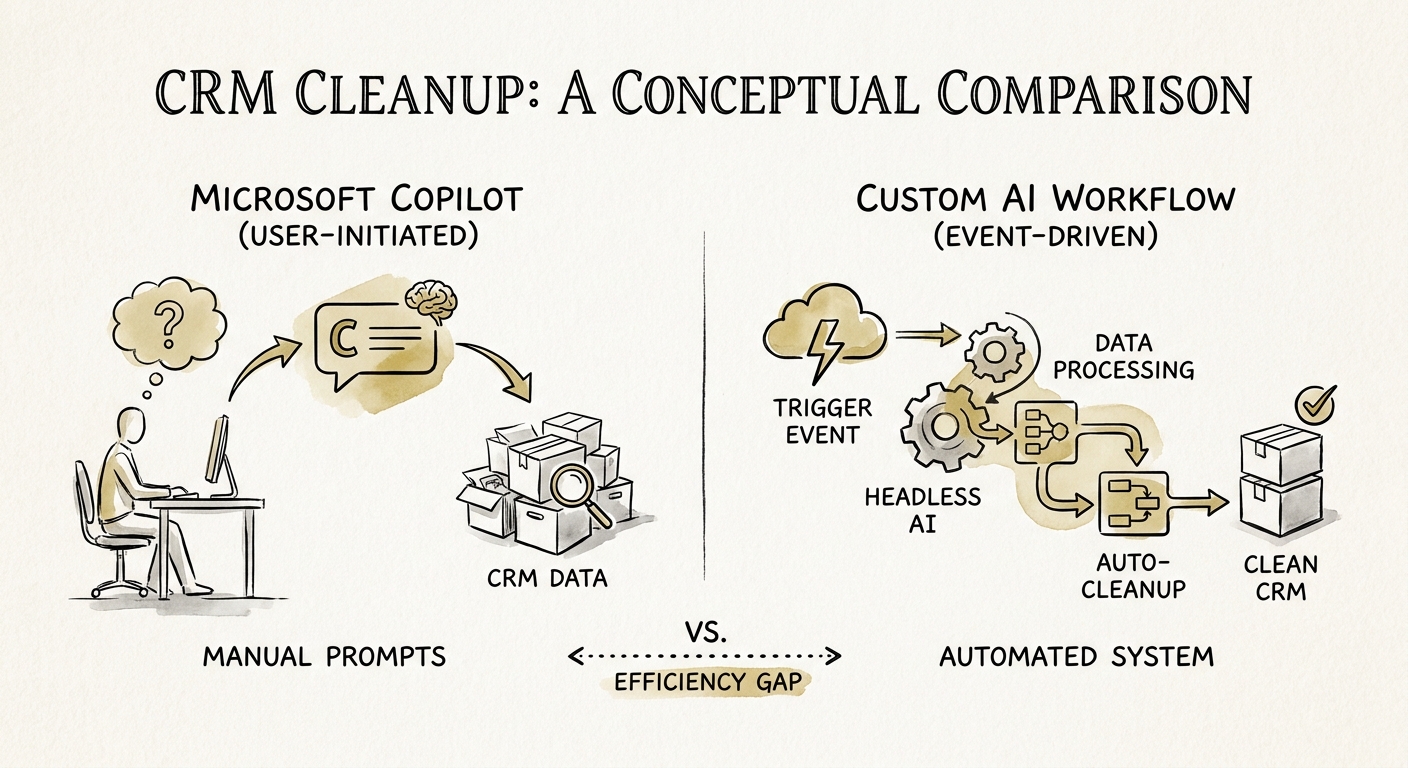
CRM Cleanup: When Copilot Helps and When You Need a Governed Workflow
Your CRM has three records for the same account and a forecast no one trusts. Here's how a 50-300 person company decides between Copilot and a governed cleanup workflow.
1 governed CRM cleanup workflow before broad AI rollout
BRIEF · AI VENDOR AND BUILD-VS-BUY
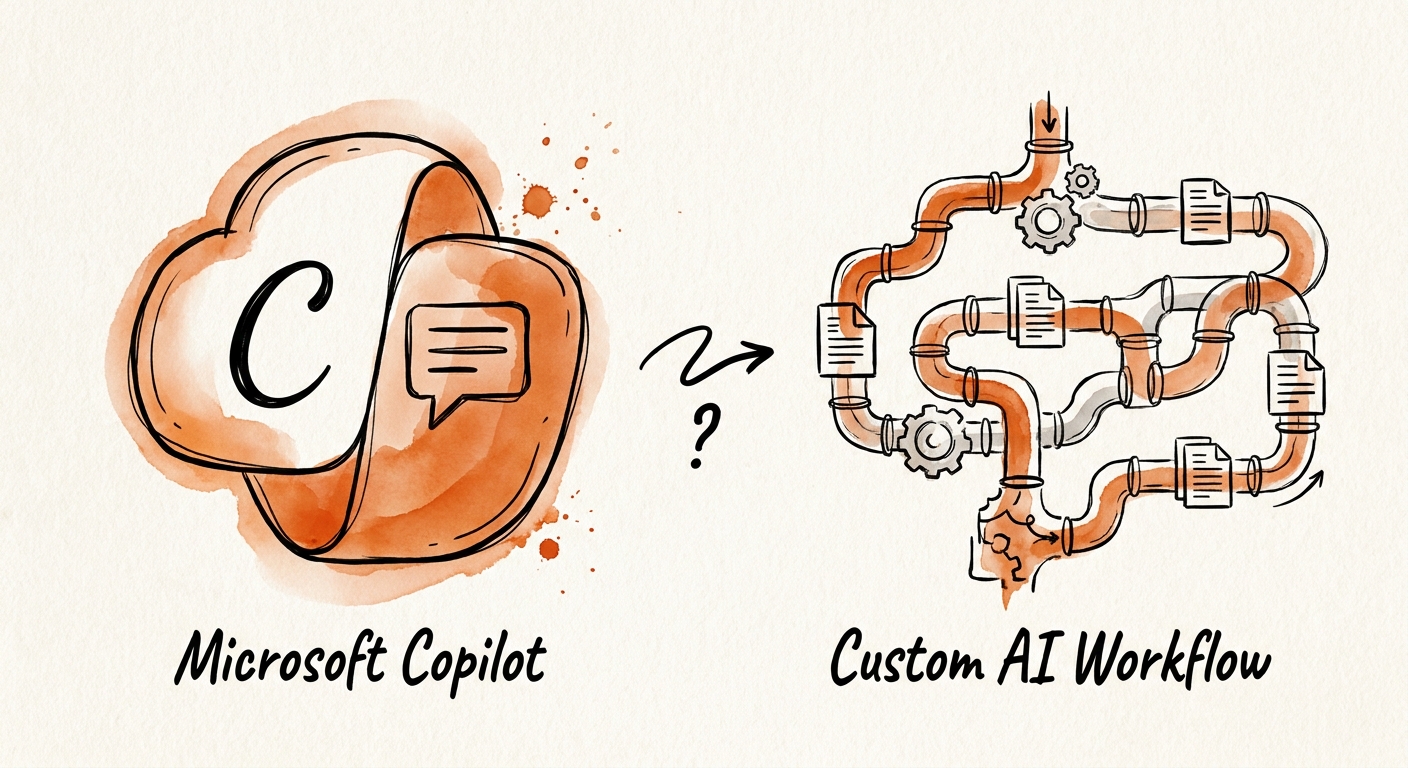
Microsoft Copilot or a Custom AI Workflow for Customer Feedback? The Real Test Is Wednesday Morning
When customer feedback analysis belongs in Microsoft 365 Copilot versus a governed custom workflow — judged by whether themes survive contact with a real roadmap decision.
1 governed customer feedback analysis workflow before broad AI rollout
BRIEF · AI VENDOR AND BUILD-VS-BUY
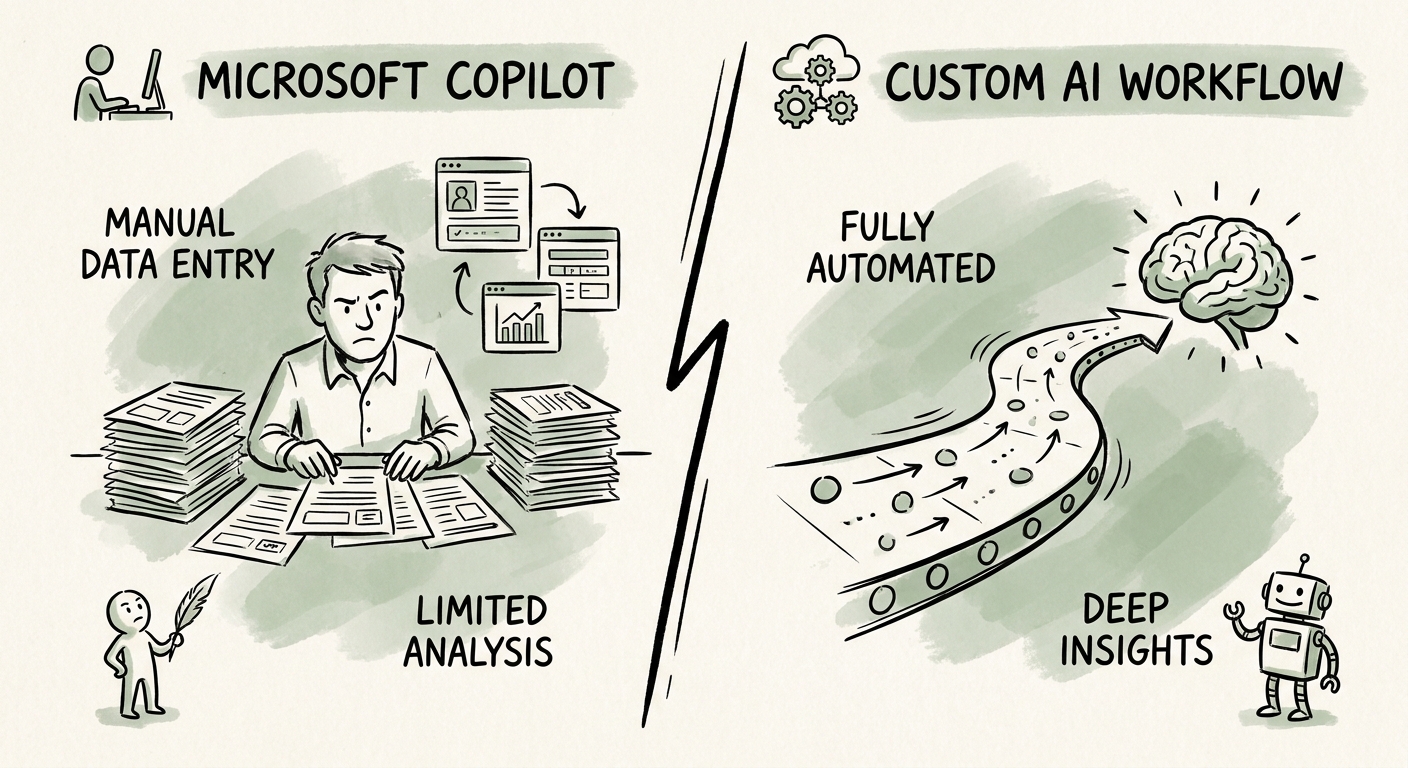
Microsoft 365 Copilot vs a Custom Workflow for Data Cleanup: Where the Line Actually Is
A 50-300 person company has a duplicate-vendor mess. Copilot can explain it; only a governed workflow can fix records safely. Here's where to draw the line.
1 governed data cleanup workflow before broad AI rollout
BRIEF · AI VENDOR AND BUILD-VS-BUY
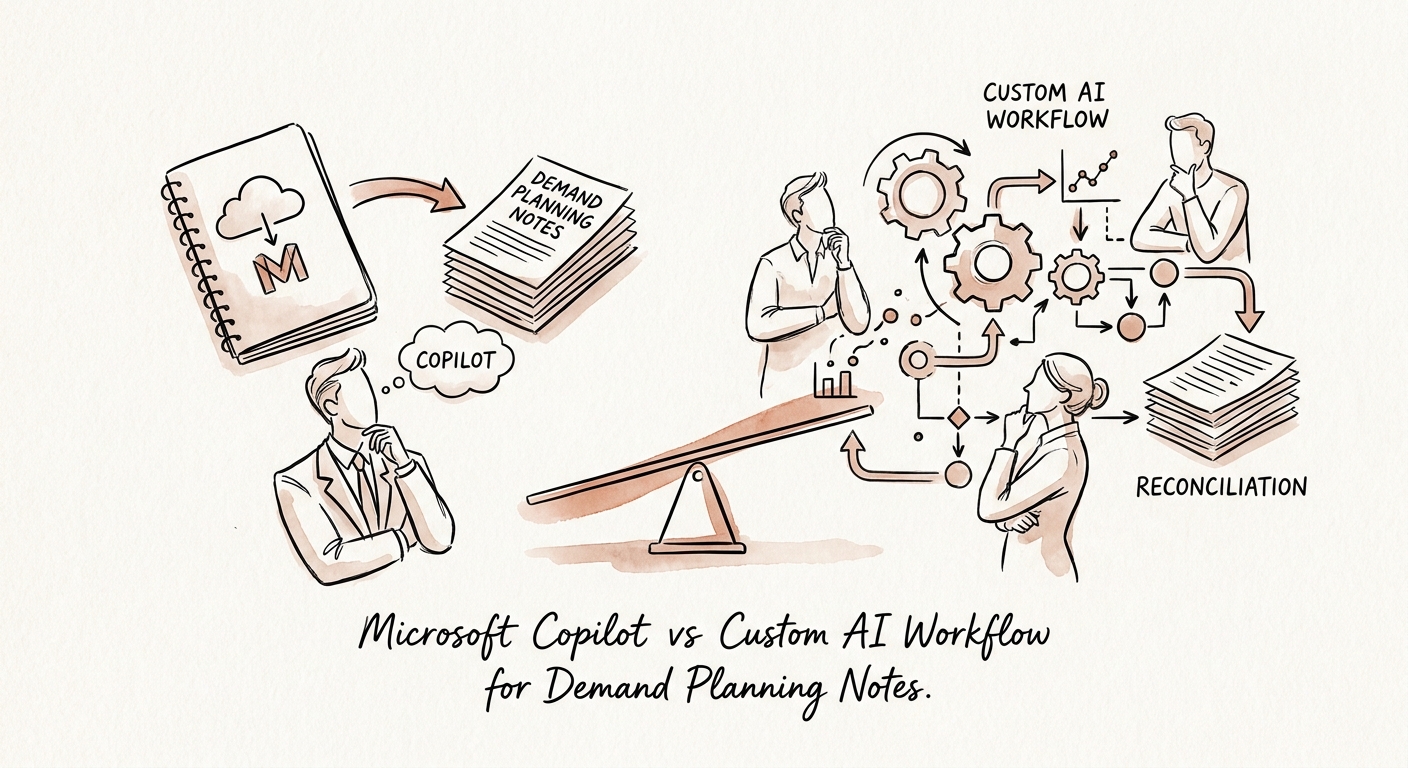
Demand Planning Notes: Microsoft 365 Copilot or a Custom AI Workflow?
The forecast lives in the margins of your planning notes. Here's how a 50-300 person operation decides what belongs in Copilot and what needs a real workflow.
1 governed demand planning notes workflow before broad AI rollout
BRIEF · AI VENDOR AND BUILD-VS-BUY
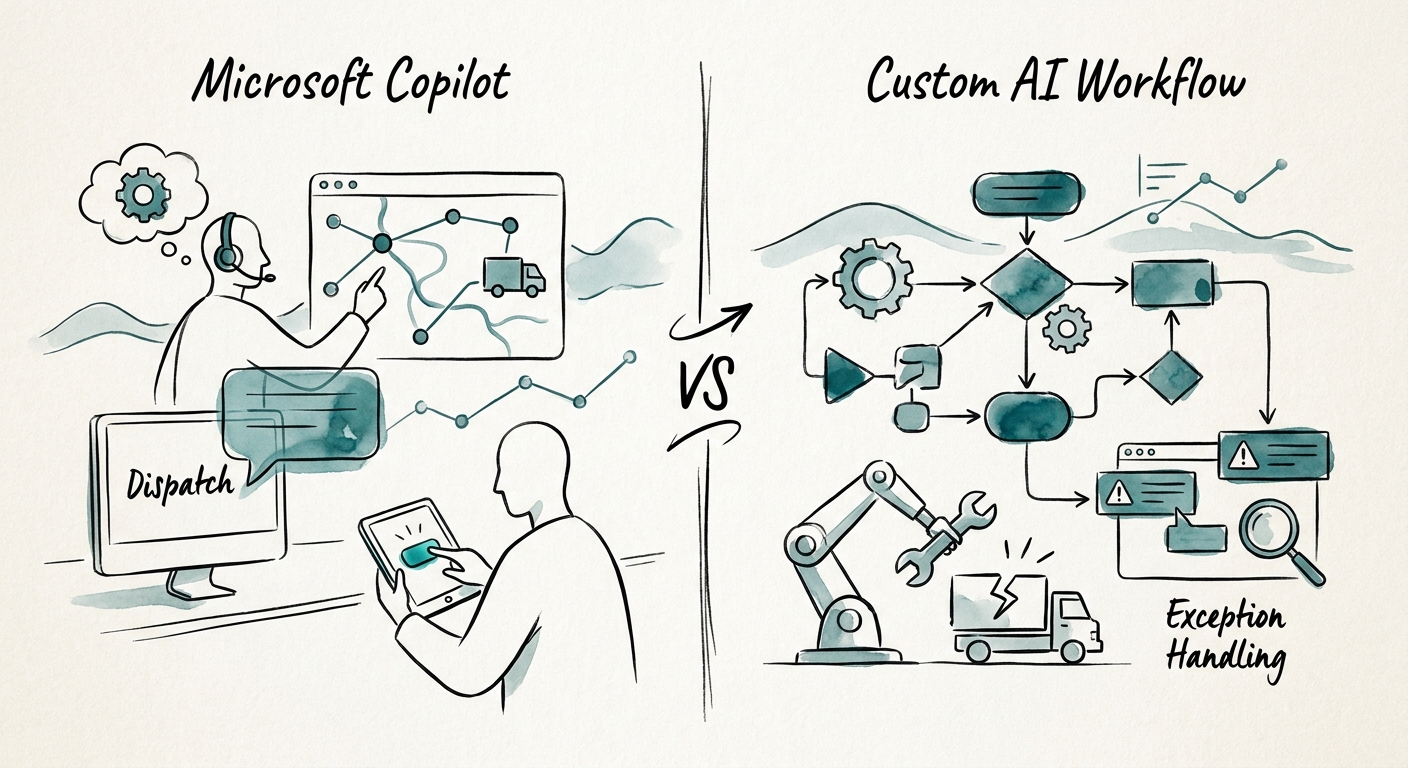
Dispatch Exceptions: Where Microsoft Copilot Stops and a Custom AI Workflow Starts
A 40-tech HVAC shop loses a customer every time a no-parts call sits in the queue. Here's exactly when Copilot is enough and when you build the workflow.
1 governed dispatch exception handling workflow before broad AI rollout
BRIEF · AI VENDOR AND BUILD-VS-BUY
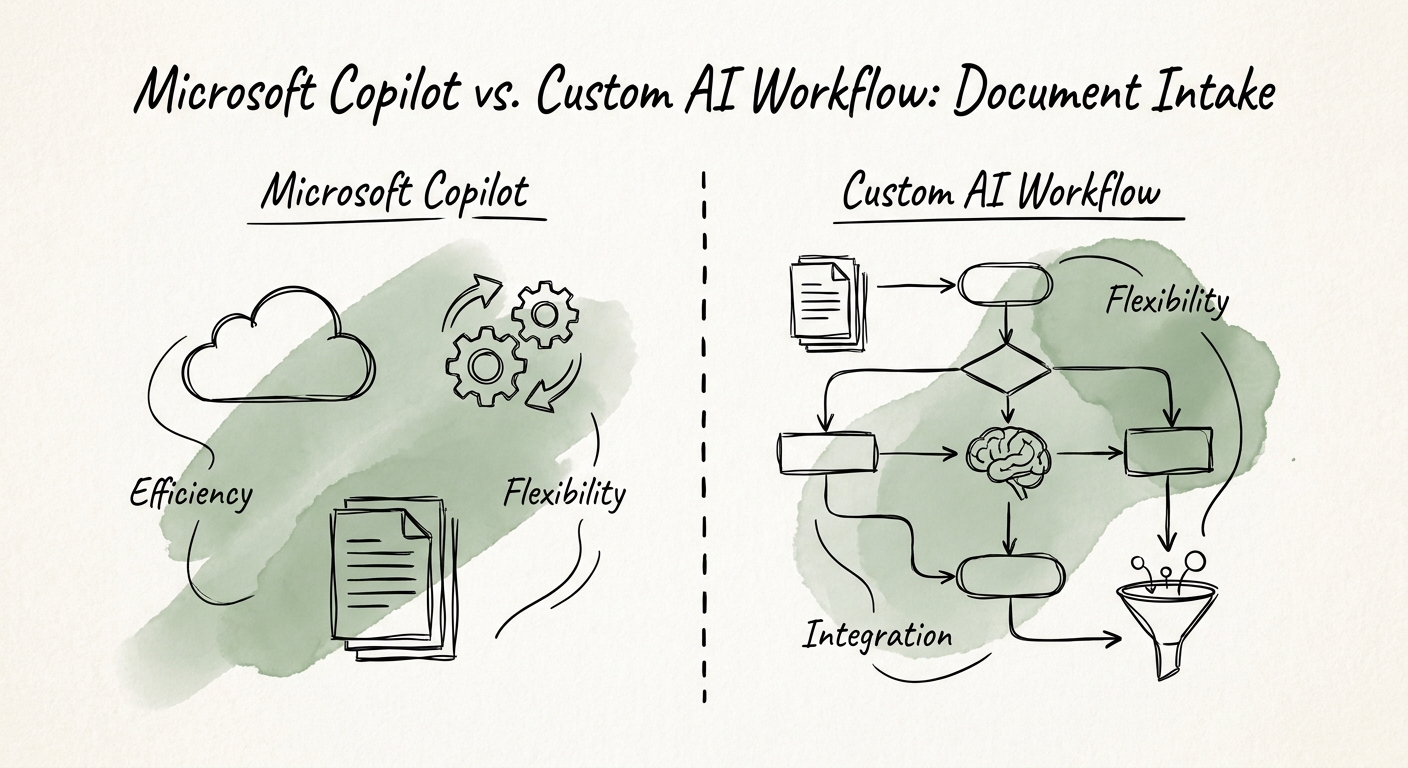
Microsoft 365 Copilot vs a Custom AI Workflow for Document Intake
A 50-300 person company drowning in inbound PDFs and email attachments faces one real question: does intake belong in Copilot, or does it need a workflow?
1 governed document intake workflow before broad AI rollout
BRIEF · AI VENDOR AND BUILD-VS-BUY
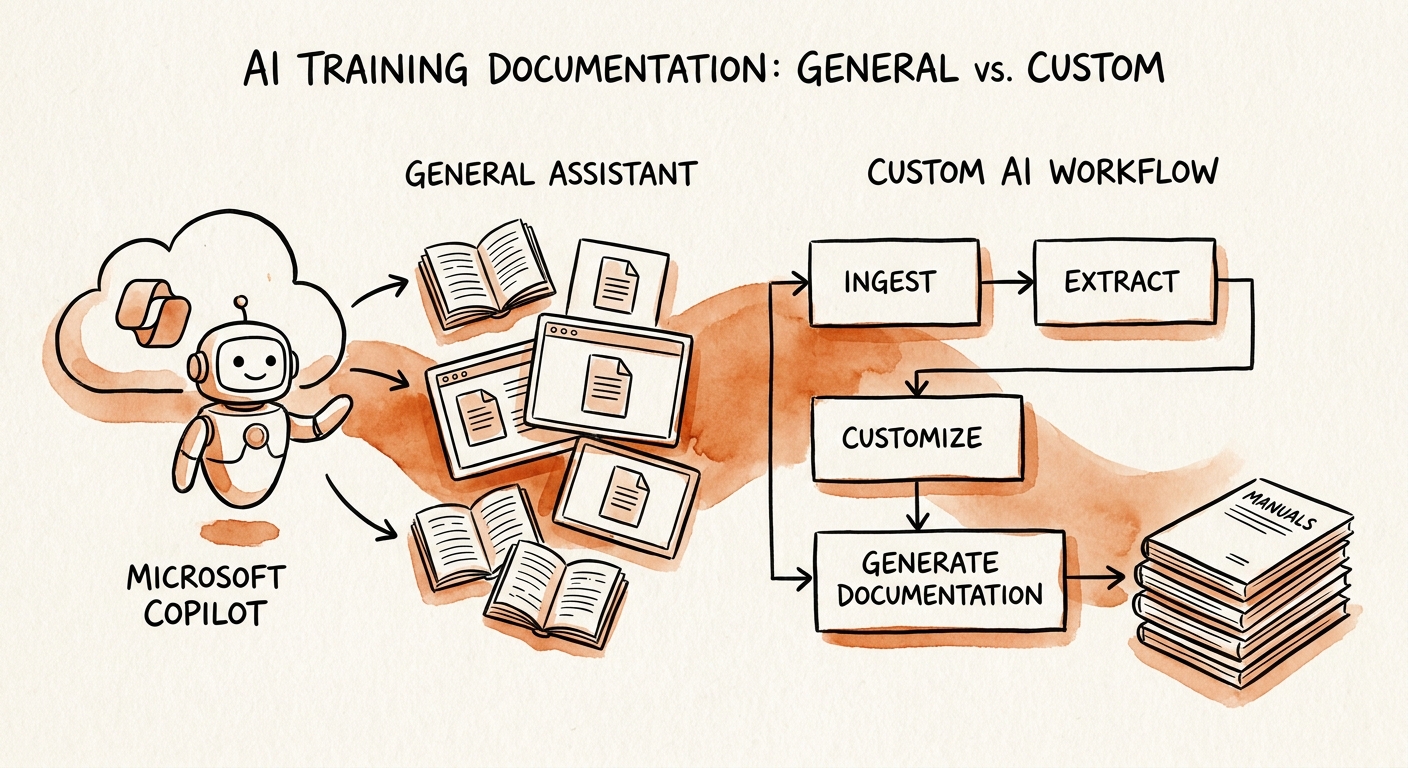
Microsoft Copilot or a Custom AI Workflow for Employee Training Docs?
Training docs that teach the old process are worse than no docs. How 50-300 person companies decide what belongs in Copilot and what needs a governed workflow.
1 governed employee training documentation workflow before broad AI rollout
BRIEF · AI VENDOR AND BUILD-VS-BUY
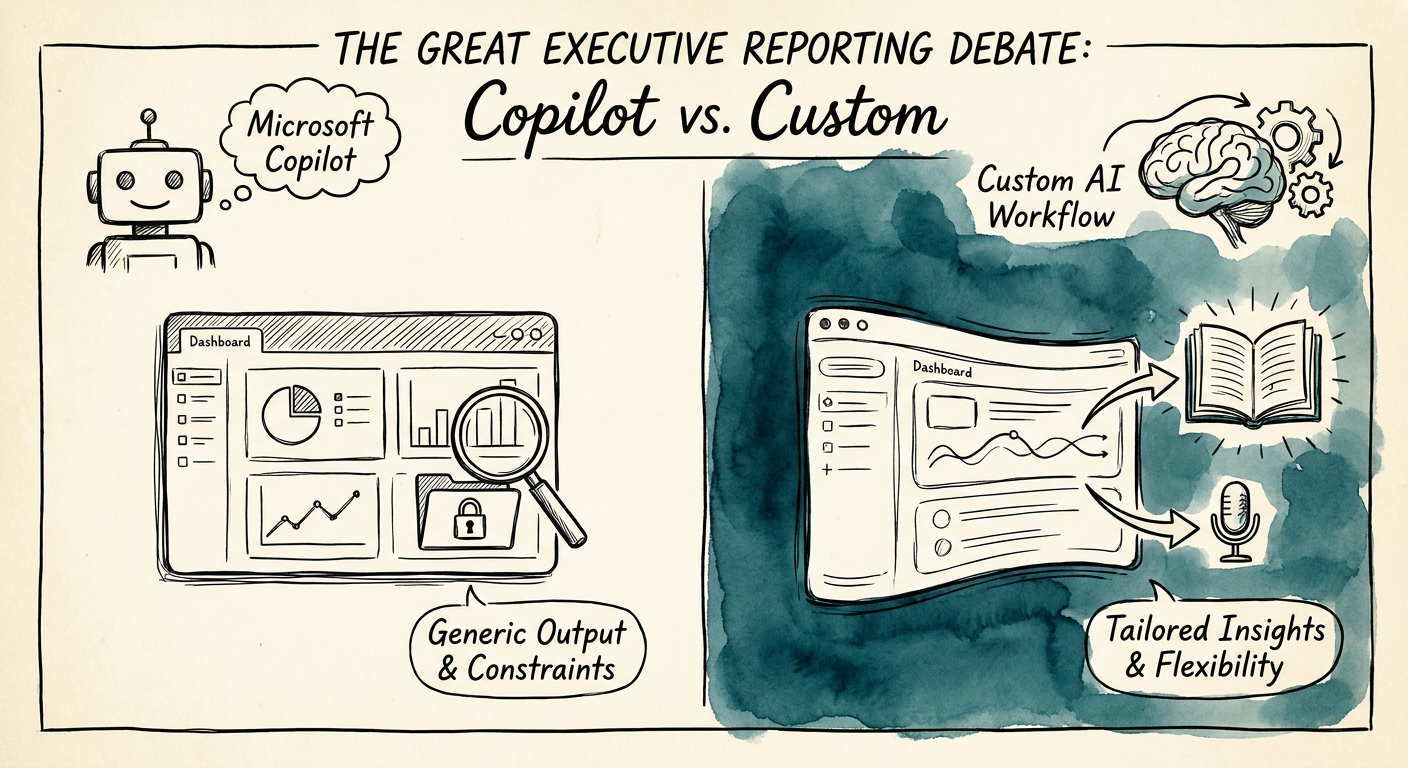
Microsoft 365 Copilot vs a Custom AI Workflow for Your Board Pack
Should your monthly board pack run on Microsoft 365 Copilot or a custom AI workflow? The dividing line is who owns the number when a director pushes back.
1 governed executive reporting workflow before broad AI rollout
BRIEF · AI VENDOR AND BUILD-VS-BUY
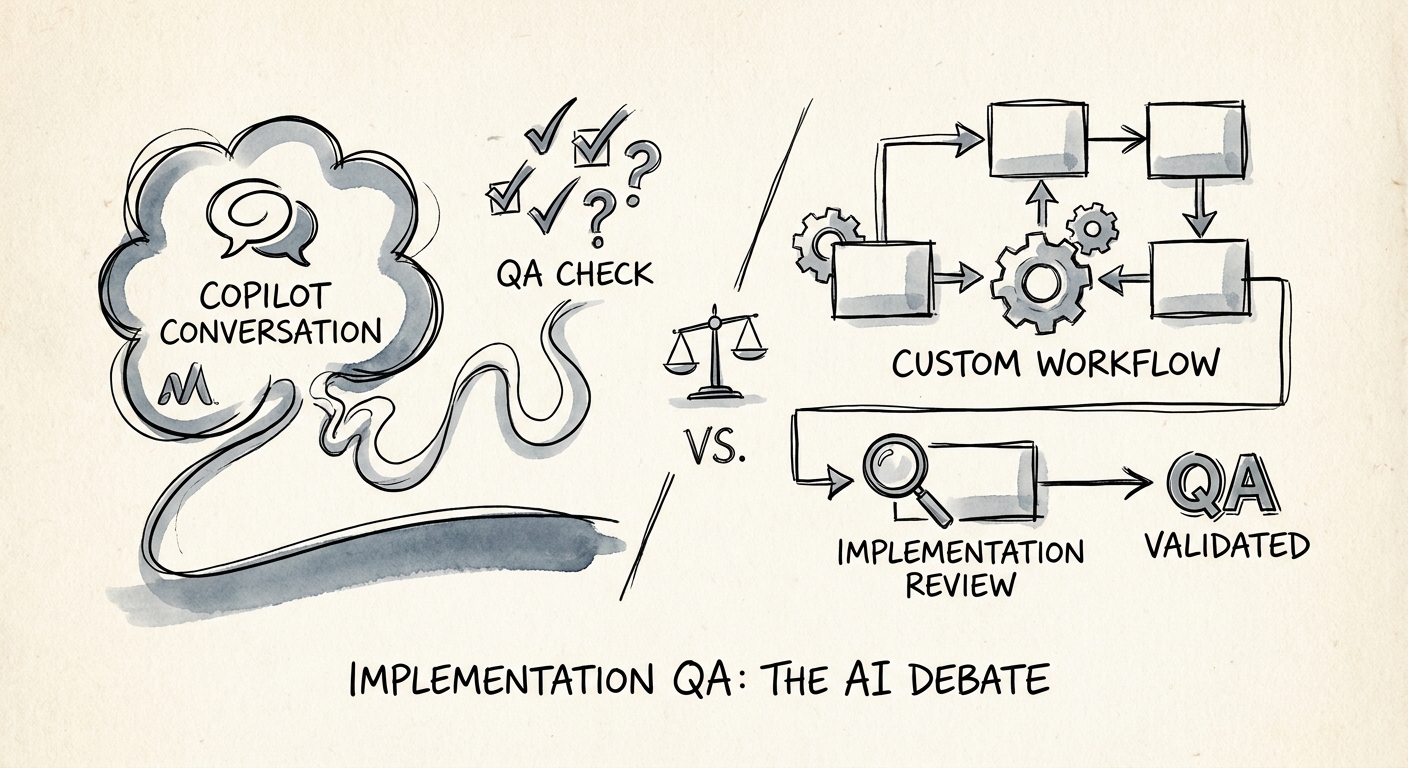
Microsoft Copilot vs Custom AI for Implementation QA: Who Owns the Go-Live Gate?
Copilot can summarize your release notes. It can't refuse a go-live. Here's where 50-300 person delivery teams should draw the line on implementation QA.
1 governed implementation QA workflow before broad AI rollout
BRIEF · AI VENDOR AND BUILD-VS-BUY
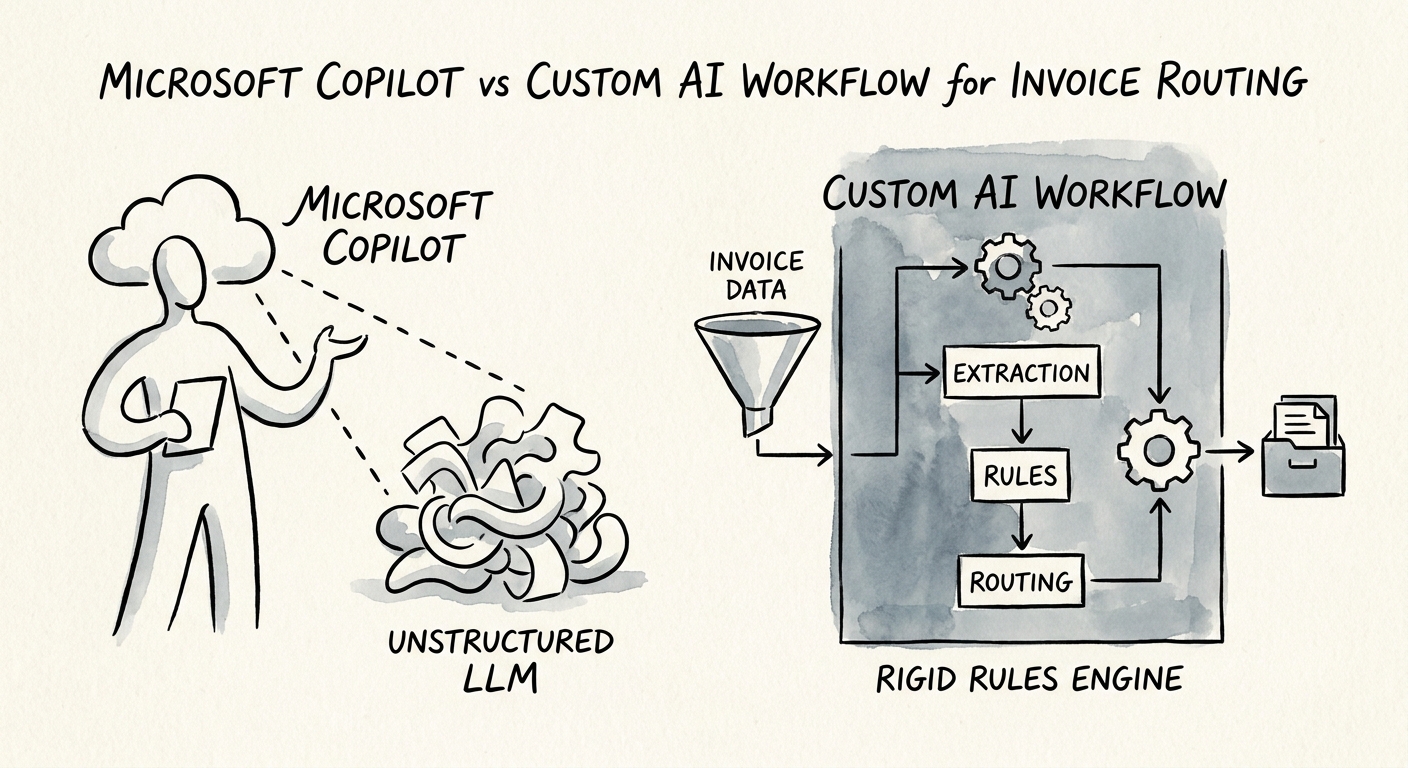
Microsoft 365 Copilot vs a Custom AI Workflow for Invoice Routing: Where the Line Actually Sits
M365 Copilot can summarize an invoice. It can't enforce your approver matrix or write to your ERP. Here's exactly where a 50-300 person AP team draws the line.
1 governed invoice routing workflow before broad AI rollout
BRIEF · AI VENDOR AND BUILD-VS-BUY
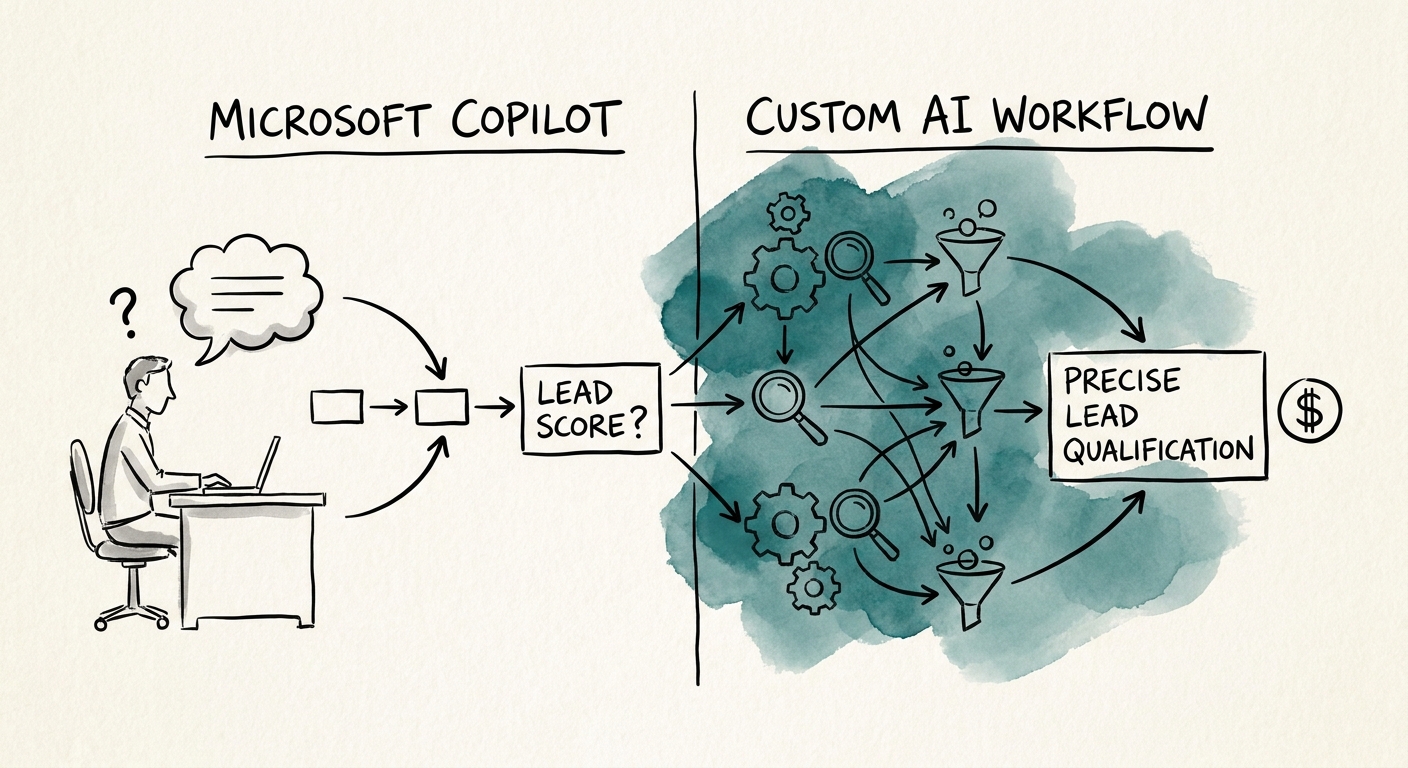
Microsoft 365 Copilot vs a Custom AI Workflow for Lead Qualification: Where the Handoff Actually Breaks
At 50-300 employees, lead qualification fails in the SDR-to-AE handoff, not the summary. Where Microsoft 365 Copilot helps and where a custom workflow earns its keep.
1 governed lead qualification workflow before broad AI rollout
BRIEF · AI VENDOR AND BUILD-VS-BUY
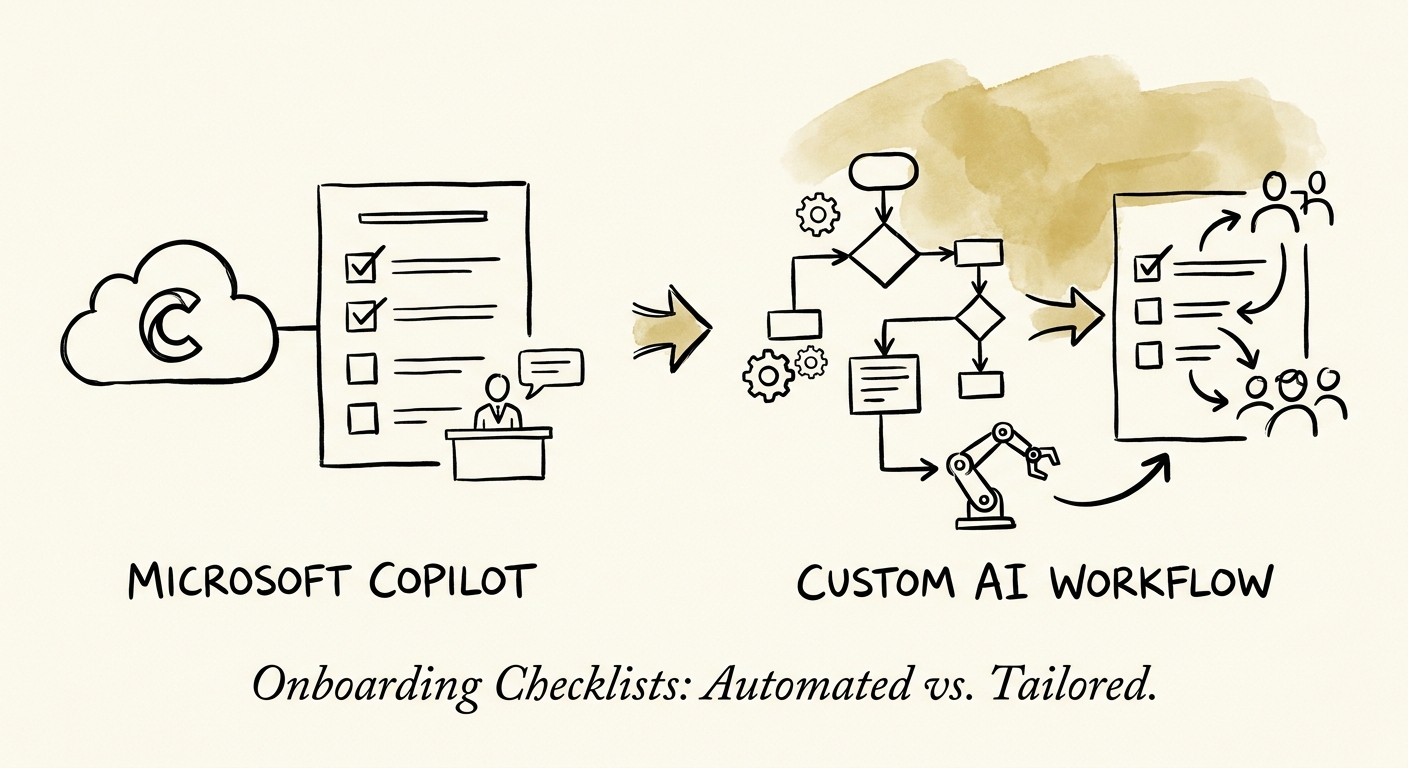
Microsoft 365 Copilot vs a Custom AI Workflow for Onboarding Checklists
A new hire's start date never moves. Here's how a 50-300 person company decides whether onboarding checklists belong in Microsoft 365 Copilot or a custom workflow.
1 governed onboarding checklists workflow before broad AI rollout