BRIEF · AI KNOWLEDGE SYSTEMS
When Your AI Cites a Deprecated Feature: Product-Doc Knowledge Systems for Services Firms
A delivery consultant asks your AI how a feature works. It answers from last year's release notes. Here's how services firms version-control product docs before they ship retrieval.
1 approved documentation library before AI retrieval
BRIEF · AI KNOWLEDGE SYSTEMS
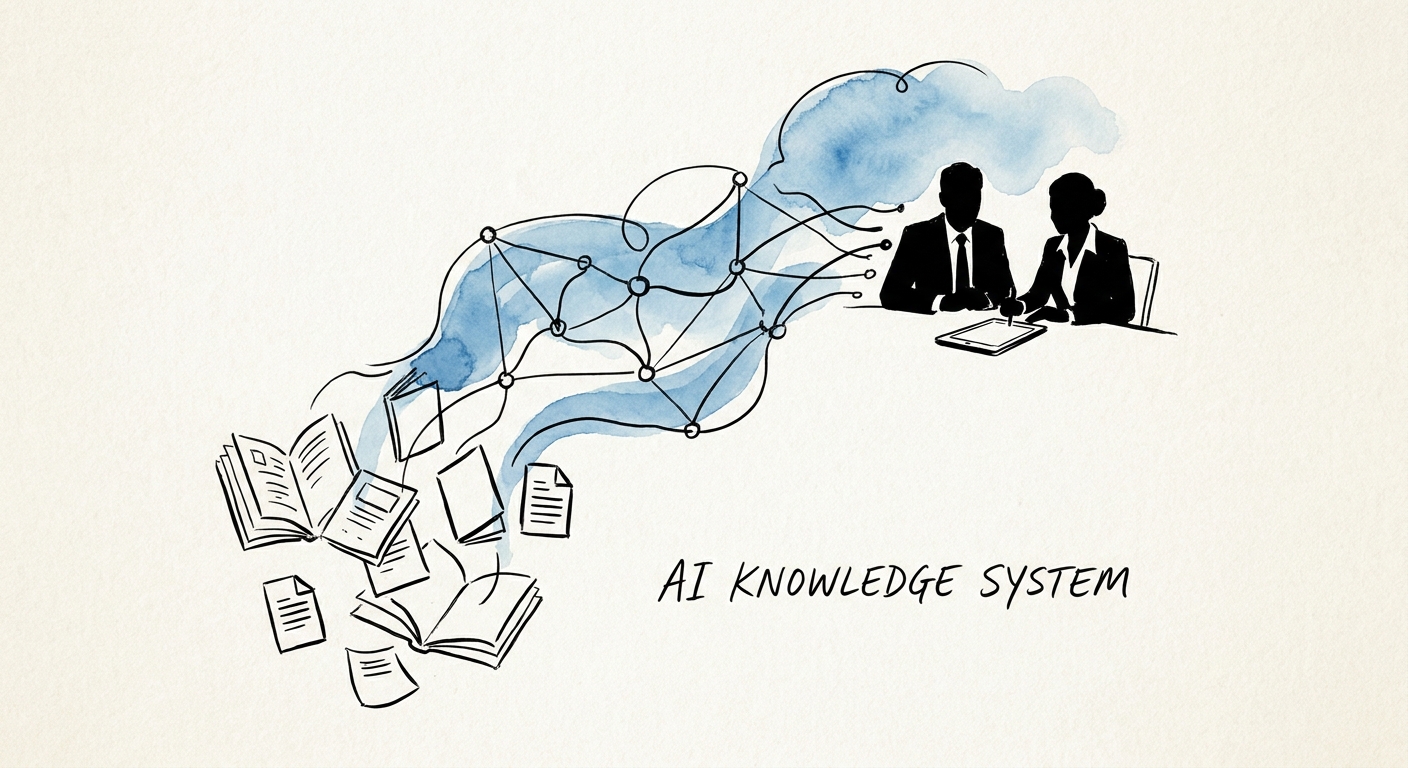
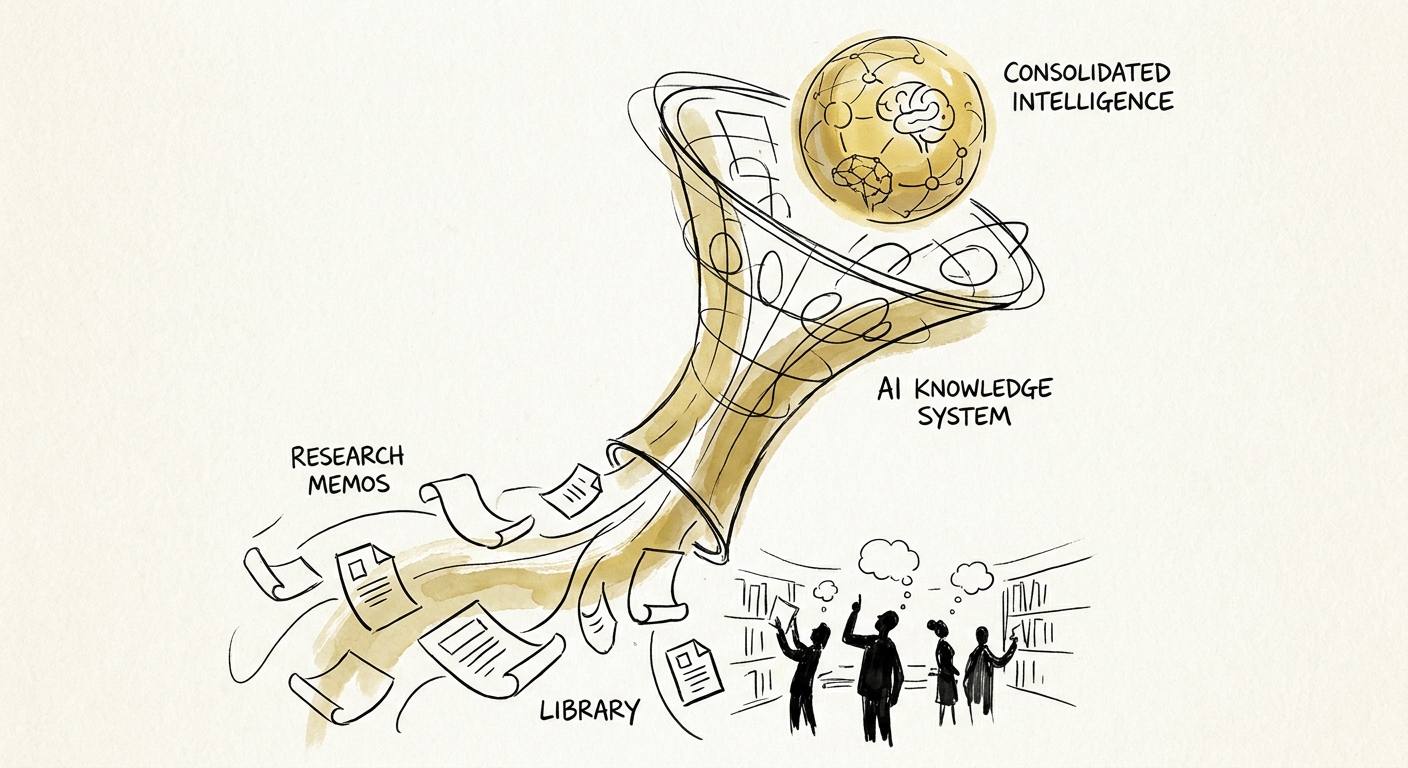
The Research Memo Your AI Should Never Surface: Building a Governed Knowledge System for Consulting Firms
A research memo library is full of drafts, retired versions, and client-confidential findings. Here is how consulting firms build an AI system that knows the difference.
1 source-of-truth library before AI retrieval
BRIEF · AI TRANSFORMATION STRATEGY
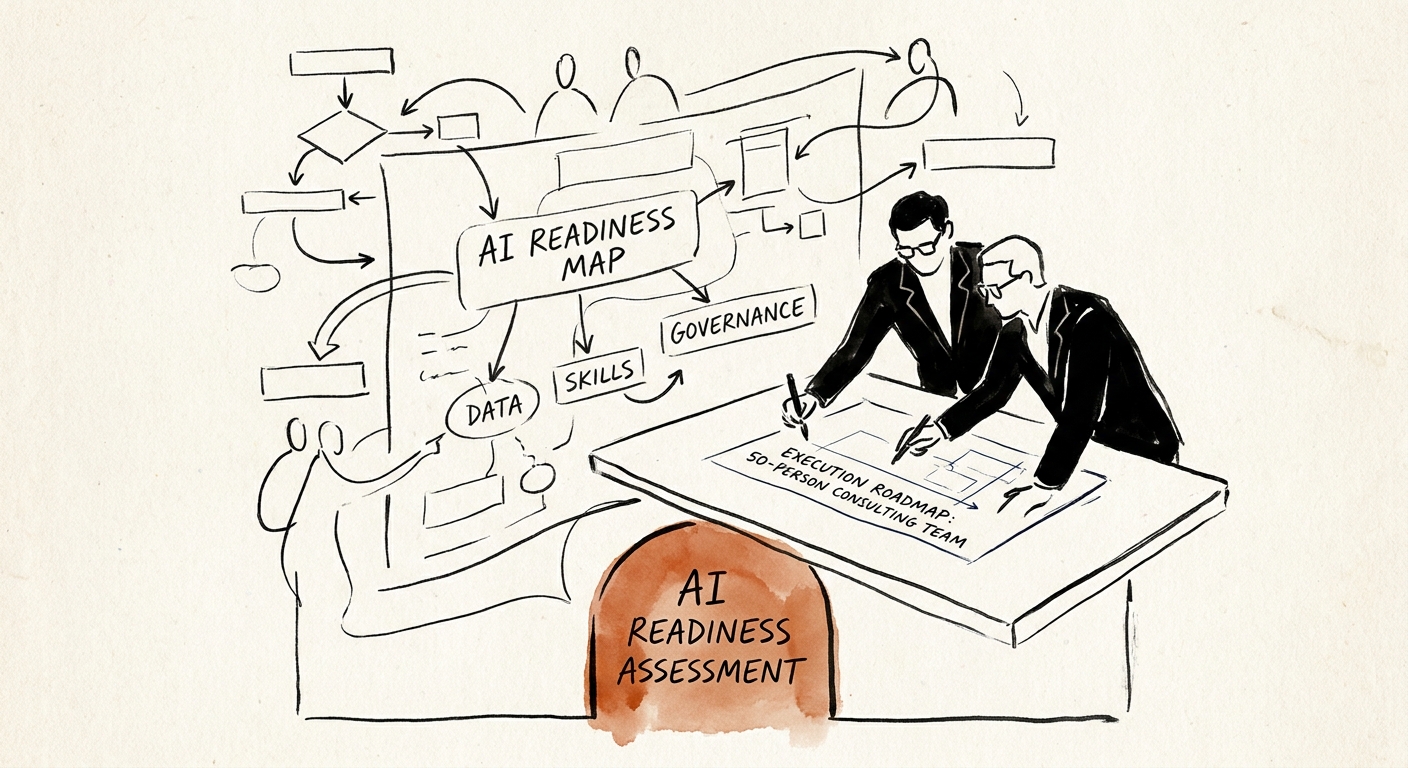
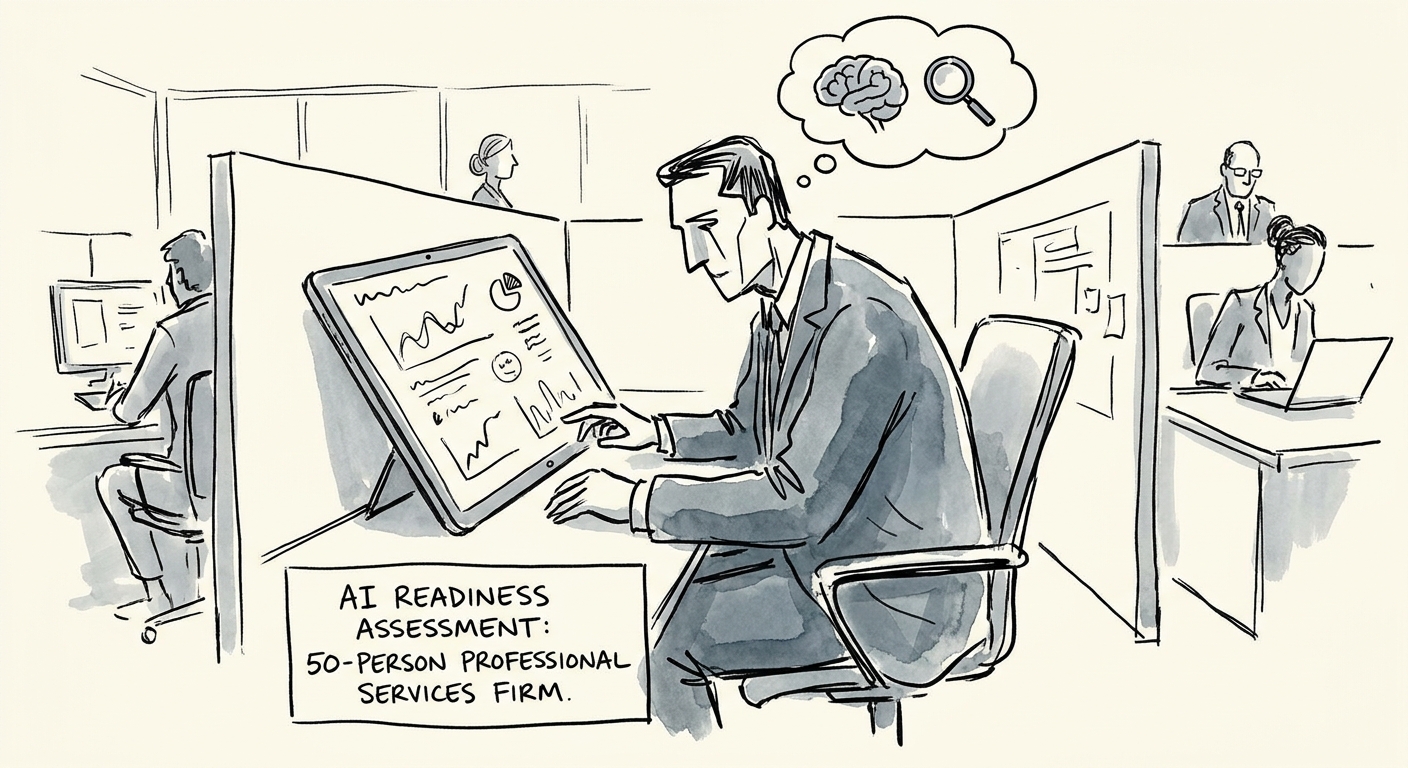
AI Readiness for a 50-Person Consulting Firm: Start With Realization, Not Licenses
A 50-person consulting firm doesn't need an AI rollout. It needs one delivery workflow where realization, reuse, and partner review can be measured.
8 readiness checks before buying more AI software
BRIEF · AI TRANSFORMATION STRATEGY
AI Readiness for a 50-Person Firm Comes Down to Three Questions, Not Three Tools
Most 50-person firms ask if they can buy an AI tool. The real readiness test is whether one billable workflow survives partner review. Here's how to check.
1 production workflow to prove before wider rollout
BRIEF · AI TRANSFORMATION STRATEGY
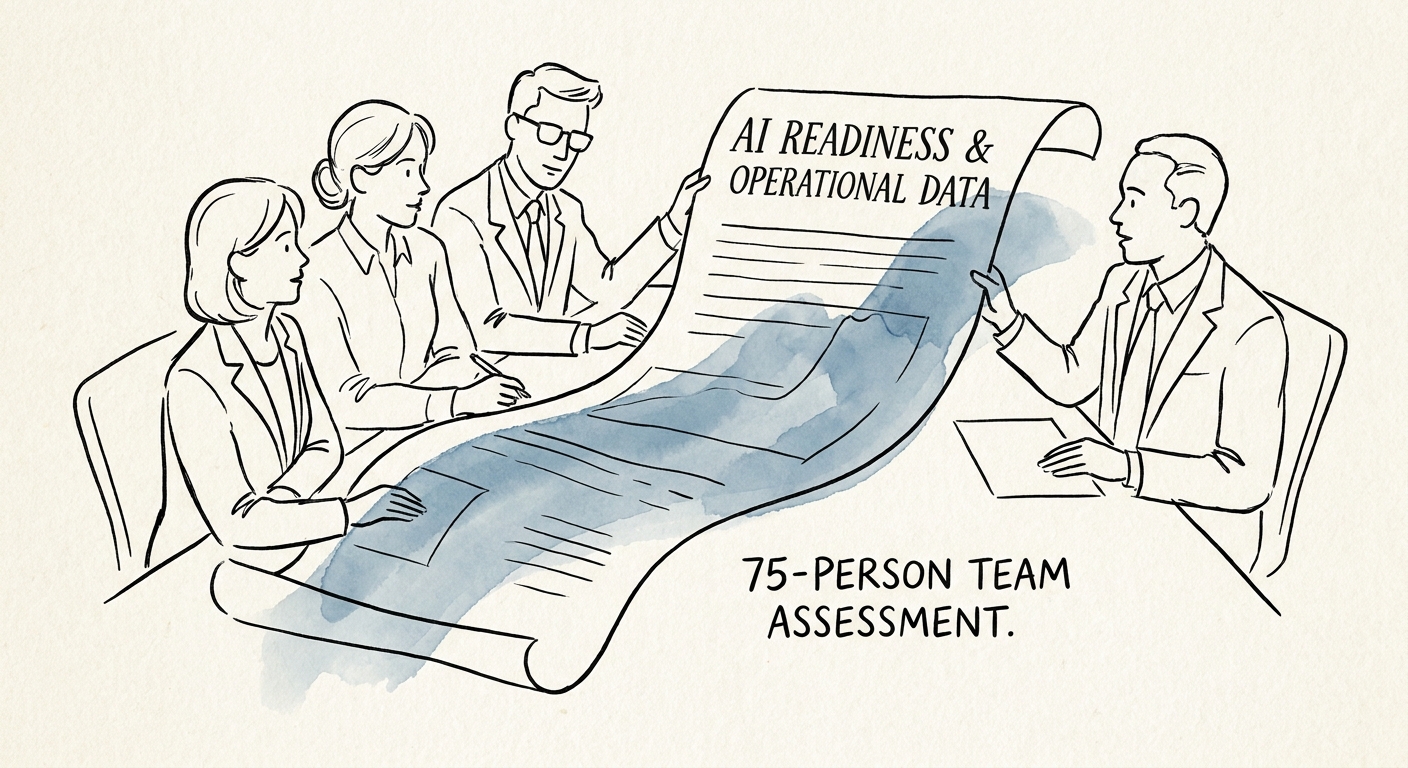
AI Readiness for a 75-Person Services Firm: Can It Survive Partner Sign-Off?
At 75 people, AI either lifts billable leverage or buries partners in review. Here's how to test which one before you roll a tool into client delivery.
8 readiness checks before the first production workflow
BRIEF · AI TRANSFORMATION STRATEGY
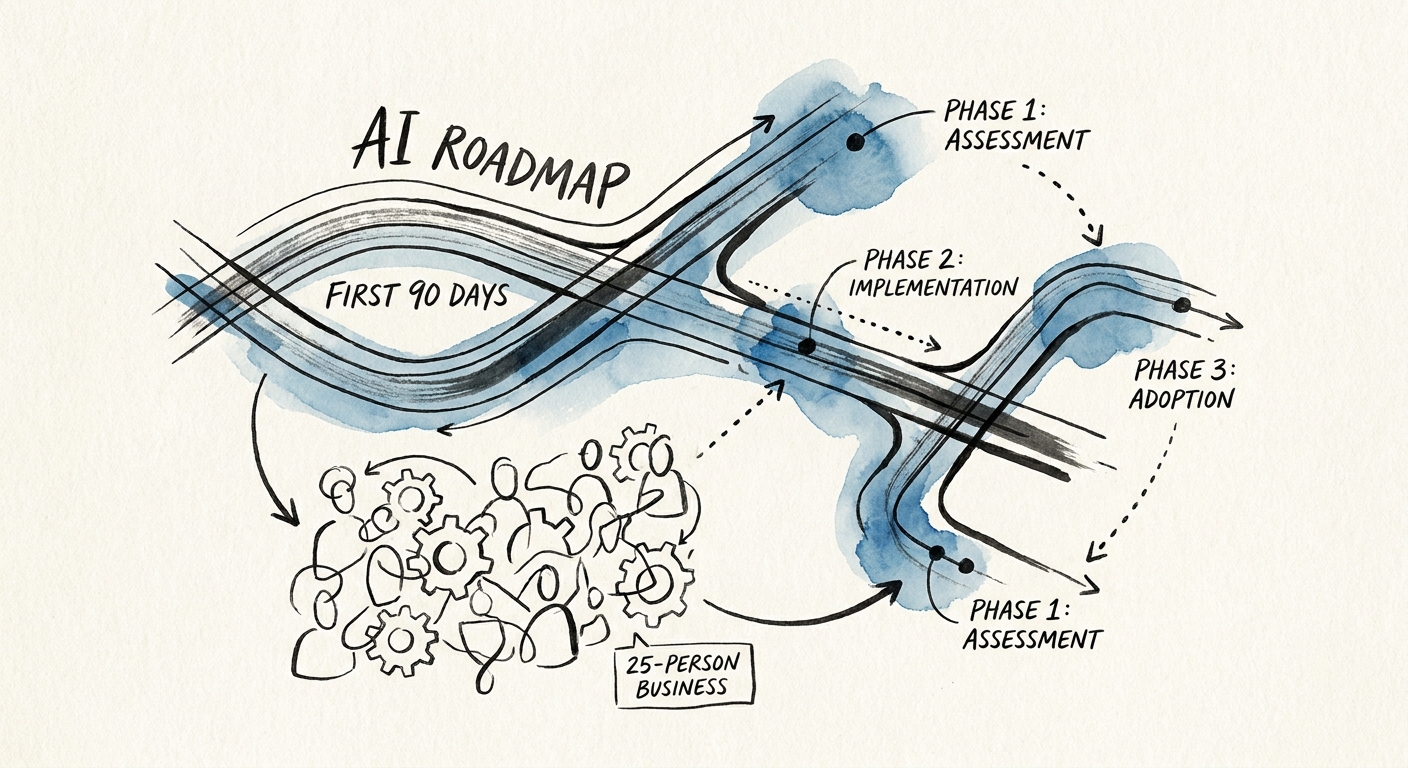
The 90-Day AI Roadmap for a 25-Person Business (Where the Owner Is the Bottleneck)
At 25 people there's no IT department and the owner signs off on everything. A 90-day AI plan to fix one workflow without leaking data or buying tool sprawl.
90 days to audit, pilot, and govern the first AI workflow
BRIEF · AI INDUSTRY USE CASES
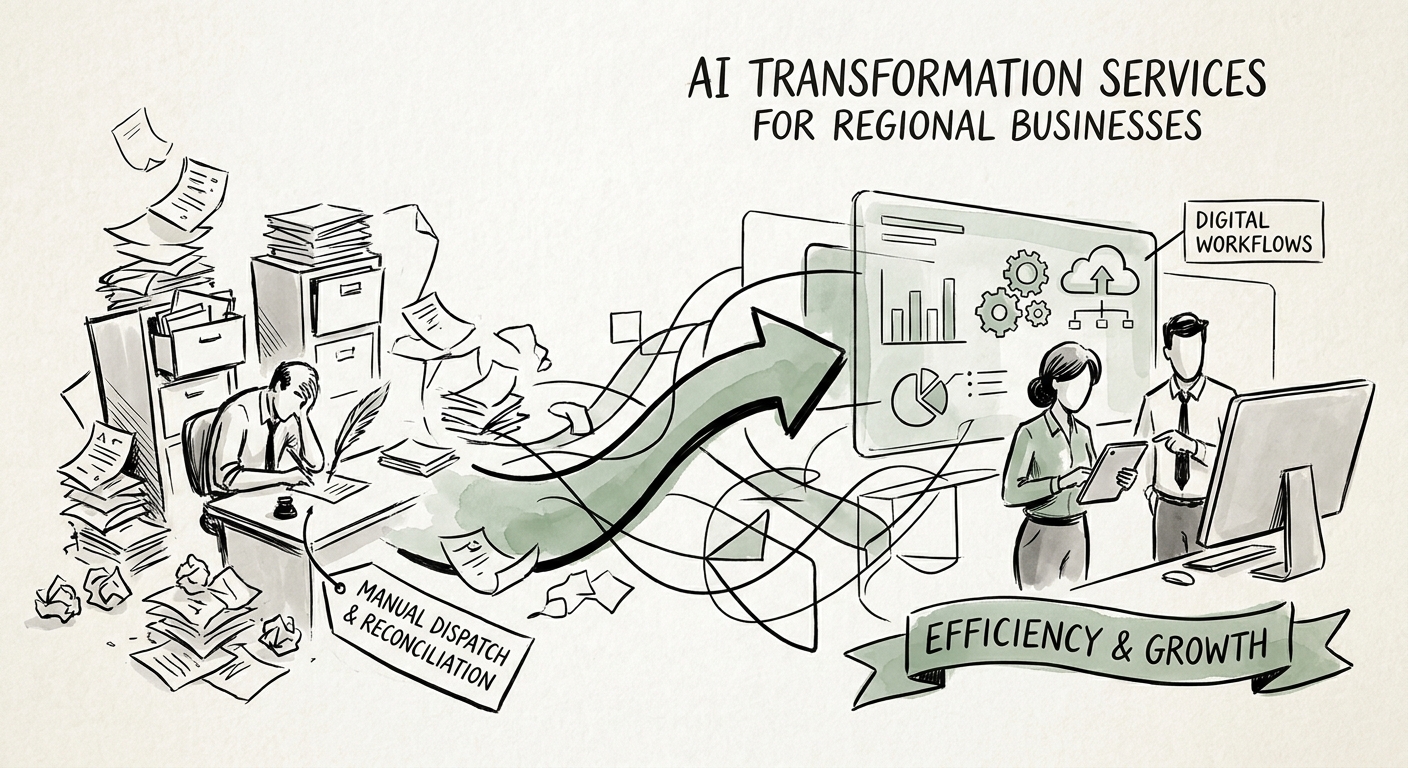
AI Transformation for Regional Businesses: Why the Second Location Breaks the Pilot
Your AI pilot worked at one branch. Then it hit the second location and fell apart. How regional operators pick the workflow, control the data, and scale across sites.
1 workflow to prove before scaling AI spend
BRIEF · AI INDUSTRY USE CASES
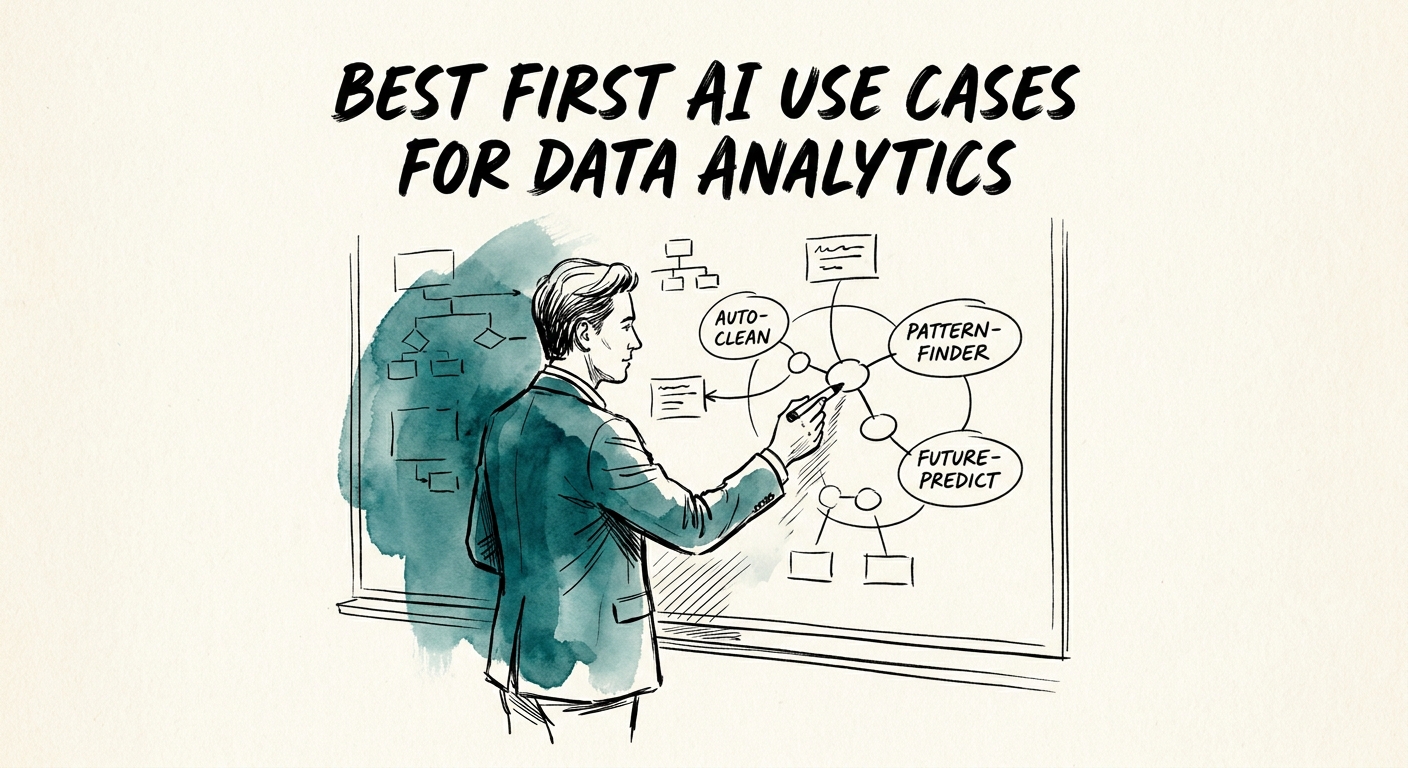
The First AI Use Case for an Analytics Consultancy Isn't Generating Insight — It's Catching the Wrong Number
Where data analytics consultancies should actually start with AI: metric-definition QA, dbt and dashboard review, and provenance you can trace — not auto-generated insight.
1 delivery workflow to prove before scaling AI
BRIEF · AI INDUSTRY USE CASES
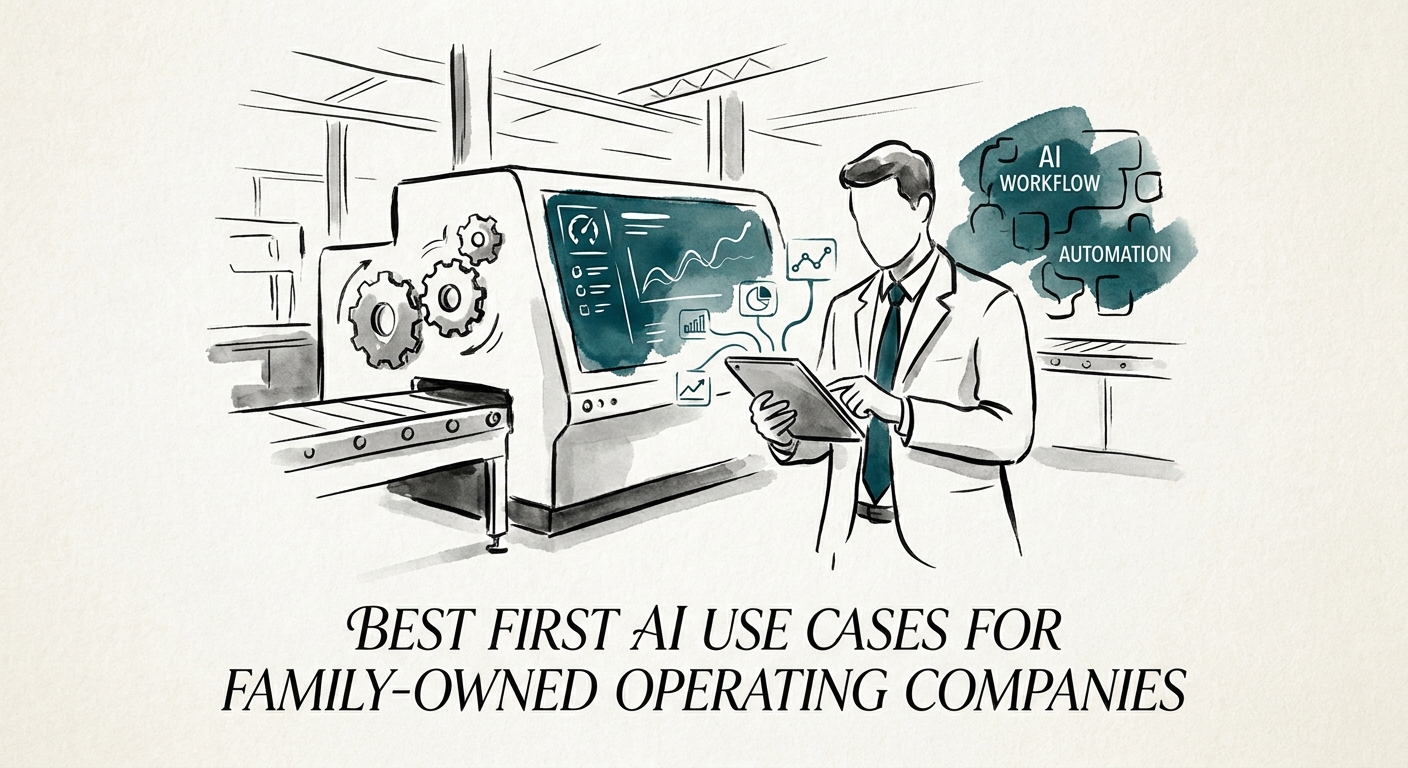
The First AI Use Case for a Family-Owned Company Is the One Nobody Wants to Touch
In a family-owned company, the best first AI use case isn't the flashiest one — it's the routine work locked in one person's head. Here's how to pick it.
1 workflow to prove before broad AI rollout
BRIEF · AI VENDOR AND BUILD-VS-BUY
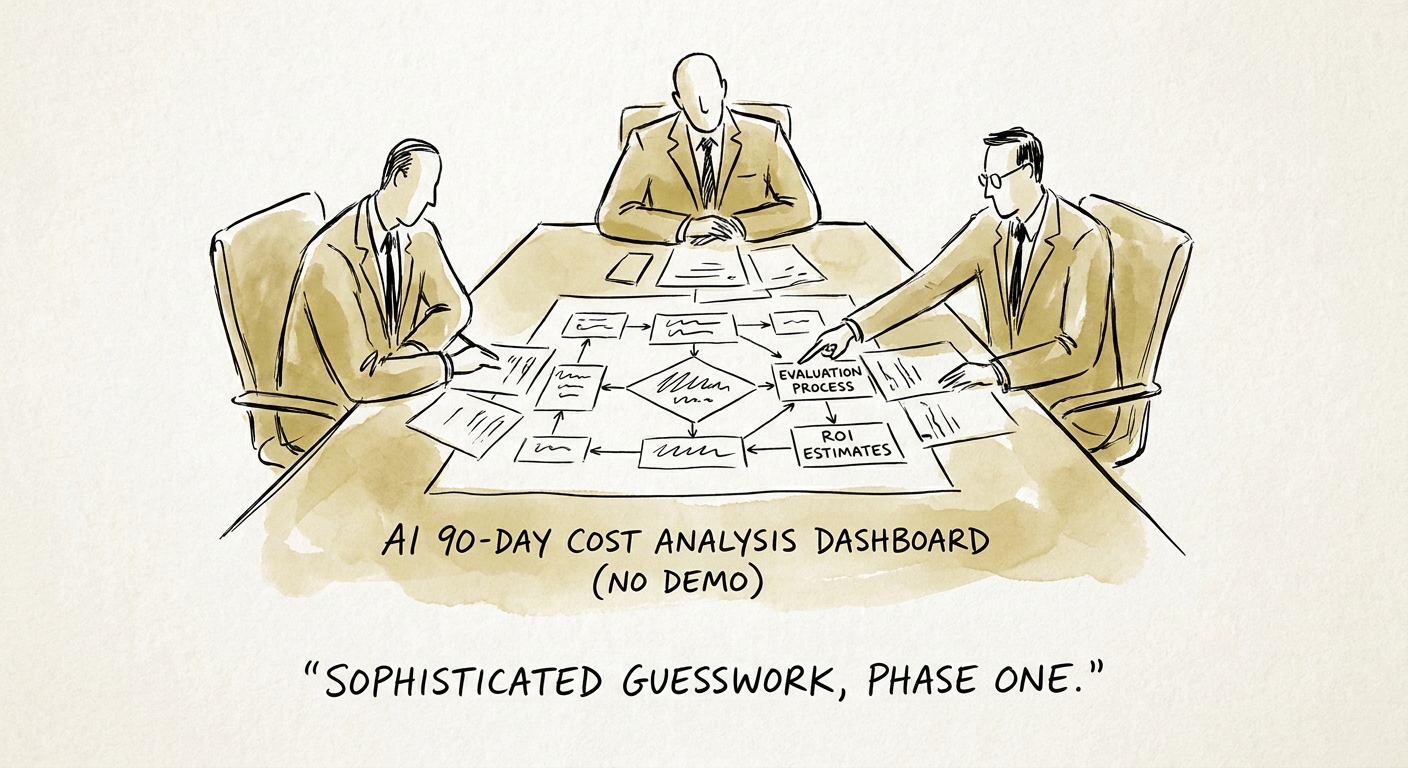
AI Implementation Cost: What the Demo Doesn't Show You
The demo shows you the license fee. The real AI implementation cost lives in data cleanup, permissions, review capacity, and adoption. Here's how to price it.
5 cost categories to price before a demo
BRIEF · AI VENDOR AND BUILD-VS-BUY
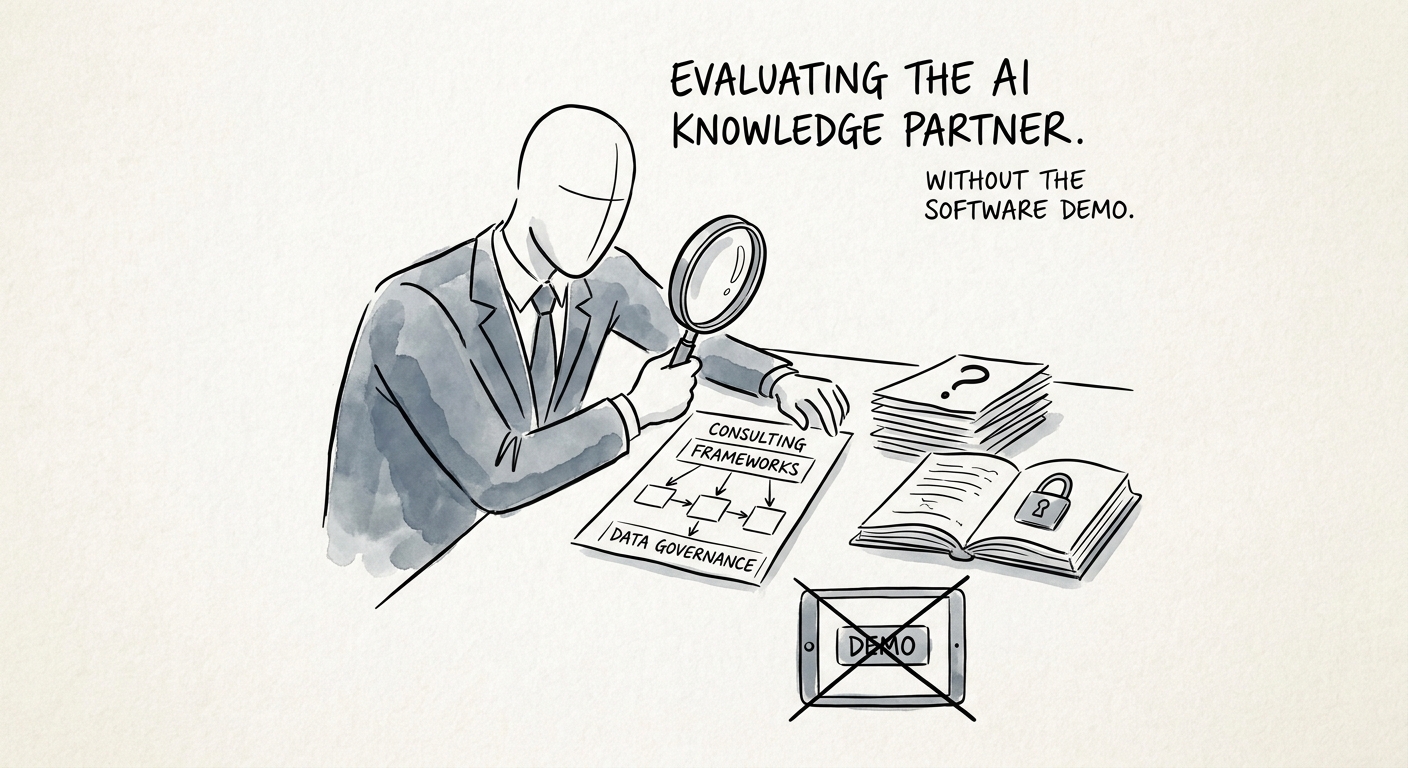
How to Vet an AI Knowledge Assistant Consultant Before You Buy the Demo
A professional services buyer's guide to evaluating AI knowledge assistant consultants: how to test for stale sources, permission leaks, and answers your firm can trust.
6 questions to ask before approving a knowledge assistant demo
BRIEF · AI VENDOR AND BUILD-VS-BUY
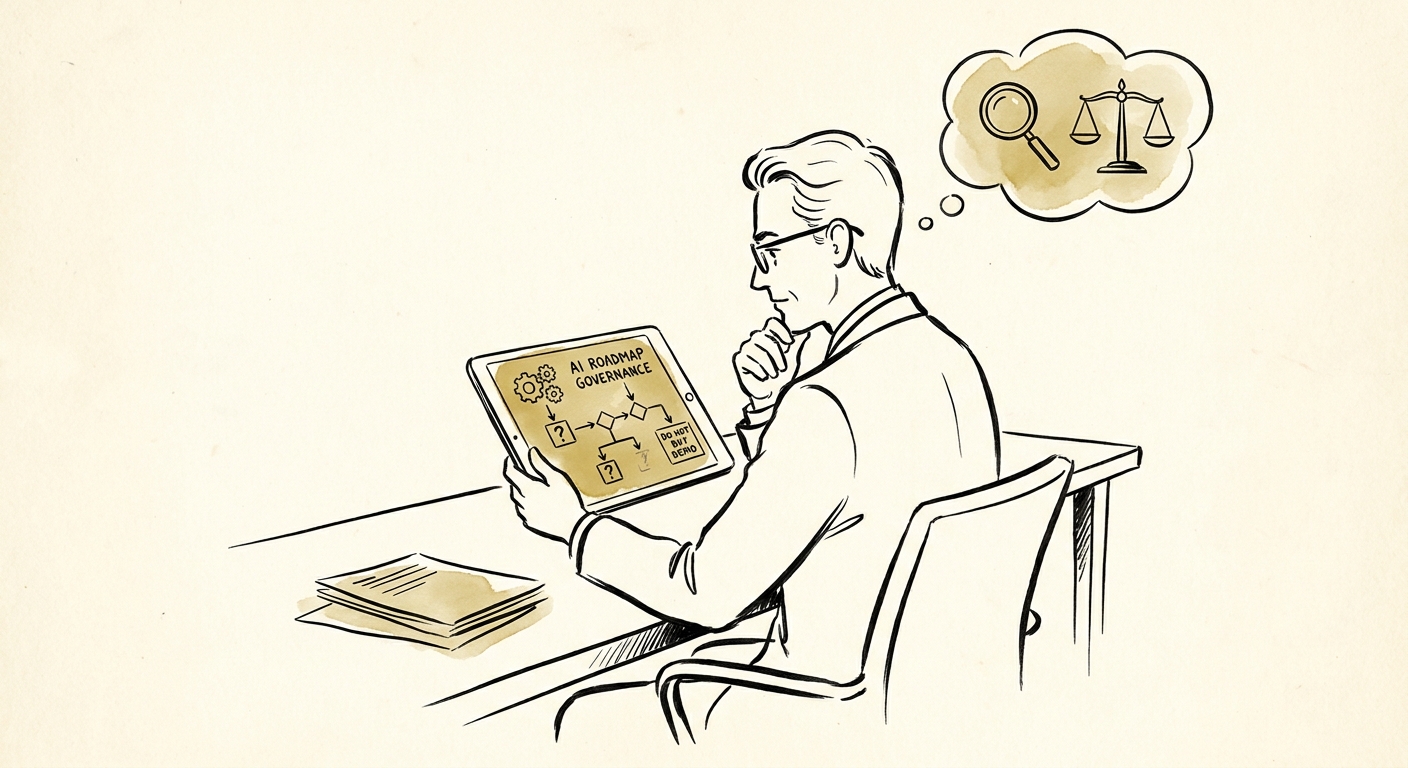
How to Tell an AI Roadmap Consultant From a Slide Deck With a Login Screen
Most AI roadmaps are 40 slides of phases that never reach a real workflow. Five questions that separate an operating plan from a tool tour for SMB and mid-market buyers.
6 roadmap proof points to request before a demo
BRIEF · AI MEASUREMENT AND ROI
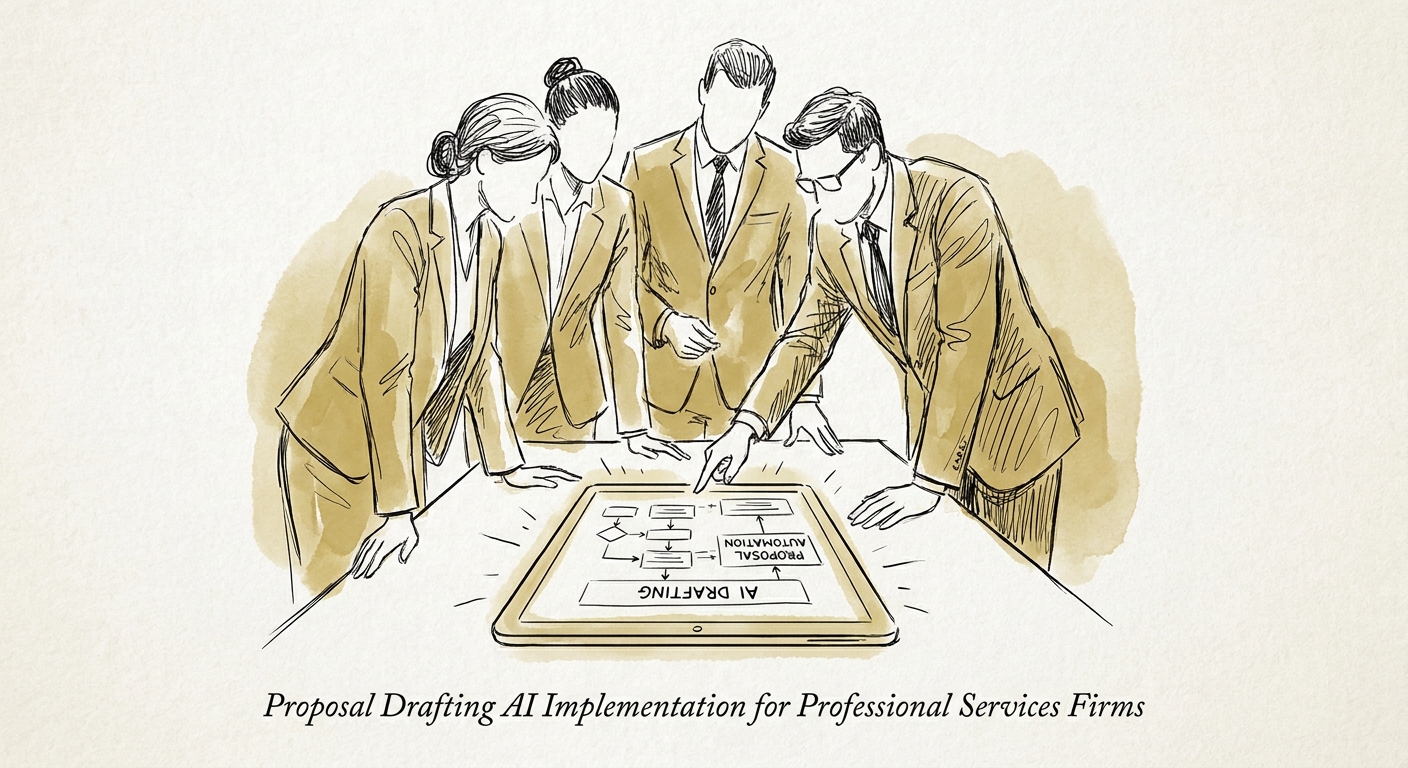
AI for Proposal Drafting: Make the First Draft, Not the Final Promise
How professional services firms use AI to draft RFP responses and proposals faster without letting it invent client claims, scope, or pricing.
3 proposal controls before AI drafting scales
BRIEF · AI FUNCTION USE CASES
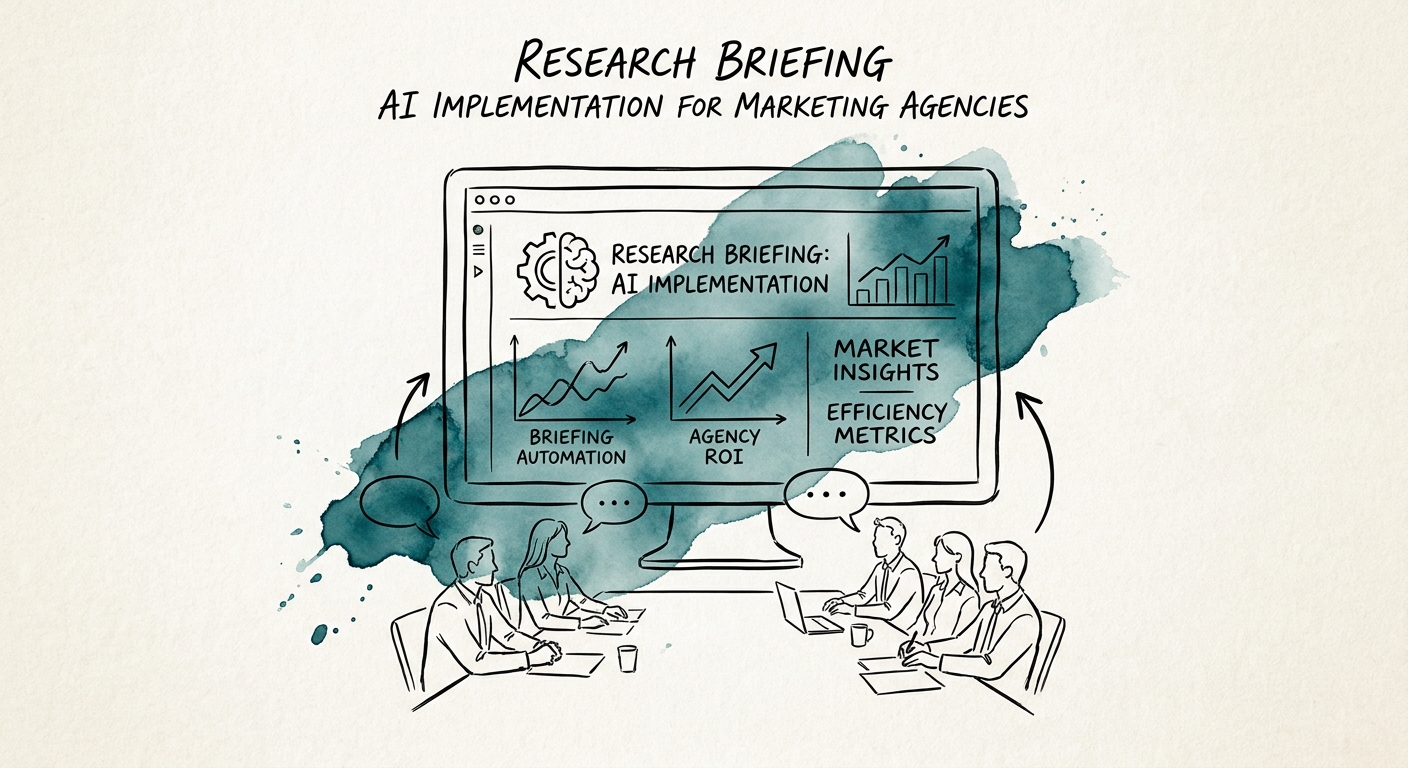
AI Research Briefings for Agencies: Compress the Prep, Protect the Strategy
A practical playbook for agencies using AI to build research briefs faster, without letting it flatten strategy, leak client context, or burn delivery margin.
1 briefing workflow to prove before broader agency AI
BRIEF · AI MEASUREMENT AND ROI
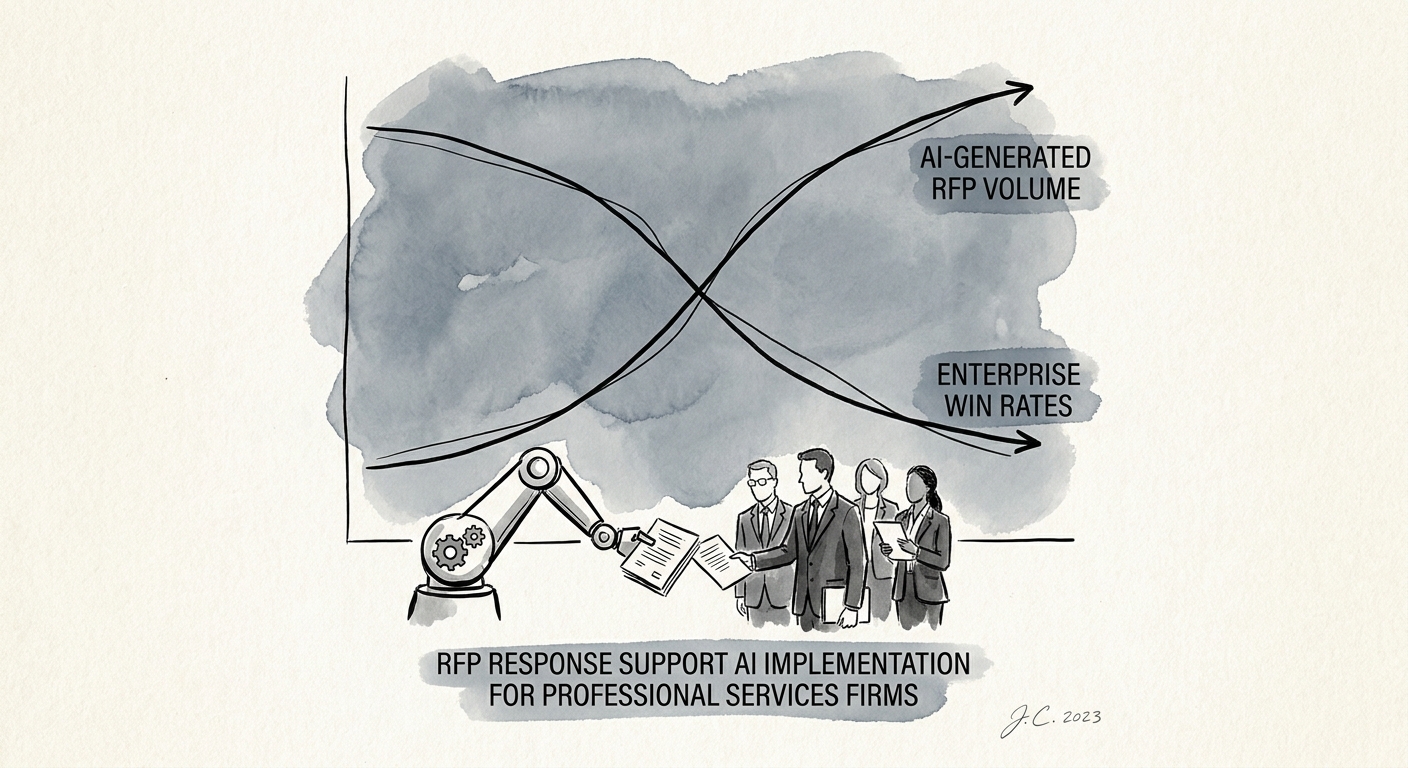
AI for RFP Responses: Win More Bids, Not Just Faster Drafts
A professional services firm's playbook for using AI on RFP responses: assemble evidence fast, protect win strategy, and keep partner sign-off on every claim.
3 review gates before AI-assisted RFP responses leave the firm
BRIEF · AI FUNCTION USE CASES
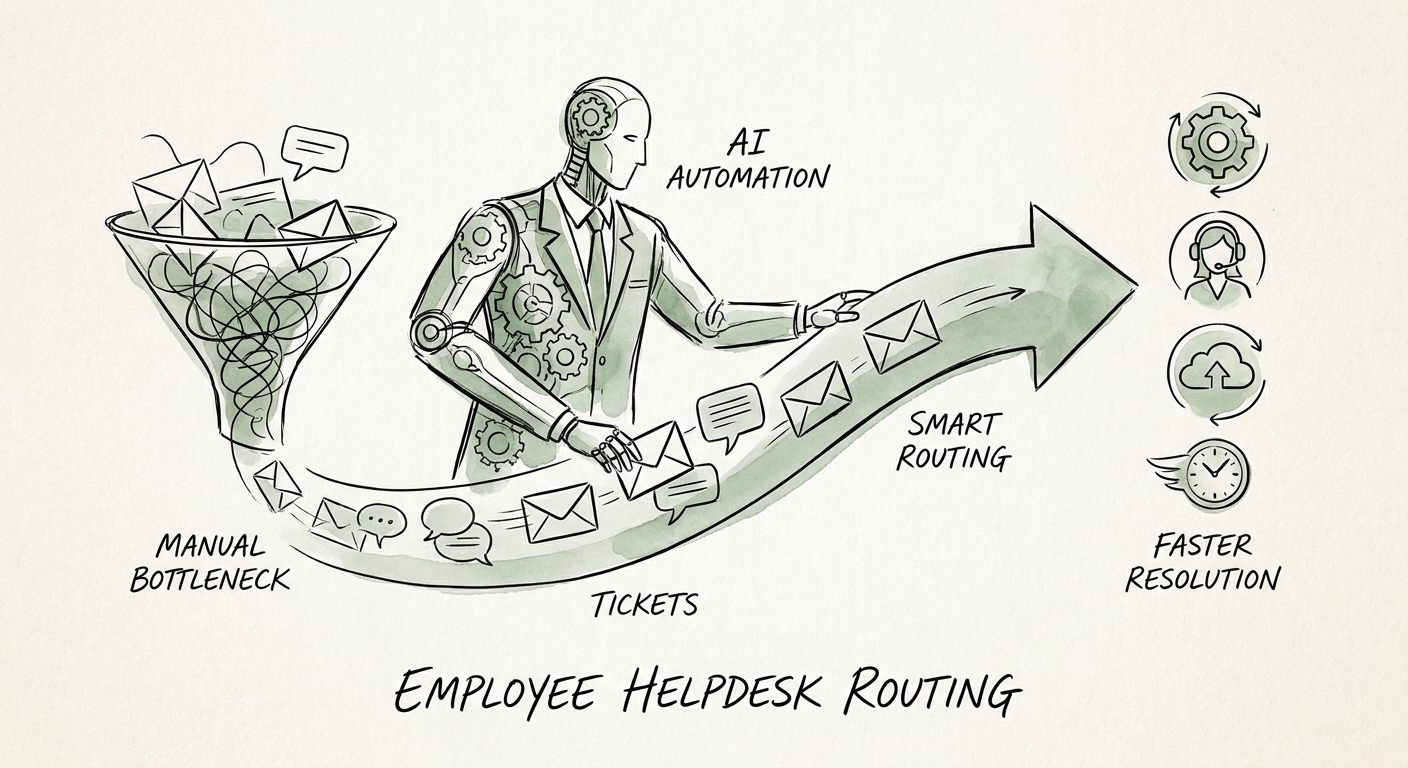
Start AI With Employee Helpdesk Routing, Not Your Whole Support Stack
The internal helpdesk is the safest first AI use case: route password resets fast, flag the HR-sensitive tickets, and never auto-close what a human owns.
1 routing workflow to prove before broader support automation
BRIEF · AI FUNCTION USE CASES
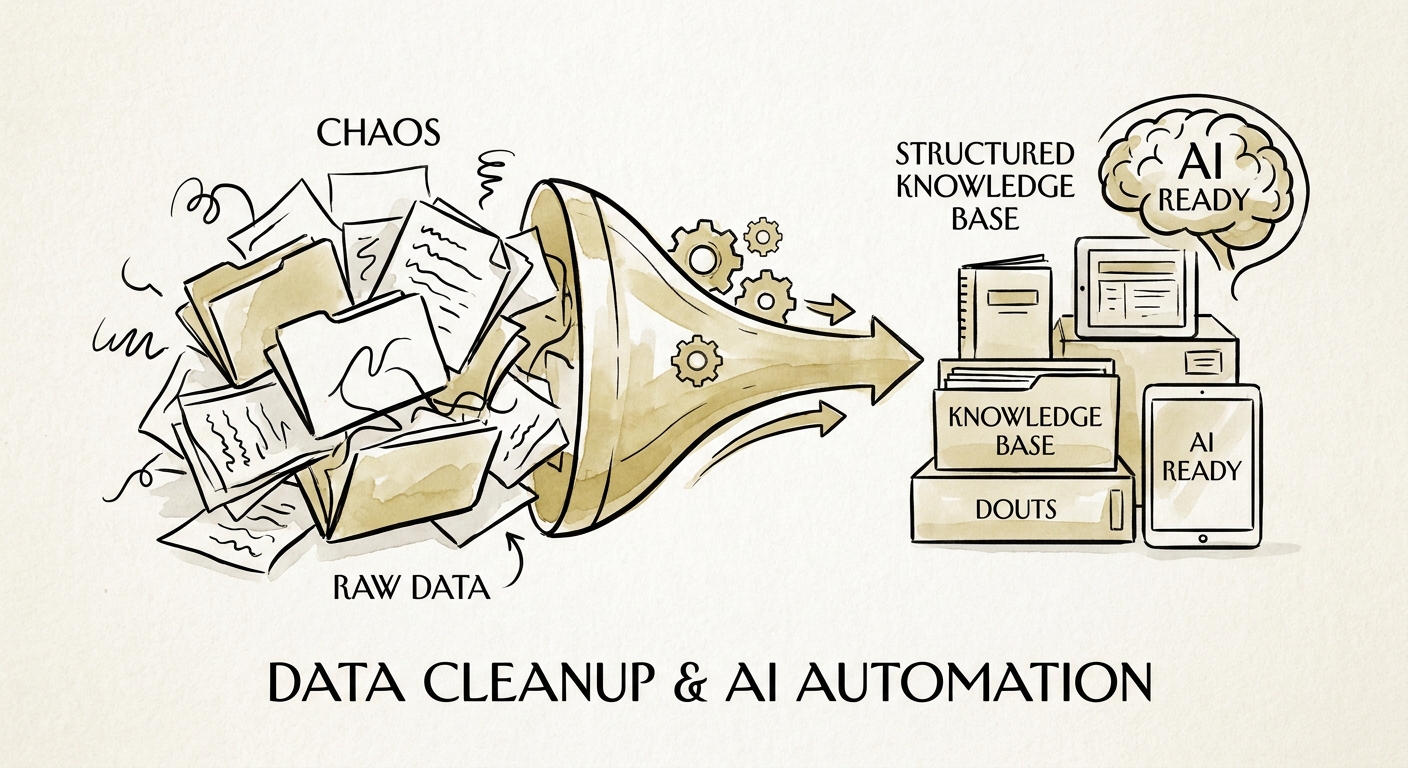
Before You Buy an AI Knowledge Assistant, Clean the Library It Reads
An AI knowledge assistant confidently quotes your stale policy from 2022. Here is the data cleanup work professional services teams should automate first.
4 cleanup checks before AI knowledge retrieval
BRIEF · AI FUNCTION USE CASES
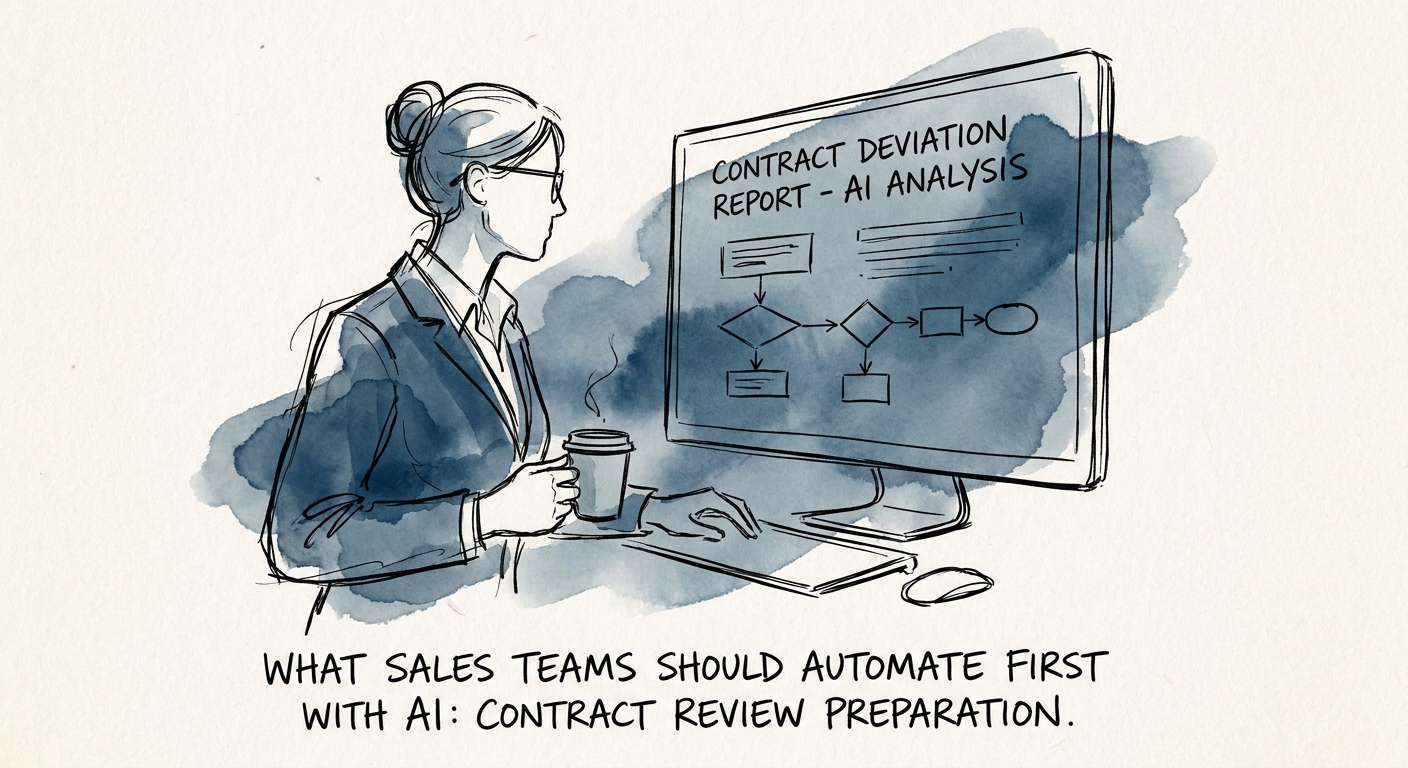
The First AI Win for Sales Teams Isn't Closing Deals. It's the Contract Handoff to Legal.
The redline that sits 6 days because legal got a half-built packet is your best first AI use case. How sales teams automate contract review prep without touching legal judgment.
1 contract-prep workflow to automate before expanding sales AI
BRIEF · AI GOVERNANCE AND TRAINING
Internal Knowledge Search With AI: The Test Before You Build It
If two senior people answer the same internal question two different ways, AI search won't fix it — it'll scale the wrong answer. Here's the test to run first.
4 readiness gaps that should pause knowledge-search automation
BRIEF · AI GOVERNANCE AND TRAINING
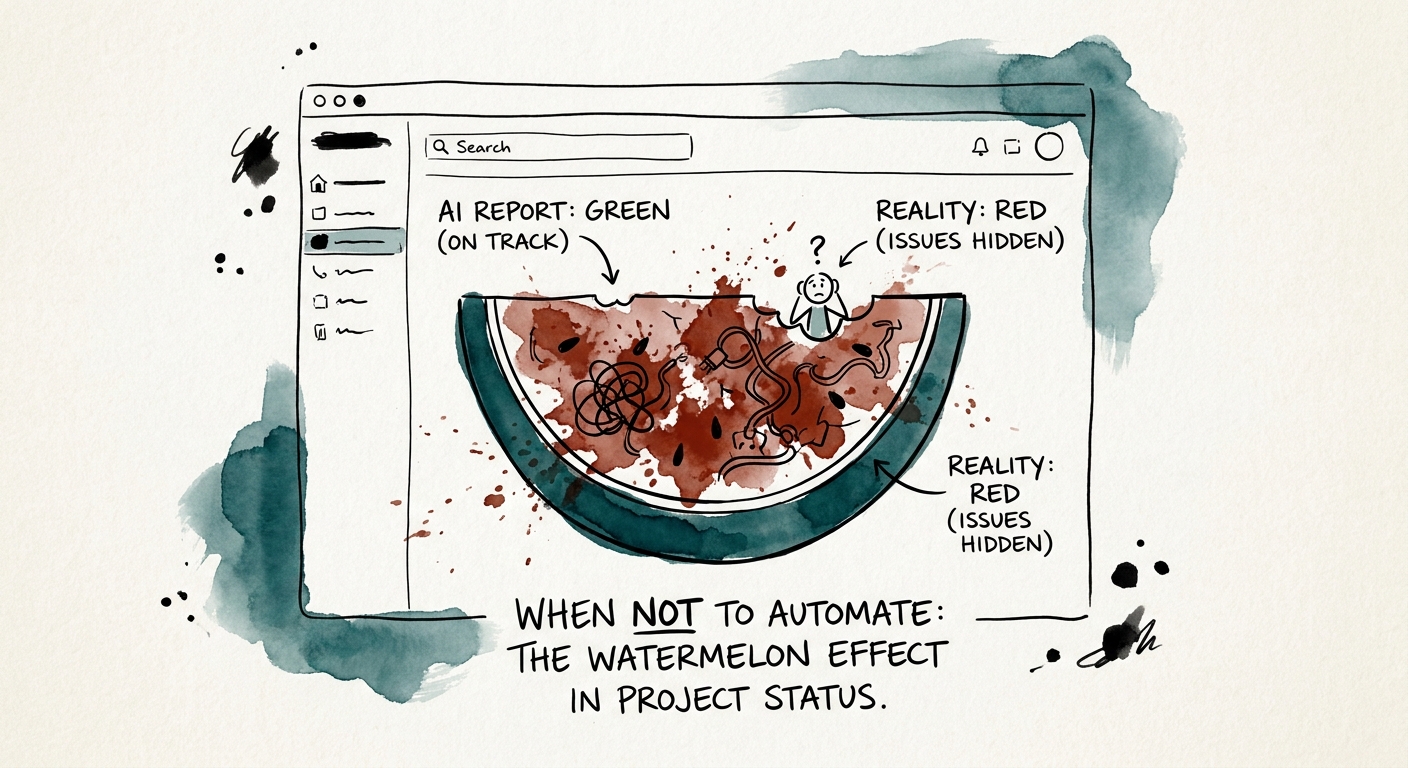
When Not to Automate Project Status Reports (The "Green-Until-It-Isn't" Problem)
A status report stays green until the week it goes red. Why AI status reporting fails in services firms when milestones, risk logs, and owners disagree.
4 status-reporting gaps to fix before automation
BRIEF · AI KNOWLEDGE SYSTEMS
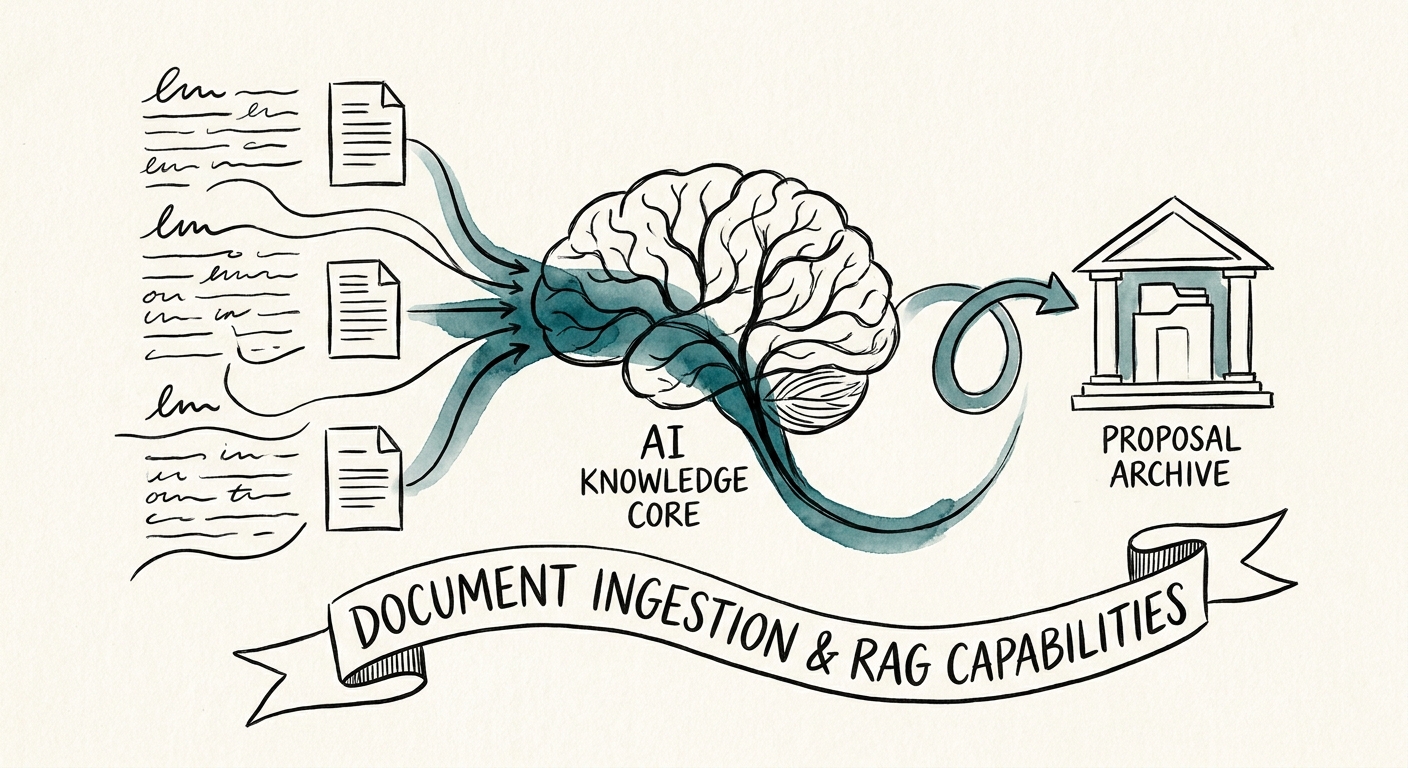
Your Proposal Archive Is a Liability Until You Tag It: AI Search for Professional Services Firms
Most firms' proposal folders are a graveyard of stale pricing and confidential scopes. Here's how to make yours safely searchable by AI before you let it draft.
4 archive controls before AI search launch
BRIEF · AI TRANSFORMATION STRATEGY
The 25-Person Agency's AI Readiness Test: Can You Name the Brand Book Before You Buy the Tool?
A 25-person agency runs faster on AI when you fix briefs and brand boundaries first. The six workflow checks to run before you approve a single tool.
6 agency workflow checks before AI rollout
BRIEF · AI TRANSFORMATION STRATEGY
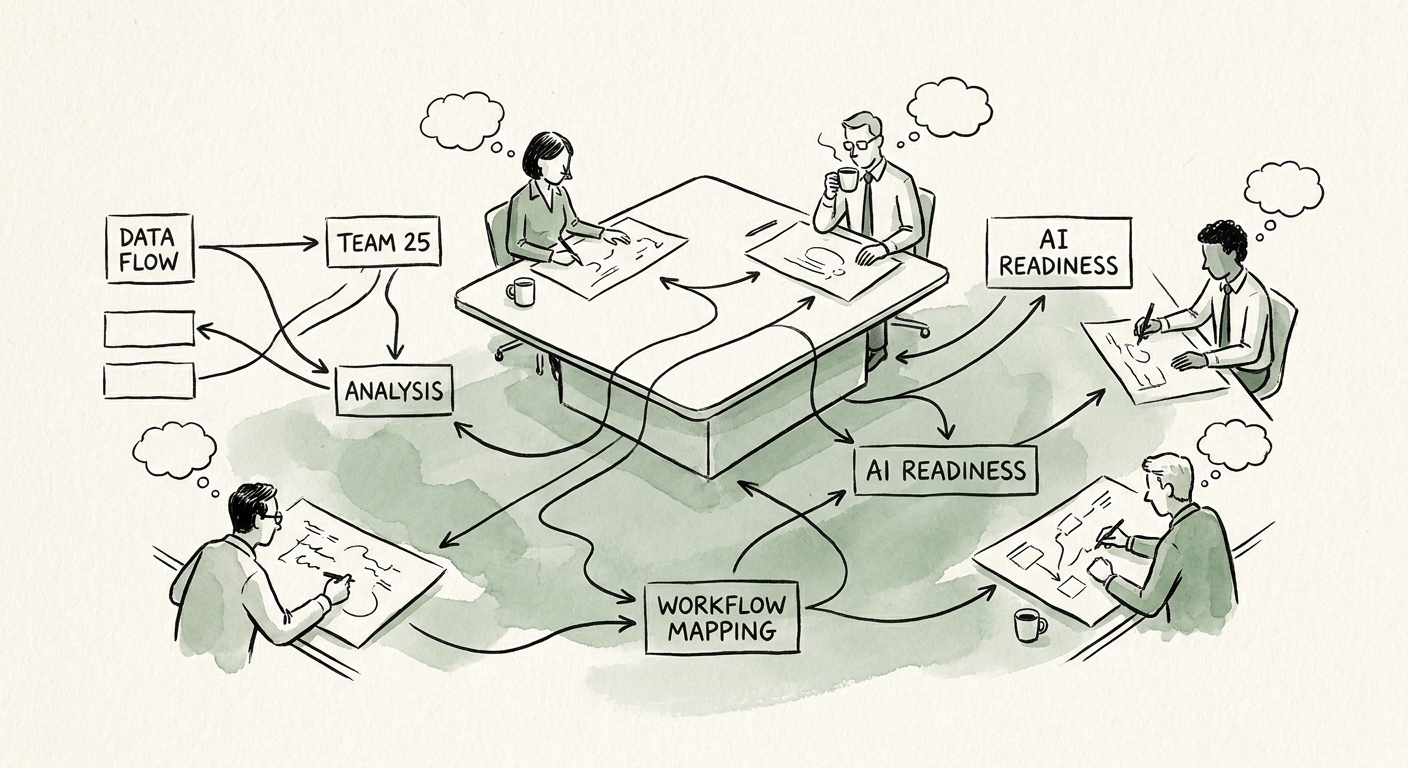
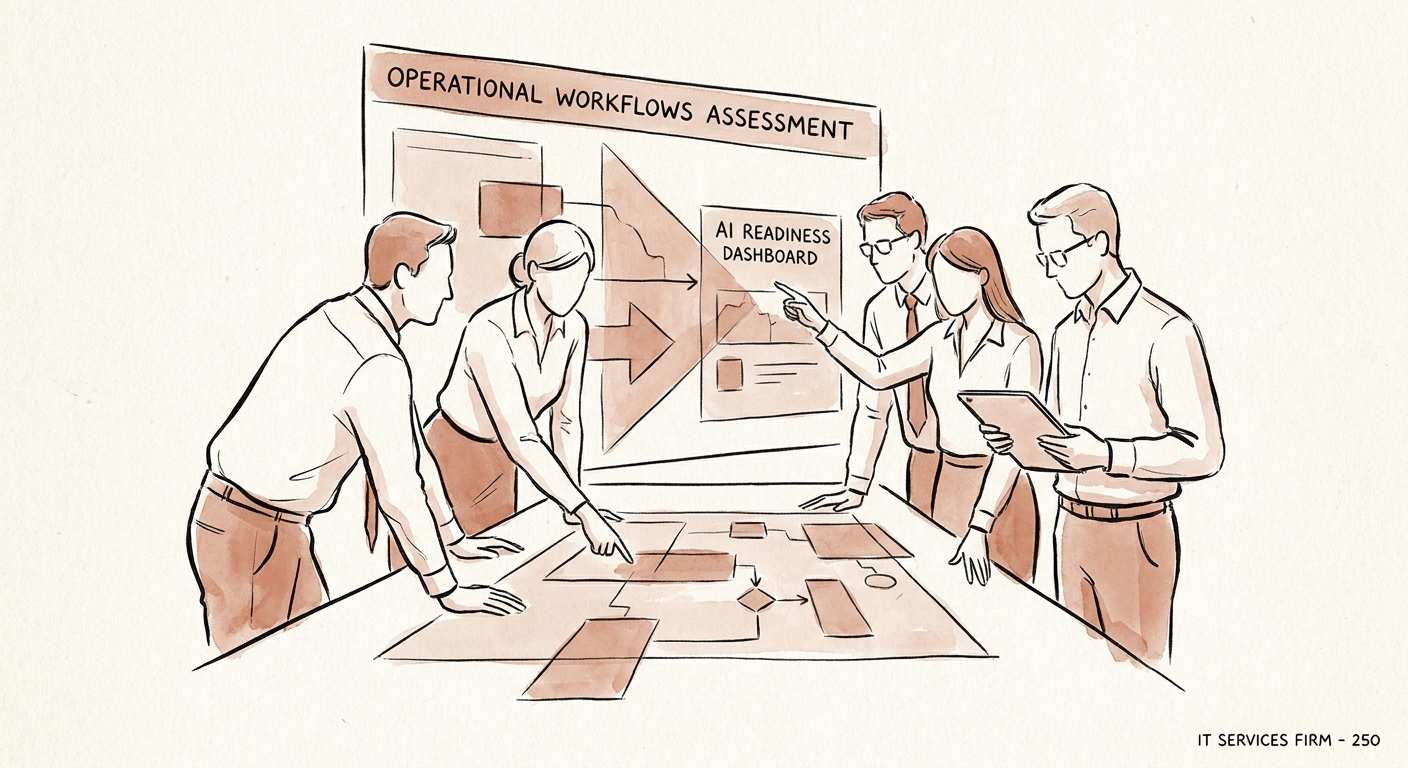
The AI Readiness Question for a 250-Person IT Services Firm: How Many Versions of "Our AI Process" Already Exist?
At 250 people, the AI risk isn't doing nothing — it's seven delivery pods each running their own ungoverned tools. Here's how to assess and consolidate.
3 operating layers to align before scaling AI
BRIEF · AI TRANSFORMATION STRATEGY
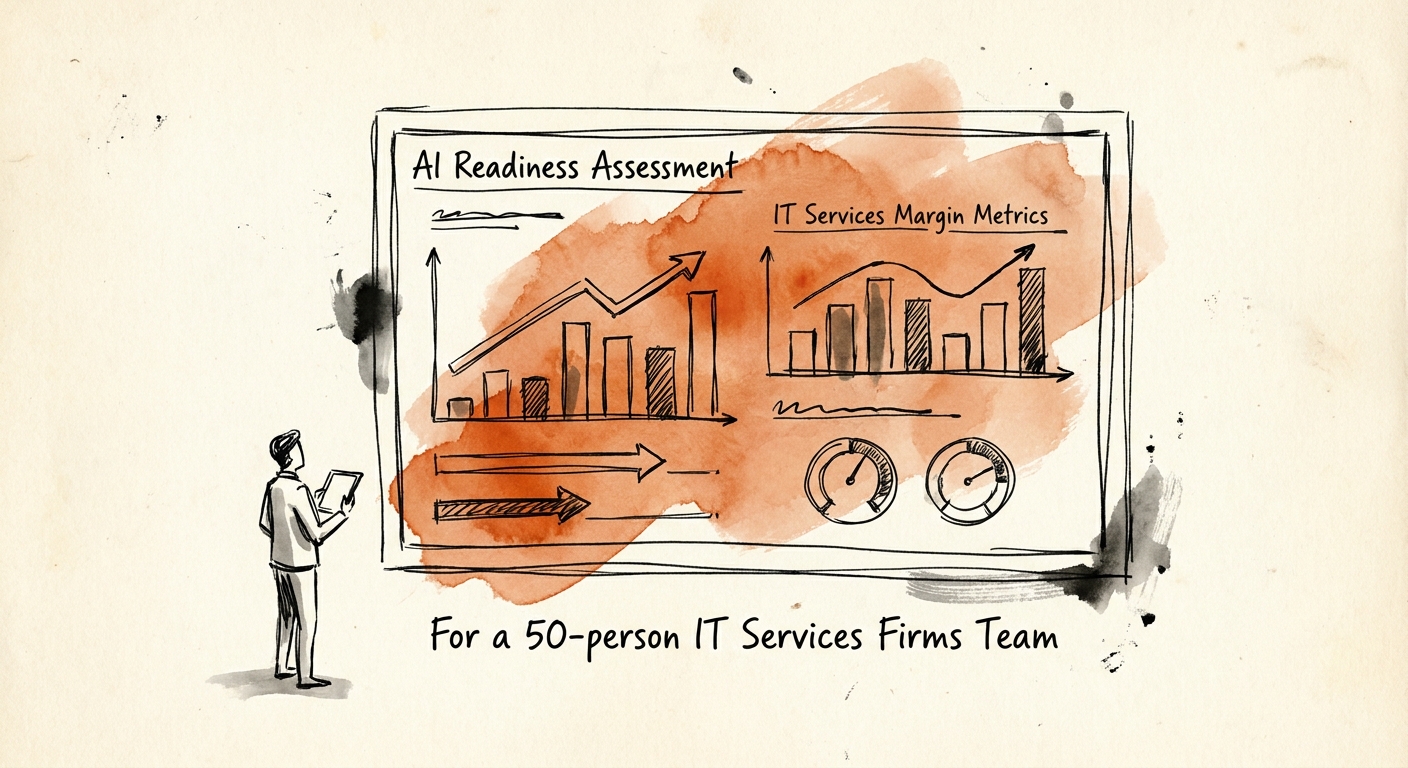
AI Readiness for a 50-Person IT Services Firm: Can Your Tickets Survive a Senior Engineer's Vacation?
At 50 people, your AI readiness is decided by how much delivery knowledge lives in tickets versus three senior engineers' heads. Here's how to test it.
8 readiness dimensions for first AI workflow approval