BRIEF · AI GOVERNANCE AND TRAINING
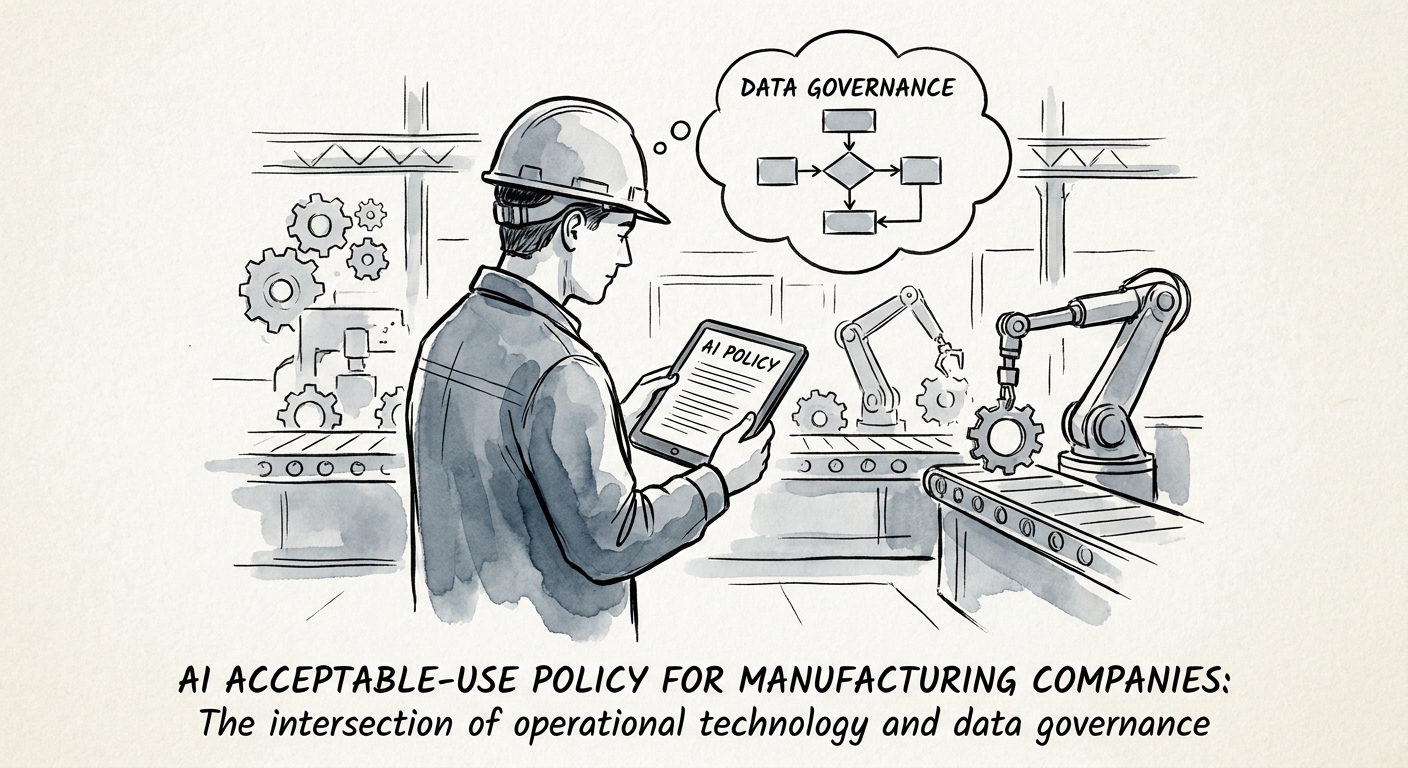
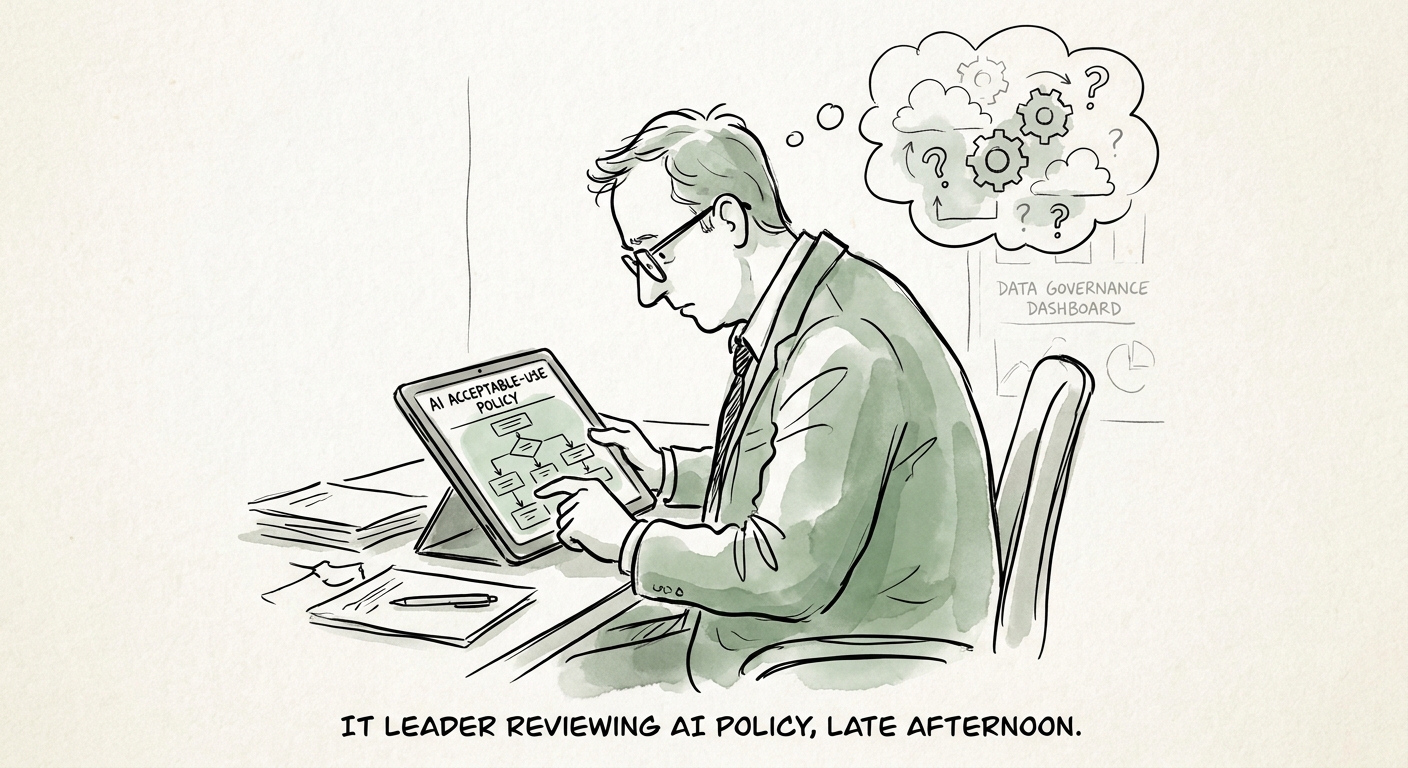
An AI Acceptable-Use Policy That Survives Contact With the Plant Floor
A manufacturing AI use policy that draws one line: a chatbot can draft an SOP, but it can never approve a torque spec or a supplier price. Here's how.
3 governance rules before broad workflow automation
BRIEF · AI GOVERNANCE AND TRAINING
The AI Policy Your Agency Needs Before a Junior Copywriter Pastes a Client's Roadmap Into ChatGPT
A marketing agency AI policy built around the real risk: client strategy, audience exports, and unpublished creative leaking into unapproved tools.
3 governance rules before broad workflow automation
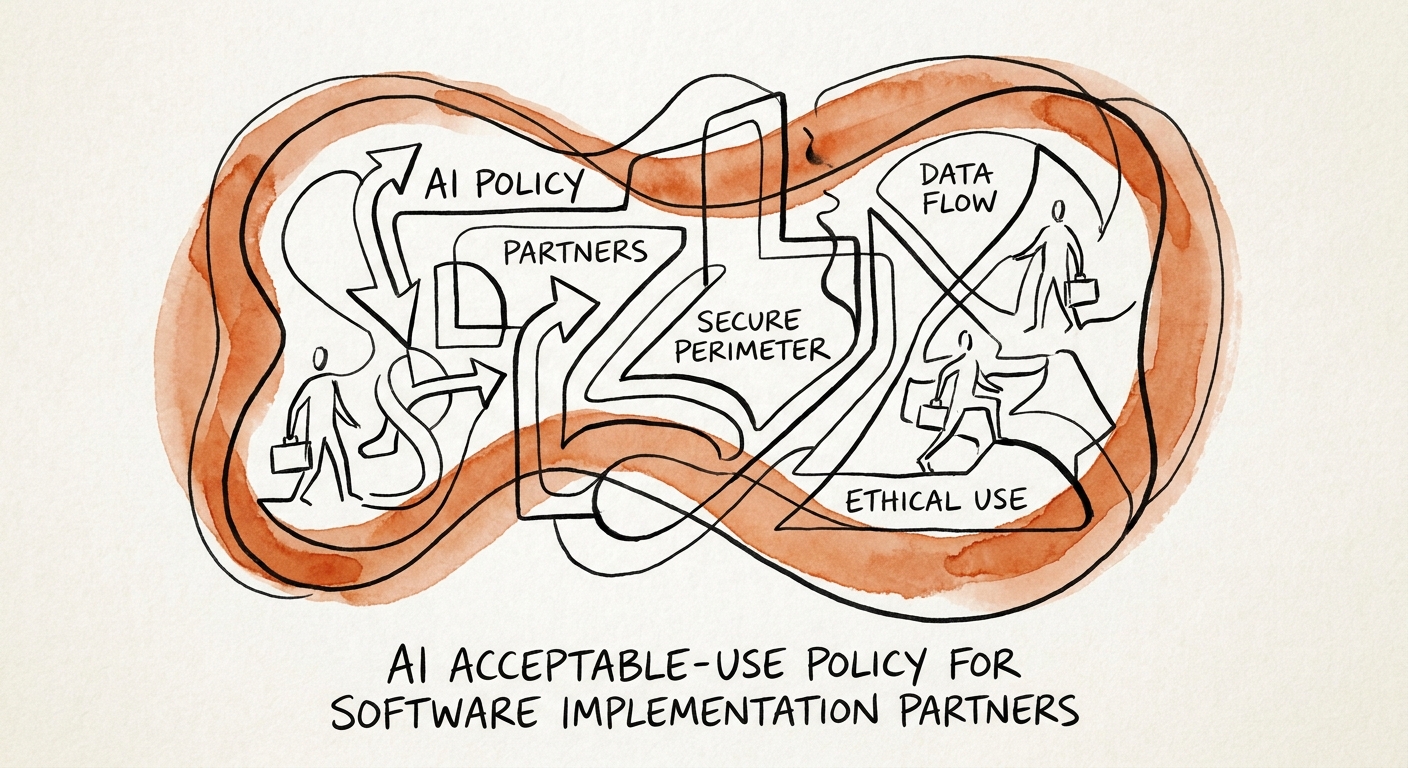
BRIEF · AI GOVERNANCE AND TRAINING
The AI Policy Every Software Implementation Partner Needs (Because You Live in Other People's Systems)
You hold clients' tenant configs, SOWs, and integration maps. Here's an AI acceptable-use policy that keeps that evidence out of unmanaged tools.
3 governance rules before broad workflow automation
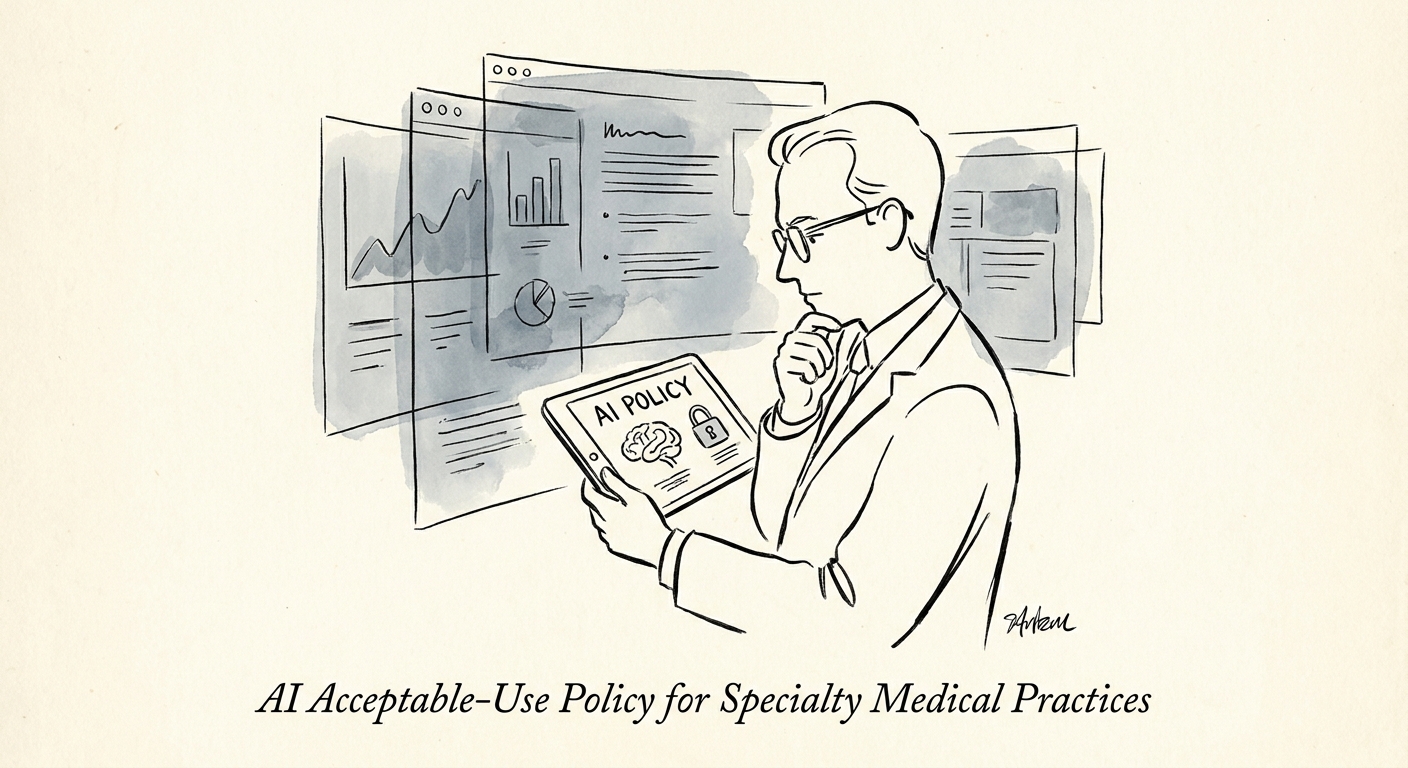
BRIEF · AI GOVERNANCE AND TRAINING
The AI Policy a Specialty Practice Actually Needs (Hint: It's About the Front Desk, Not the Exam Room)
A specialty practice's real AI risk isn't diagnosis—it's a referral packet pasted into a chatbot. Here's the one-page policy that fits a 20-person office.
3 governance rules before broad workflow automation
BRIEF · AI WORKFLOW AUTOMATION
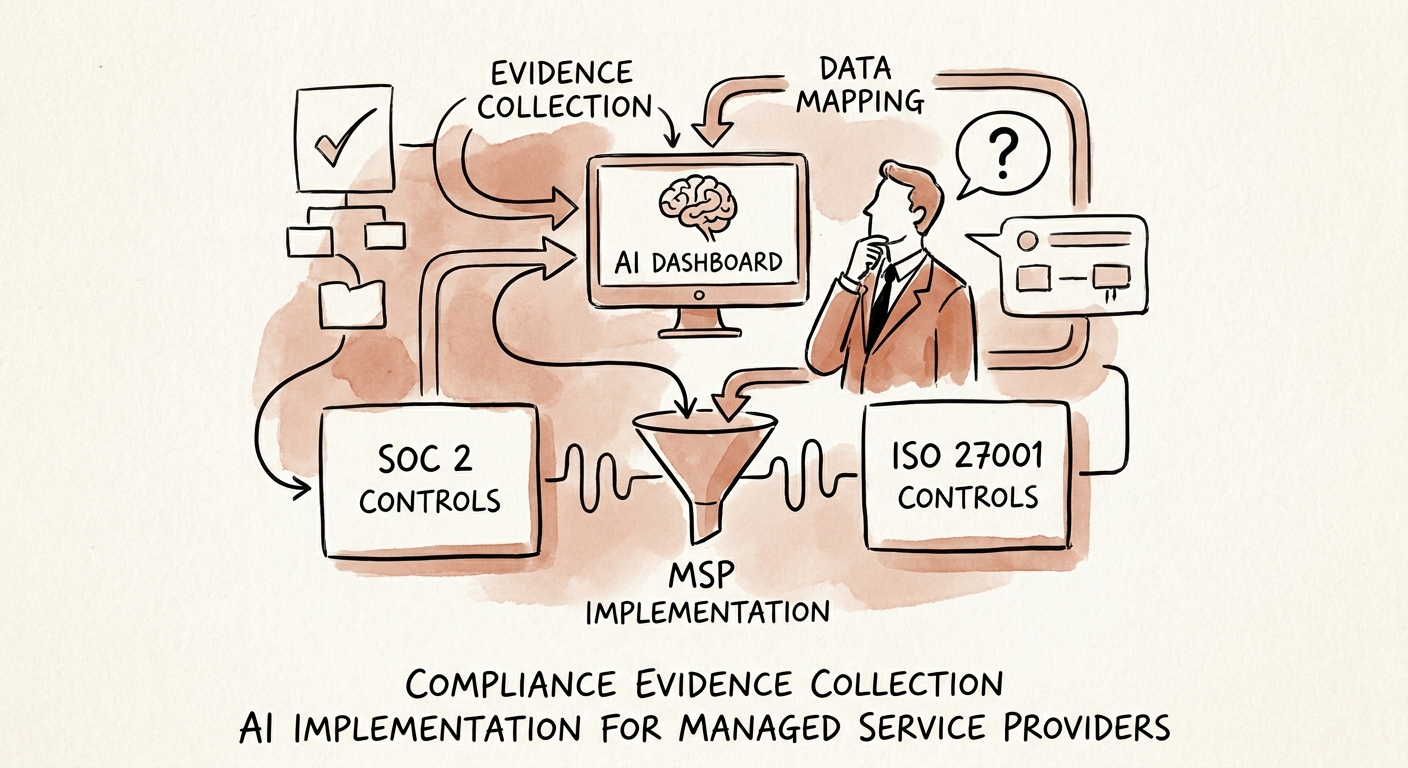
The MSP Audit Scramble: Using Governed AI to Collect Compliance Evidence
MSPs get audited constantly. Here's how to point governed AI at your tickets, access reviews, and change logs to pull SOC 2 evidence without leaking client data.
1 governed source library before automation
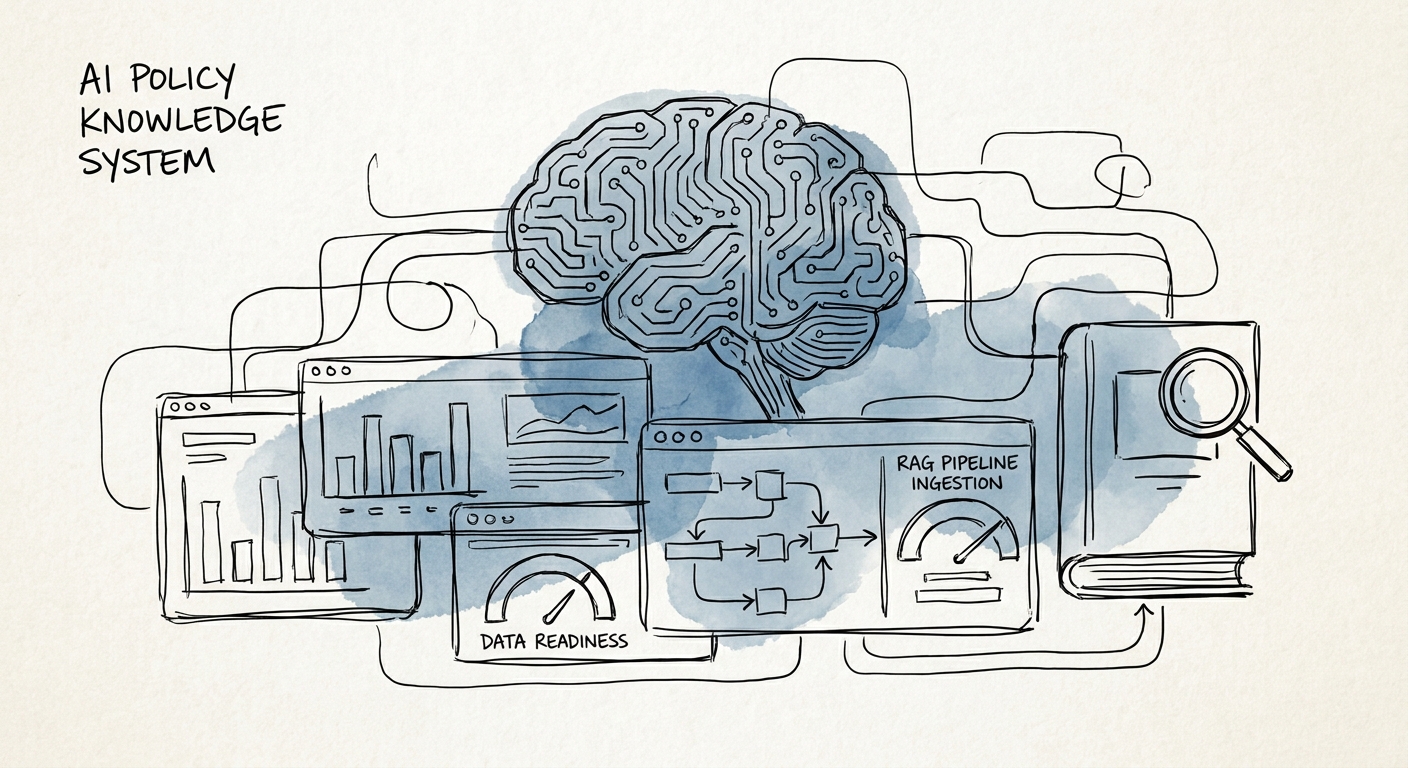
BRIEF · AI KNOWLEDGE SYSTEMS
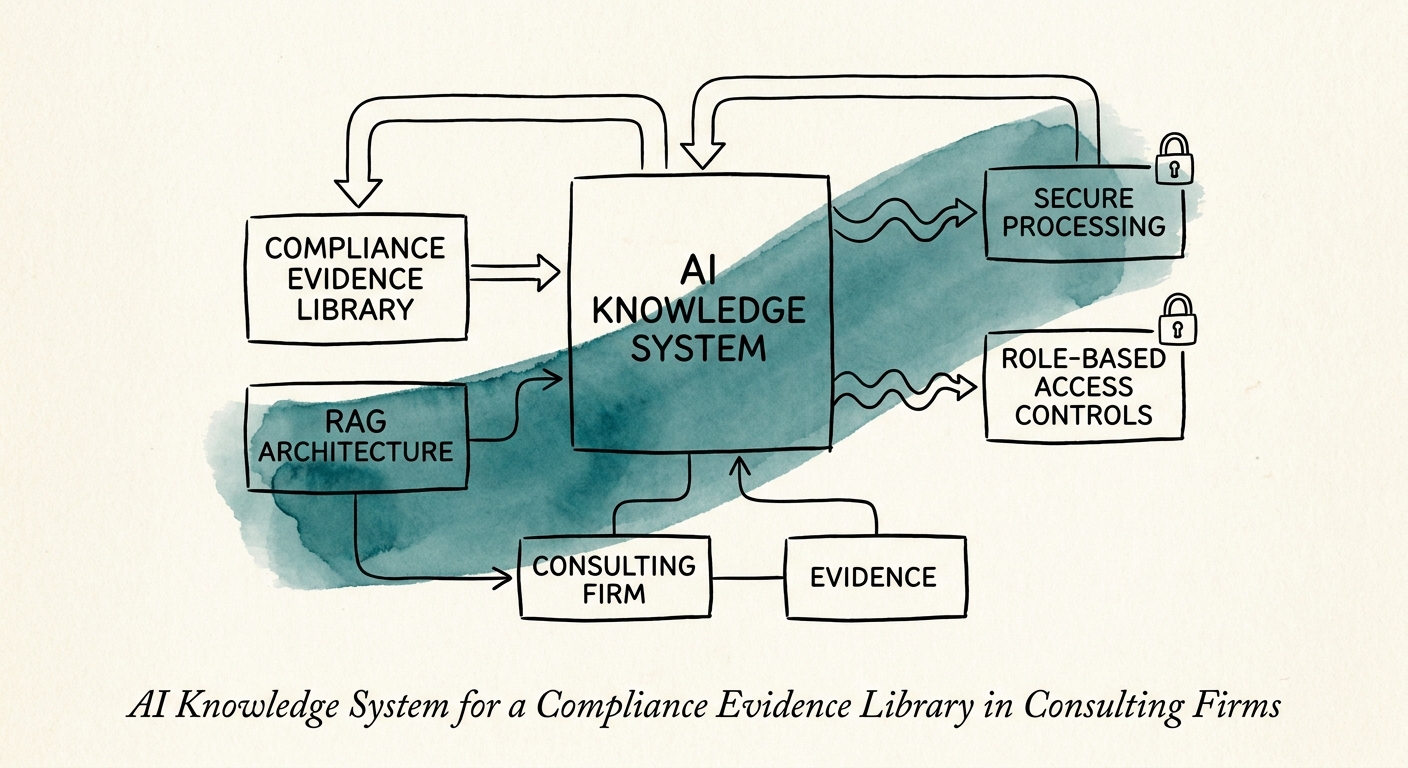
Your Evidence Library Is the Real Product: Building a Governed AI Layer for Consulting Compliance
When a client's auditor wants your SOC 2 evidence, a consulting firm has hours, not days. How to build a governed AI knowledge layer over your evidence library without leaking confidential material.
1 governed source library before automation
BRIEF · AI KNOWLEDGE SYSTEMS
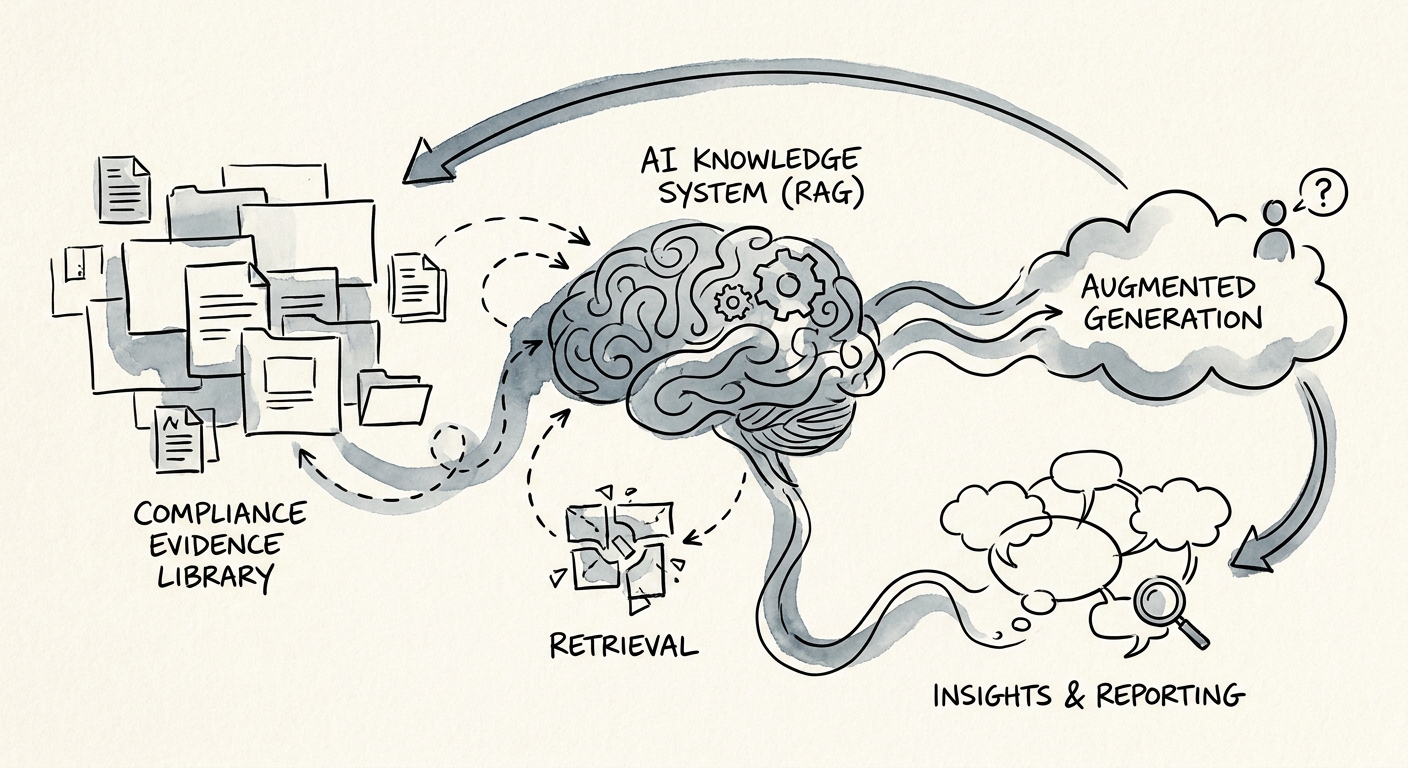
Compliance Evidence on Demand: An AI Knowledge System Your Auditor Can Actually Trust
When a client or auditor asks "show me the evidence," a governed AI knowledge system finds it from approved sources and proves who reviewed it. Here's how to build one.
1 governed source library before automation
BRIEF · AI KNOWLEDGE SYSTEMS
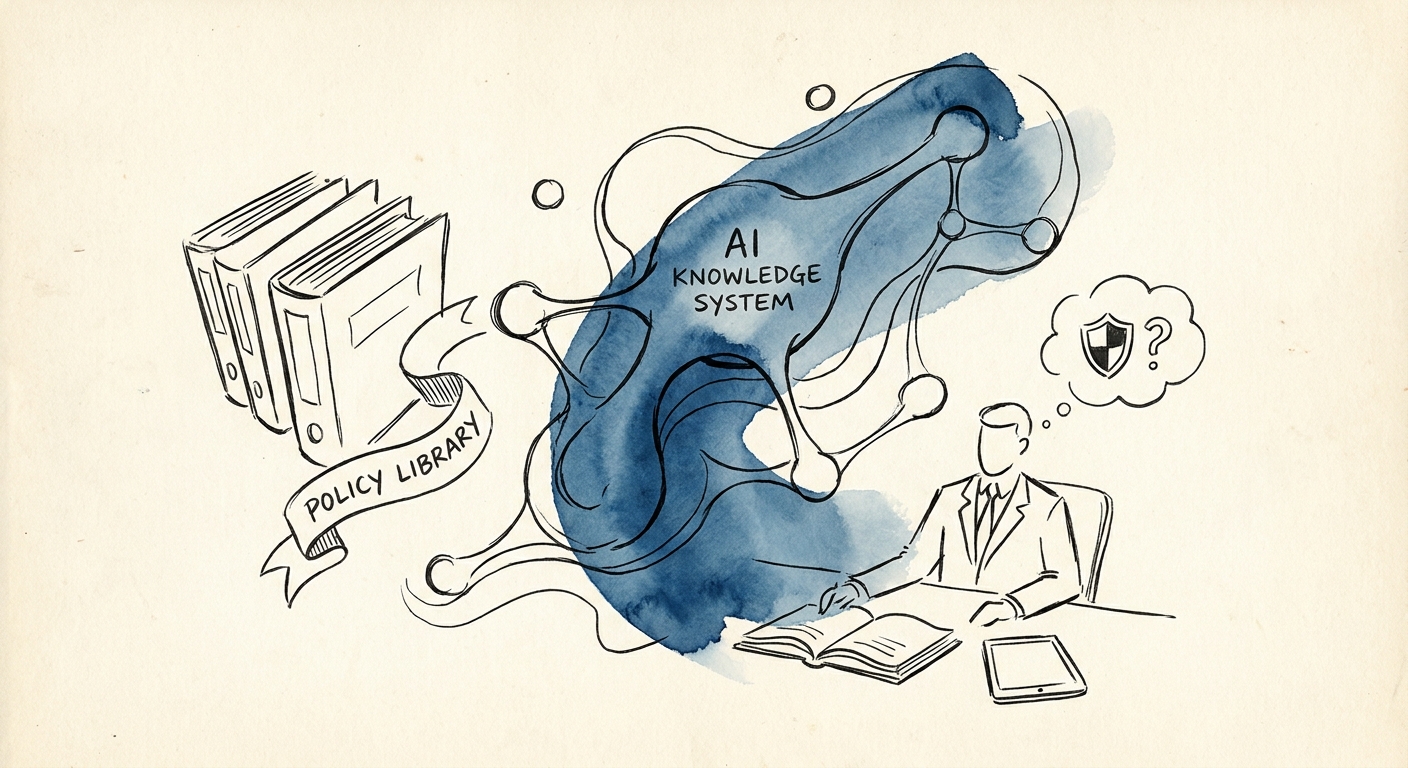
The Policy Library Your Consultants Already Ignore (And How AI Makes It Worse Before It Makes It Better)
Most consulting firms have a policy library nobody trusts. Here's how to put an AI layer on top without scaling the wrong answer to every project at once.
1 governed source library before automation
BRIEF · AI KNOWLEDGE SYSTEMS
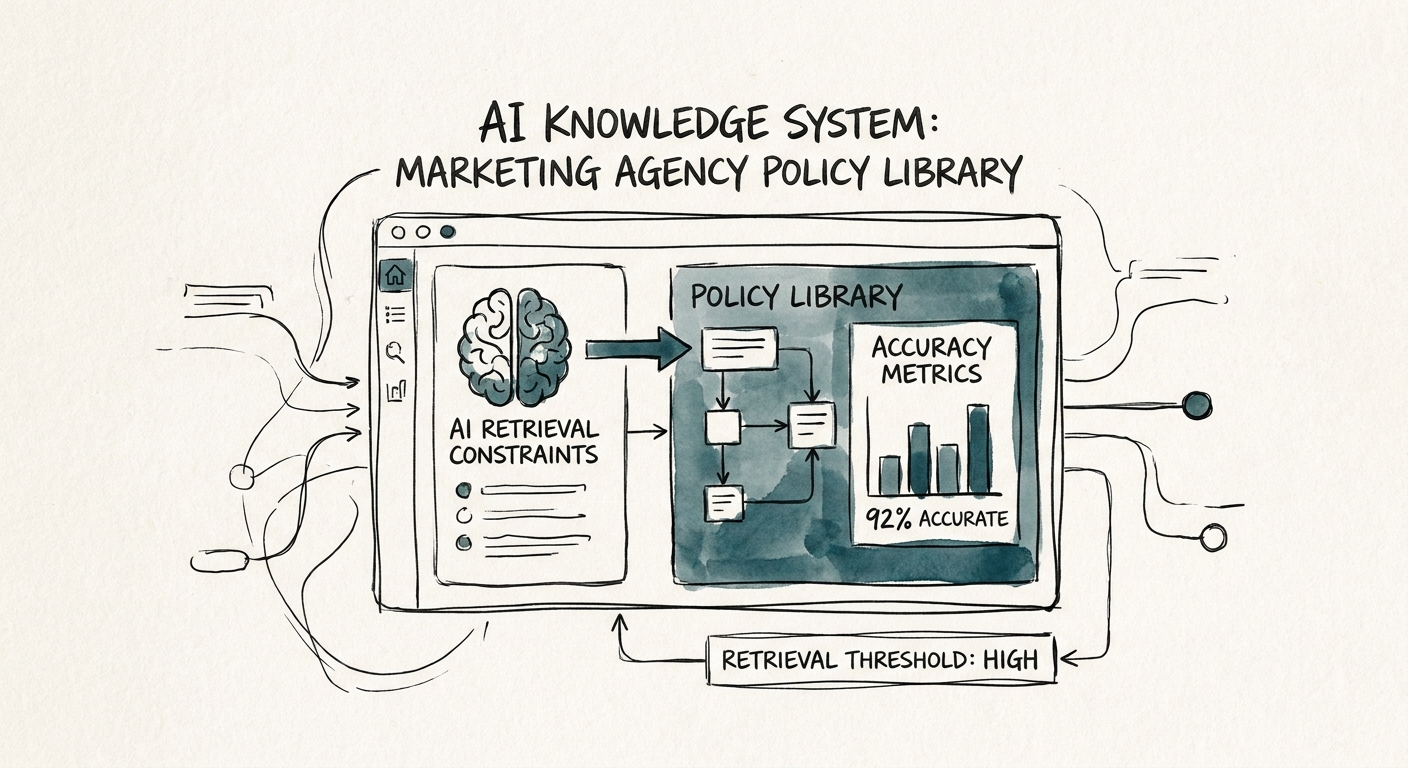
The AI Policy Assistant Your Agency Needs Before It Ships the Wrong Client's Brand Voice
A junior copywriter pulls the wrong client's tone rules at 6pm. Here's how agencies build an AI knowledge system that answers from approved policy — and cites it.
1 governed source library before automation
BRIEF · AI KNOWLEDGE SYSTEMS
The Policy Library Lives in Three Partners' Heads. An AI Knowledge System Fixes That — If You Govern It.
A junior consultant Slacks a partner to ask which NDA template to use. Here's how a professional services firm builds a governed AI knowledge system that answers from approved policy instead.
1 governed source library before automation
BRIEF · AI KNOWLEDGE SYSTEMS
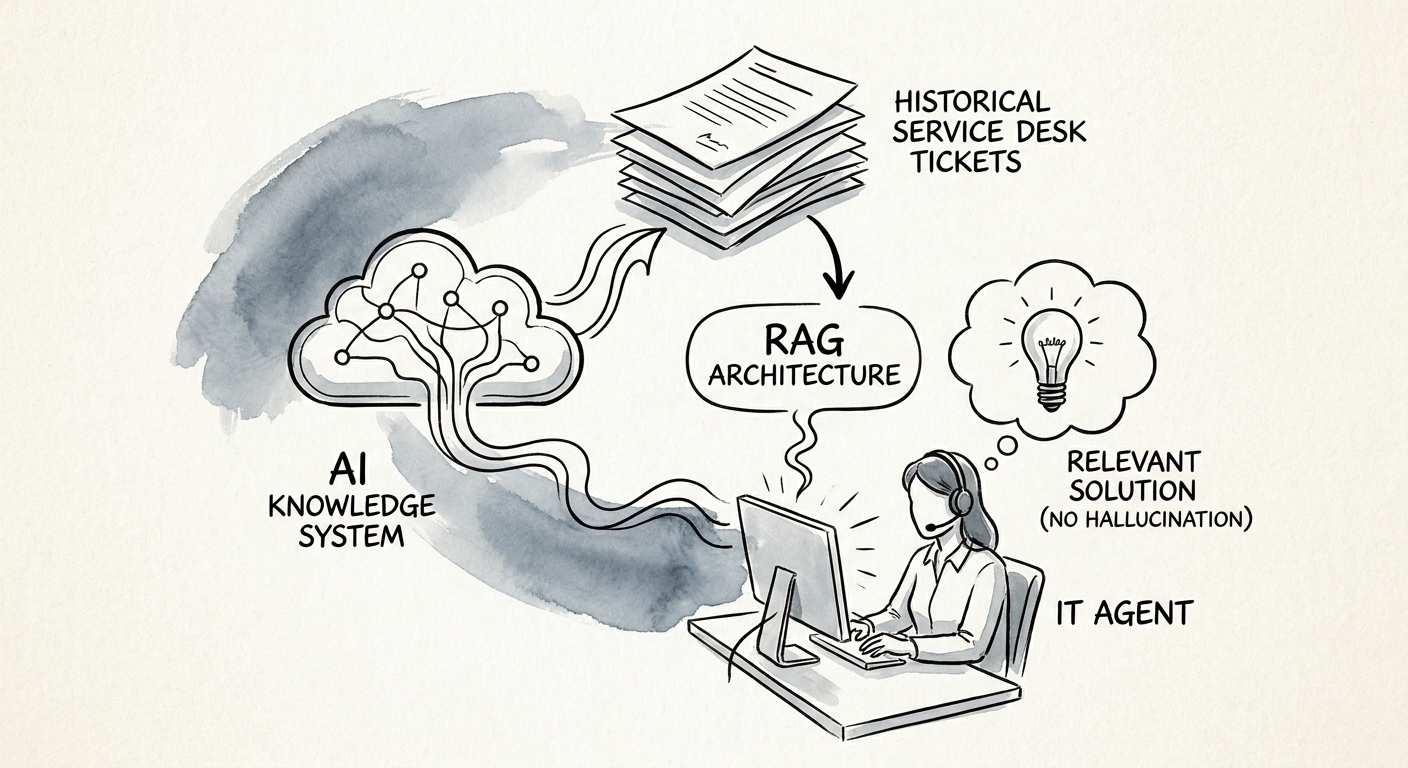
Your Best Engineer Already Solved That Ticket. Can Anyone Else Find the Fix?
A consulting firm's resolved tickets are its best playbook — and its biggest leak. How to turn service desk history into a governed AI system without exposing client data.
1 governed source library before automation
BRIEF · AI KNOWLEDGE SYSTEMS
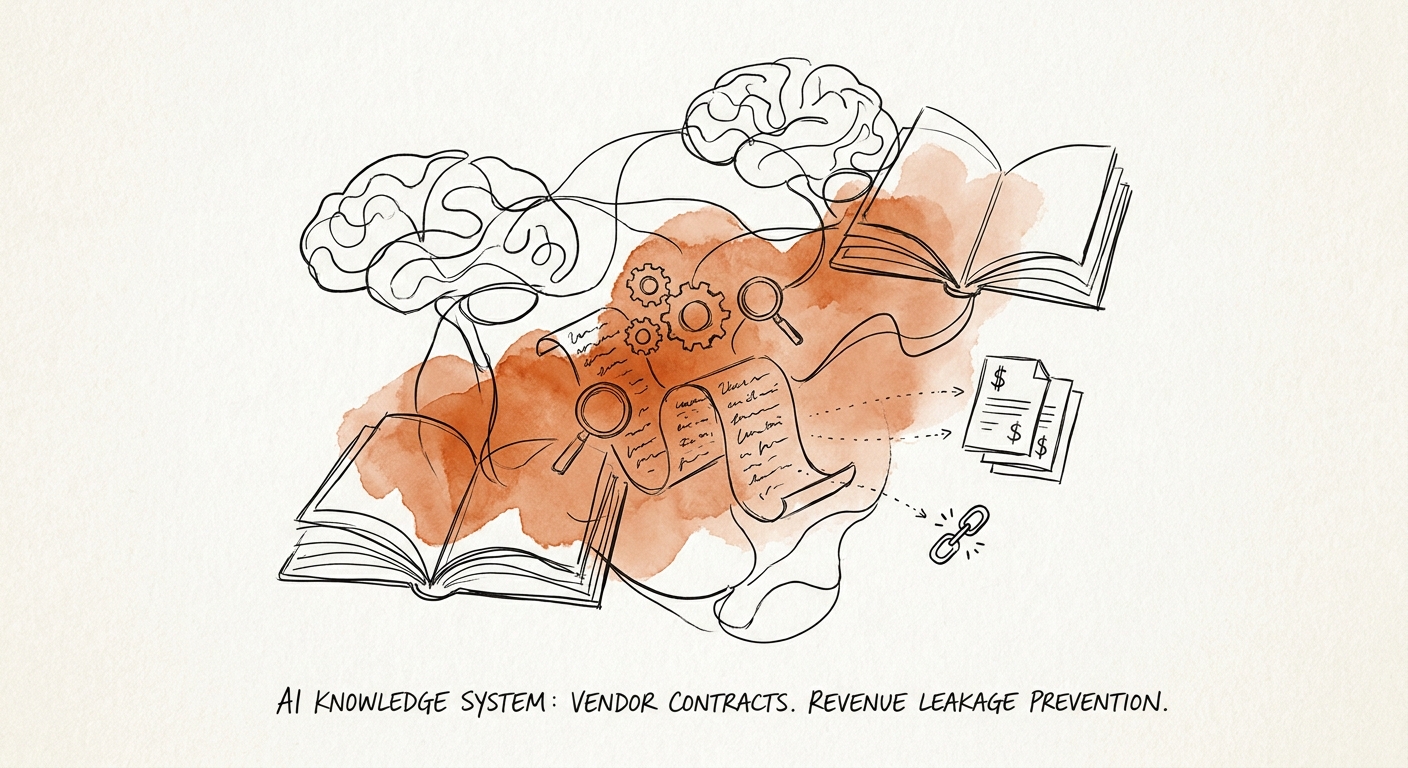
The Auto-Renewal You Forgot to Cancel: AI Over a Vendor Contract Library
A professional services firm's vendor contracts hide renewal dates and termination windows in 200 PDFs. Here's how to put governed AI over that library without leaking client terms.
1 governed source library before automation
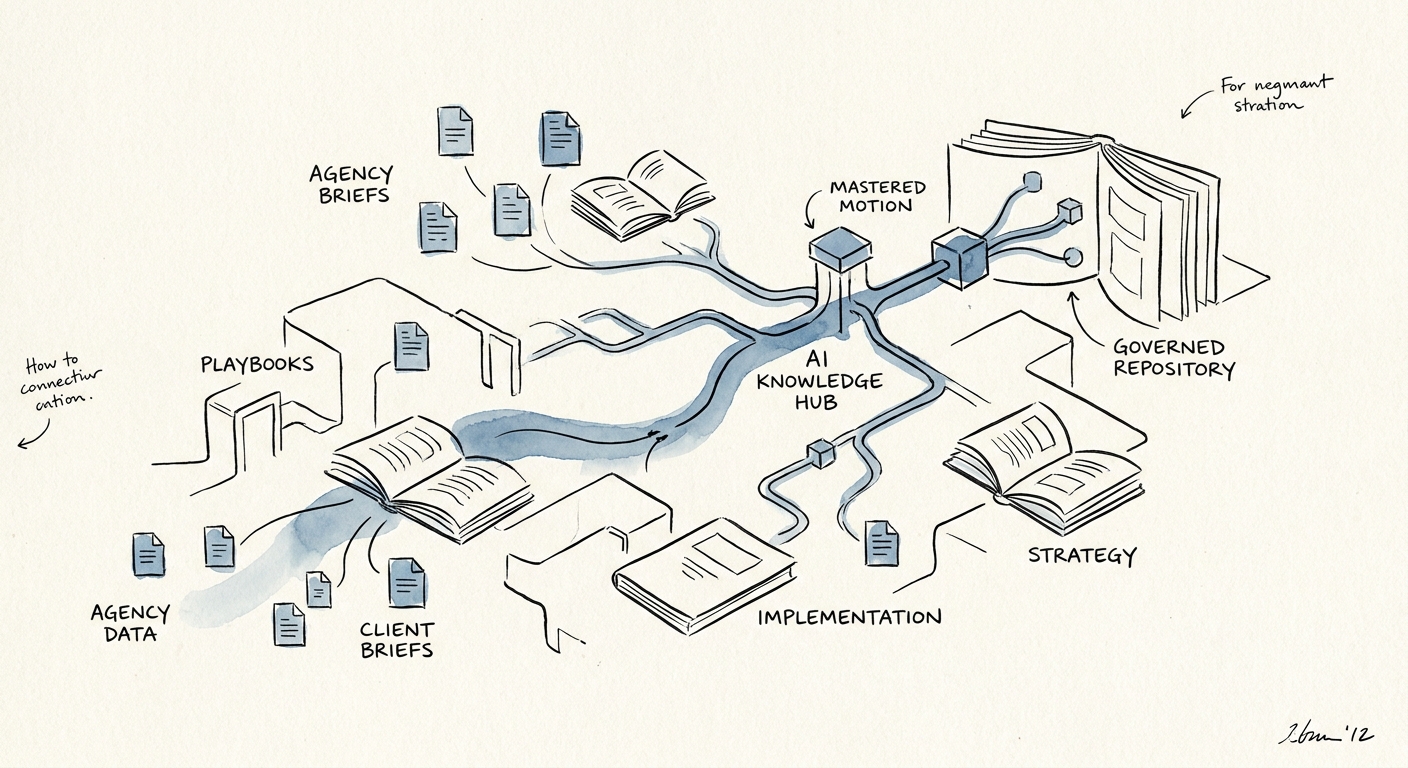
BRIEF · AI KNOWLEDGE SYSTEMS
The AI Knowledge System That Stops Your Agency From Rebuilding the Same Playbook Twice
Marketing agencies lose hours hunting for the current version of an implementation playbook. Here's how to build an AI knowledge system that actually gets used.
32% AI use at 100-249 employee firms
BRIEF · AI WORKFLOW AUTOMATION
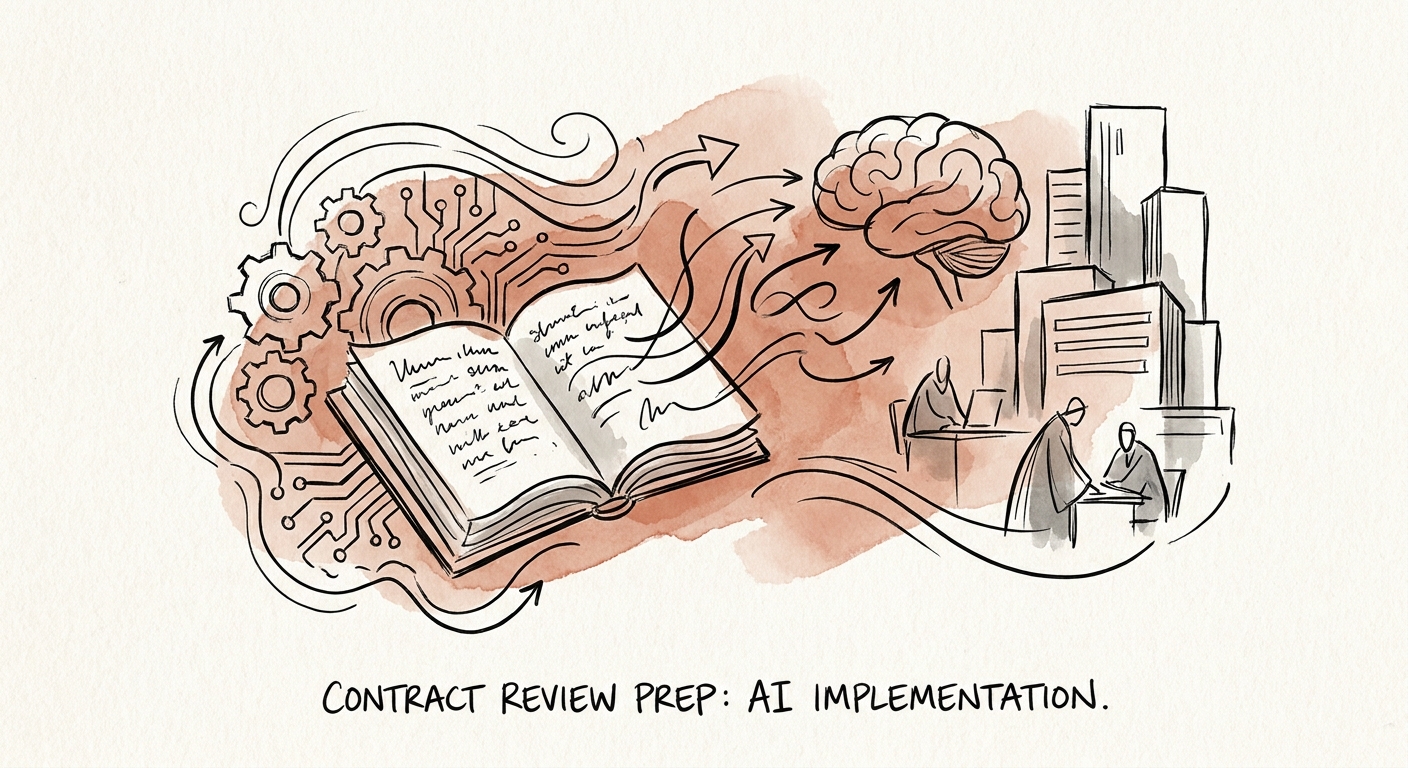
AI for Contract Review at Professional Services Firms: Where It Helps Partners, Where It Can't
How a professional services firm puts AI on contract-review prep — engagement letters, liability caps, conflict checks — without letting a bad clause reach signature.
32% AI use at 100-249 employee firms
BRIEF · AI KNOWLEDGE SYSTEMS
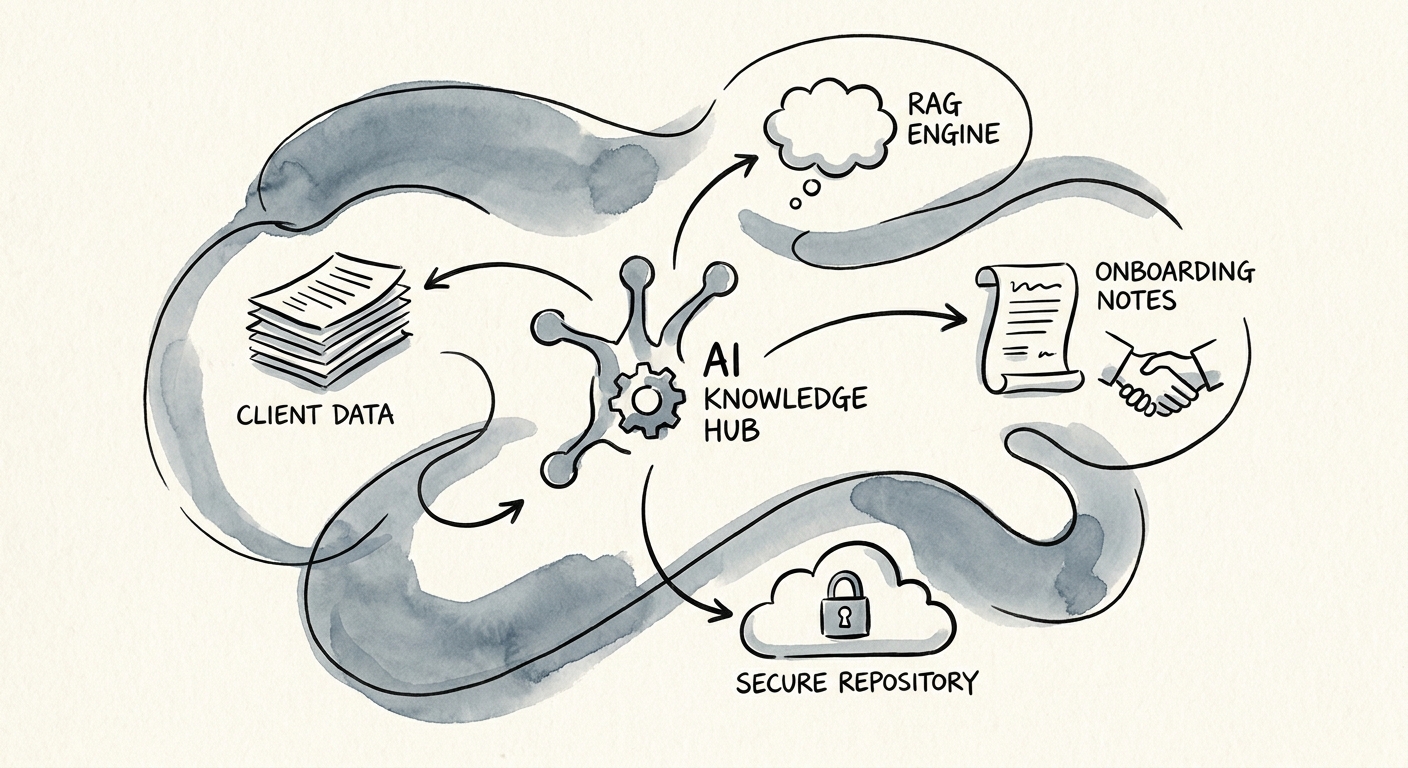
The Agency Onboarding Handoff Is Where Margin Quietly Dies
A new client signs, the kickoff goes great, then delivery starts with the wrong logo and a scope nobody agreed to. Here's how to fix the agency onboarding handoff.
1 onboarding record to standardize first
BRIEF · AI WORKFLOW AUTOMATION
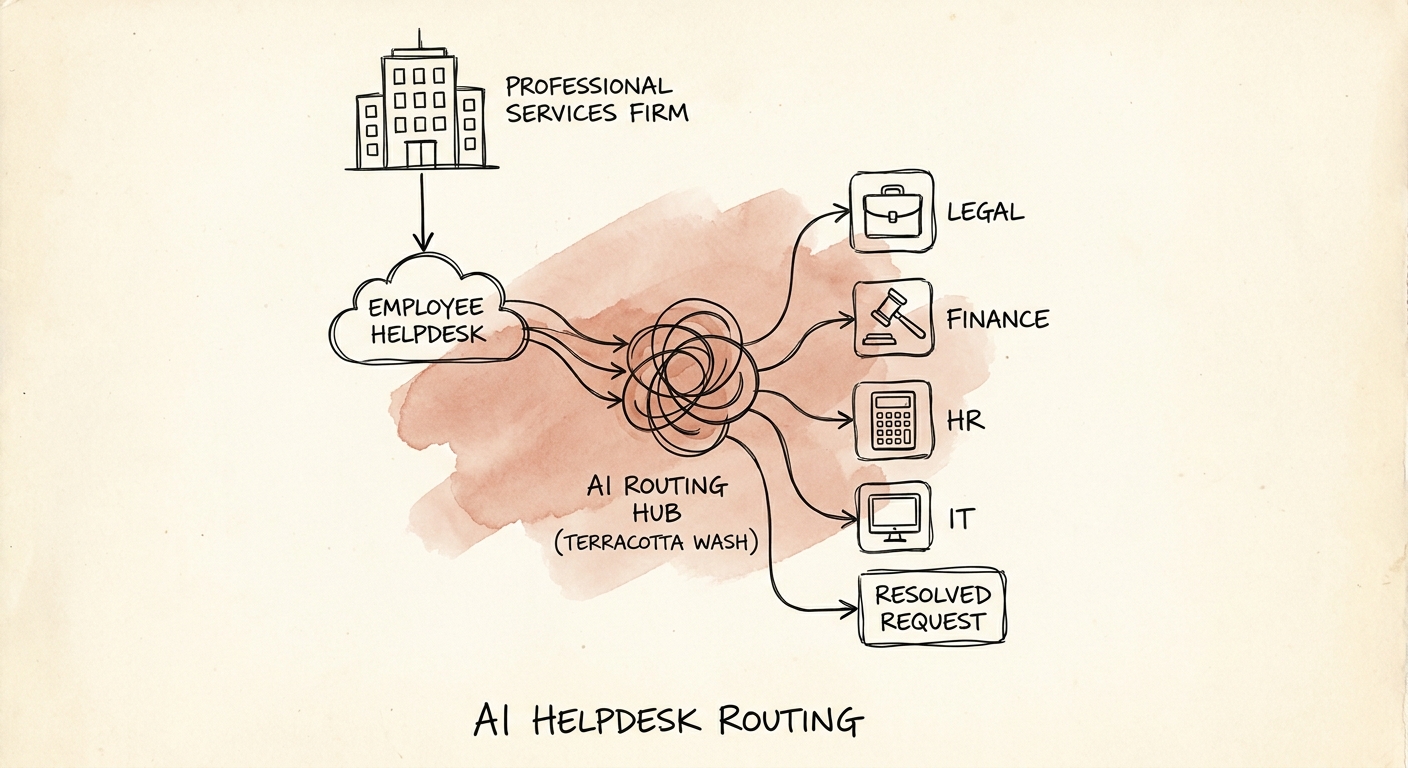
Employee Helpdesk Routing AI for Professional Services Firms: Stop Burning Billable Hours on Internal Tickets
In a services firm, every misrouted internal ticket steals billable time. How to use AI to route IT, HR, and finance requests without leaking sensitive data.
4 routing checks before AI sends a ticket onward
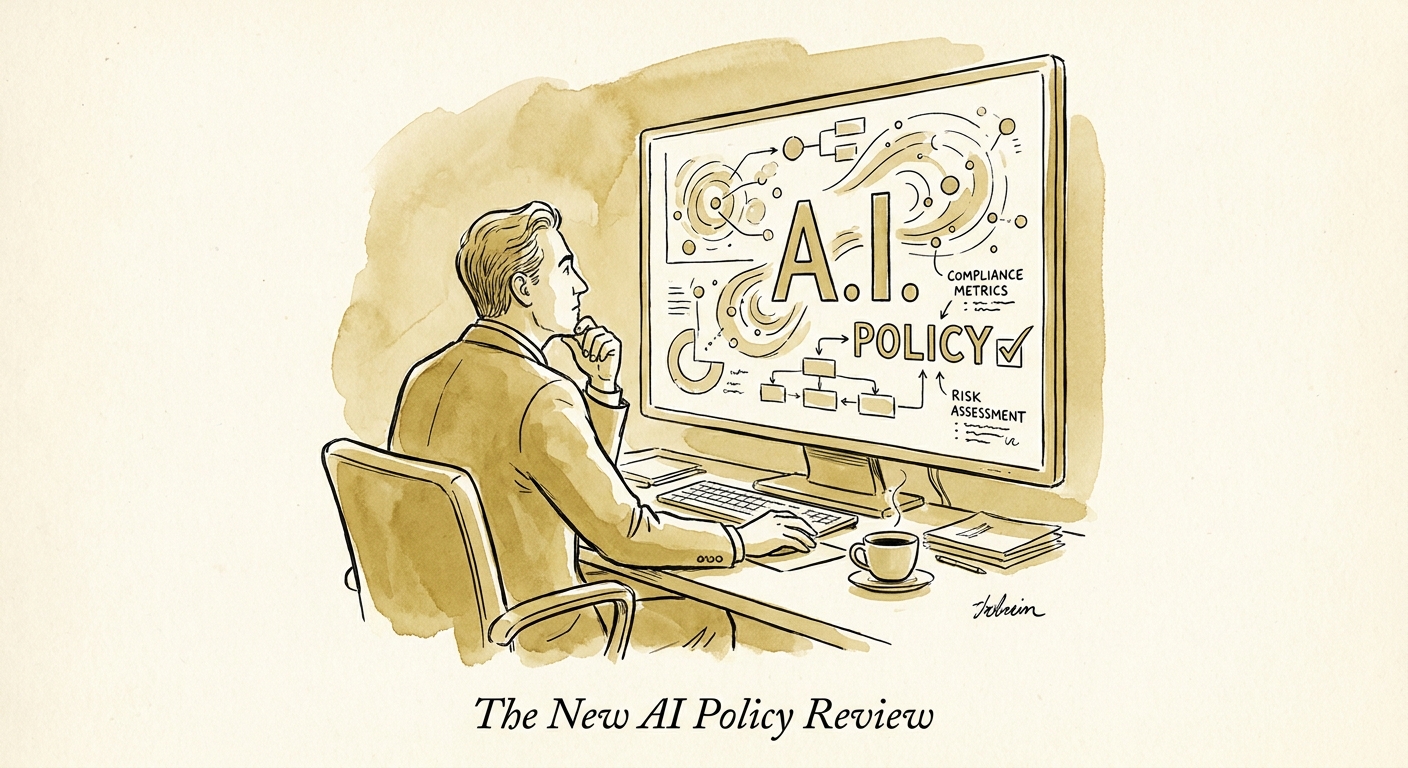
BRIEF · AI GOVERNANCE AND TRAINING
The AI Acceptable-Use Policy Professional Services Firms Actually Need
Most AI policies for professional services firms are unread PDFs. Here is how to write one that controls what gets pasted into a chatbot and who reviews the output.
6 policy decisions to settle before employee rollout
BRIEF · AI MEASUREMENT AND ROI
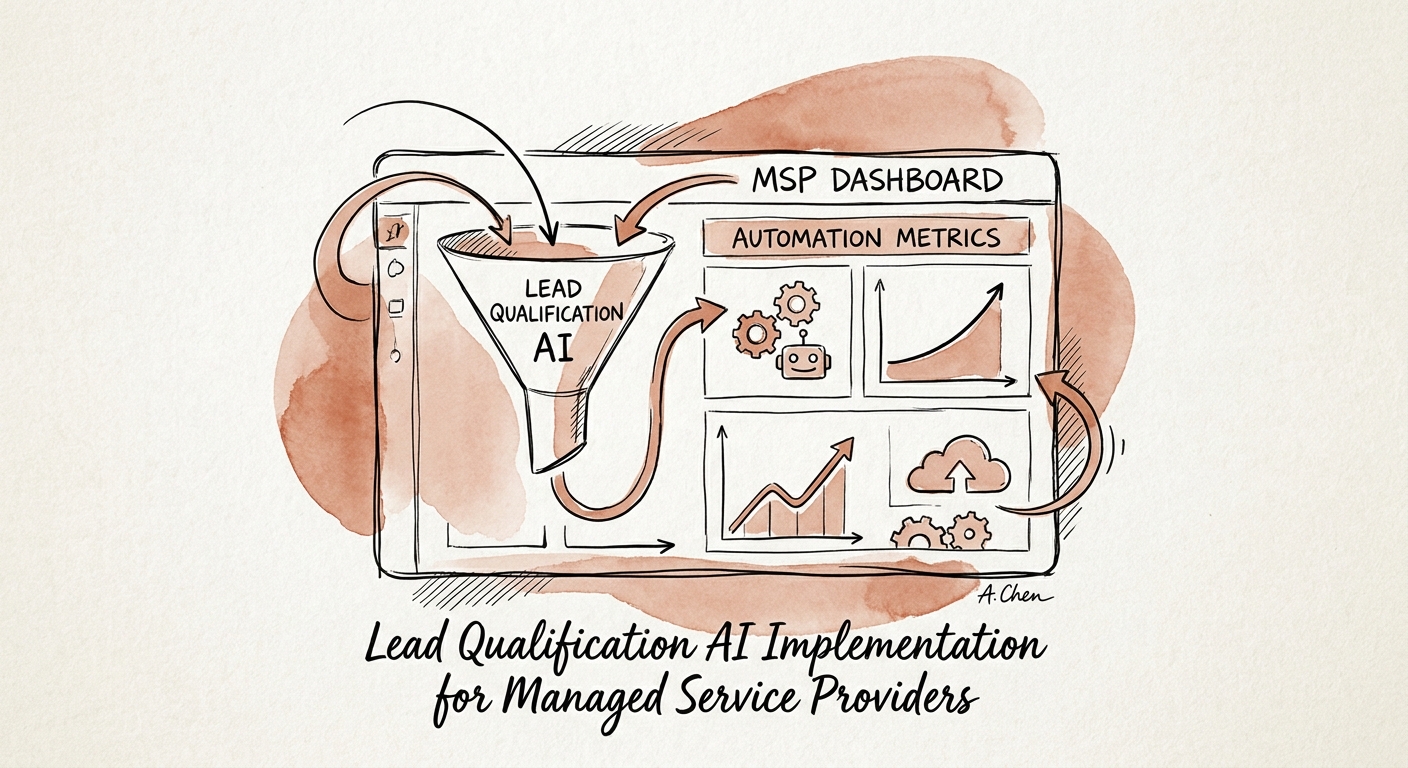
Lead Qualification AI for MSPs: Stop Burning vCIO Hours on Tire-Kickers
How MSPs can use AI to triage inbound leads by stack-fit, security posture, and contract size, without a black-box score hiding the reason for the call.
1 intake lane One governed lead-intake lane before scaling
BRIEF · AI VENDOR AND BUILD-VS-BUY
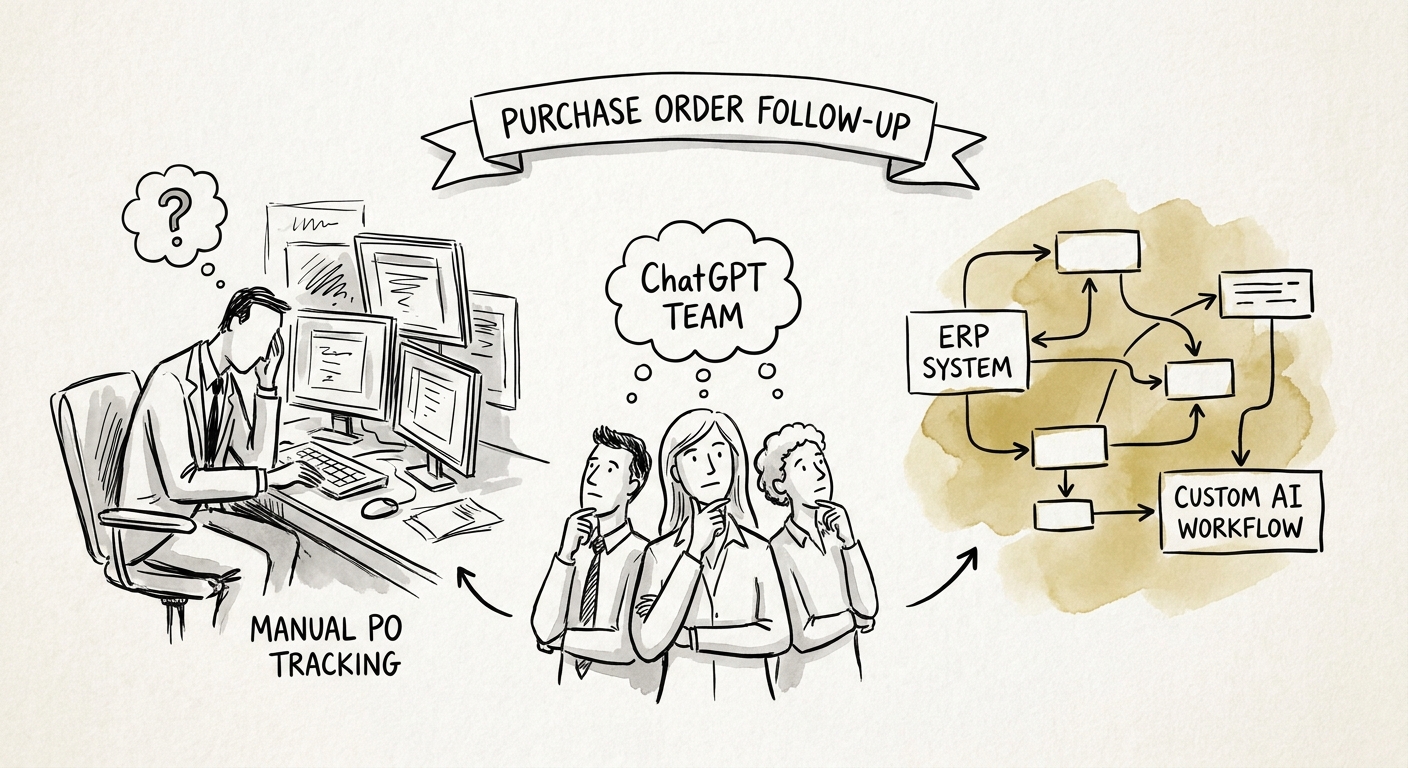
PO Follow-Ups: When ChatGPT Business Is Enough, and When You Need a Real Workflow
A reminder that nudges the wrong PO or commits unauthorized spend is worse than no AI. How to decide between ChatGPT Business and a governed workflow.
2 paths Separate ad hoc assistant use from governed workflow automation
BRIEF · AI INDUSTRY USE CASES
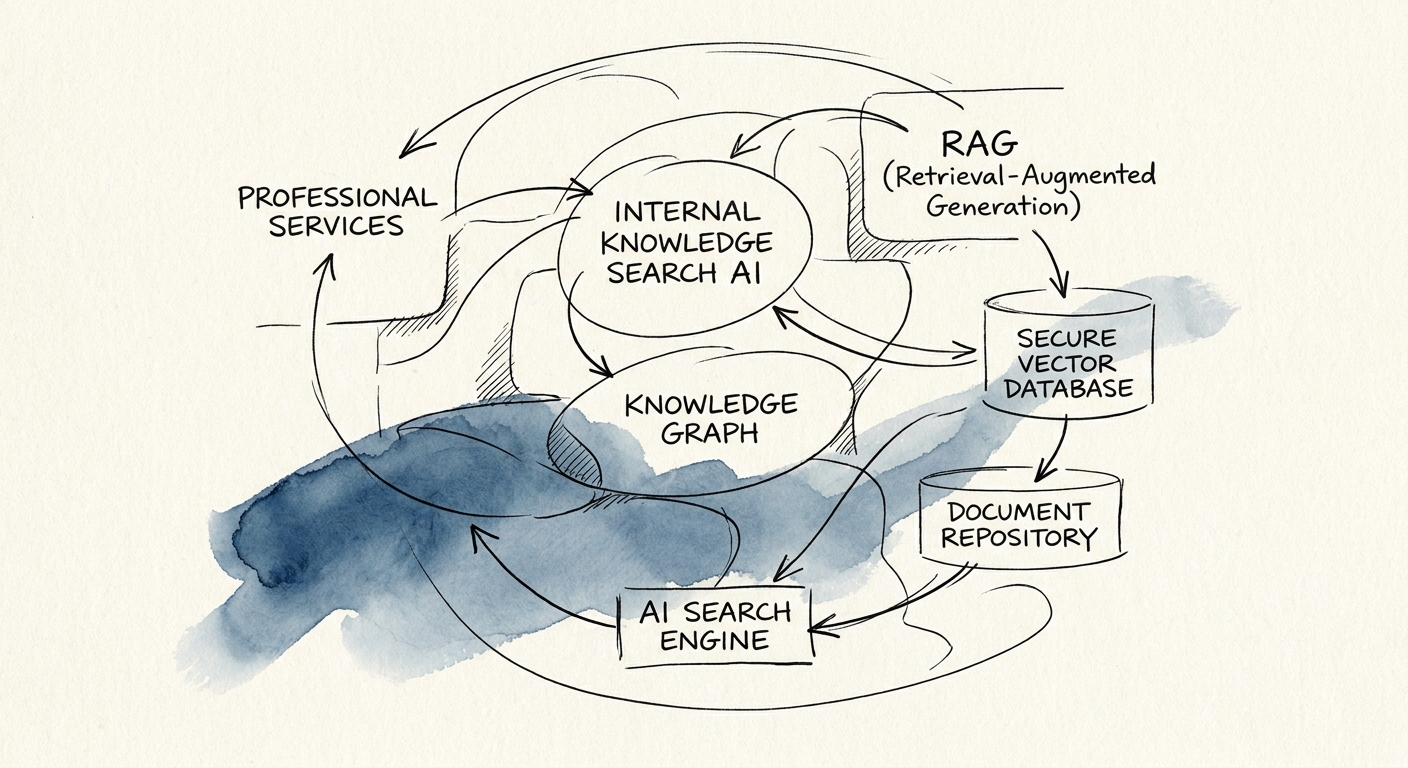
Internal Knowledge Search for Professional Services Firms: Make the Right Deck Findable, Not Every Deck
How professional services firms roll out AI knowledge search that surfaces the approved SOW, not last year's mispriced one — with source hygiene and a consultant review loop.
4 knowledge hygiene questions to answer before implementation
BRIEF · AI FUNCTION USE CASES
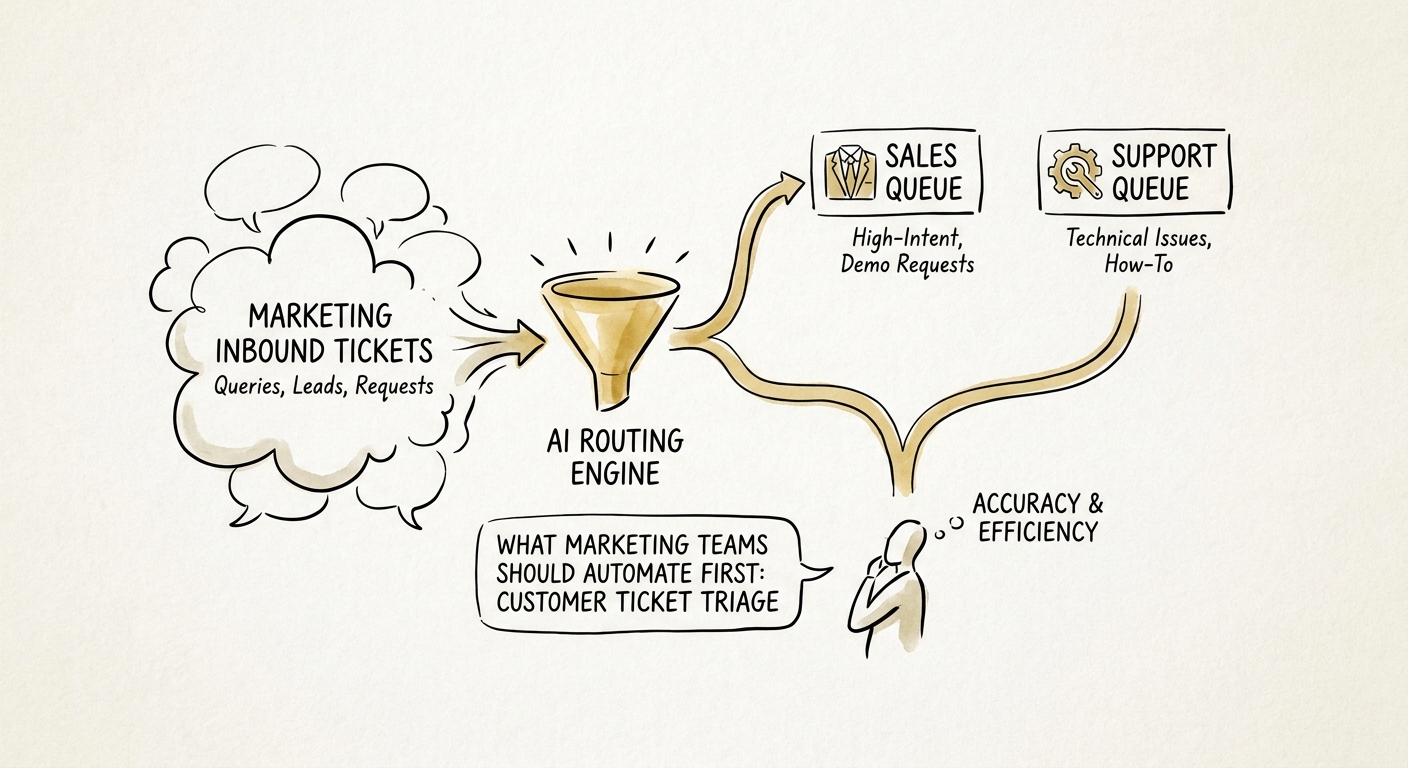
The First AI Project Marketing Should Steal From Support: Ticket Triage
Your support queue is the best market research you're not reading. Here's how a marketing team turns AI ticket triage into a voice-of-customer engine.
1 triage queue One customer-signal queue with human review
BRIEF · AI VENDOR AND BUILD-VS-BUY
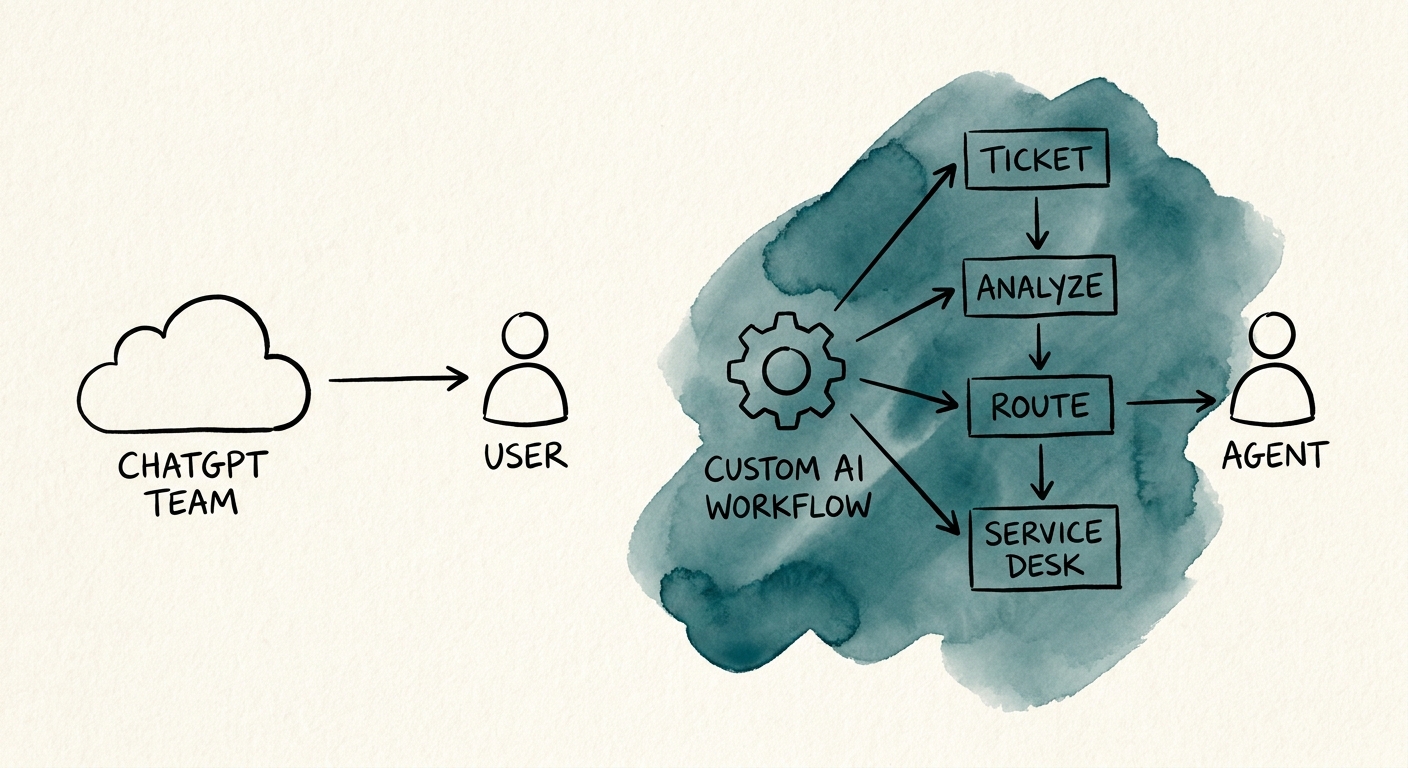
ChatGPT Business or a Custom Escalation Workflow: What Your Service Desk Actually Needs
A managed-services build-vs-buy guide: when ChatGPT Business is enough to draft service desk tickets, and when escalation needs a custom, SLA-aware workflow.
4 decision points before custom service desk AI
BRIEF · AI MEASUREMENT AND ROI
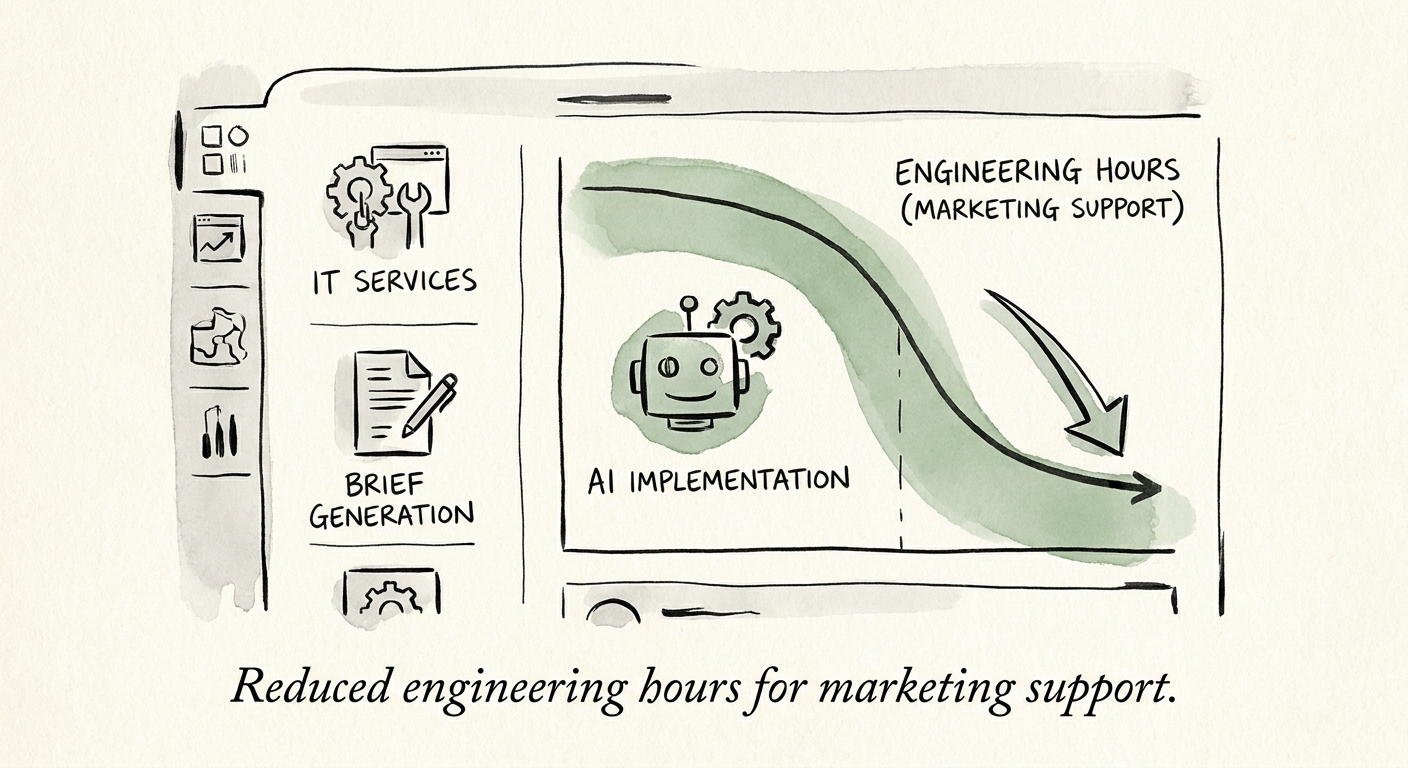
AI Marketing Brief Generation for IT Services Firms: Where the ROI Actually Comes From
IT services firms sit on case studies, ticket data, and service specs. Here's how to turn that into AI-drafted marketing briefs without inventing client outcomes.
90 days practical window to prove workflow ROI
BRIEF · AI GOVERNANCE AND TRAINING
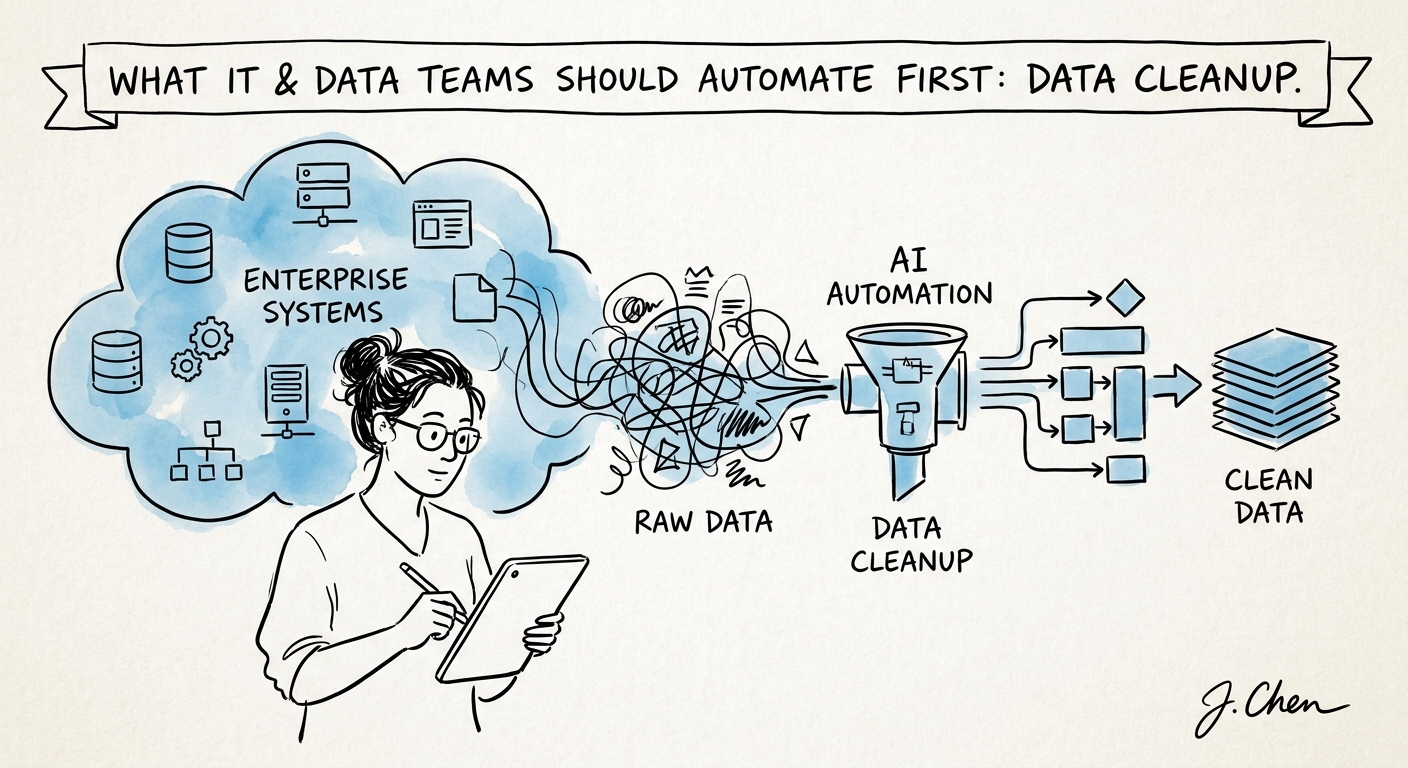
Before You Point AI at Your Duplicate Records, Answer One Question: Whose Record Wins?
Why AI data cleanup is really a master-record ownership problem, and the review queue tech-services IT teams should ship before any writeback.
Trusted records first IT/data AI outcome