BRIEF · AI FUNCTION USE CASES
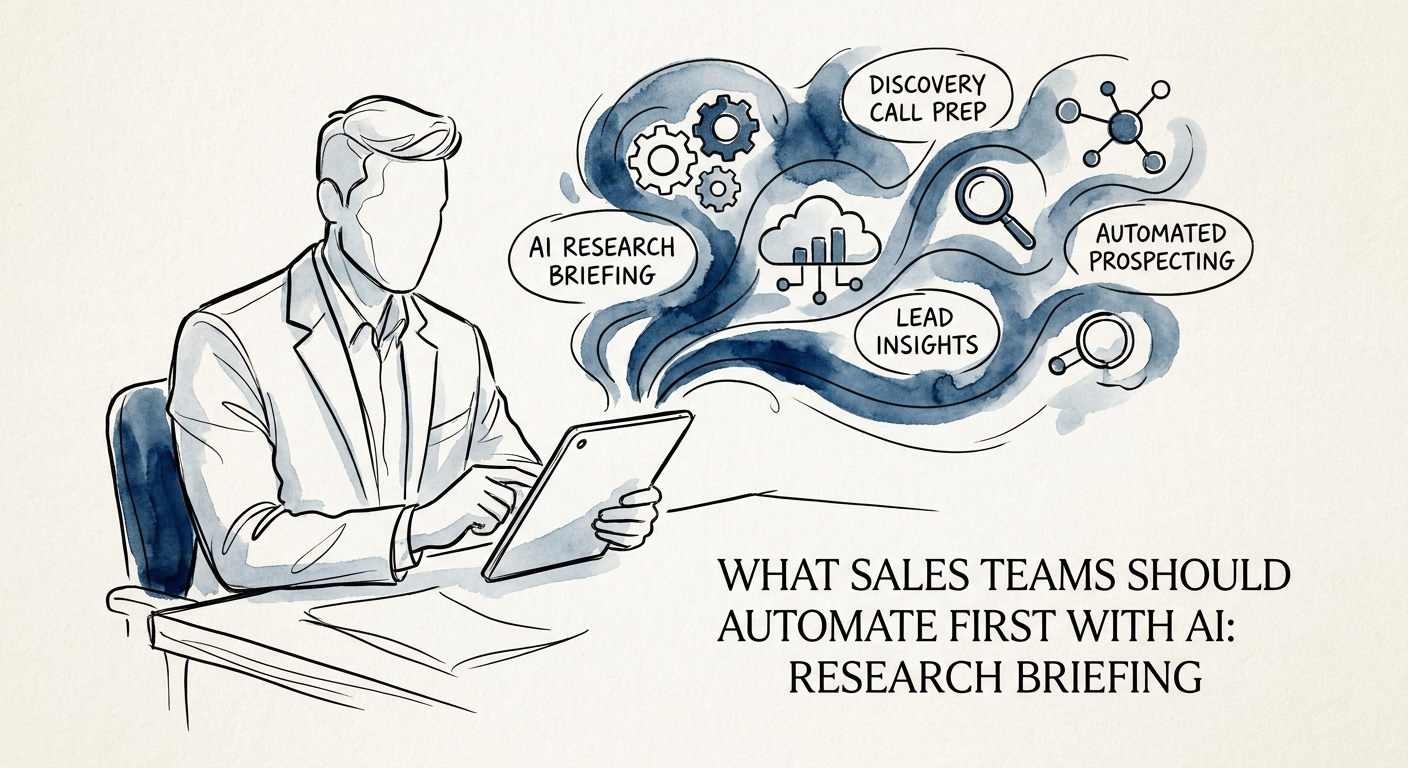
The First Sales Task to Hand AI Isn't Outreach — It's the Pre-Call Brief
Why account-research briefings — not auto-outreach — are the safest first sales AI workflow, and how to build one that reps actually trust before a call.
Better preparation first account-research AI outcome
BRIEF · AI WORKFLOW AUTOMATION
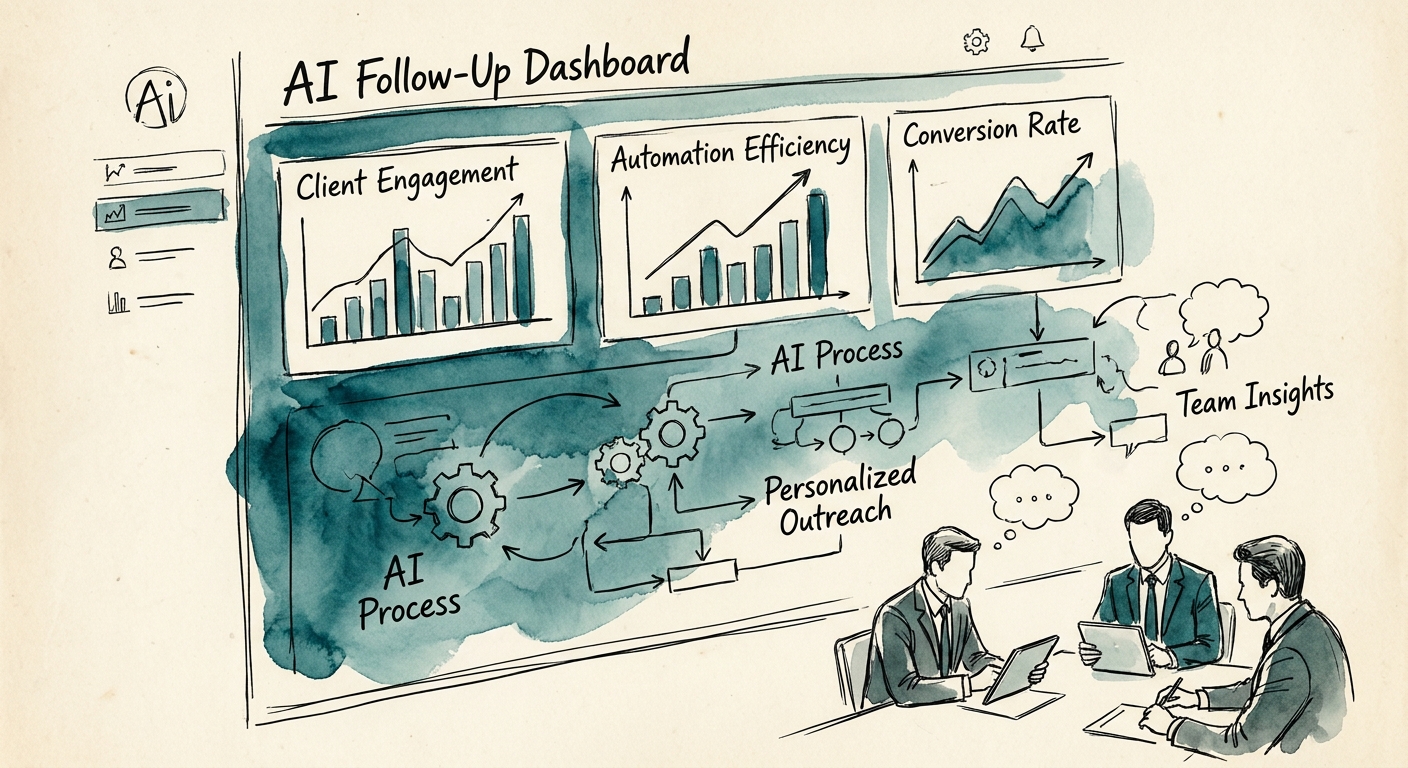
AI Sales Follow-Up for Professional Services Firms: Drafting the "I'll Send You That" Email Without Inventing Promises
A partner-led playbook for AI sales follow-up at professional services firms: capture the real next step, keep CRM provenance, and measure pipeline, not email speed.
1 follow-up workflow to standardize before scaling AI
BRIEF · AI KNOWLEDGE SYSTEMS
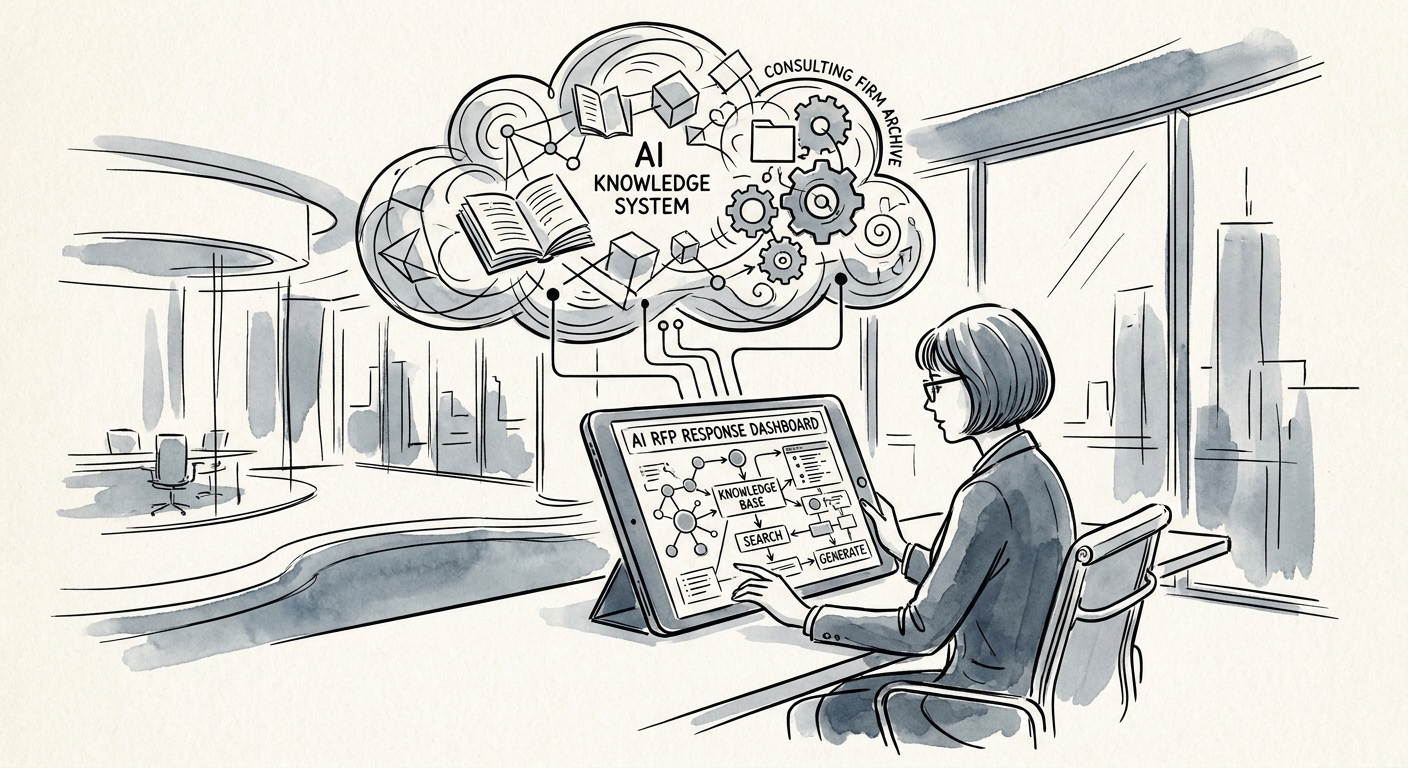
The AI RFP Library That Stops Your Firm From Promising 2023's Capabilities
An AI knowledge system for consulting RFP libraries: retrieve approved answer blocks with owners and expiration dates, not stale proposal copy that creates risk.
3 approval layers required for AI-assisted RFP reuse
BRIEF · AI GOVERNANCE AND TRAINING
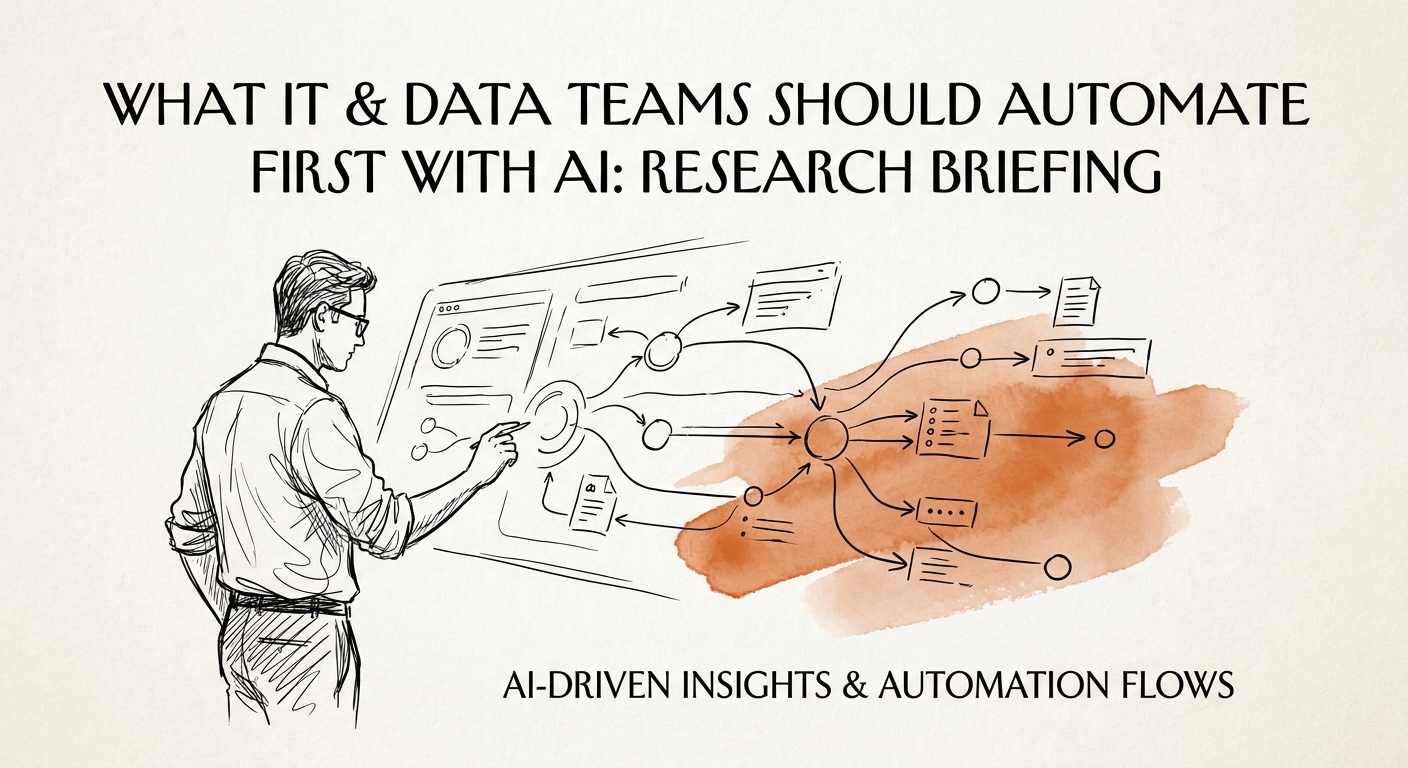
The First Thing IT and Data Teams Should Hand to AI: The Research Briefing
Why the research briefing is the smartest first AI workflow for IT and data teams—and how to build it so it cites sources instead of inventing them.
32% AI use at 100-249 employee firms
BRIEF · AI FUNCTION USE CASES
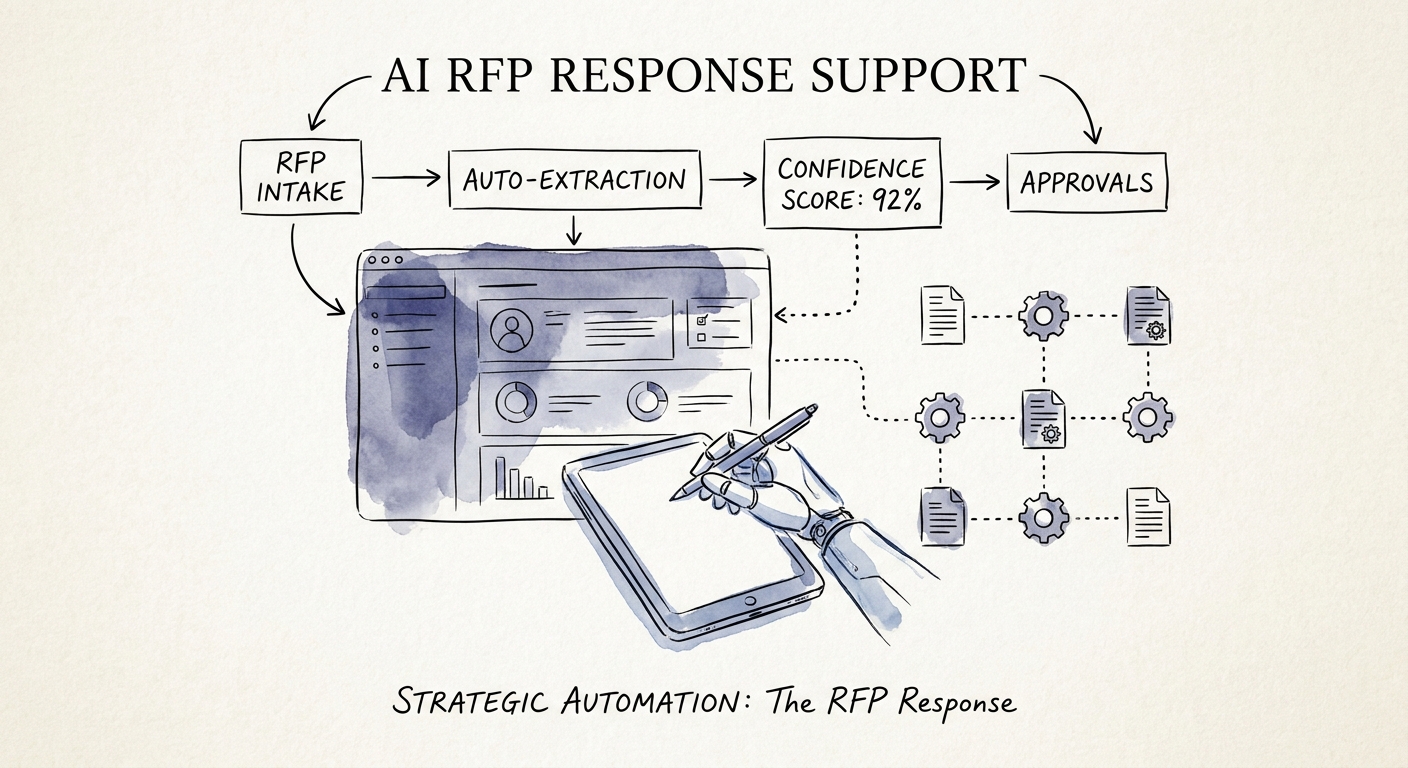
The First Thing Sales Should Automate Isn't Email — It's the RFP Answer Library
RFPs are the highest-leverage, highest-risk place to start AI in sales. Here's how to automate the answer library without locking in a promise you can't keep.
3/4 Companies planning agentic AI deployment within two years
BRIEF · AI MEASUREMENT AND ROI
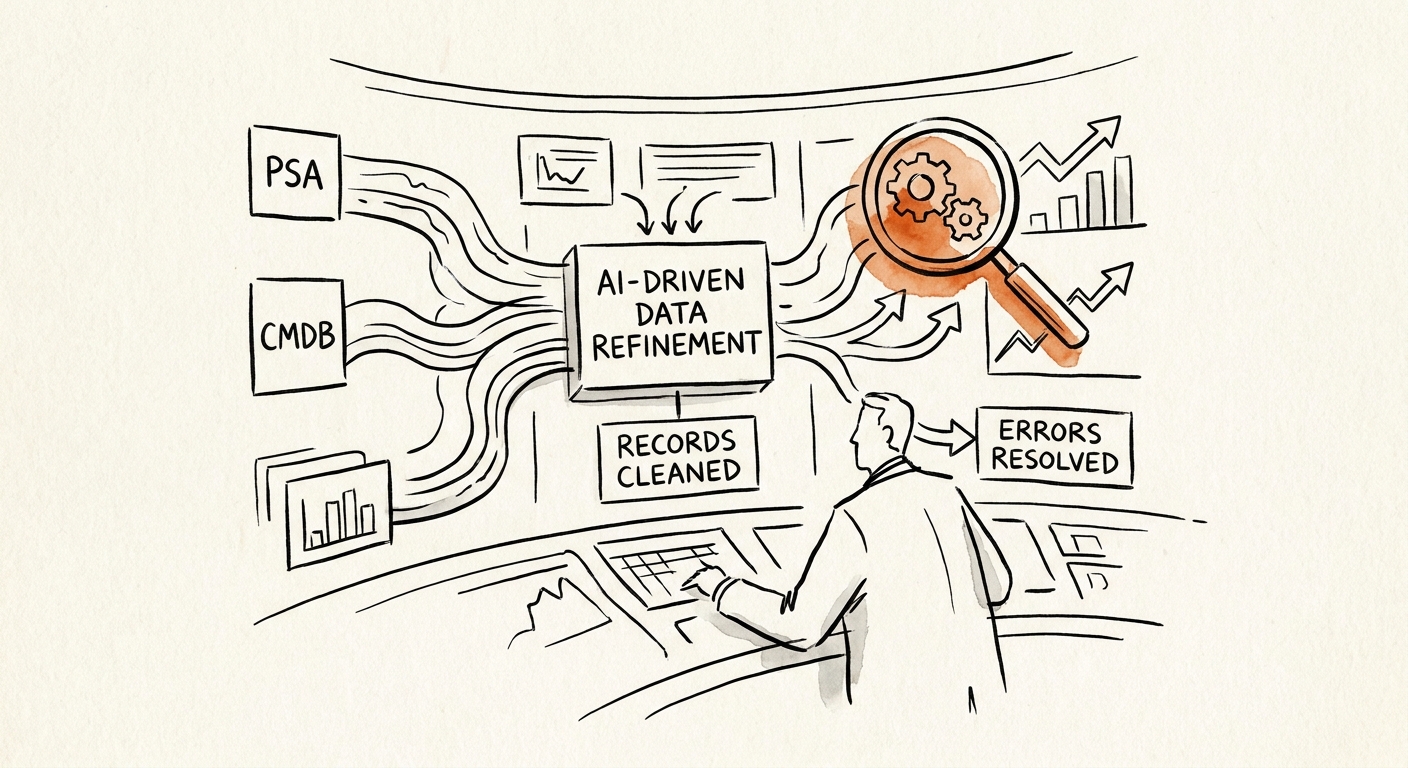
AI Data Cleanup for IT Services Firms: Fix the CMDB Before You Automate It
Your CMDB is 30% wrong and AI will route tickets on it anyway. How IT services firms clean one data domain, prove it, and decide whether to scale.
1 data domain One data domain cleaned before automation
BRIEF · AI MEASUREMENT AND ROI
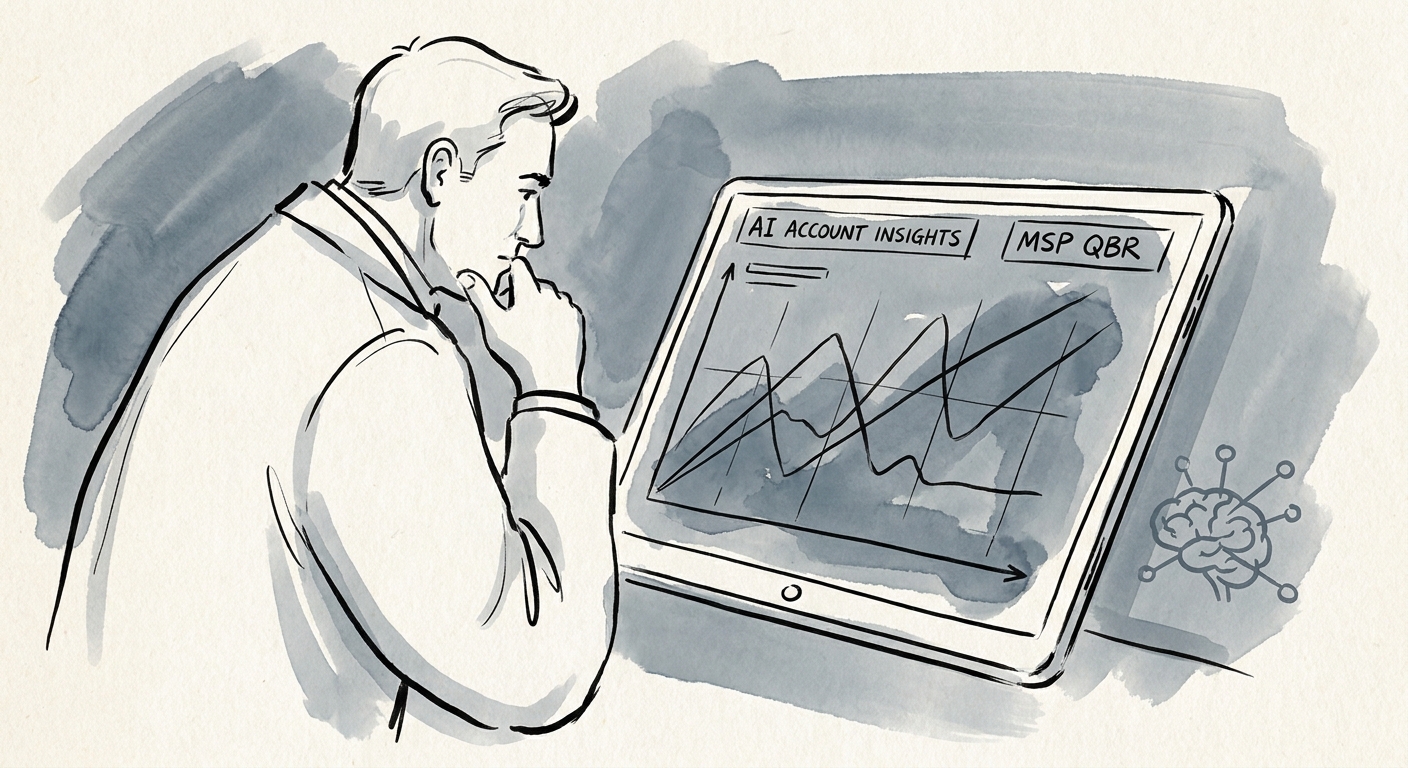
The MSP QBR Prep Problem: Using AI to Build Renewal Briefings From PSA, CRM, and Ticket Data
How MSP account managers can use AI to assemble renewal briefings from PSA tickets, CRM notes, and RMM data — with tenant boundaries and source citations intact.
3 data sources to reconcile before automating account research
BRIEF · AI WORKFLOW AUTOMATION
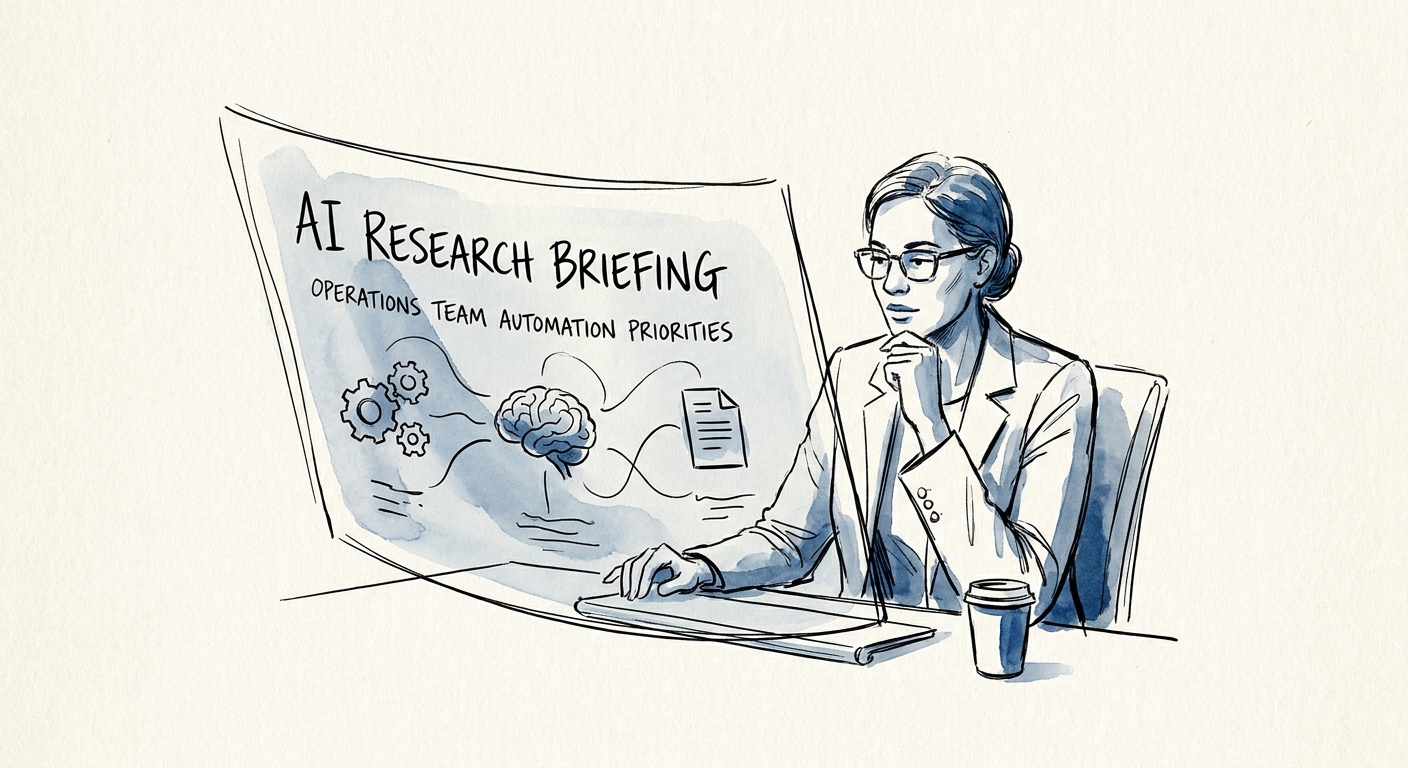
Start Your Ops Team's AI With Research Briefings, Not Reports
Why research briefing is the safest first AI automation for a mid-market operations team, and the exact freshness and source checks to run before you scale it.
1 briefing flow One briefing flow with source review
BRIEF · AI KNOWLEDGE SYSTEMS
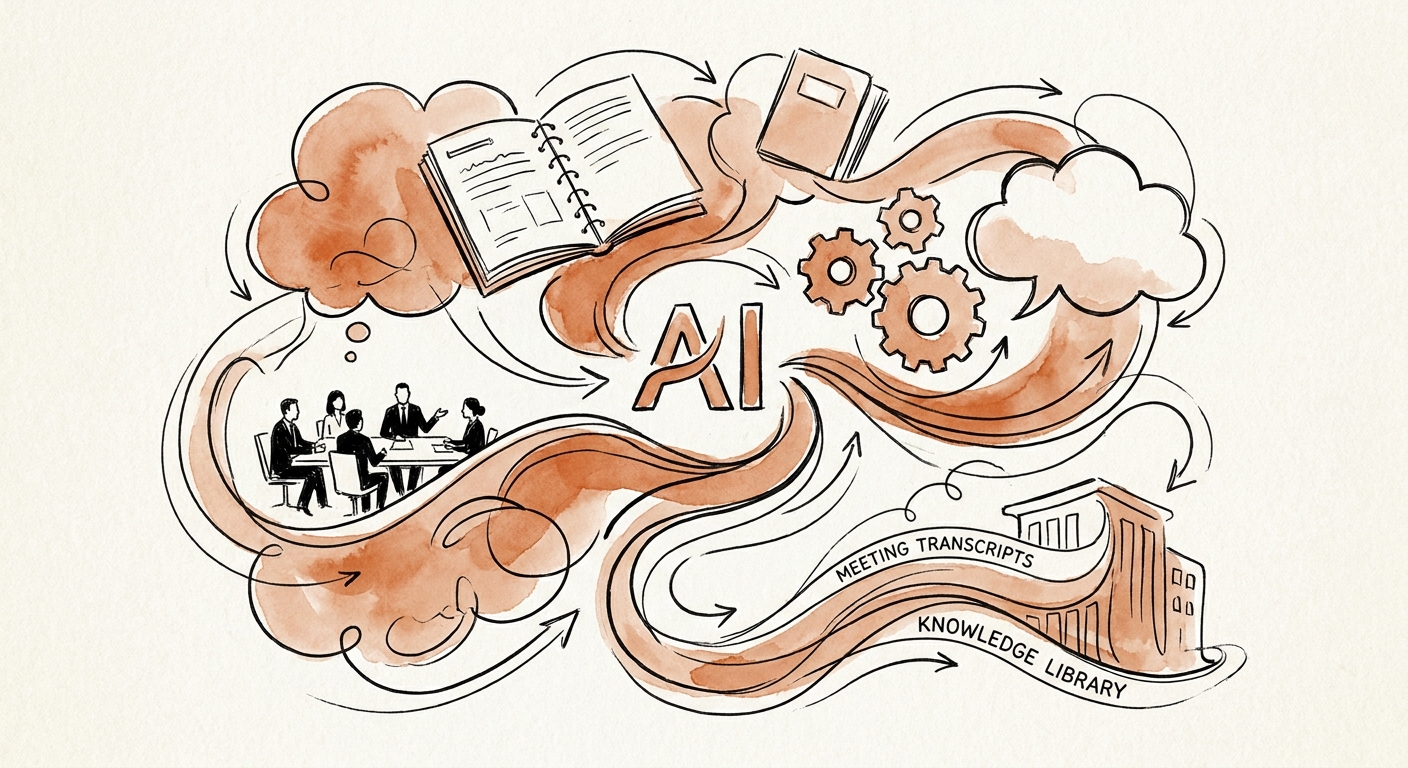
Your Consulting Firm's Best Thinking Is Buried in 4,000 Hours of Meeting Transcripts
How consulting firms turn a transcript graveyard into a governed AI answer layer — without leaking one client's call into another's deliverable.
25% leaders moving many AI pilots into production
BRIEF · AI KNOWLEDGE SYSTEMS
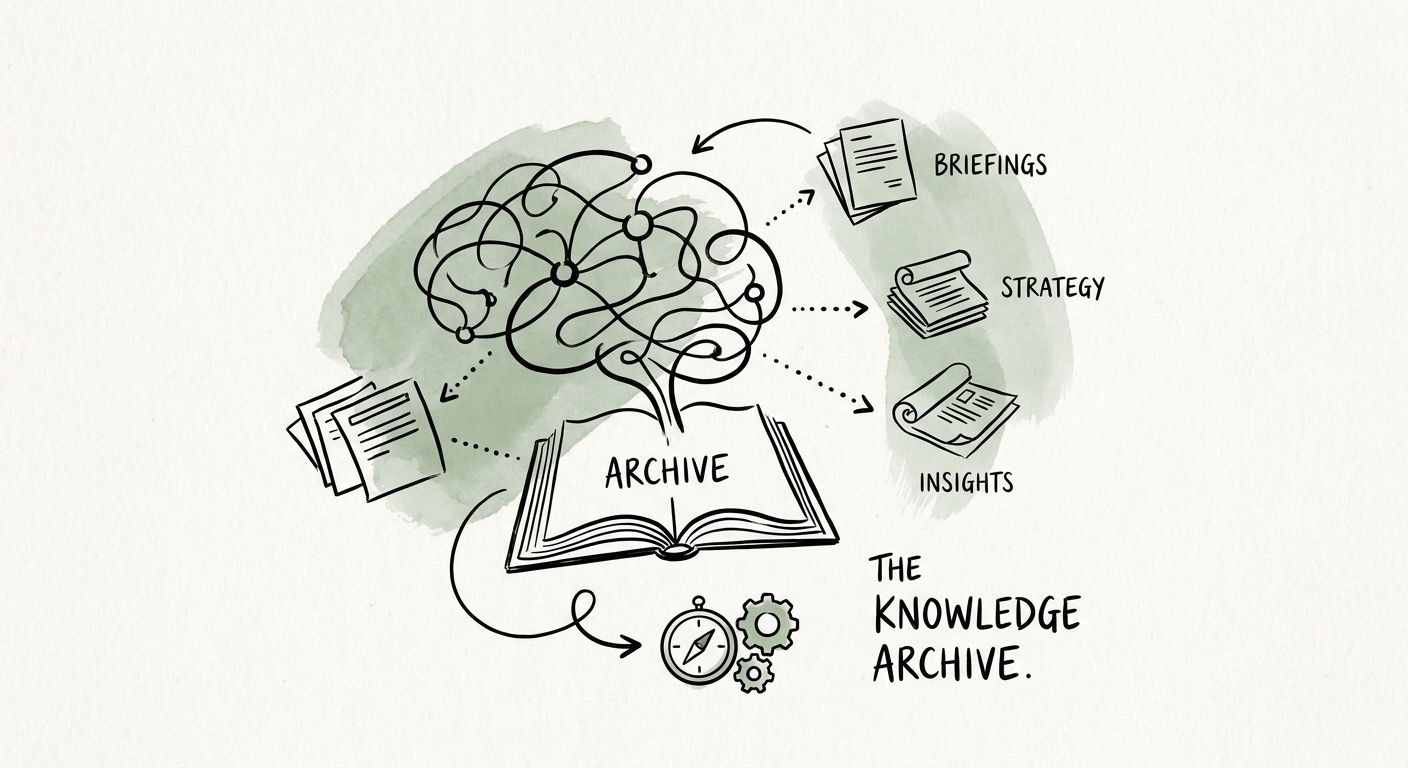
The Reused Slide Problem: An AI Knowledge System for Consulting Firms' Briefing Archives
A consultant pulls a two-year-old board slide into a new deck. Here's how to make your briefing archive AI-searchable without dragging stale stats or client secrets along.
3 controls needed before opening a briefing archive to AI
BRIEF · AI INDUSTRY USE CASES
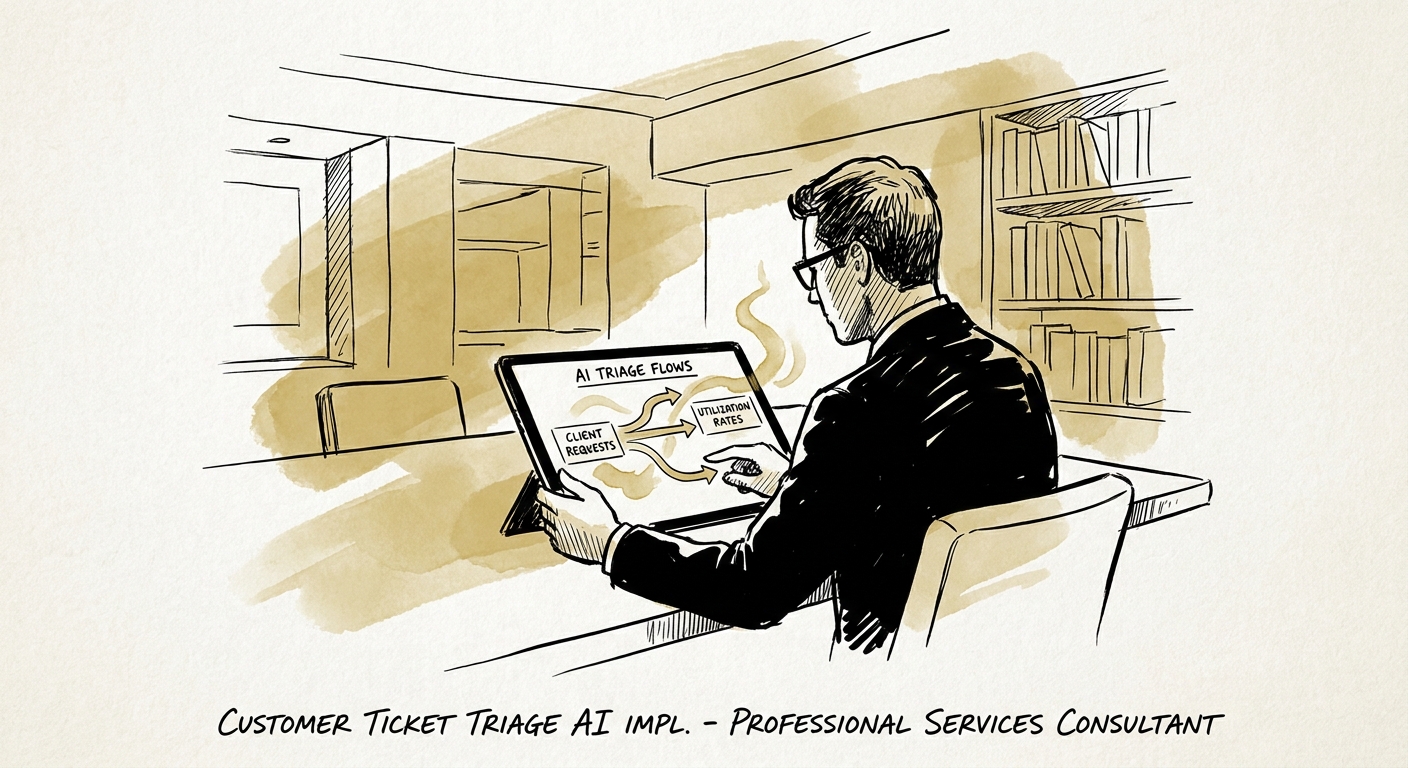
AI Ticket Triage for Professional Services: Where Misrouting Costs More Than Time
A professional services firm's guide to AI ticket triage: why a misrouted client request is a conflict-and-confidentiality risk, and how to govern it.
2 governed routing decisions before broad automation
BRIEF · AI MEASUREMENT AND ROI
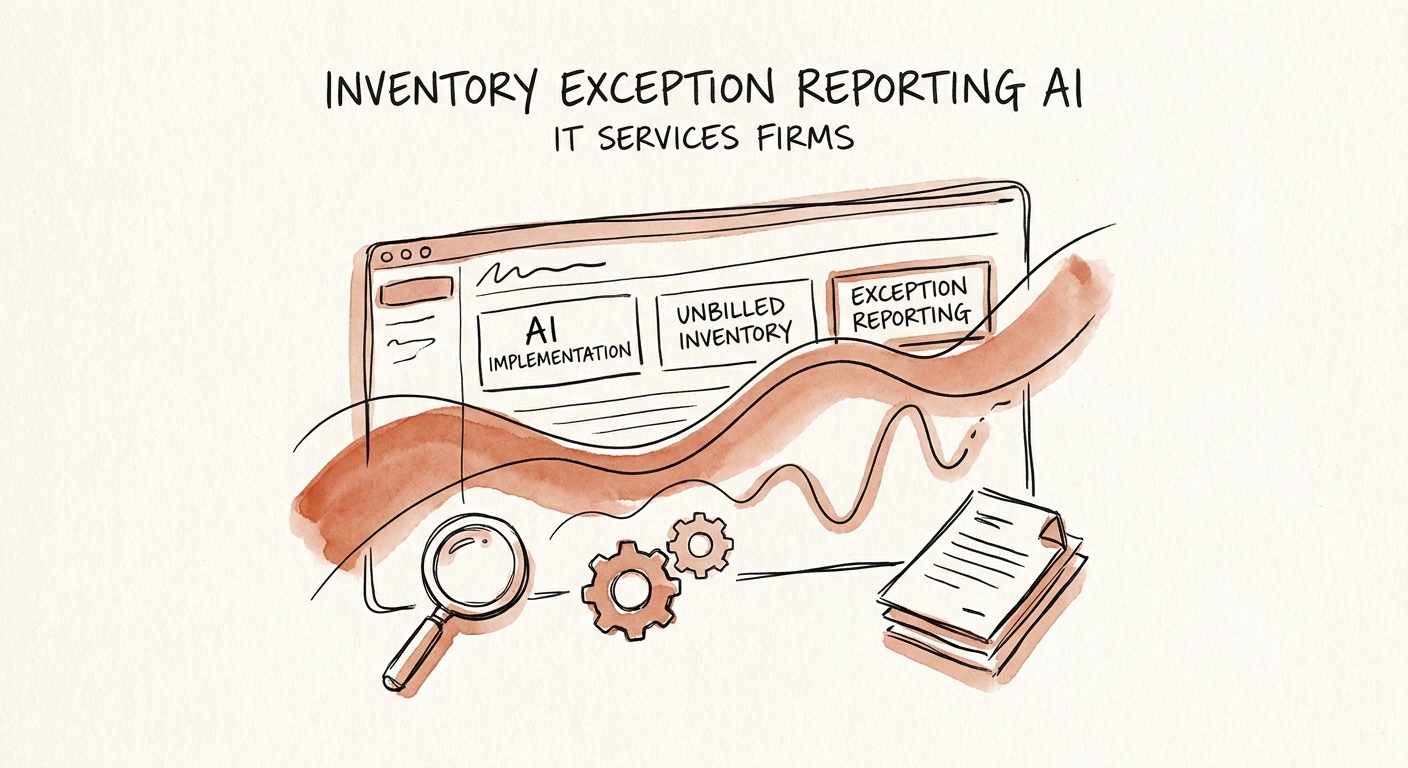
The Inventory Exception That Costs an MSP a Client: An AI Workflow for IT Services Firms
A license auto-renews with no PO. A laptop drops off your RMM. Here's how an IT services firm uses AI to catch inventory exceptions without touching the source of truth.
1 exception queue to prove first
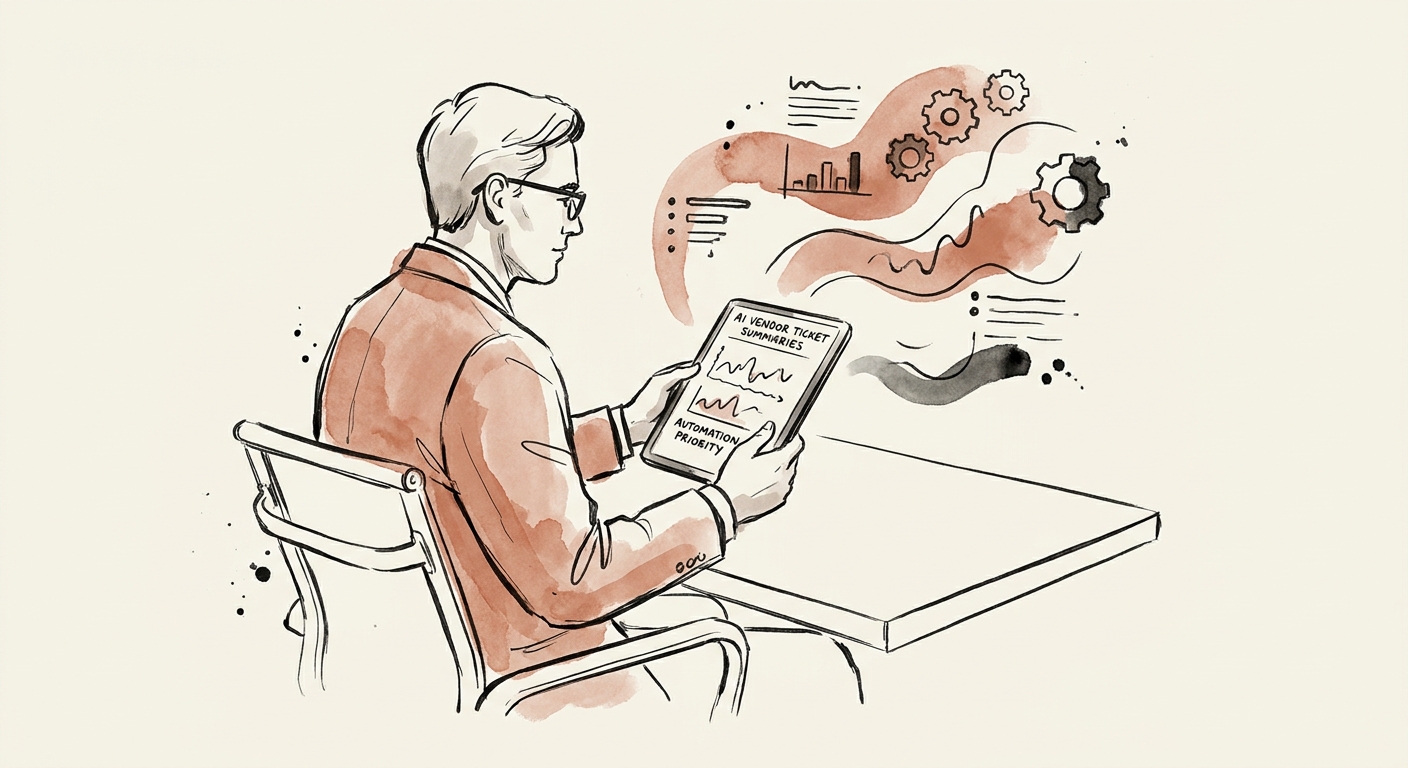
BRIEF · AI WORKFLOW AUTOMATION
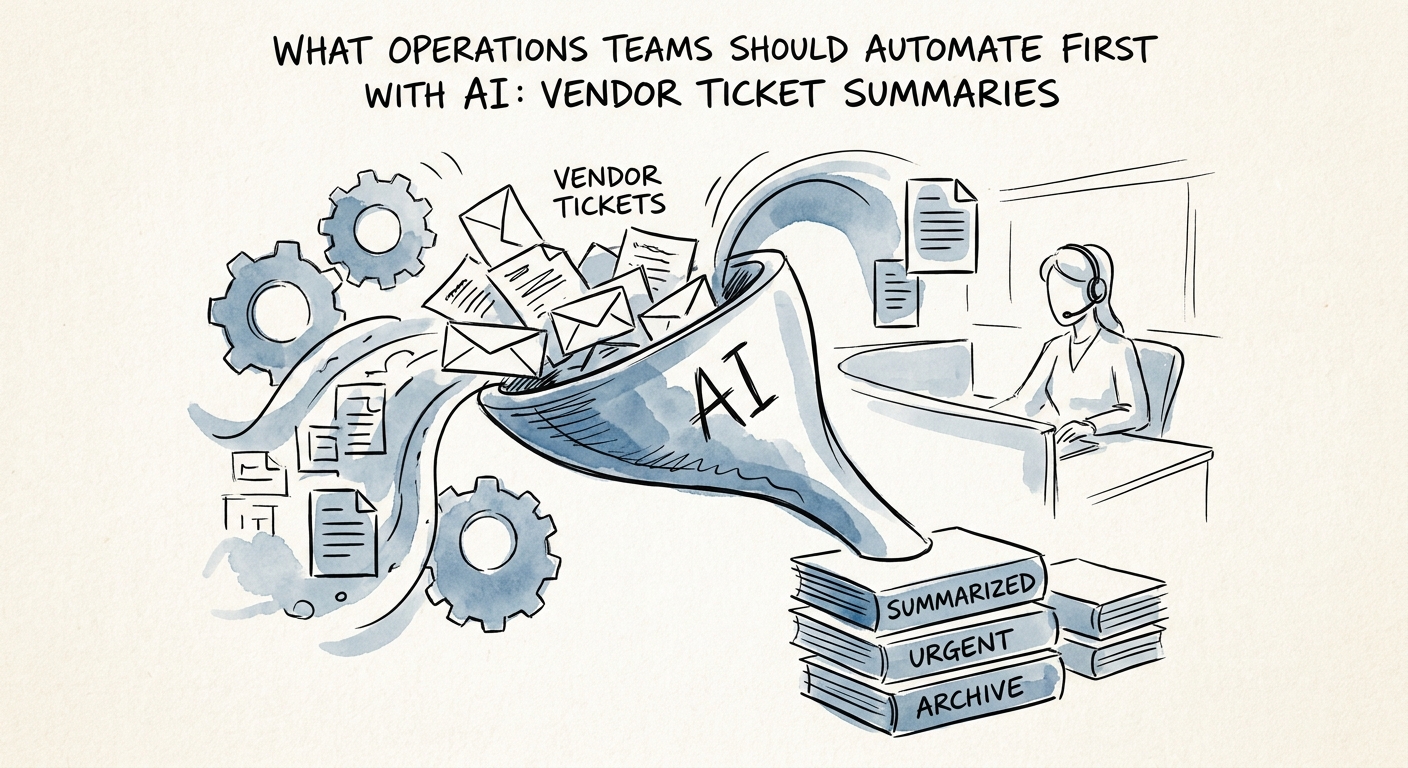
Vendor Ticket Summaries: The First Operations Workflow Worth Automating
Most vendor recaps hide the contract exposure and customer impact that should drive the weekly operating meeting. Here is how to automate the one that doesn't.
1 vendor-risk summary before the weekly operating meeting
BRIEF · AI FUNCTION USE CASES
The Deal Is Won and Stuck: Why PO Follow-Up Is Your First Sales AI Win
The contract is signed but the PO is missing a billing entity and a tax code. Here is how to put AI on post-close follow-up without letting it renegotiate the deal.
Cleaner handoff first post-sale AI outcome
BRIEF · AI KNOWLEDGE SYSTEMS
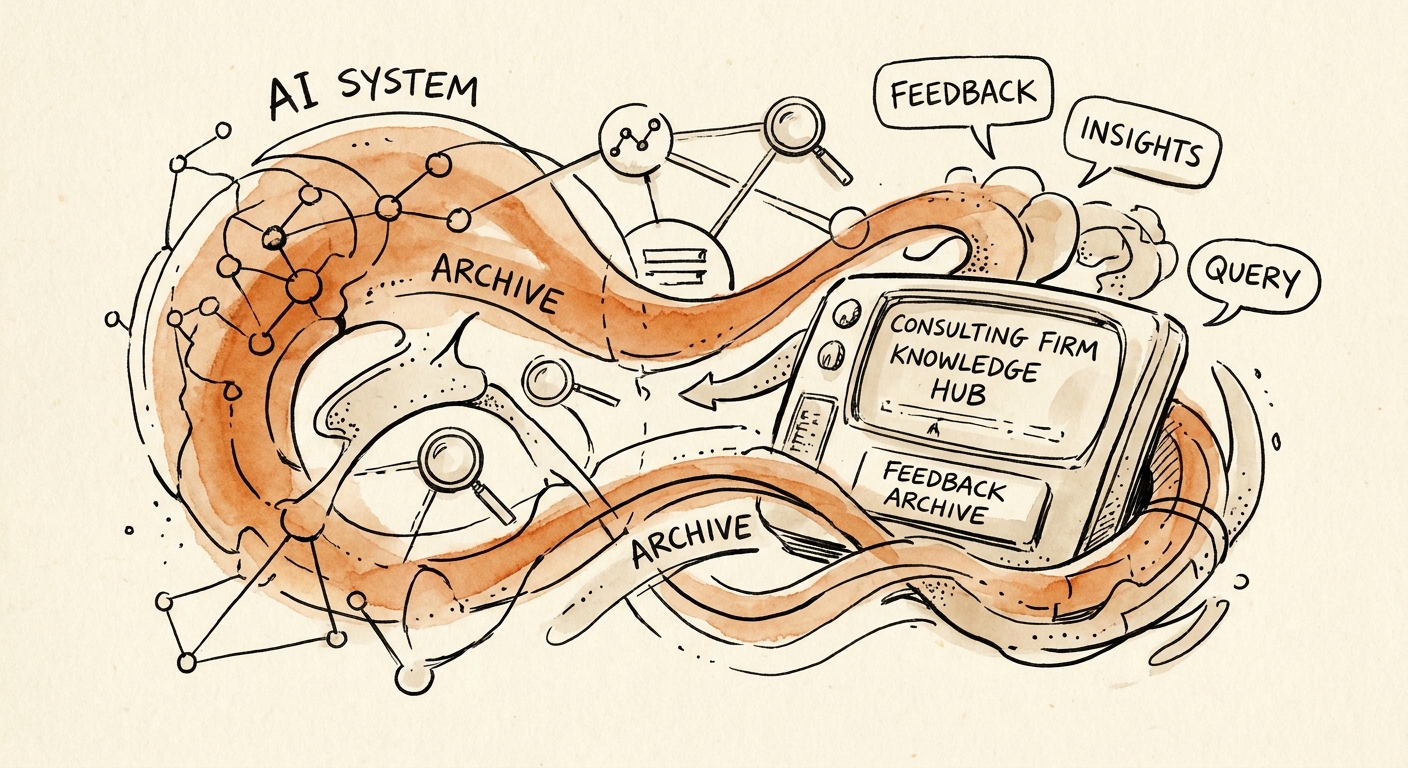
Your Best Client Feedback Is Buried. An AI Knowledge System Digs It Out — Safely
How a mid-market consulting firm turns scattered customer feedback archives into a governed AI knowledge system — without leaking restricted client data.
25% leaders moving many AI pilots into production
BRIEF · AI GOVERNANCE AND TRAINING
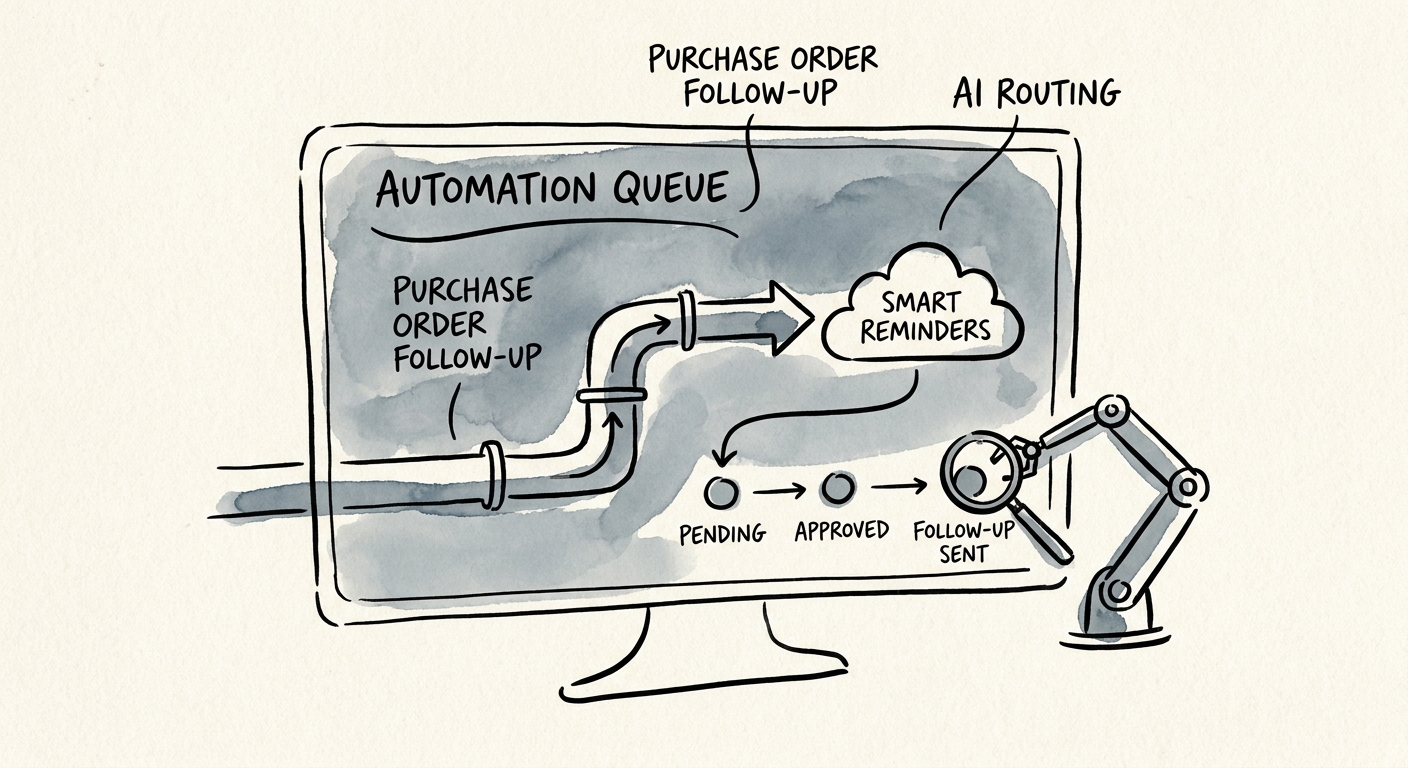
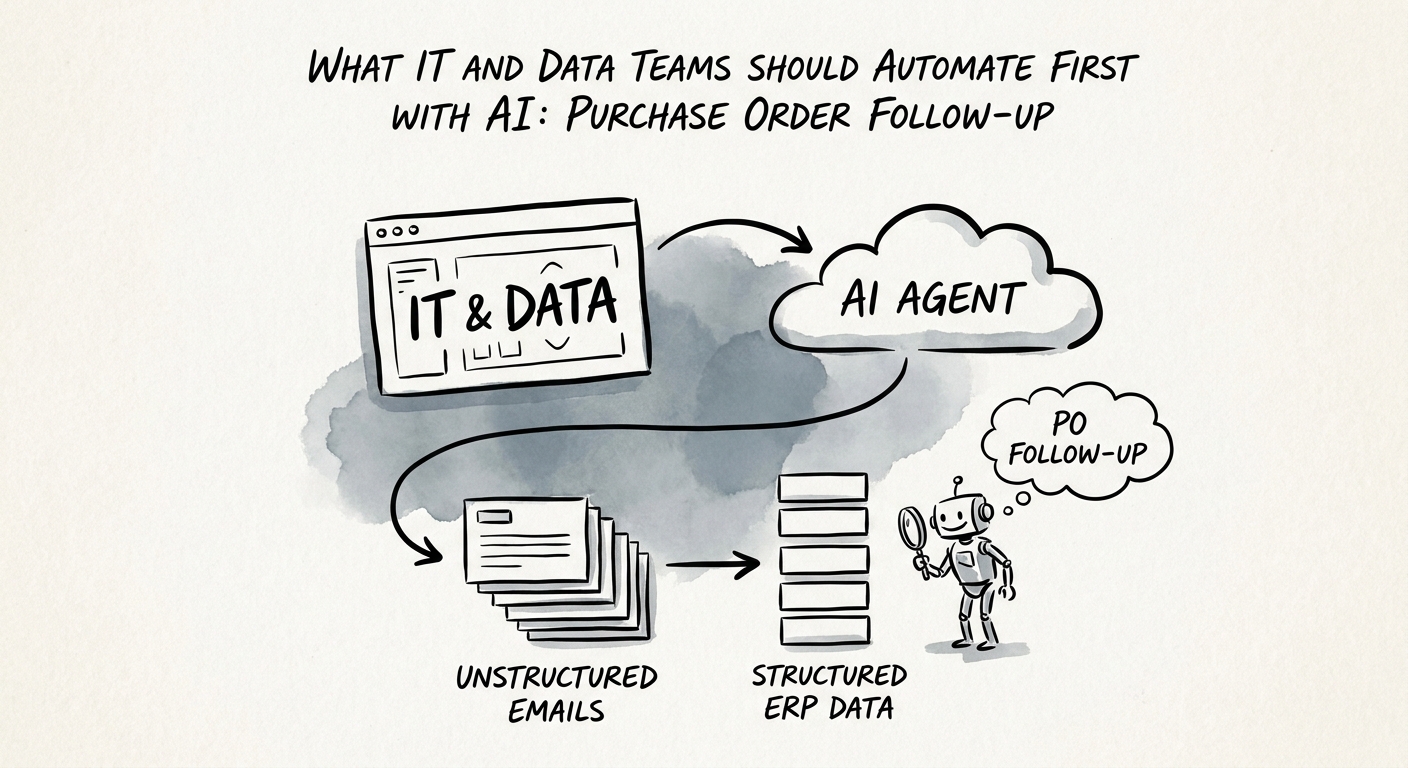
The First AI Win for IT Teams Is Boring: Chasing Stuck Purchase Orders
Purchase-order follow-up is a low-risk first AI pilot for IT and data teams. Draft the reminders, keep approval authority with finance, and prove it worked.
1 approval path One approval path with clean access rules
BRIEF · AI FUNCTION USE CASES
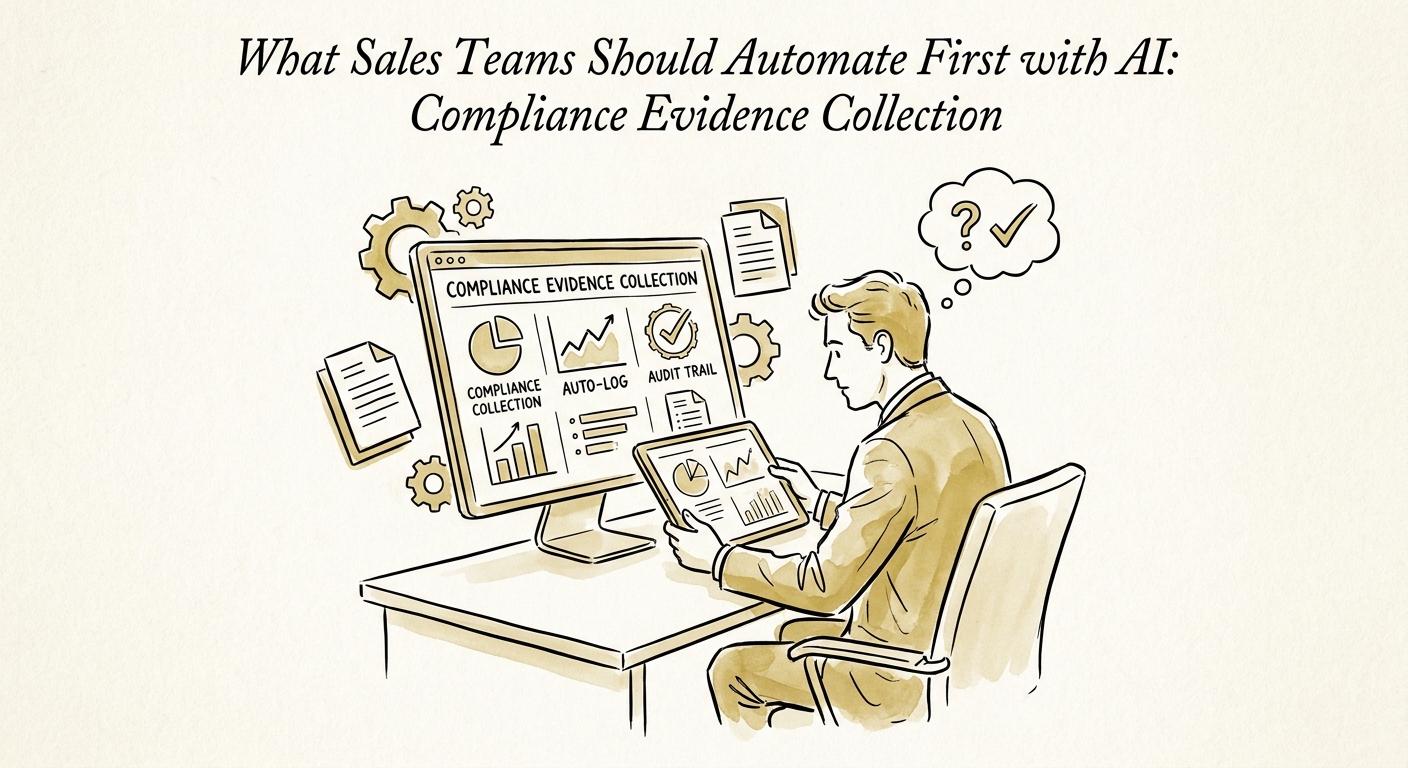
The Security Questionnaire Is Where Your Deal Dies: Automate Evidence Collection First
A 300-question security questionnaire shouldn't take three weeks. How mid-market vendors use AI to retrieve approved compliance evidence without inventing posture.
1 evidence source of record before customer submission
BRIEF · AI WORKFLOW AUTOMATION
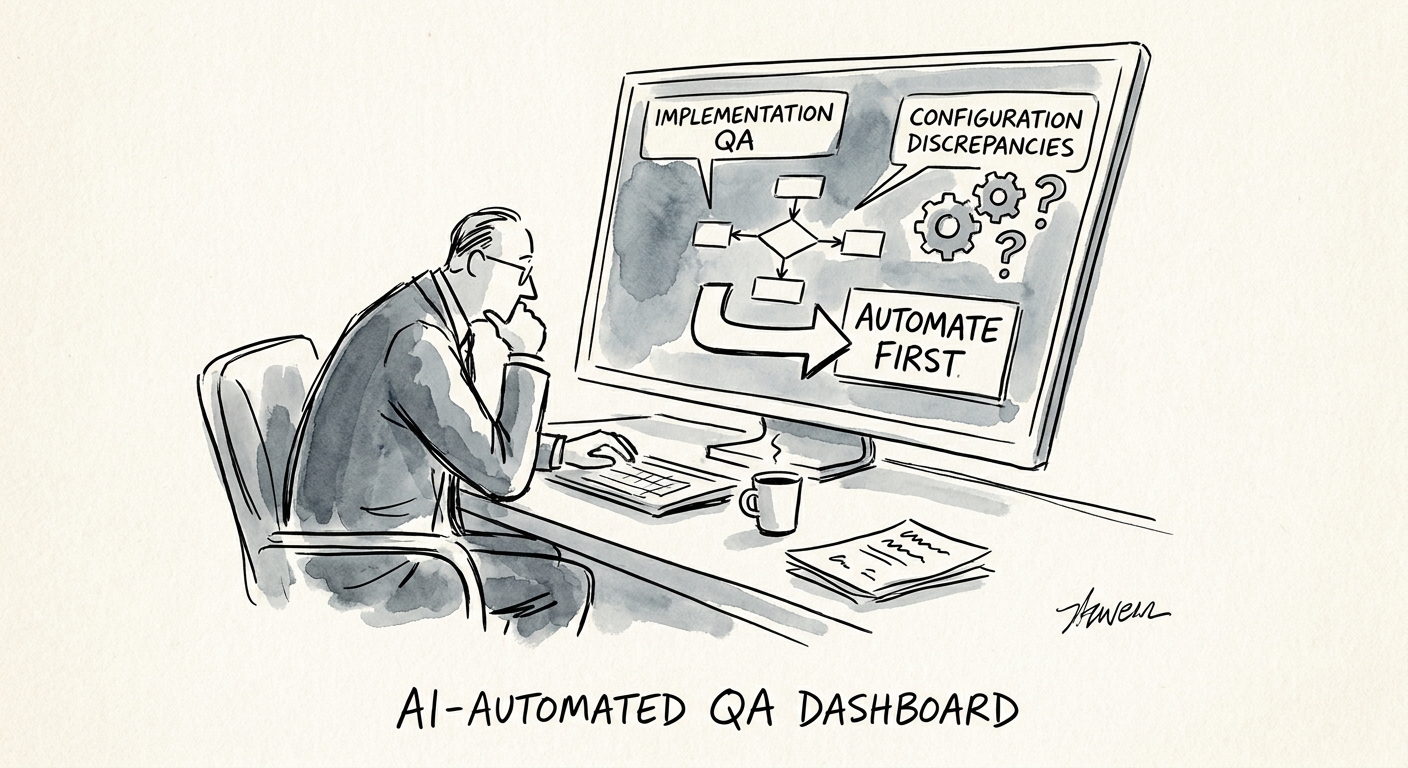
The First AI Workflow for Services Delivery Teams: Implementation QA That Catches Defects Before the Client Does
For services delivery teams, the first AI workflow worth building is implementation QA: checking each handoff against acceptance criteria before it reaches the client.
1 QA checklist to automate before broad deployment
BRIEF · AI VENDOR AND BUILD-VS-BUY
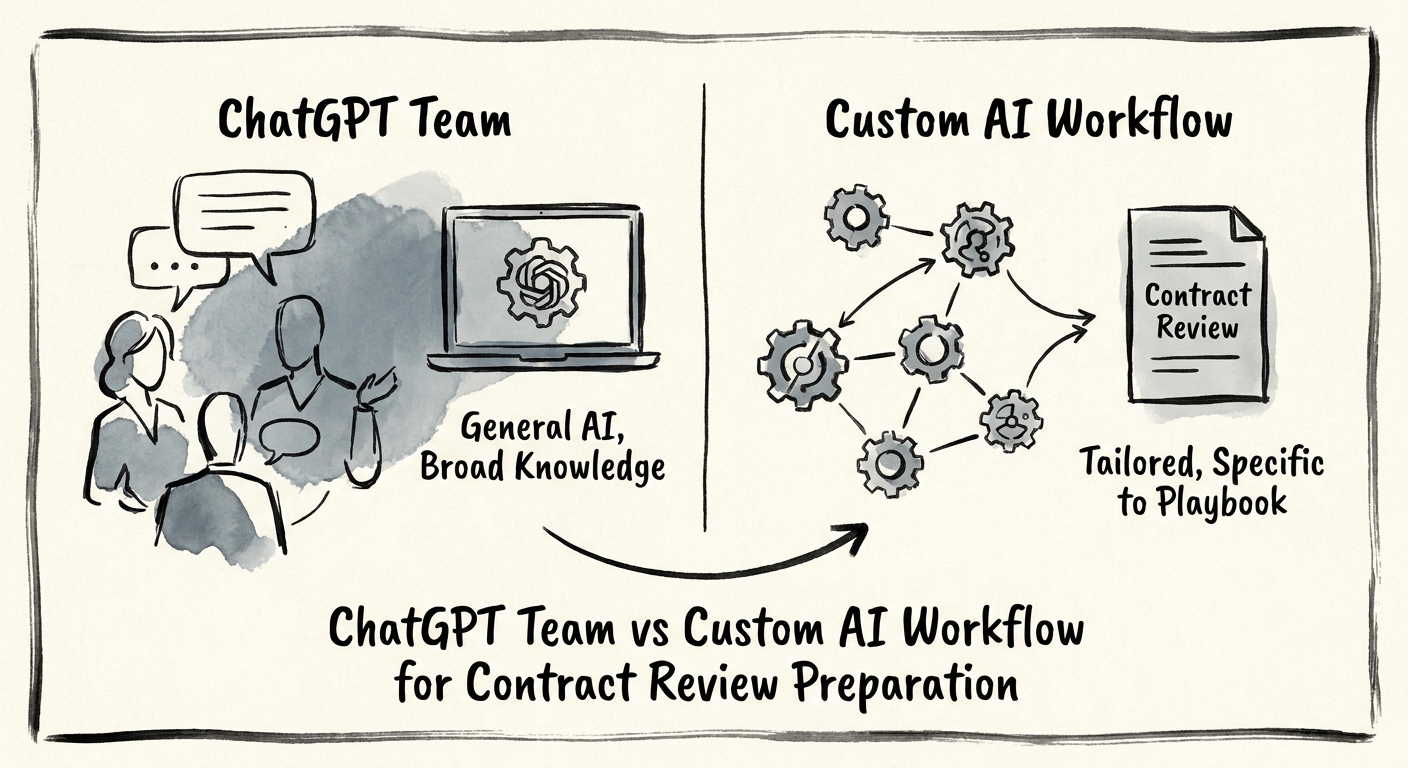
ChatGPT Team or a Custom Workflow for Contract Review? Decide by Who Owns the Redline
When a chat assistant beats a custom AI contract-review workflow for a services firm, and the exact line where the MSA, the renewal clause, and the approval trail force you to build.
2 paths assistant workspace or custom workflow
BRIEF · AI TRANSFORMATION STRATEGY
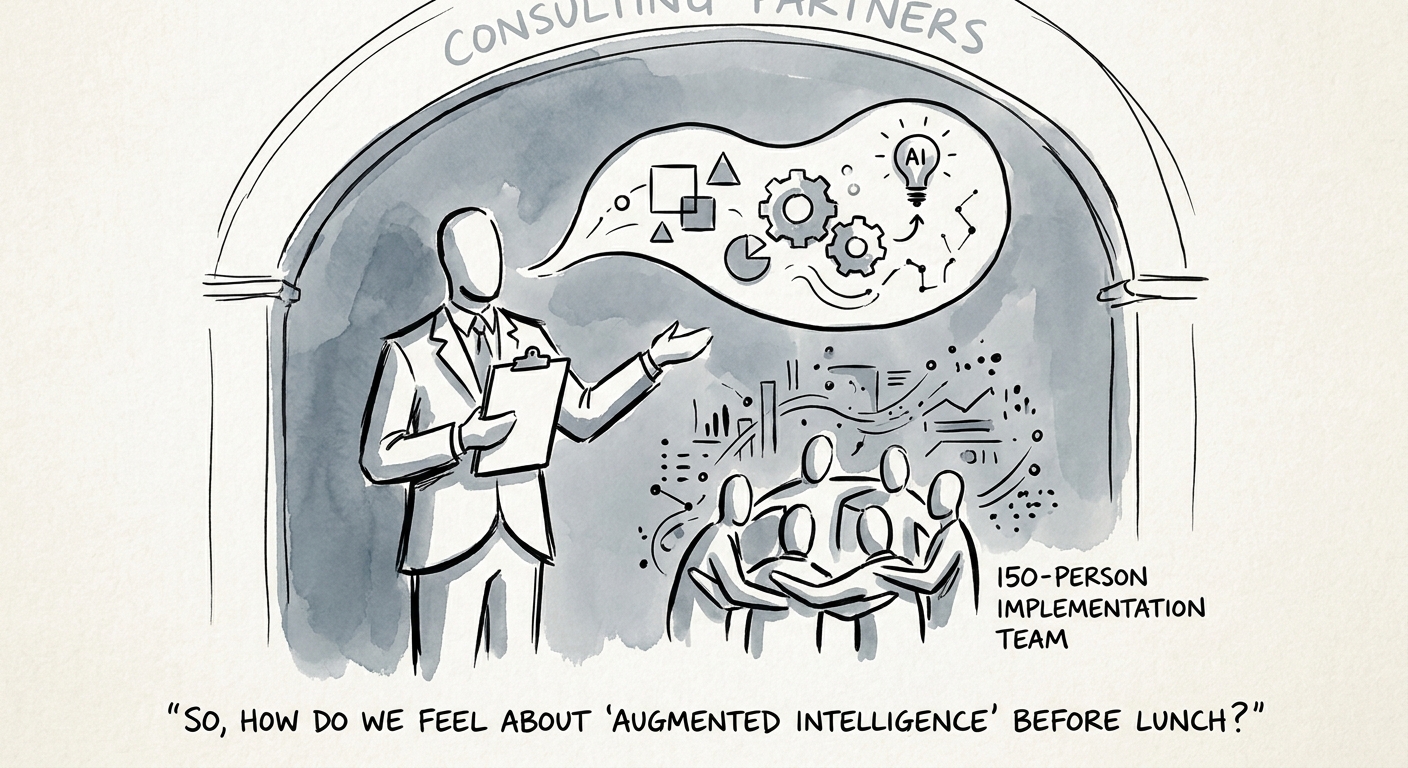
The AI Readiness Assessment a 150-Person Implementation Partner Actually Needs
For a 150-person software implementation partner, AI readiness lives in your SOWs and utilization data, not a platform demo. Where to start, and what to score.
32% AI use at 100-249 employee firms
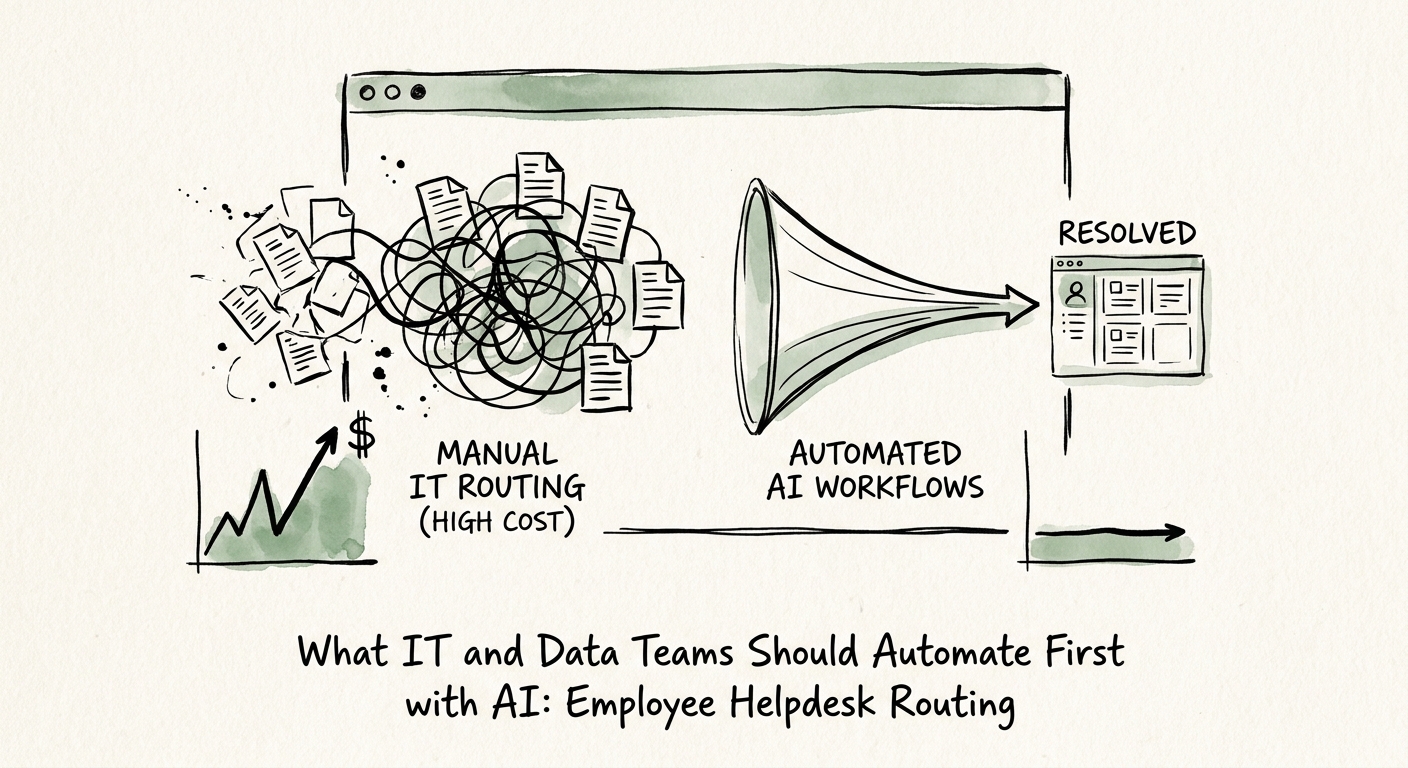
BRIEF · AI GOVERNANCE AND TRAINING
Why Helpdesk Routing Is the First AI Win Your IT Team Should Ship
Ticket misrouting burns days before anyone touches the real problem. Here's how IT teams ship AI helpdesk routing that proves out in 90 days.
30-60-90 implementation path from pilot to governed workflow
BRIEF · AI FUNCTION USE CASES
The First AI Win for Sales: Stop Walking Into Renewals Blind to the Support Queue
Your account owner is one tab away from the seven open tickets that will sink the renewal. Here's how to make AI surface ticket history ahead of the call.
1 vendor queue One vendor queue connected to account action
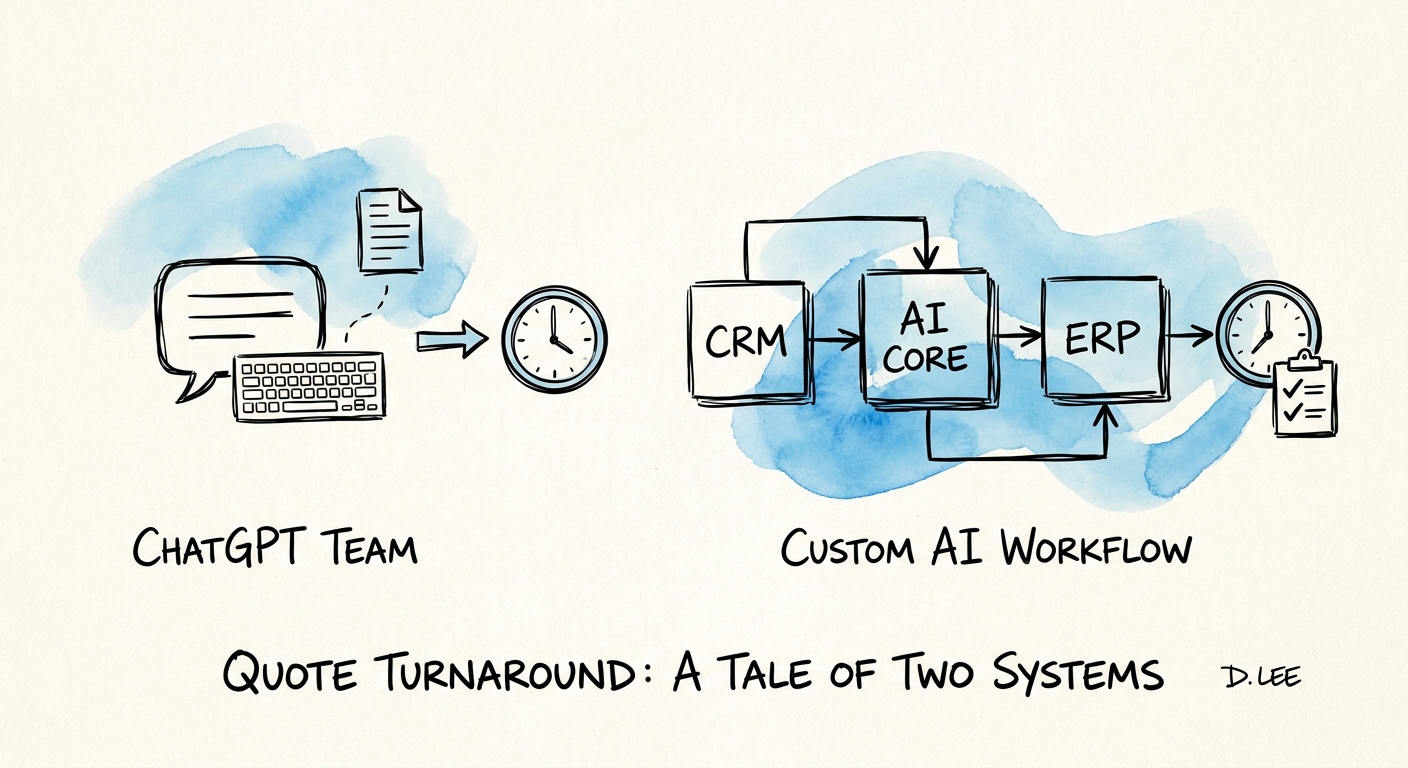
BRIEF · AI VENDOR AND BUILD-VS-BUY
ChatGPT Team or a Custom Workflow for Quote Turnaround: The Pricing Question Decides It
A wrong quote is worse than a slow one. How services firms decide whether quote turnaround belongs in ChatGPT Team or a custom workflow tied to live pricing.
3 decision checks before automating quote turnaround
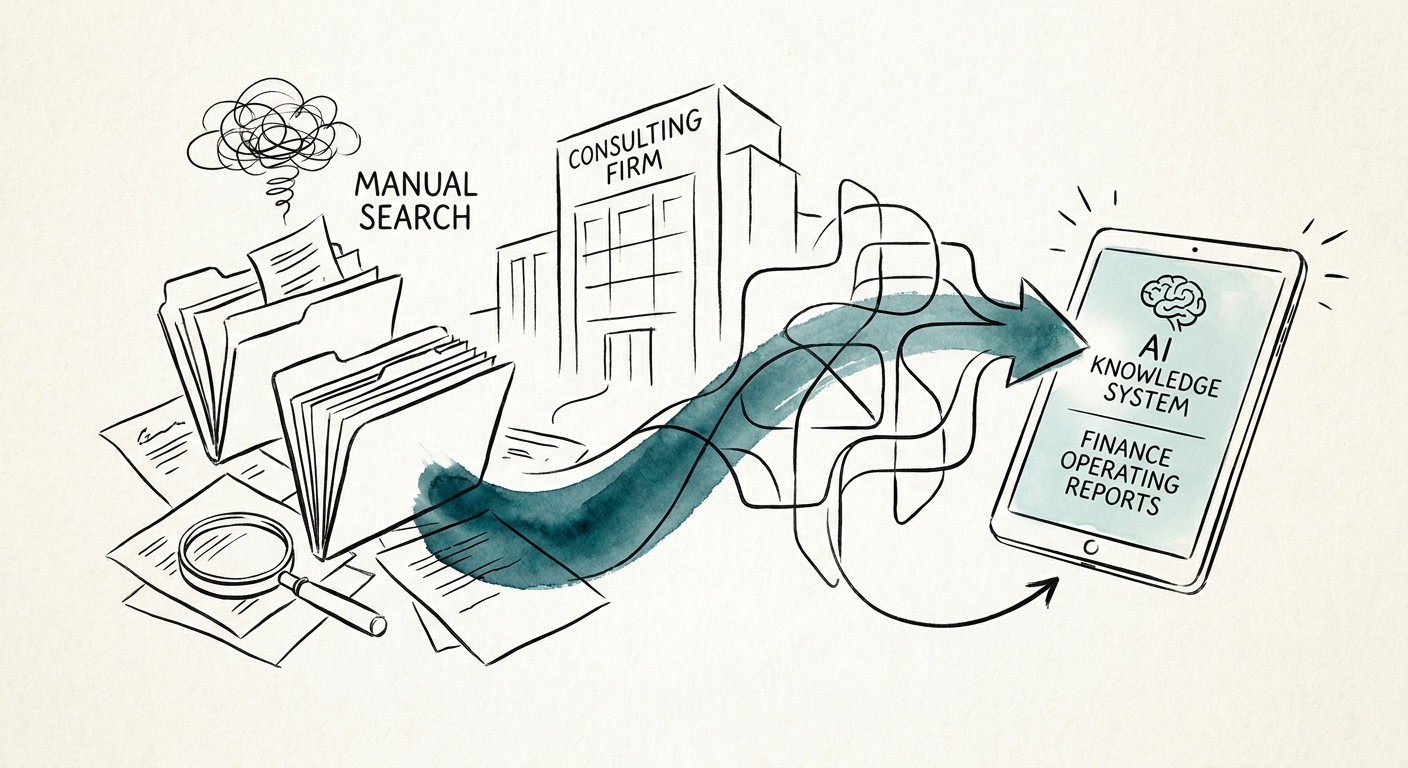
BRIEF · AI KNOWLEDGE SYSTEMS
When a Partner Quotes Last Quarter's Margins to a Client: AI Knowledge Systems for Consulting Finance Reports
Why consulting firms keep citing stale finance operating reports in front of clients, and how a governed AI retrieval layer fixes the version-control problem.
32% AI use at 100-249 employee firms