BRIEF · AI FUNCTION USE CASES
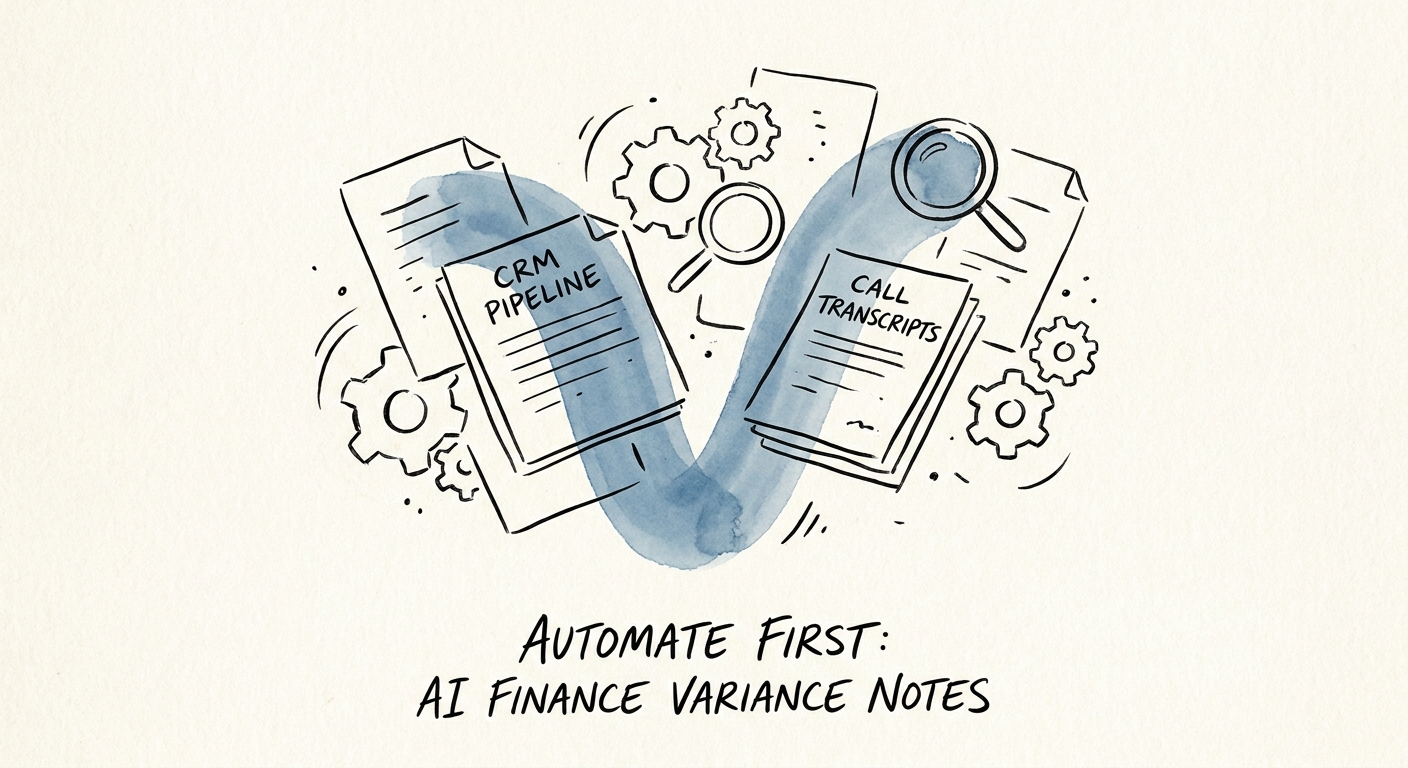
The First AI Win for Sales Ops: Variance Notes That Explain Why the Forecast Moved
A worked guide to using AI to draft finance variance notes from CRM activity — so your forecast call argues about action, not about why the number changed.
Manager-ready notes first sales-finance AI output
BRIEF · AI MEASUREMENT AND ROI
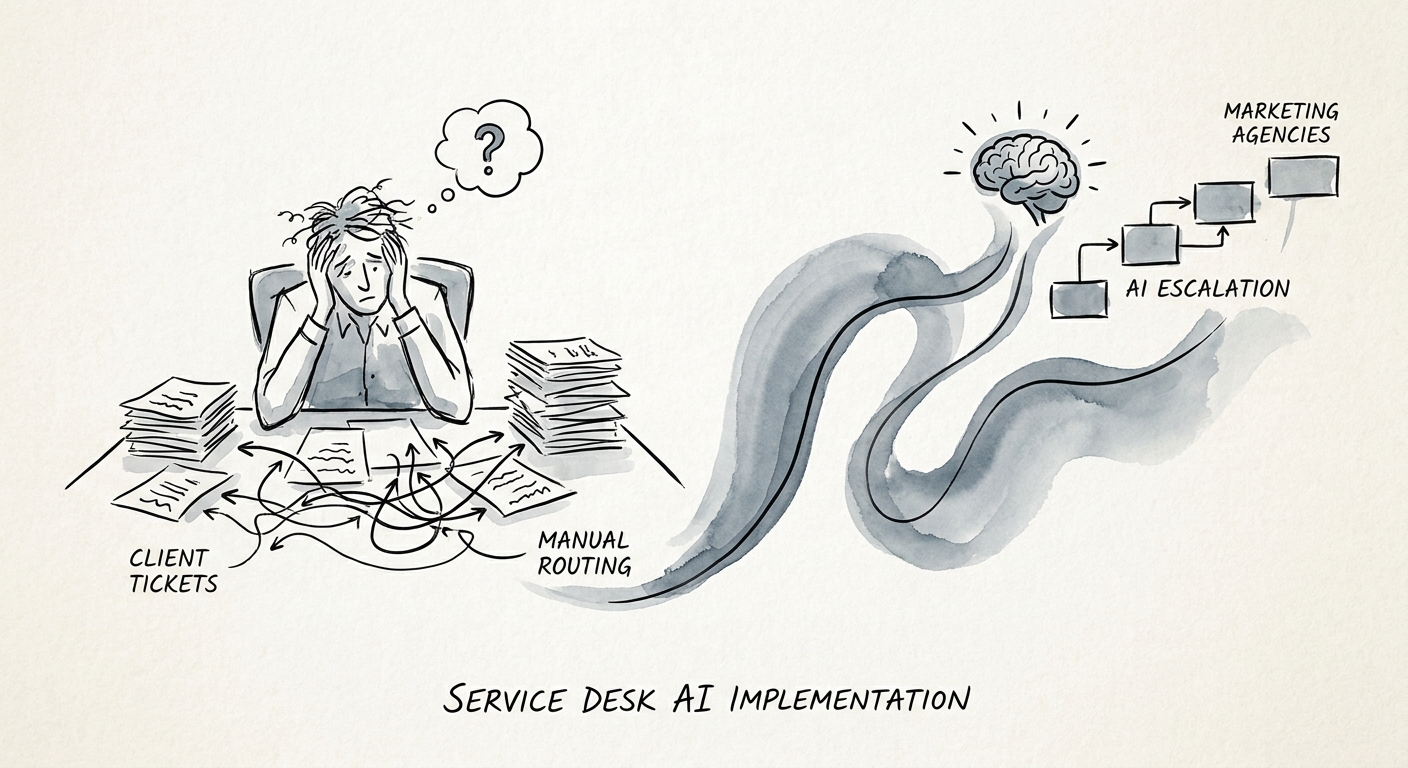
AI for Agency Escalations: Routing the "This Is on Fire" Email
How marketing agencies can use AI to triage client escalations — what to route, what to draft, and what a senior must still own. A 30-60-90 path.
30-60-90 implementation path from pilot to governed workflow
BRIEF · AI MEASUREMENT AND ROI
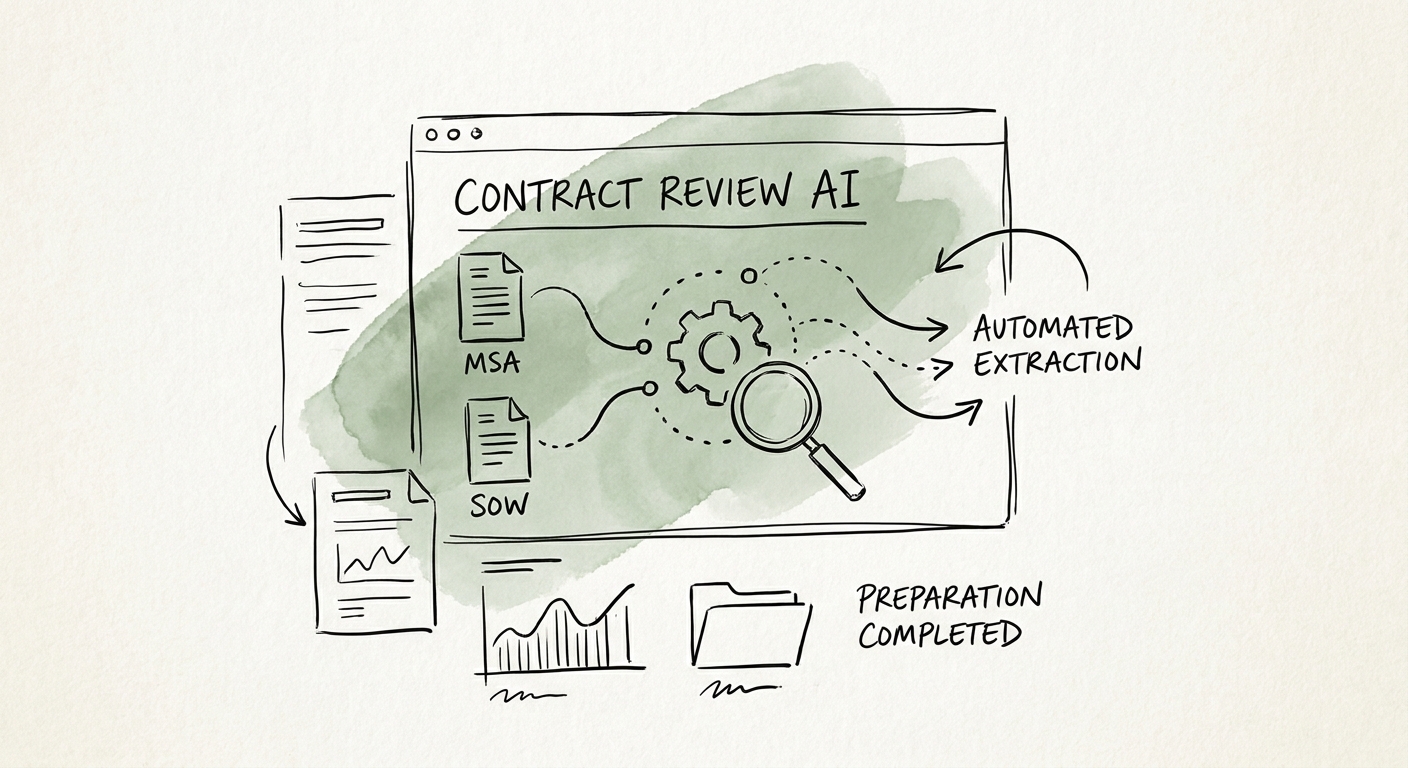
How Agencies Catch Scope Creep in Contracts Before It Eats the Margin
A practical way for marketing agencies to use AI on MSAs and SOWs — flagging unlimited revisions, IP grabs, and out-of-scope language before signature.
32% AI use at 100-249 employee firms
BRIEF · AI FUNCTION USE CASES
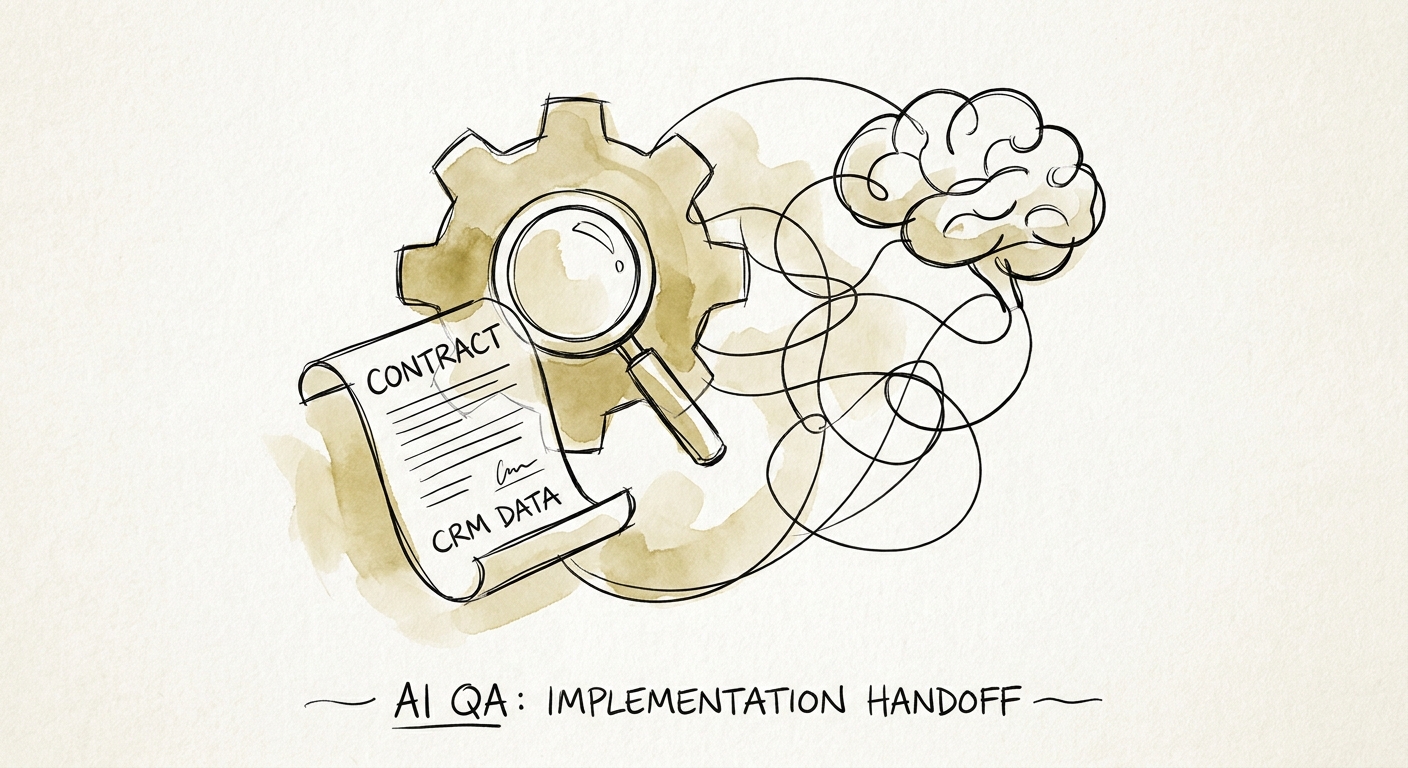
The First AI Workflow for B2B Sales Teams: Catch Scope Drift Before Kickoff
The gap between what sales sold and what delivery kicks off is where margin leaks. Here's how to point AI at the handoff packet first, and what it actually catches.
Cleaner handoff first implementation QA outcome
BRIEF · AI MEASUREMENT AND ROI
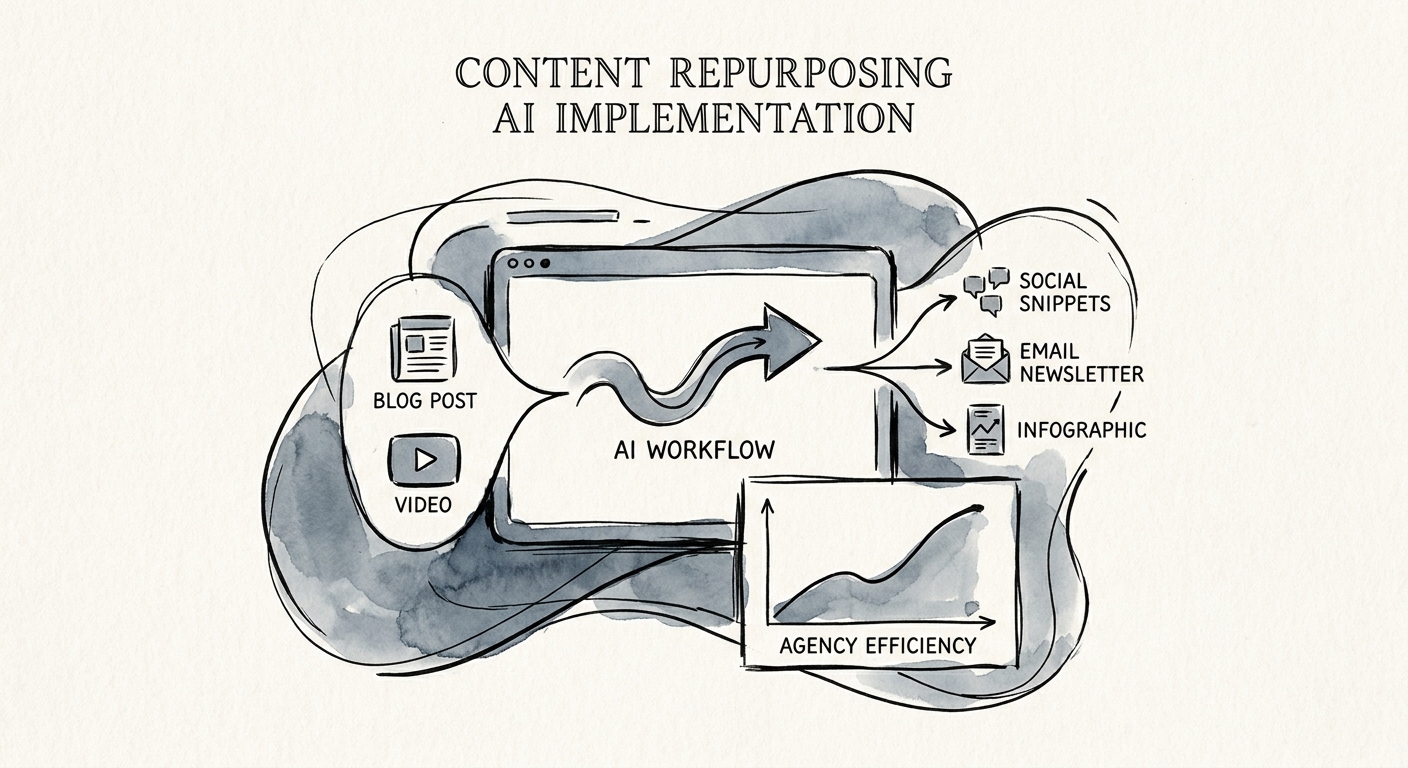
AI Content Repurposing for Agencies: Turn One Webinar Into Twelve Assets Without Wrecking the Brand
How agencies use AI to repurpose a webinar or report into a dozen channel-ready assets — without diluting client brand voice or shipping unsubstantiated claims.
4 content controls before scale
BRIEF · AI TRANSFORMATION STRATEGY
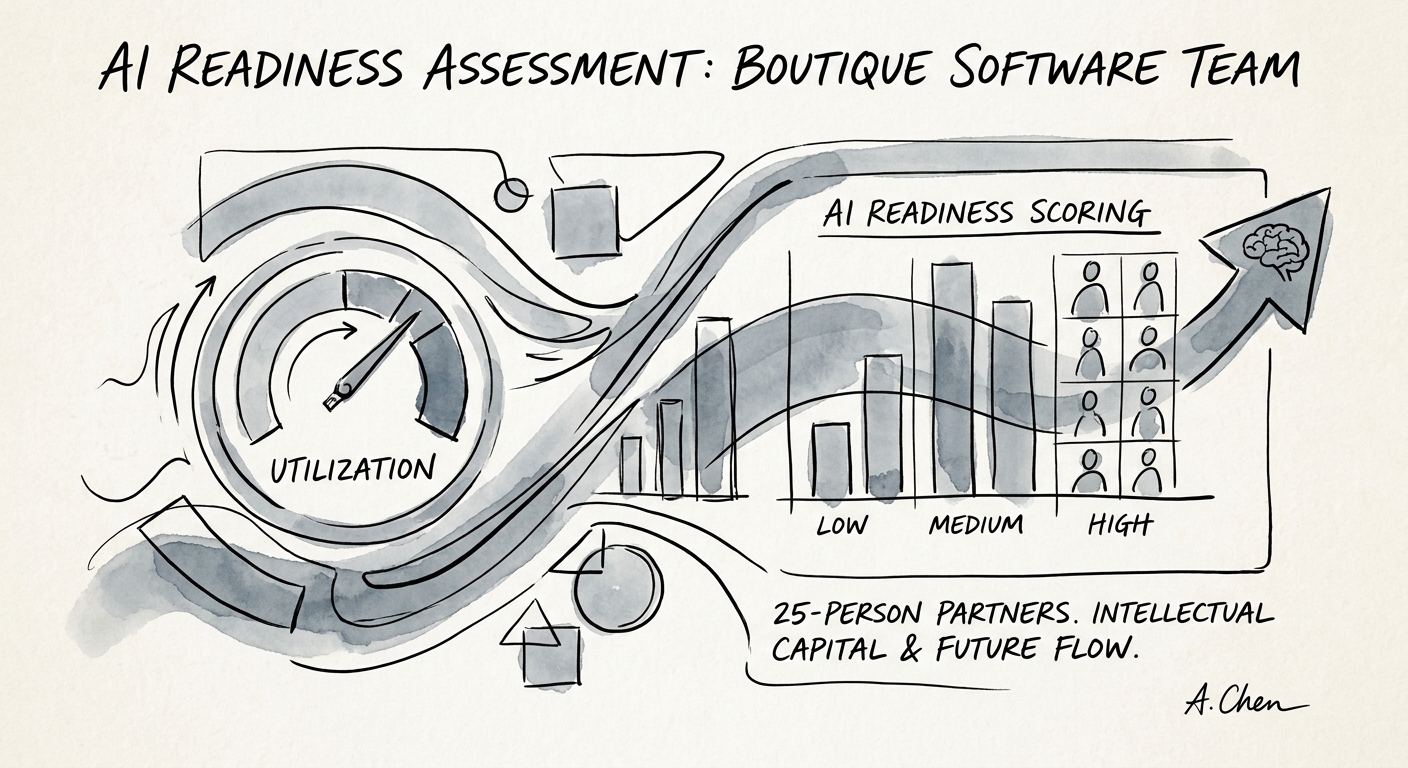
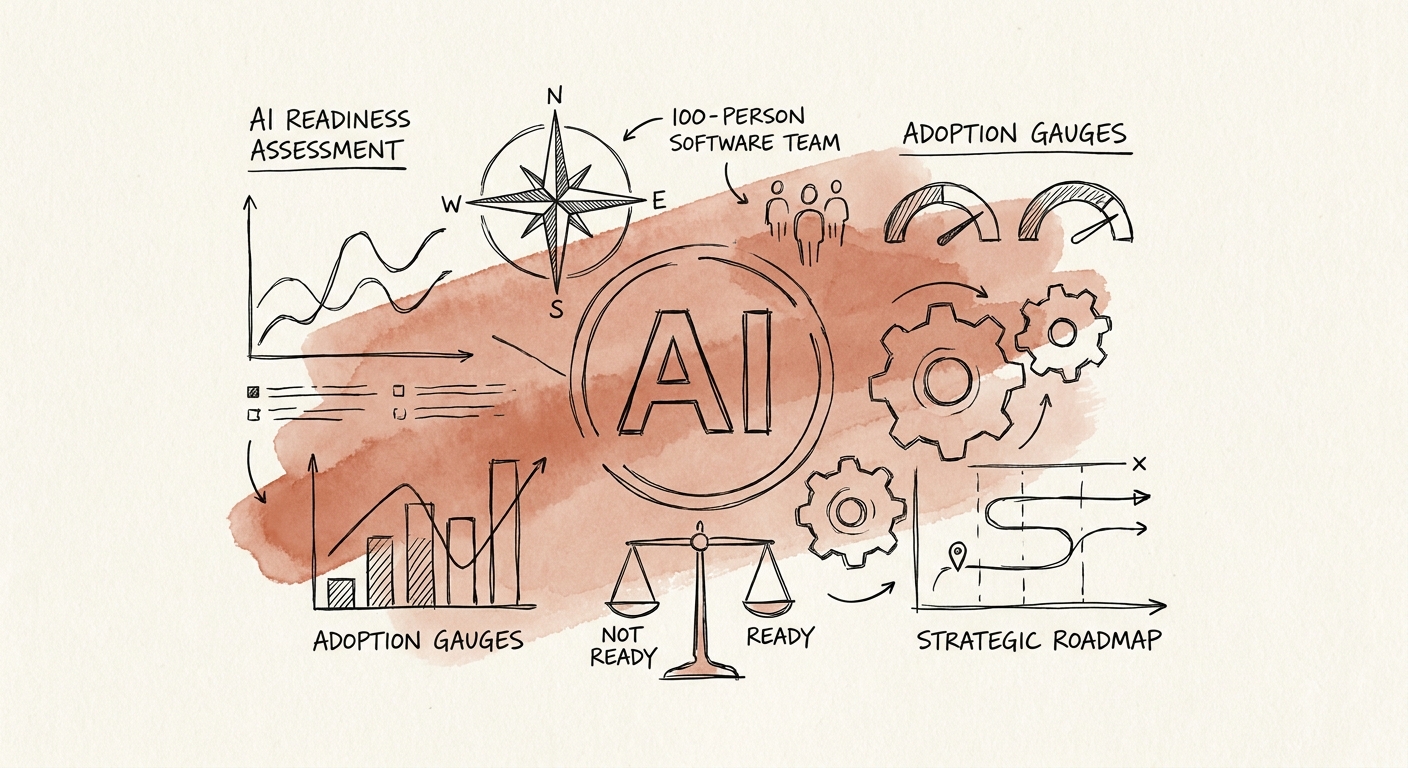
AI Readiness for a 25-Person Implementation Partner: Score the Delivery Drag First
A 25-person implementation shop should score five readiness checks before buying AI: where senior architects leak billable hours and which SOW-to-config gap actually costs margin.
5 readiness checks before the first AI workflow
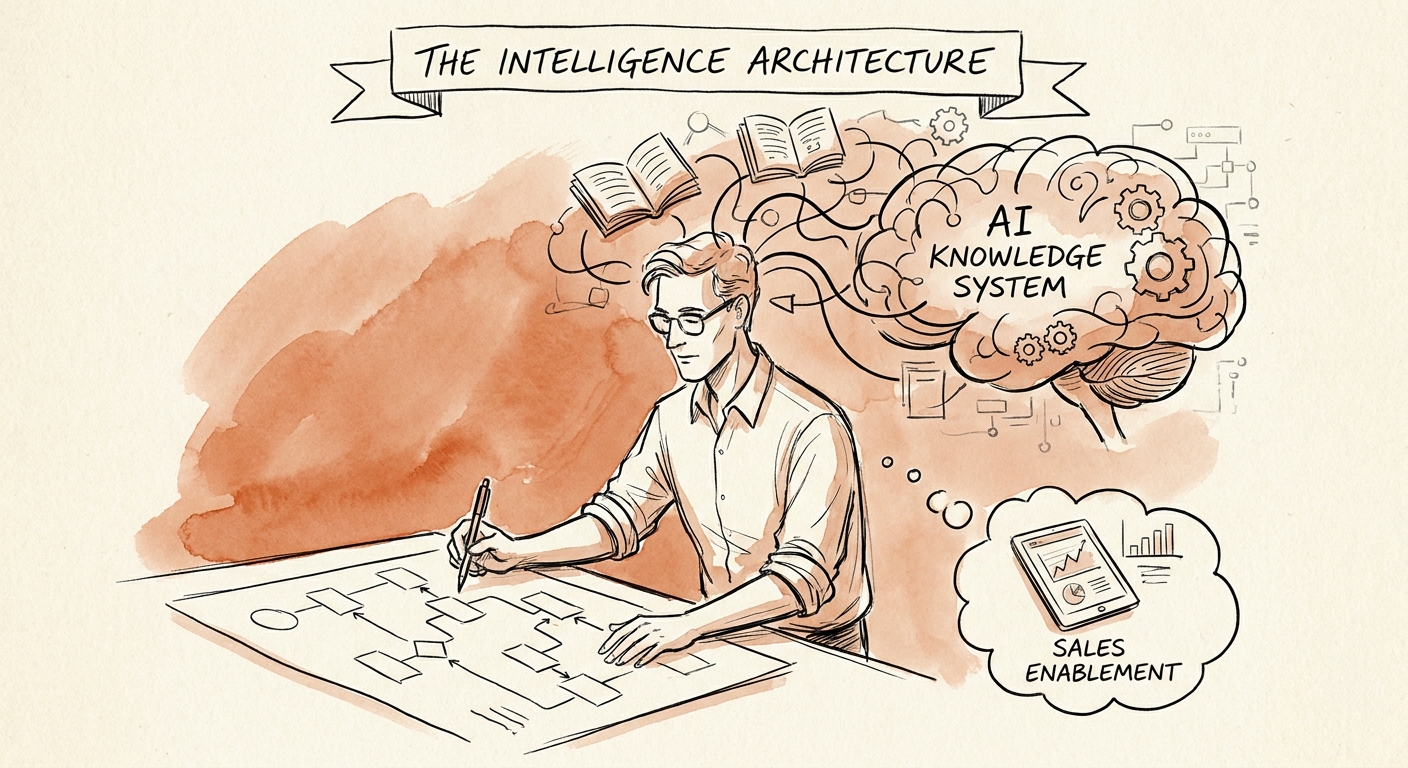
BRIEF · AI KNOWLEDGE SYSTEMS
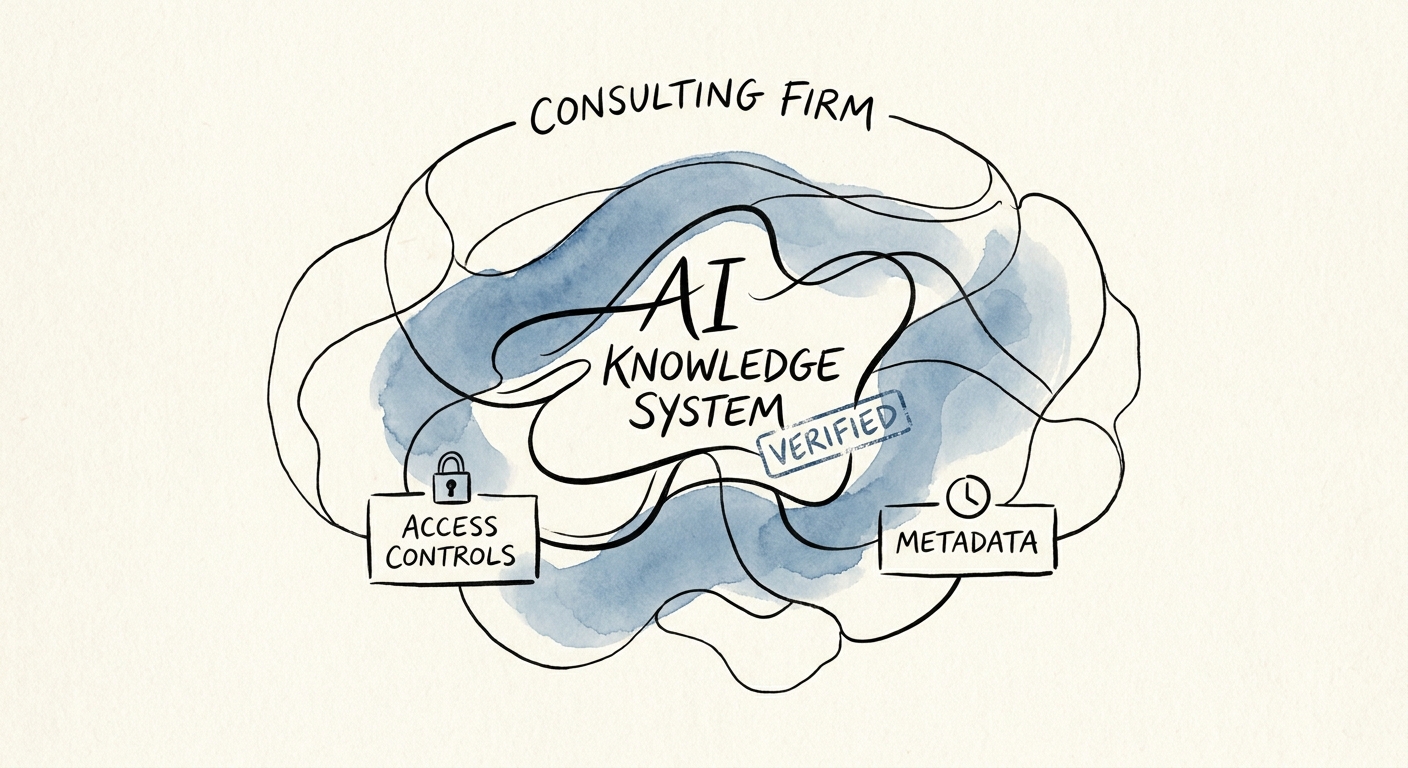
Why Your Consulting Firm's AI Knowledge Base Keeps Surfacing the Wrong Client's Answer
A consulting firm's AI knowledge base fails the day it serves Client A's playbook to a Client B engagement. Here's how to build retrieval that won't.
3 controls before launch
BRIEF · AI FUNCTION USE CASES
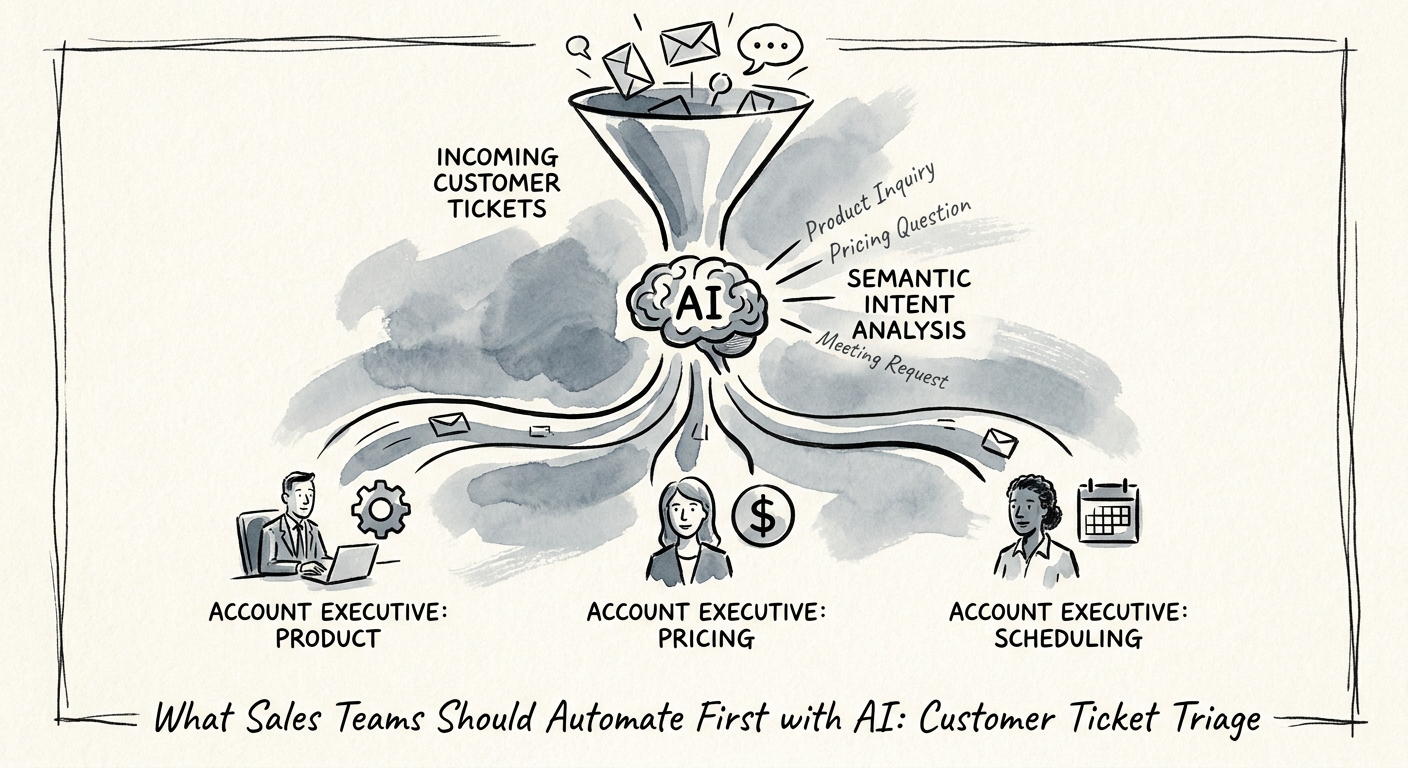
Why Ticket Triage Beats Prospecting as Your First Sales AI Project
A B2B services queue where a renewal complaint sits two days behind billing questions is the perfect first AI automation. Here is how to scope it.
Faster routing first sales support outcome
BRIEF · AI WORKFLOW AUTOMATION
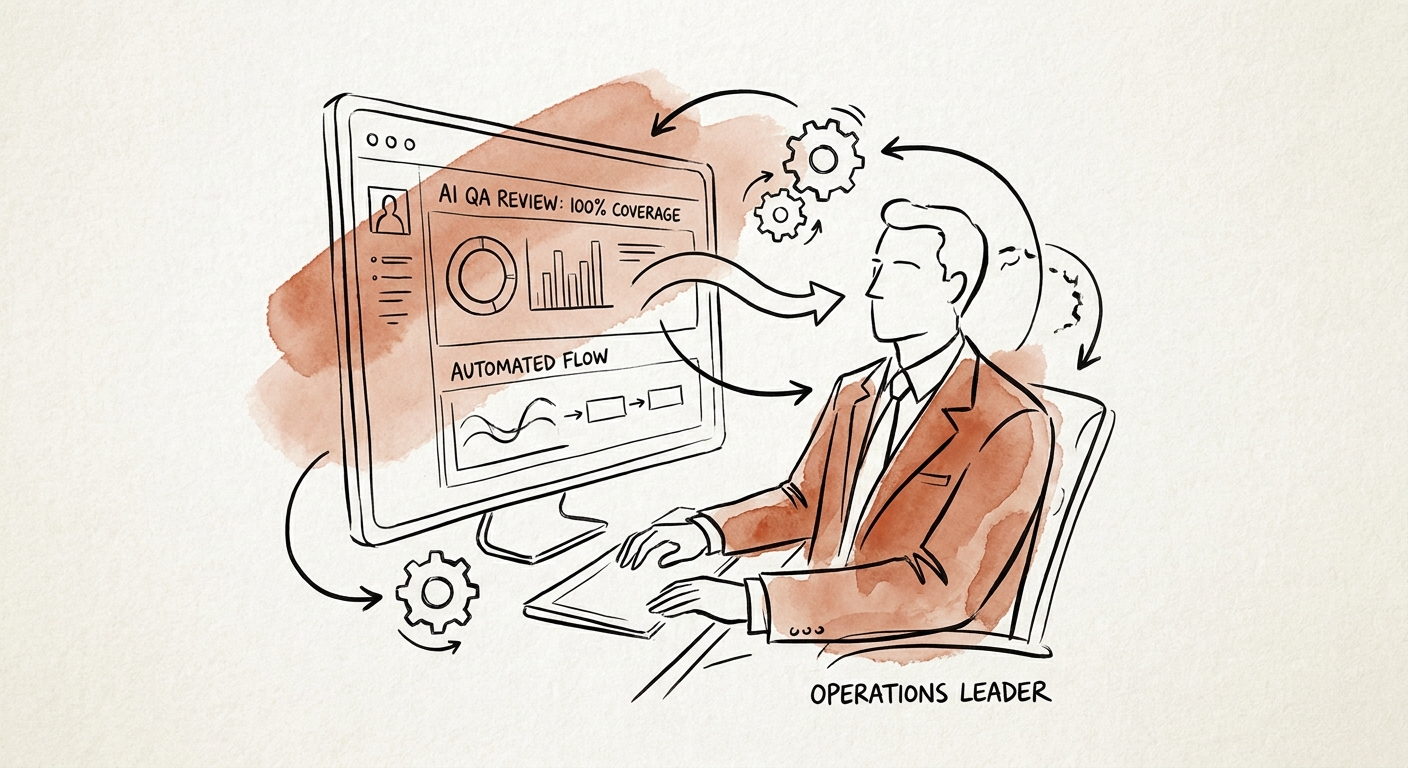
The First AI Workflow Operations Should Automate: QA That Reads Every Ticket, Not 12
Most B2B services QA reviews 5% of work and calls it a sample. Here's why AI-assisted quality review is the safest first automation — and how to scope it.
1 record type to prove first
BRIEF · AI KNOWLEDGE SYSTEMS
What Your Kickoff Notes Actually Hold (and Why AI Keeps Getting It Wrong)
Why an AI layer over your kickoff and onboarding notes fails when it can't tell what the client promised from what your team assumed. A practical fix.
37% AI use at firms with 250+ employees
BRIEF · AI VENDOR AND BUILD-VS-BUY
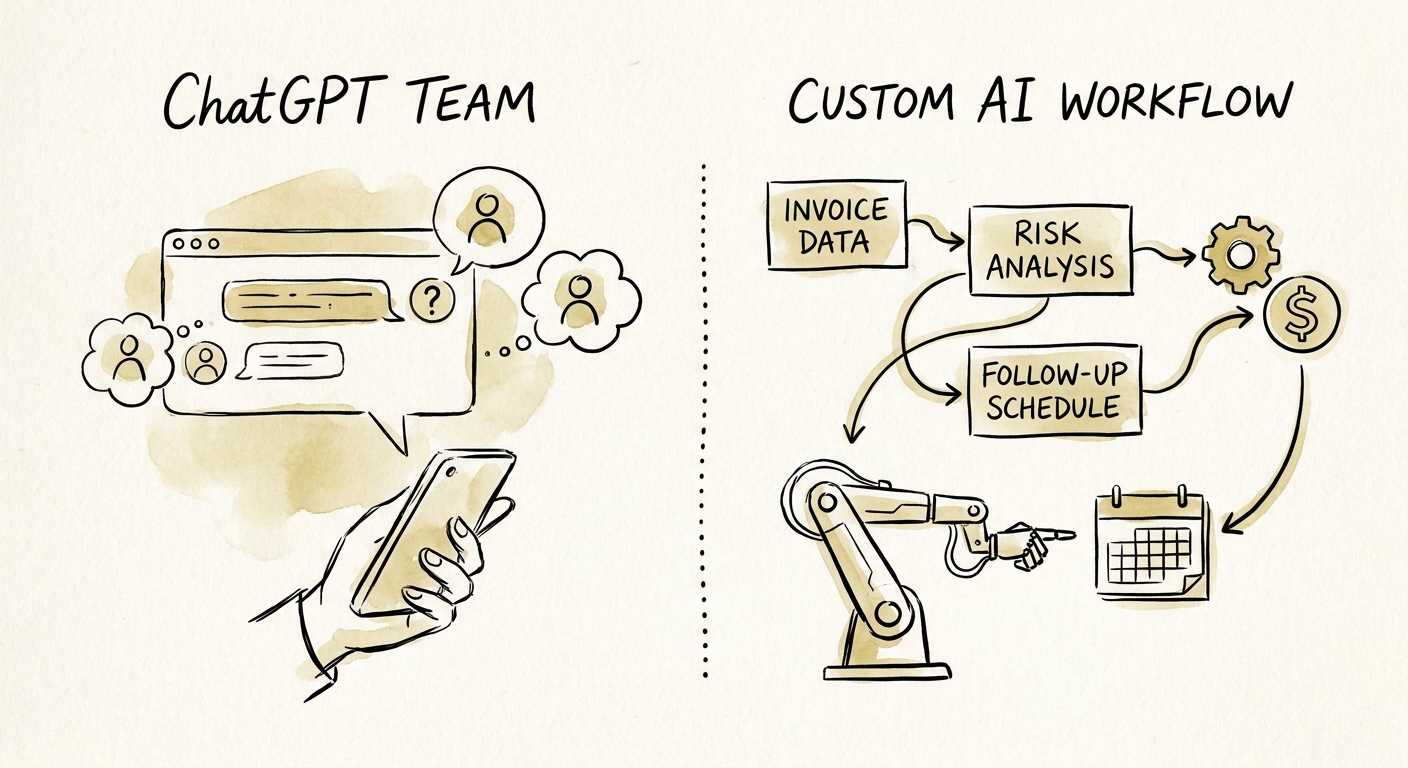
ChatGPT Team or a Custom AI Workflow for Collections? It Depends on Where Your DSO Hides
A collector spends most of a dunning cycle hunting context, not writing. Here's how to decide if ChatGPT Team or a custom AI workflow fixes your AR follow-up.
2 paths to compare
BRIEF · AI GOVERNANCE AND TRAINING
The First IT Workflow to Hand AI Isn't Password Resets — It's the Ticket Nobody Reads Right
The misrouted ticket — not the password reset — is what drains your senior engineers. Why AI-assisted escalation triage is the smartest first IT automation.
1 queue family to prove first
BRIEF · AI KNOWLEDGE SYSTEMS
The Stale Case Study Problem: An AI Knowledge System for a Consulting Firm's Sales Library
Consultants paste last year's rate card into a live proposal. Here's how to build a governed AI knowledge system over your sales enablement library that retrieves only the approved version.
25% leaders moving many AI pilots into production
BRIEF · AI MEASUREMENT AND ROI
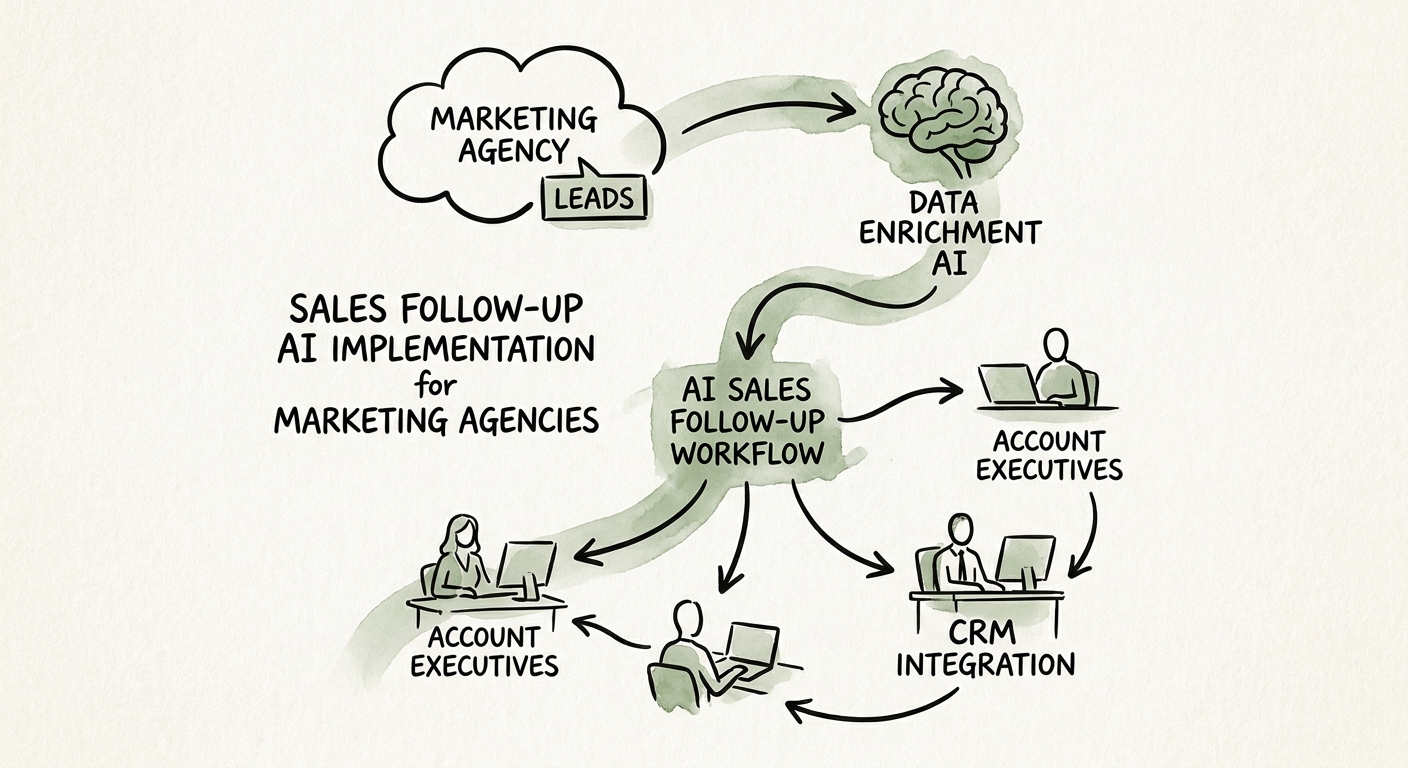
AI Sales Follow-Up for Marketing Agencies: Where It Helps and Where It Burns a Retainer
Agency follow-up is relationship work, not volume work. Where AI drafting actually helps a marketing shop, where it risks a client, and how to test it on one motion.
1 follow-up path One follow-up path tied to pipeline quality
BRIEF · AI FUNCTION USE CASES
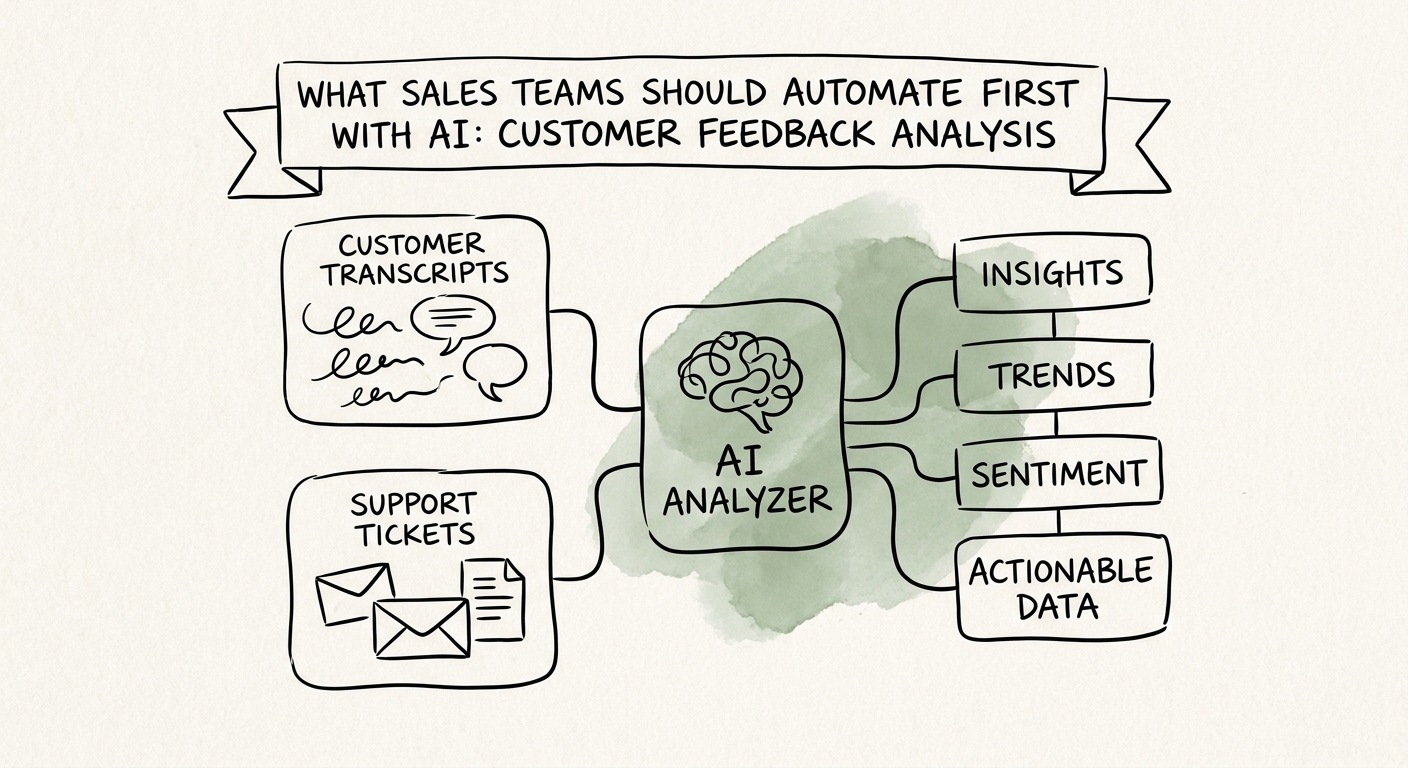
The First AI Job for a Sales Team: Turn Feedback Into a Changed Account Plan
Most "voice of customer" AI produces sentiment nobody acts on. Here's how a B2B sales team makes feedback analysis the first workflow that changes account plans.
Reviewed account signals first customer-feedback AI output
BRIEF · AI WORKFLOW AUTOMATION
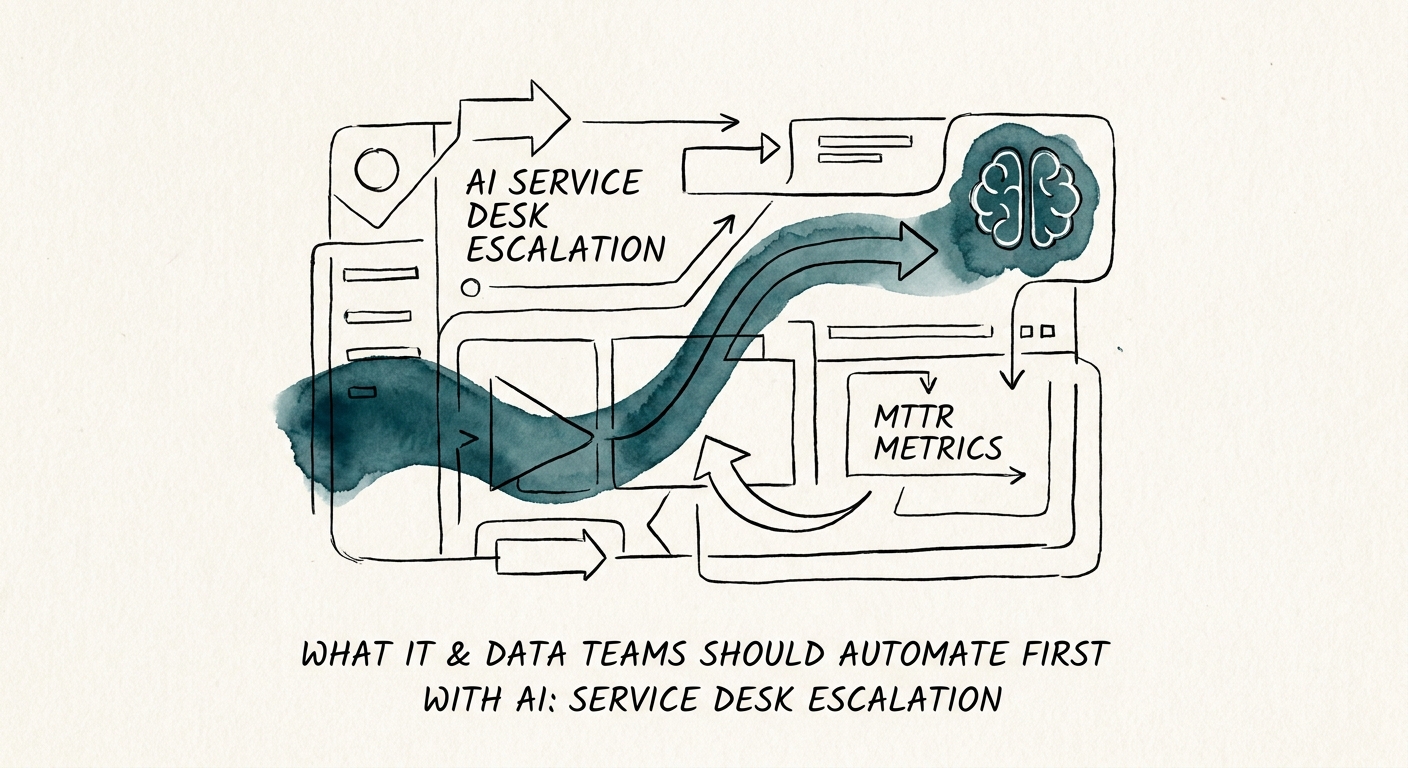
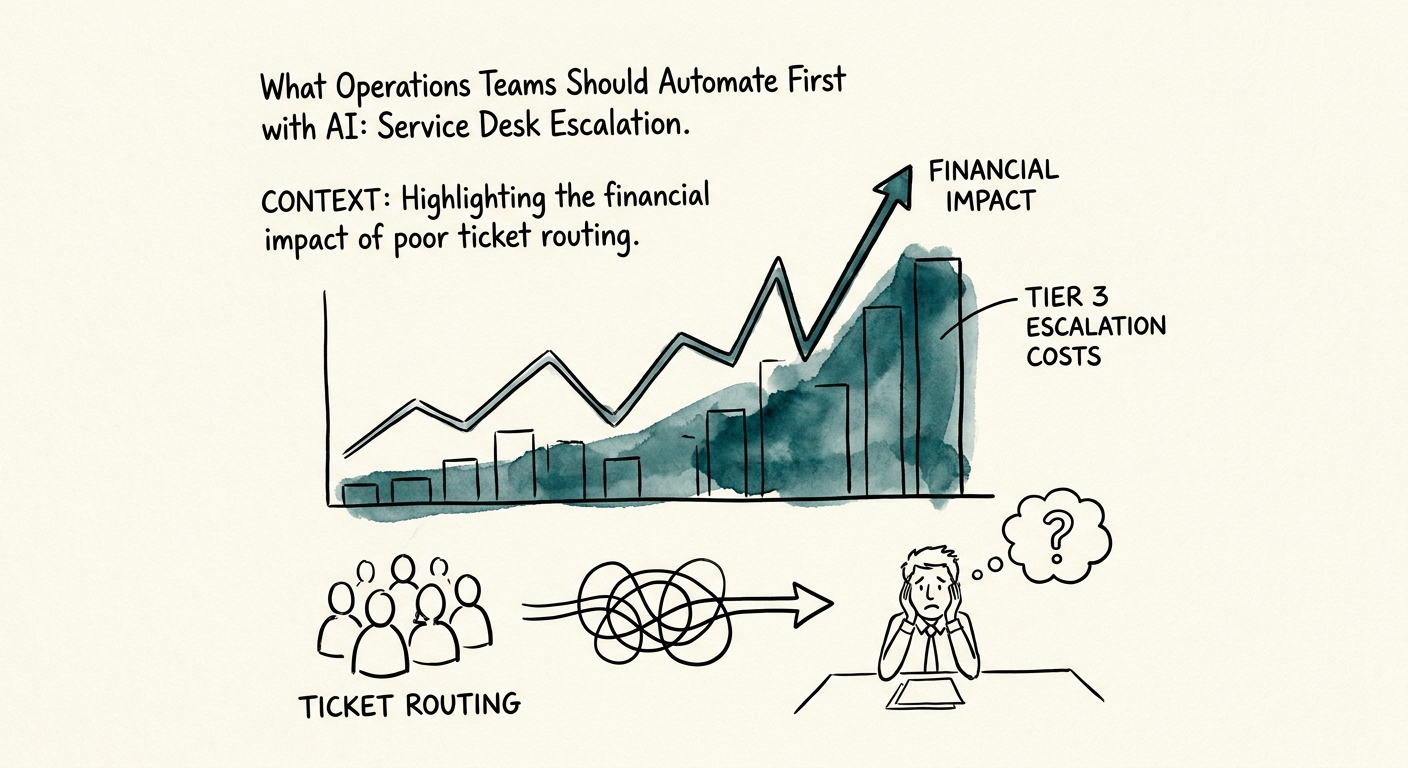
The First AI Workflow Ops Teams Should Build: Smarter Service Desk Escalation
Why service desk escalation is the smartest first AI workflow for ops teams — and the severity, SLA, and owner trail that keeps it from over-routing the queue.
1 escalation path with source rationale
BRIEF · AI KNOWLEDGE SYSTEMS
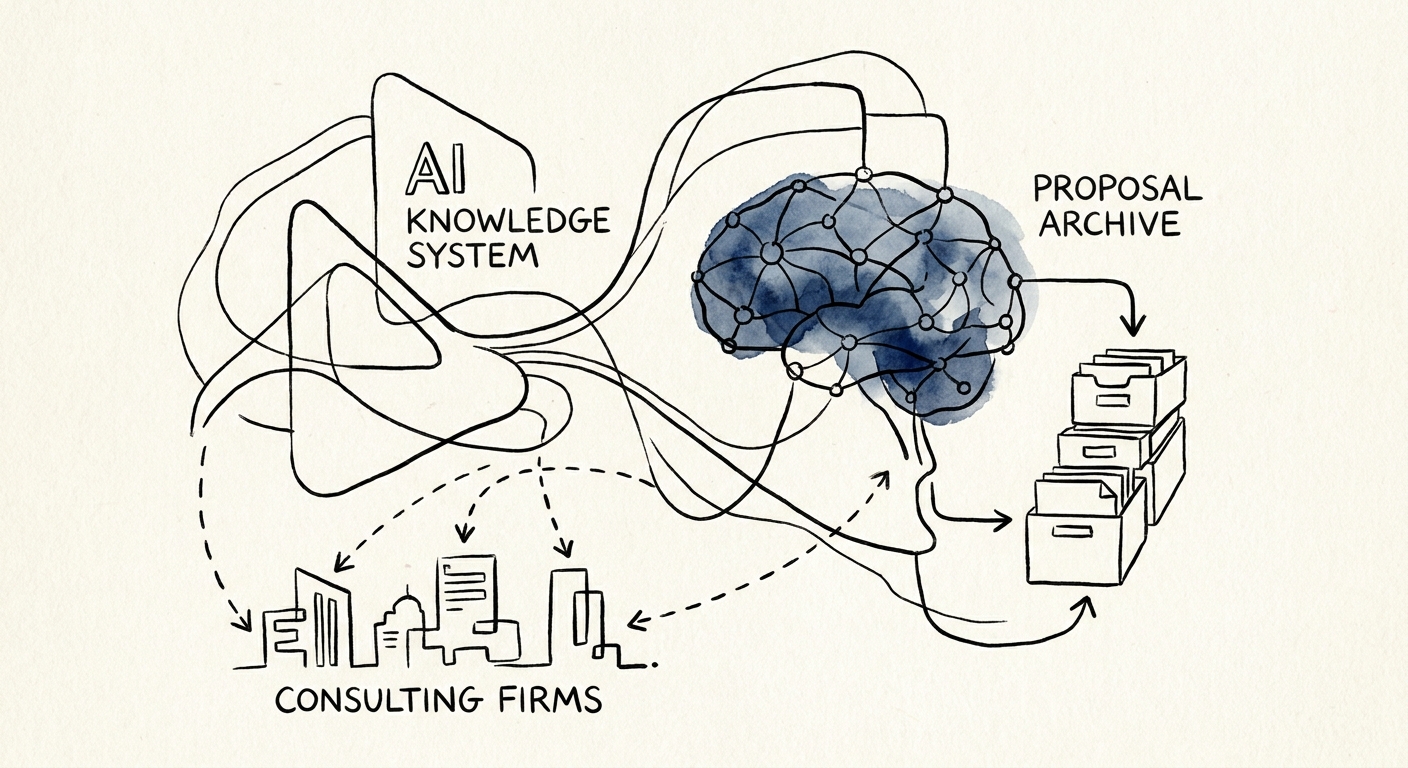
The AI Knowledge System That Finds Your Best Proposal Before the Deadline
Consulting proposals don't lose to competitors — they lose to your own archive. How a governed AI knowledge system surfaces the winning version before the deadline.
25% leaders moving many AI pilots into production
BRIEF · AI TRANSFORMATION STRATEGY
Is Your 200-Person MSP Actually Ready for AI? Start in the Ticket Queue
A 200-person MSP's AI readiness lives in its PSA/RMM data and ticket triage. Three things to prove before rollout: tenant isolation, dispatch ownership, margin.
3 gates Data access, workflow ownership, and value model before rollout
BRIEF · AI FUNCTION USE CASES
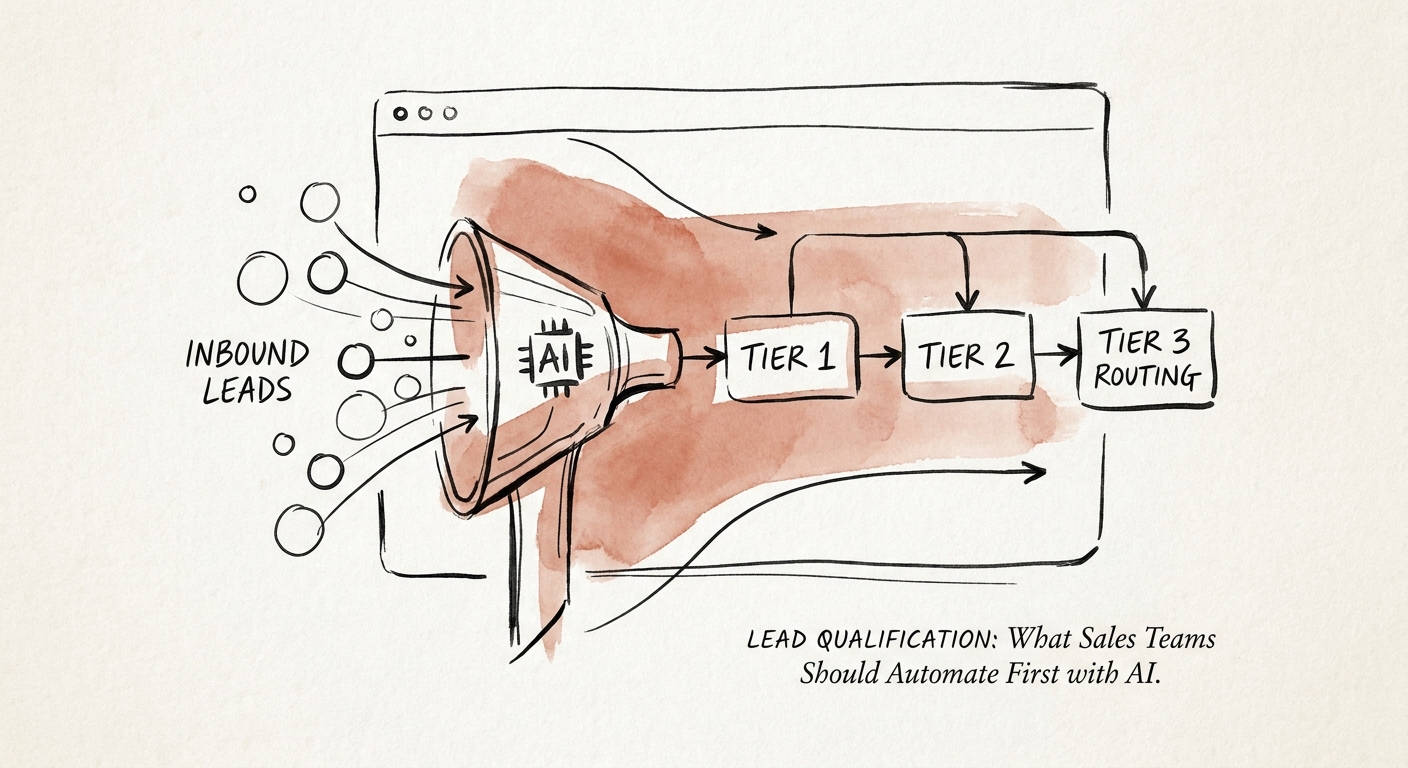
The First Thing Sales Should Hand to AI Is the Lead Triage Nobody Wants to Do
For B2B services teams: why lead triage is the safest first AI workflow, how to make every route inspectable, and what to measure in the first 90 days.
Reviewed qualification first lead AI outcome
BRIEF · AI TRANSFORMATION STRATEGY
AI Readiness for a 100-Person Implementation Partner: Score the Workflow, Not the Tool
A 100-person software implementation partner has dozens of AI candidates and one hard constraint: client data boundaries. Here's how to score readiness before you turn anything on.
8 readiness dimensions to score before rollout
BRIEF · AI TRANSFORMATION STRATEGY
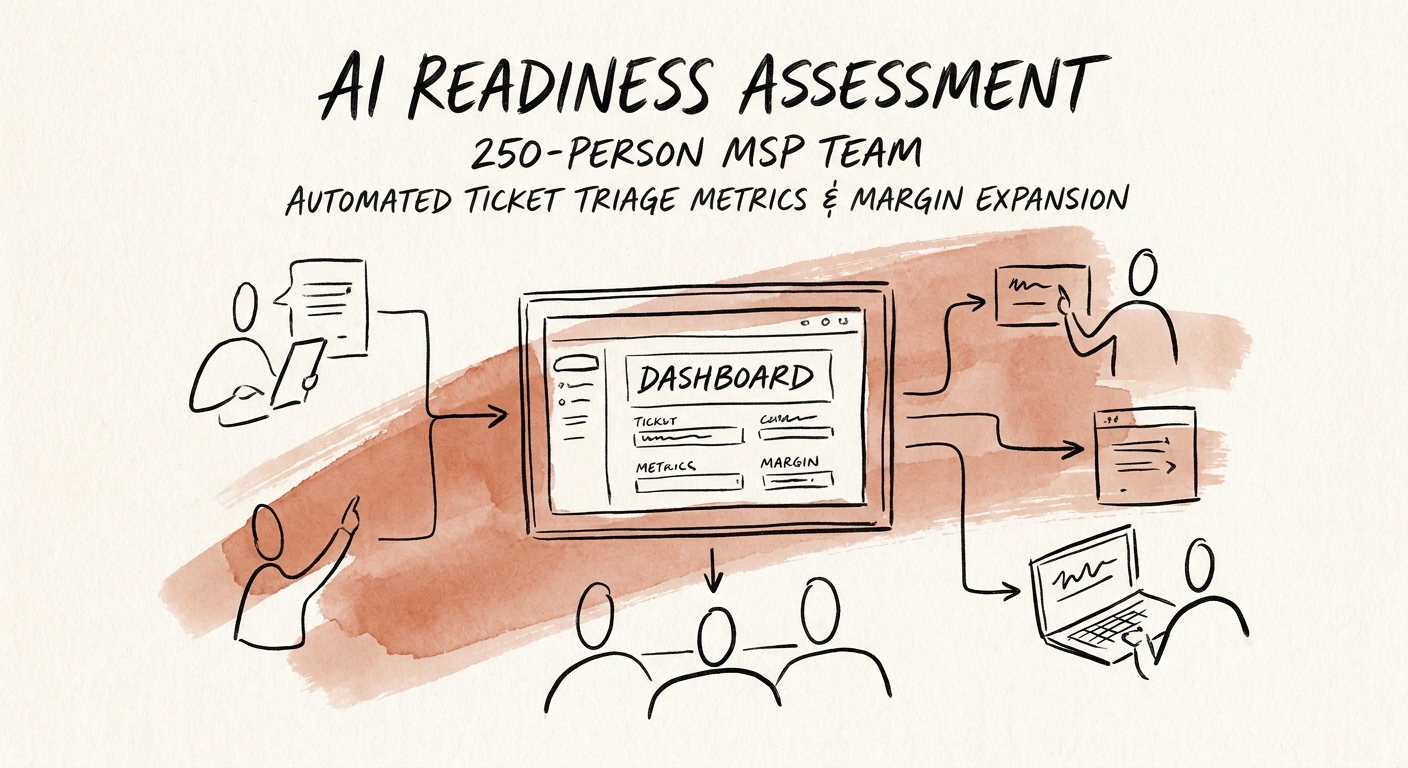
AI Readiness for a 250-Person MSP: The Multi-Tenant Test Most Pilots Fail
A 250-person MSP touches dozens of client tenants from one help desk. Here's how to assess AI readiness without leaking one client's data into another's ticket.
5 operating layers to verify before MSP AI rollout
BRIEF · AI FUNCTION USE CASES
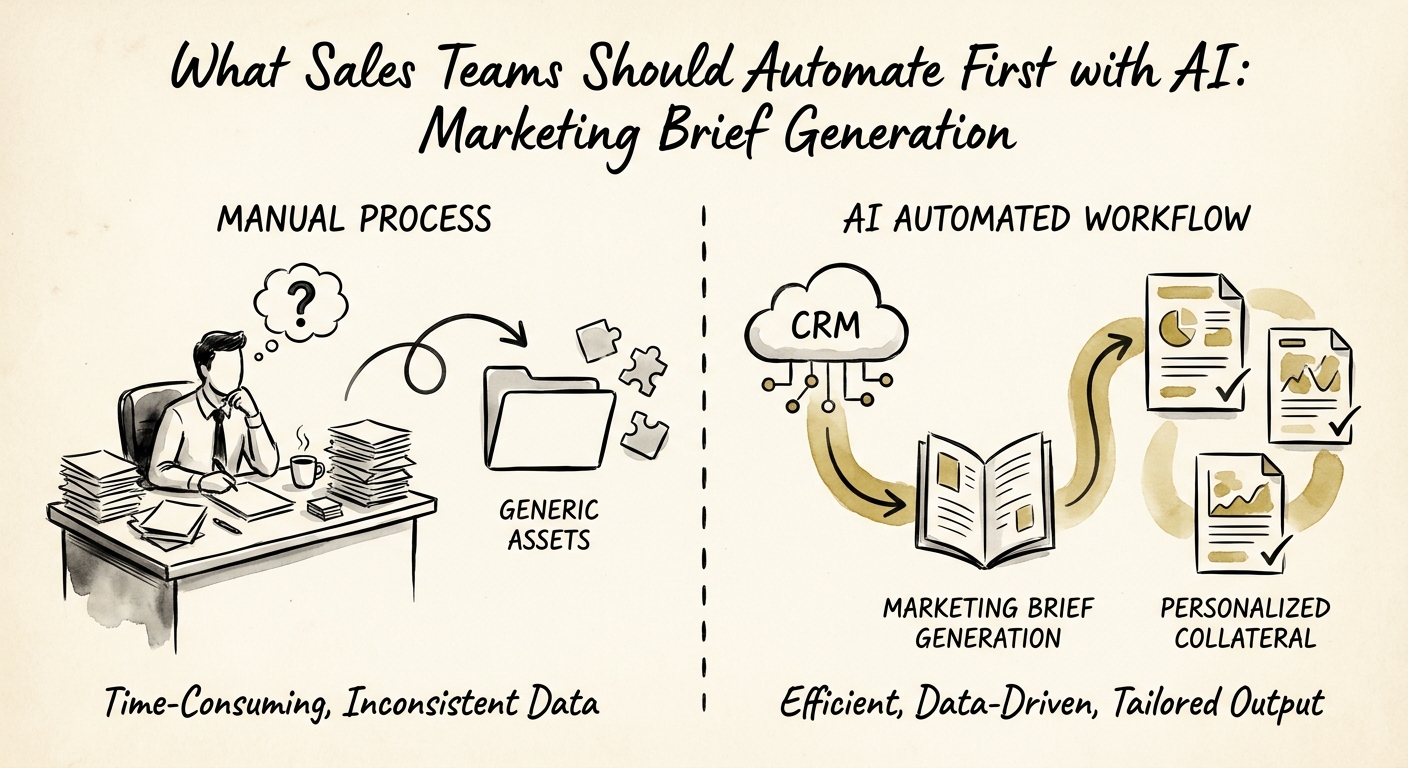
Your Best Marketing Briefs Are Trapped in Sales Calls. Here's How to Get Them Out Safely
B2B sales teams sit on the best buyer language nobody uses. How to turn call notes into marketing briefs with AI — without leaking deal-specific detail.
1 reviewed market brief from sales conversations each week
BRIEF · AI MEASUREMENT AND ROI
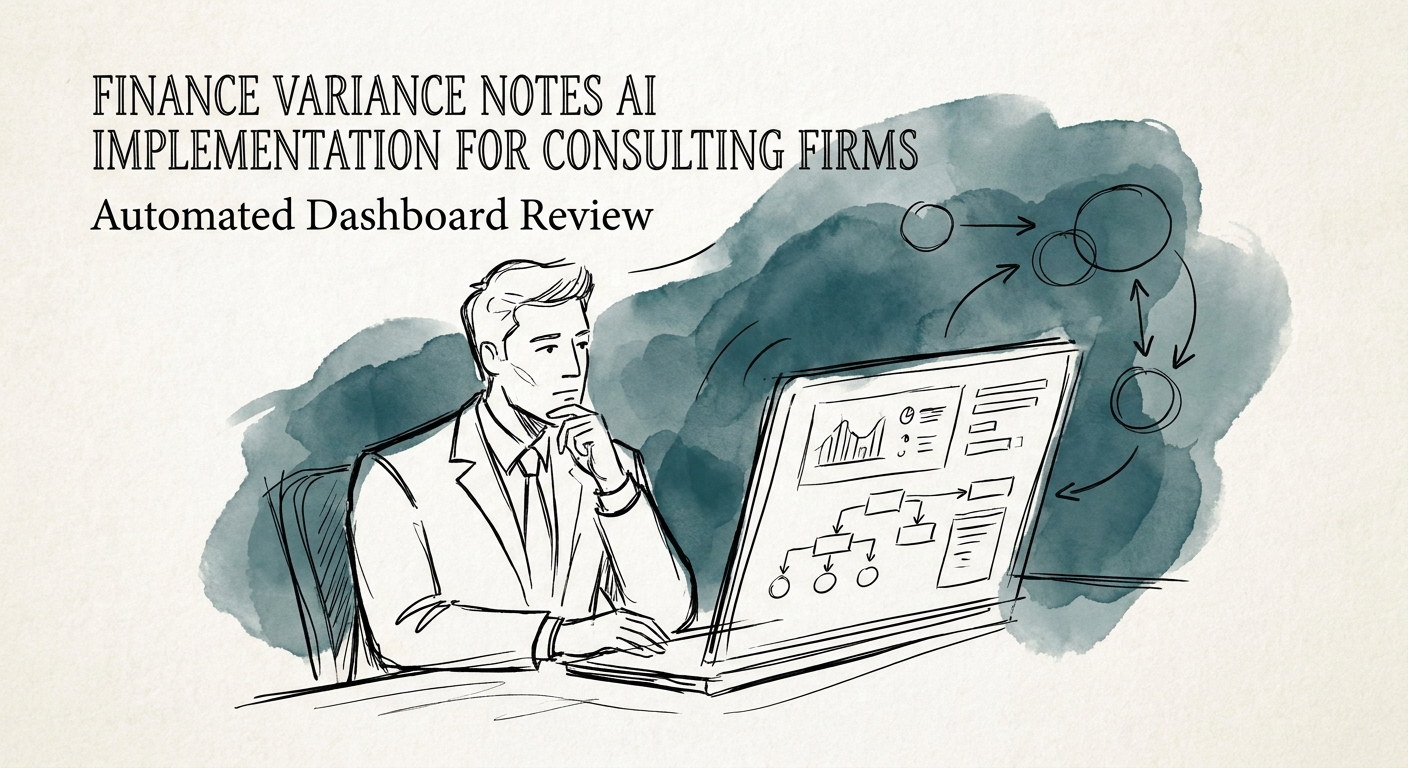
The Variance Note That Said "Timing" for Three Months: An AI Pilot for Consulting Firm Finance
Project margin slipped and the note said "timing." Here's how a consulting firm can pilot AI on close-cycle variance notes in one close, without losing the why.
1 close cycle One close cycle to prove review quality
BRIEF · AI GOVERNANCE AND TRAINING
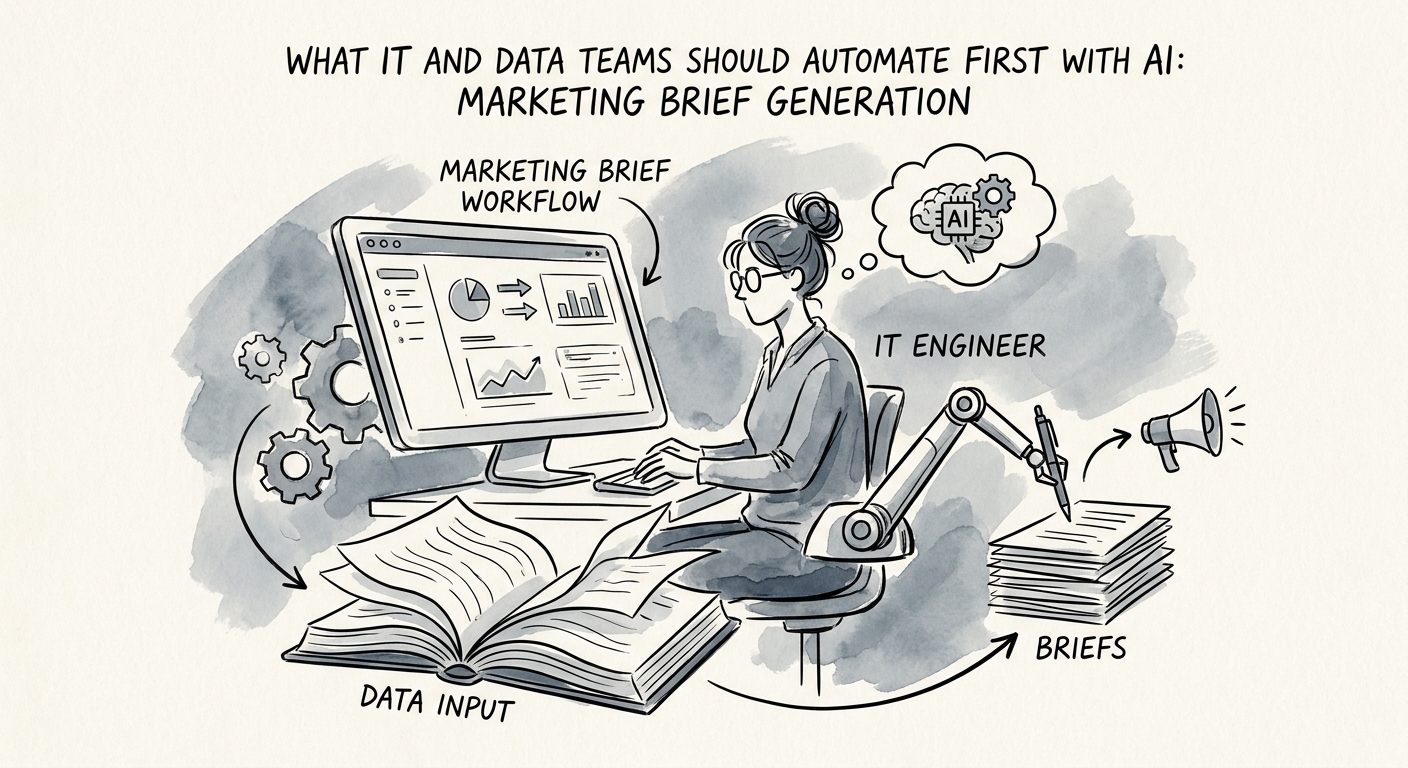
The First AI Win for IT and Data Teams: Marketing Brief Generation Built on Facts Marketing Can Defend
Marketing briefs fail when AI invents facts. Here's how IT and data teams ship brief generation that pulls only approved figures, claims, and audience data.
32% AI use at 100-249 employee firms