BRIEF · AI MEASUREMENT AND ROI
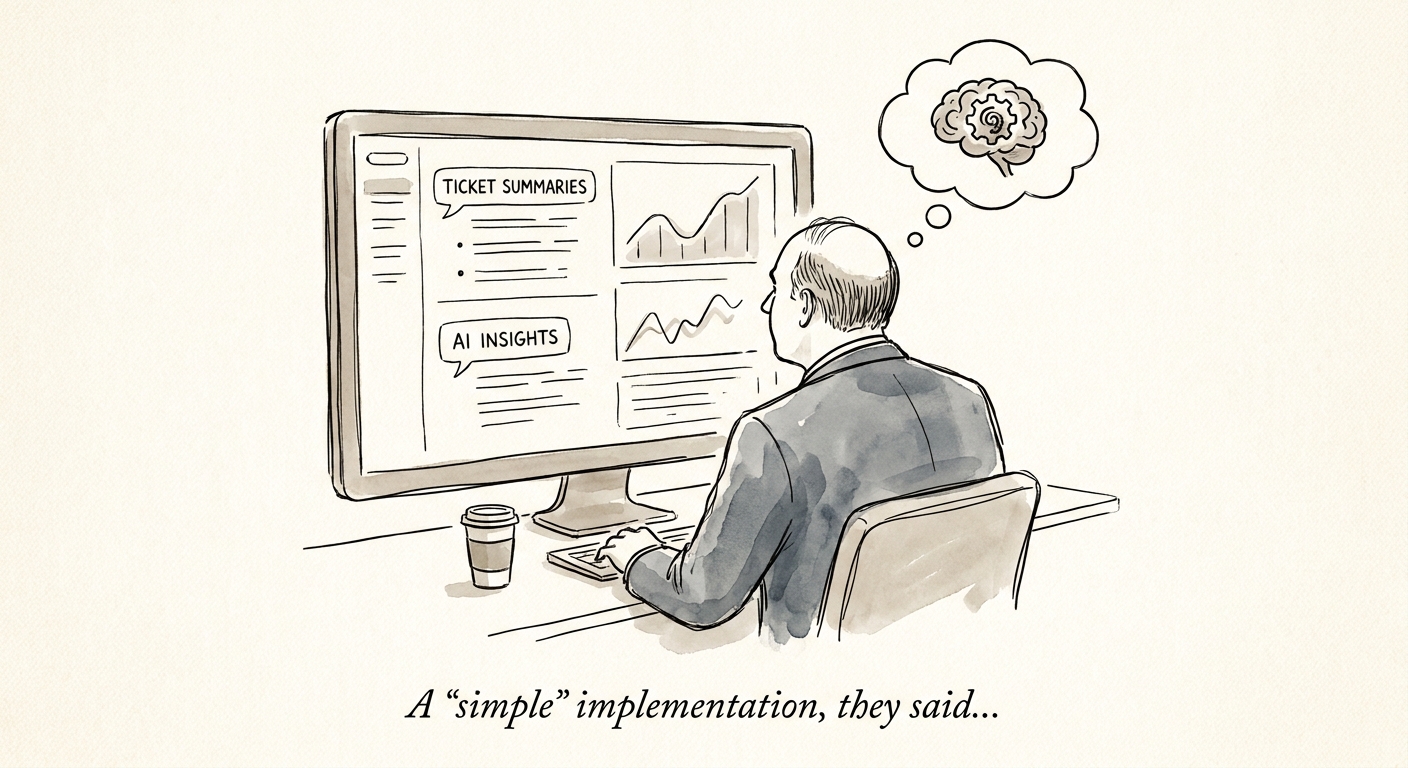
Vendor Ticket Summaries: The AI Workflow That Catches Client Escalations Early
Consulting firms sit between clients and the vendors they manage. Here's how to turn scattered vendor tickets into an account-risk brief before the client calls.
1 weekly vendor-risk summary per account
BRIEF · AI KNOWLEDGE SYSTEMS
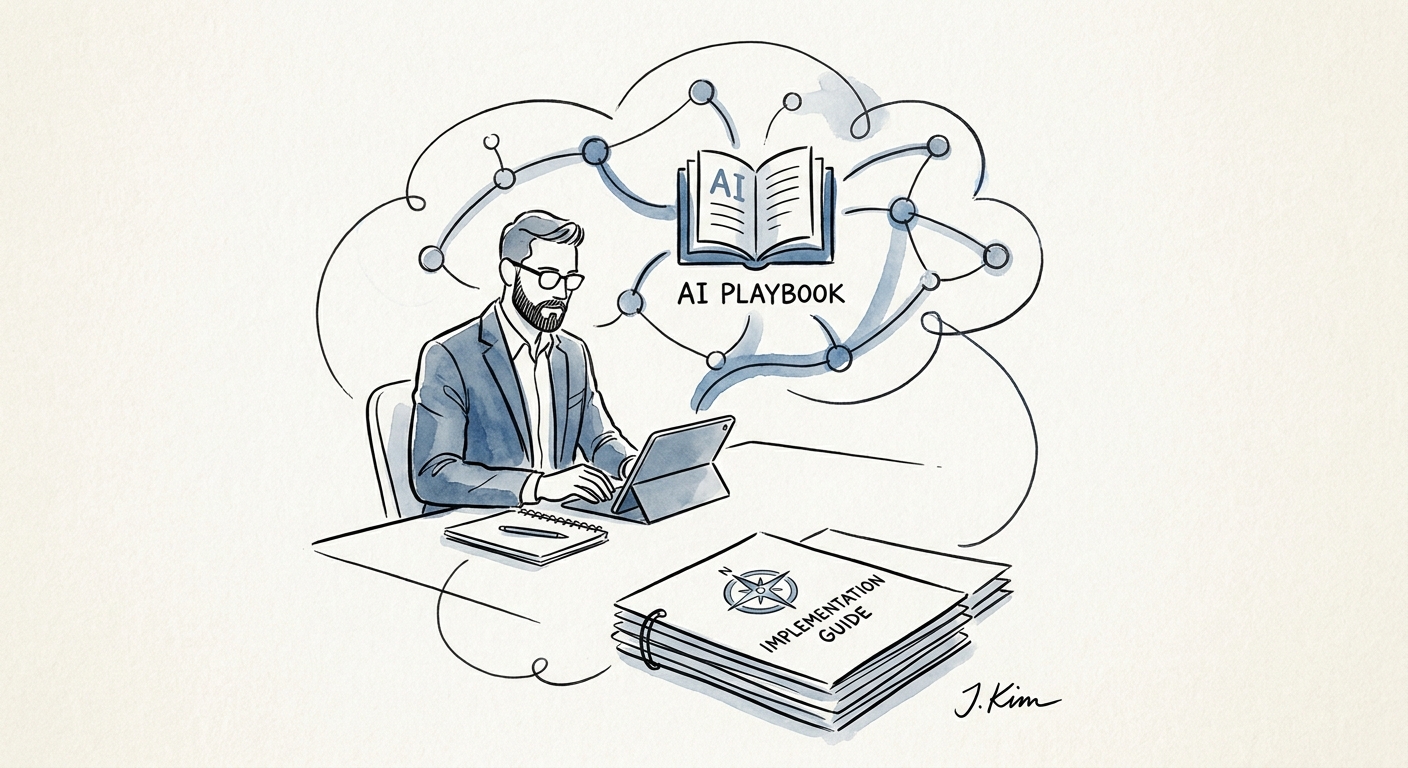
When Your Implementation Playbook Has Three Versions, AI Search Has to Pick the Right One
Implementation services firms have playbooks in five versions and a Slack thread. Here's how to make AI retrieval surface the current one, not the ghost copy.
25% Leaders reporting transformative AI impact
BRIEF · AI TRANSFORMATION STRATEGY
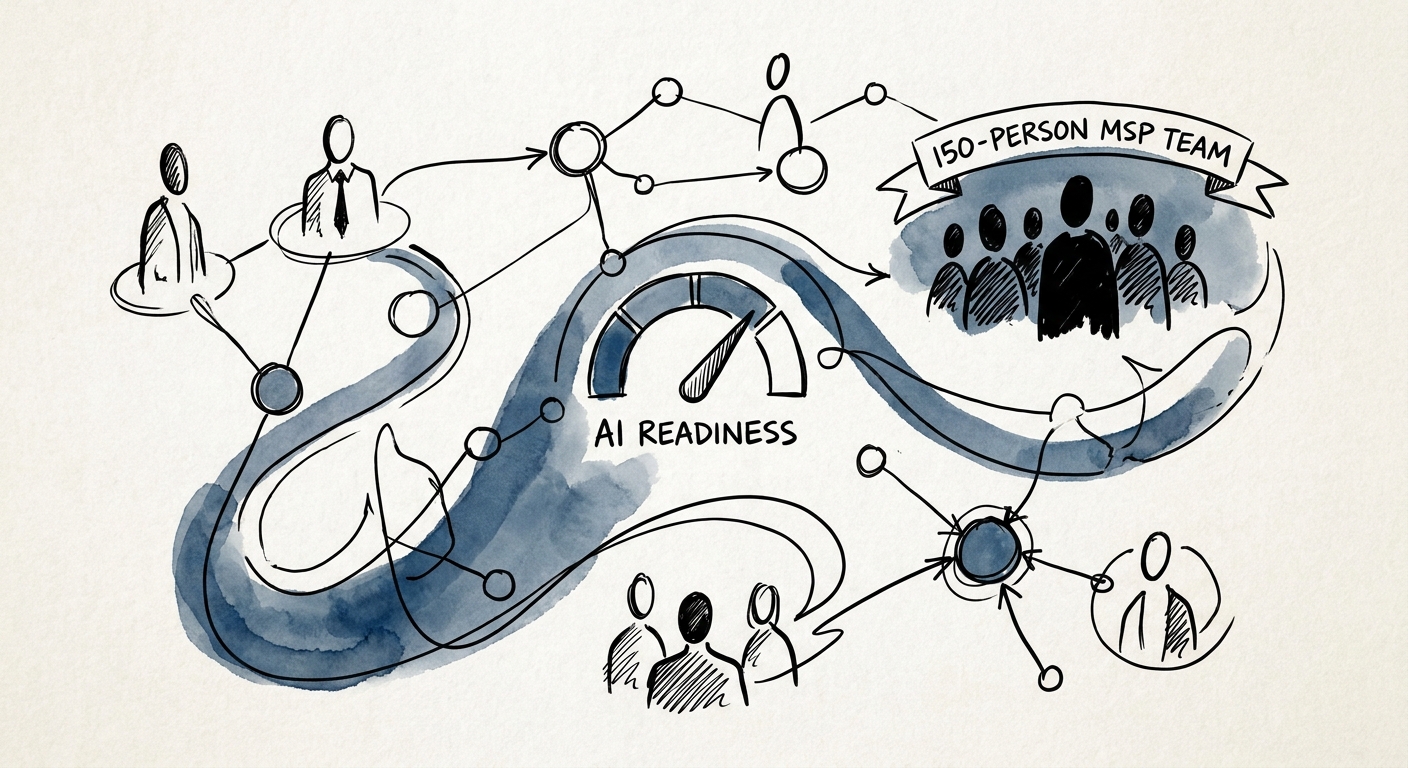
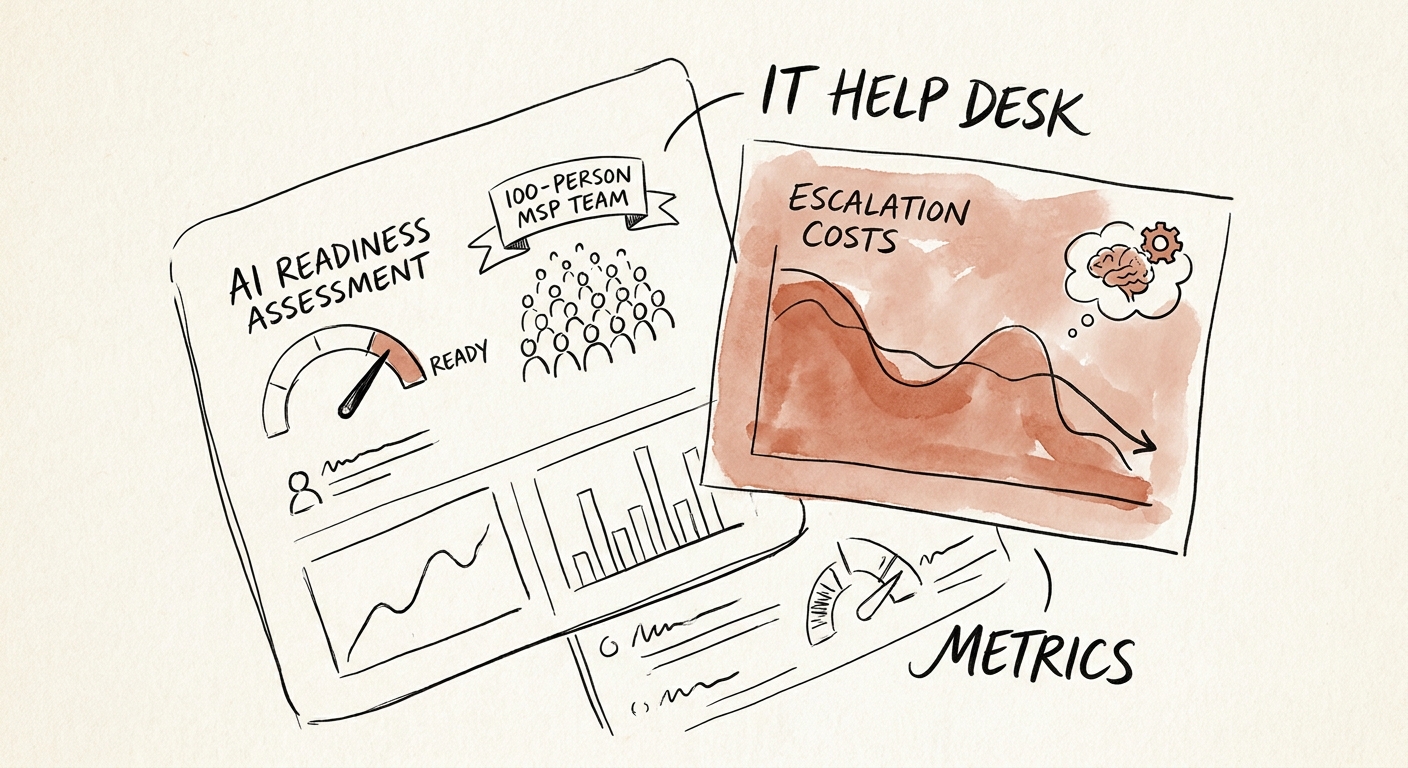
AI Readiness for a 150-Person MSP: Read Your Ticket Data First
A 150-person MSP runs on ticket taxonomy, PSA/RMM data, and cross-client boundaries. Here's how to assess whether yours can absorb a governed AI workflow.
5 readiness areas to verify before MSP automation
BRIEF · AI FUNCTION USE CASES
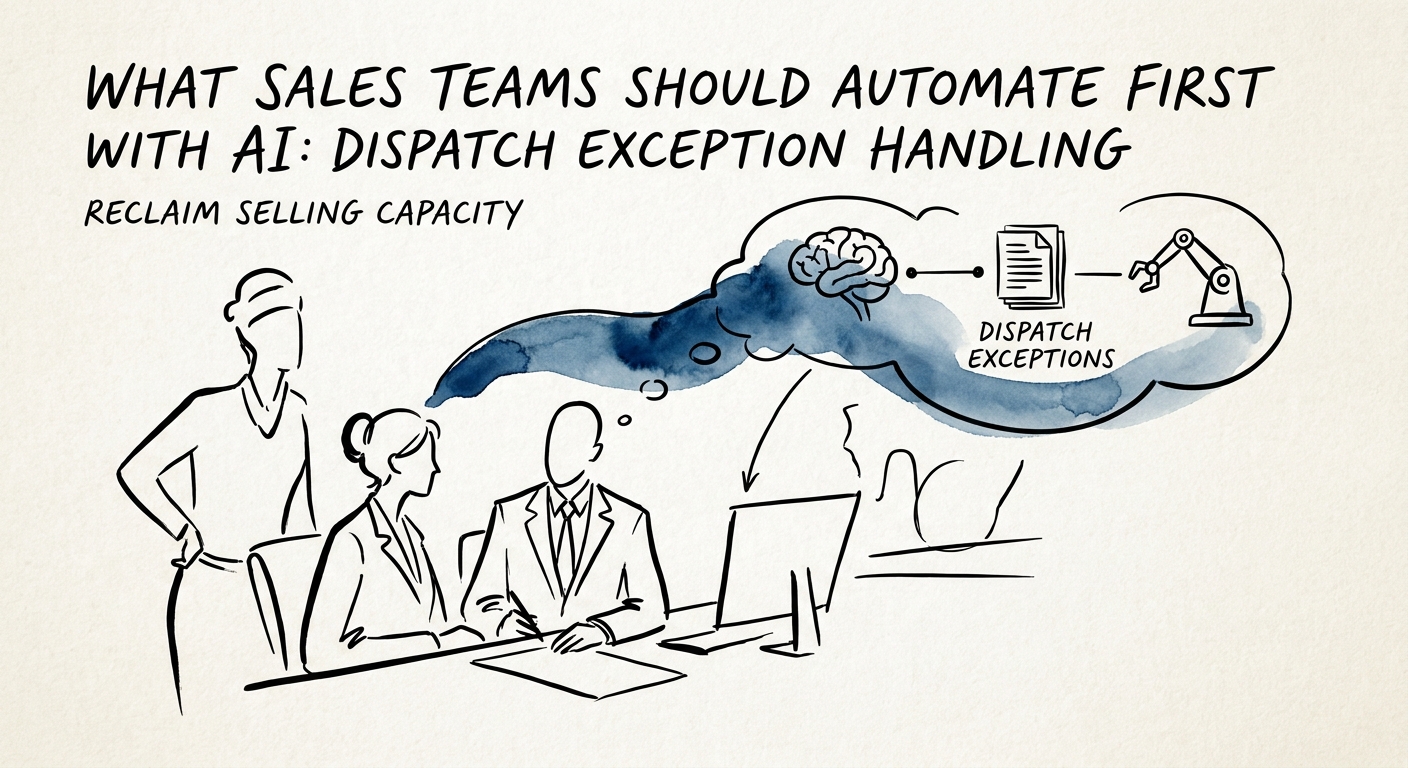
The First AI Win for Sales: Catch a Blown Delivery Before the Customer Does
When delivery slips or a tech reroutes, the account owner should hear it first. How sales teams use AI to flag dispatch exceptions inside 24 hours.
24 hours to notify account owners of delivery exceptions
BRIEF · AI FUNCTION USE CASES
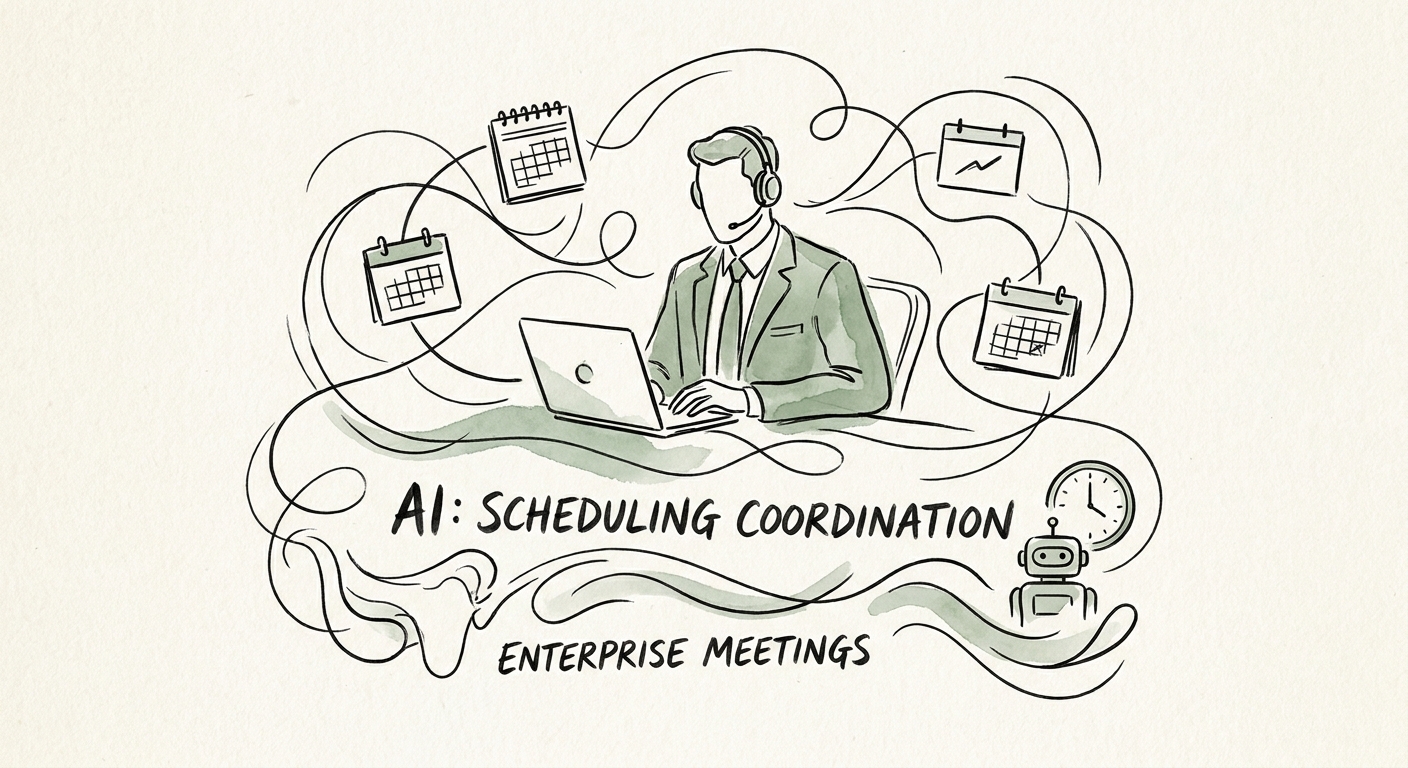
The First Thing Sales Should Automate With AI Is the Calendar Tag
Scheduling is the safest place for a B2B sales team to start with AI — if the calendar tag never leaks the deal. Here's how to scope the first pilot.
Fewer scheduling loops first sales coordination outcome
BRIEF · AI WORKFLOW AUTOMATION
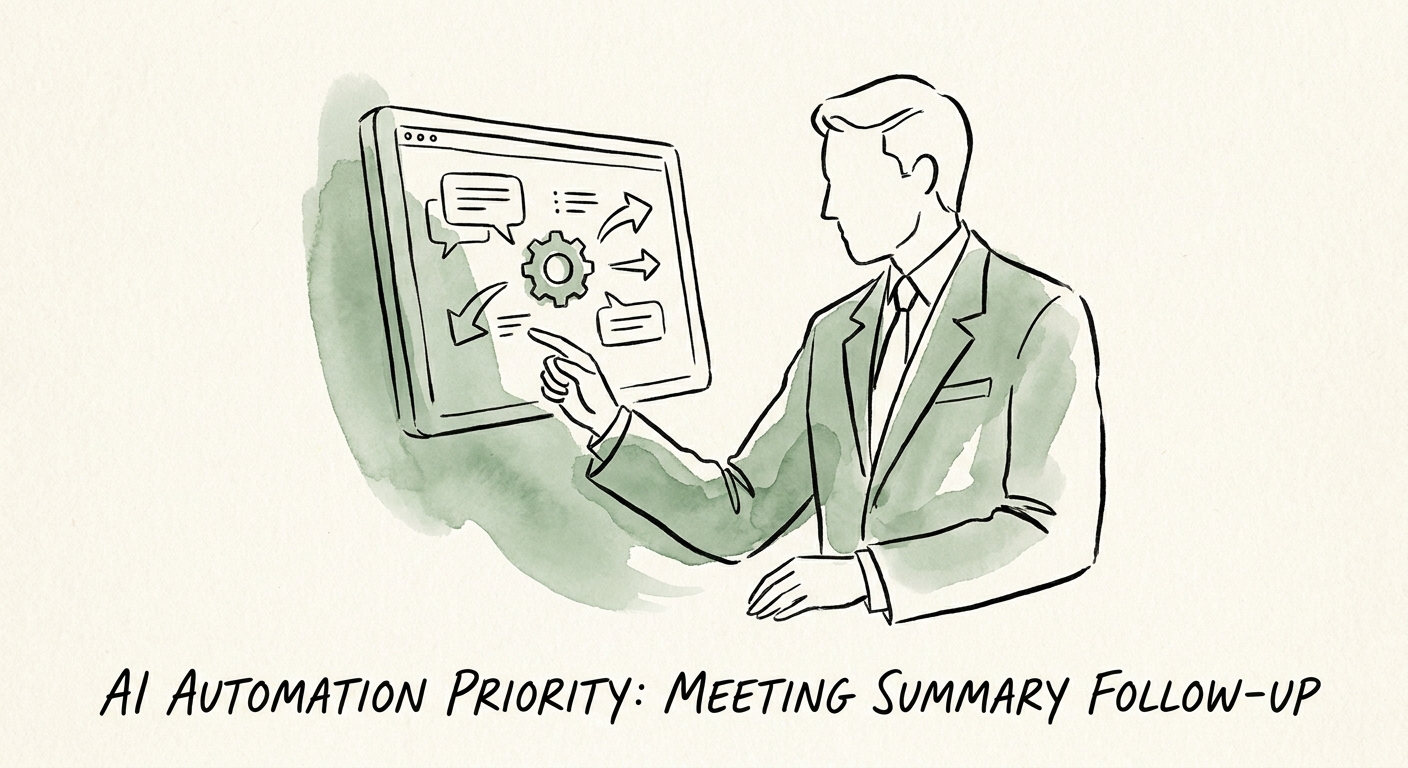
The First AI Workflow Operations Should Automate: Turning Meeting Notes Into Owned Commitments
A clean AI summary isn't follow-through. Here's how B2B services ops teams turn weekly meeting notes into owned, dated commitments that actually close.
Clearer action owners first meeting AI outcome
BRIEF · AI VENDOR AND BUILD-VS-BUY
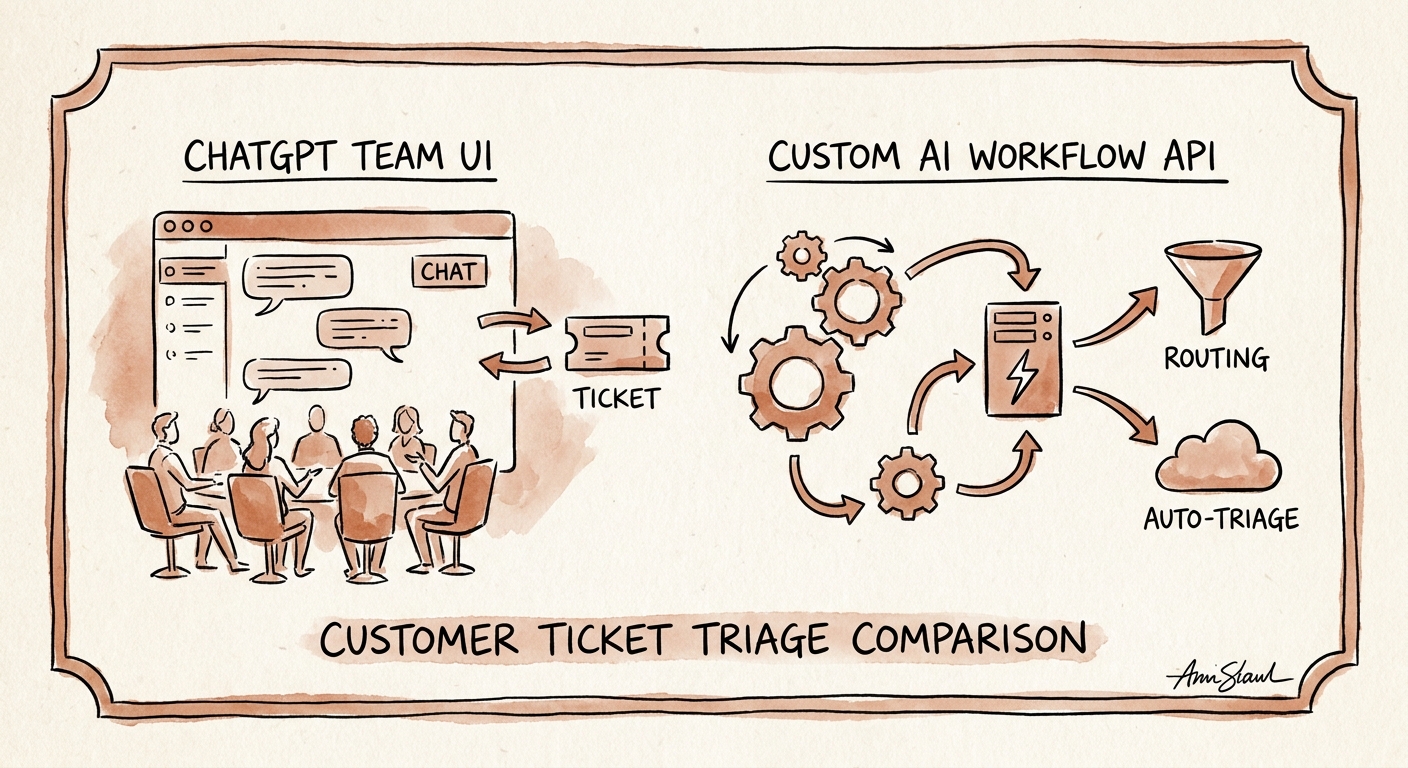
ChatGPT Business vs. a Custom Triage Workflow: Who Routes the Ticket?
A support leader's build-vs-buy guide: when ChatGPT Business is enough for ticket triage drafts, and when SLA exposure and account tier force a custom workflow.
2 seats ChatGPT Business minimum standard seats
BRIEF · AI MEASUREMENT AND ROI
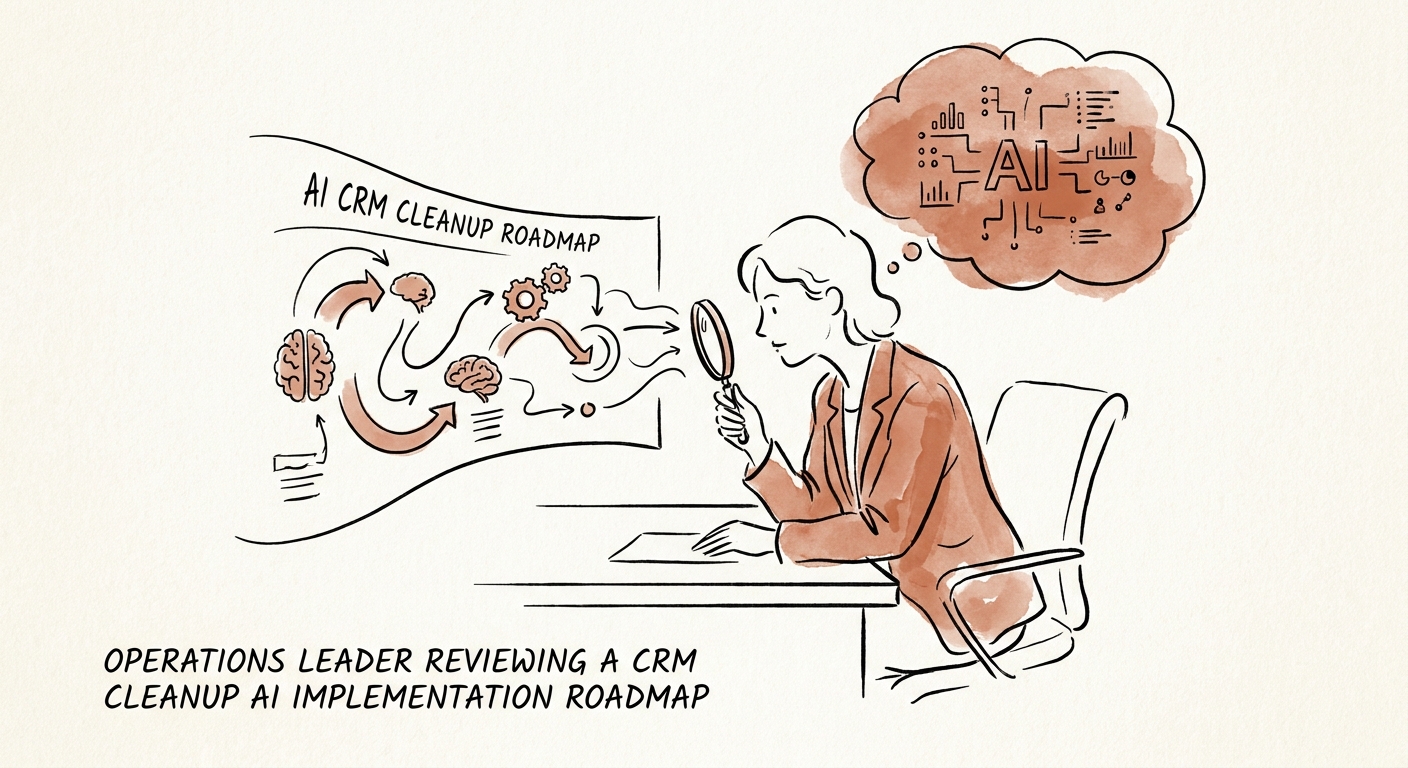
The Partner Forgot to Update the CRM: AI Cleanup for Consulting Firms
In a partner-led consulting firm, the CRM rots in private inboxes. Here's how to use AI to surface drift without letting it overwrite a partner's judgment.
Pipeline hygiene first measurable CRM cleanup outcome
BRIEF · AI TRANSFORMATION STRATEGY
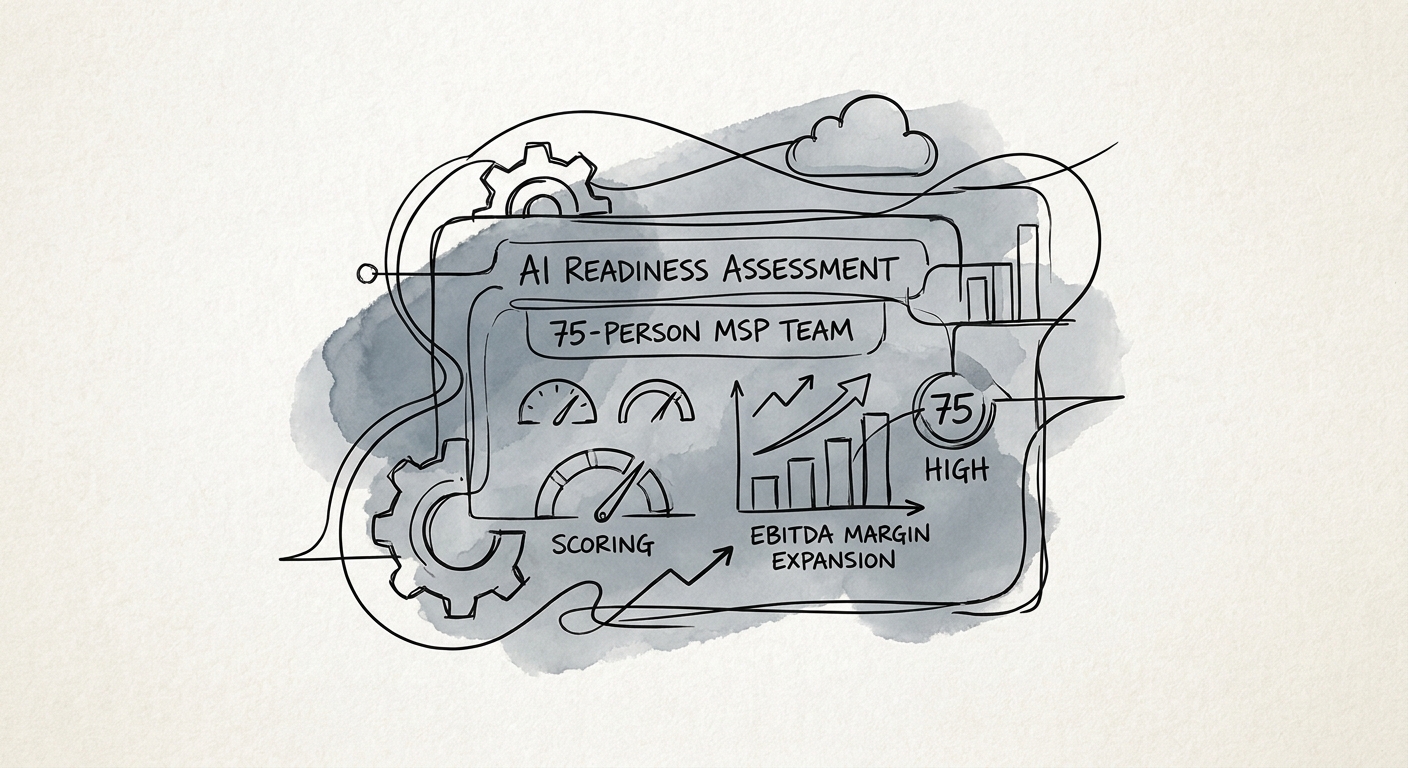
AI Readiness for a 75-Person MSP: The Multi-Tenant Test Most Teams Skip
A 75-person MSP runs on client trust and clean tenant boundaries. Here's how to score AI readiness so a ticket summary never leaks one client's data into another's.
8 readiness dimensions to score before AI rollout
BRIEF · AI FUNCTION USE CASES
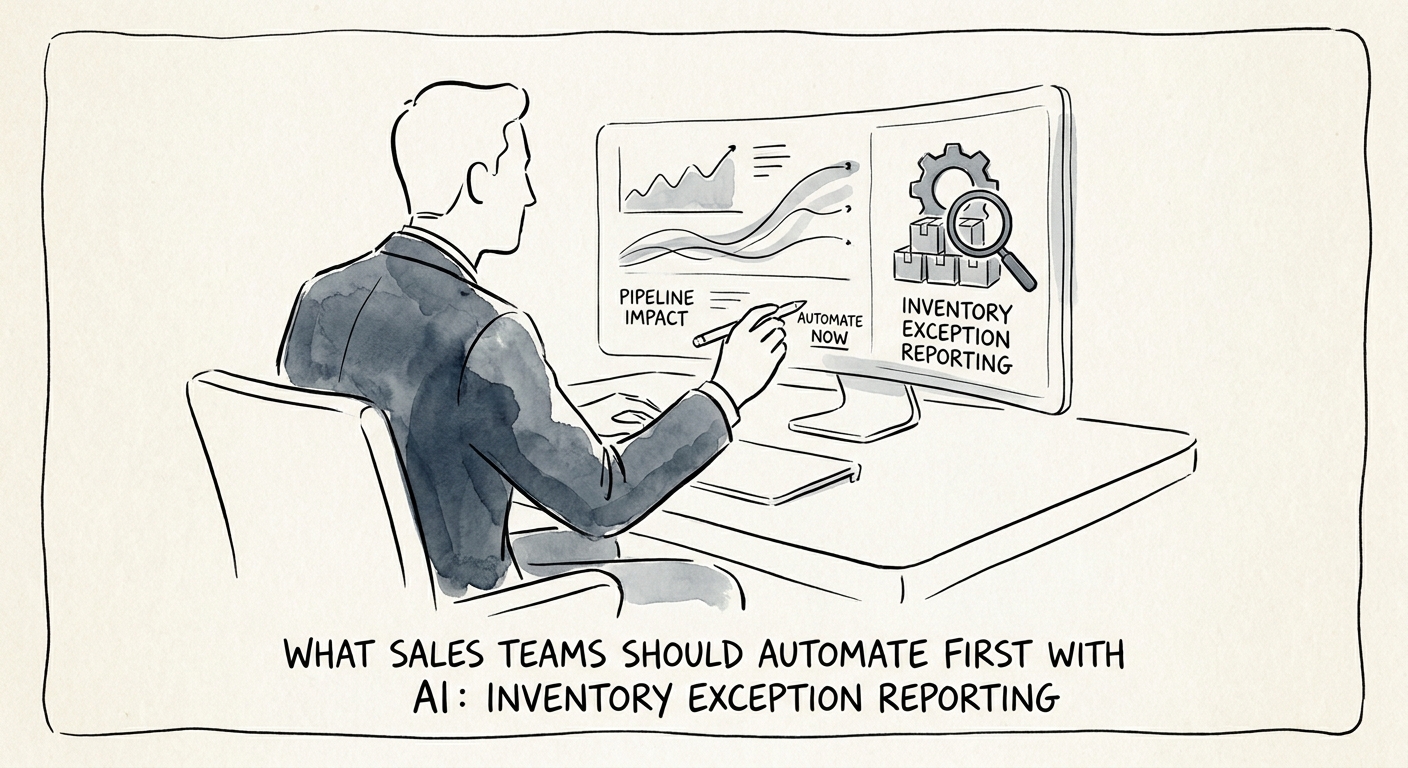
The First Thing Sales Should Automate With AI: Catching the Inventory Exception Before It Breaks a Promise
For distributors and services firms: how to point AI at inventory exception reporting so reps learn about stockouts before the customer does — without auto-changing promises.
24 hours to notify account owners of material inventory exceptions
BRIEF · AI VENDOR AND BUILD-VS-BUY
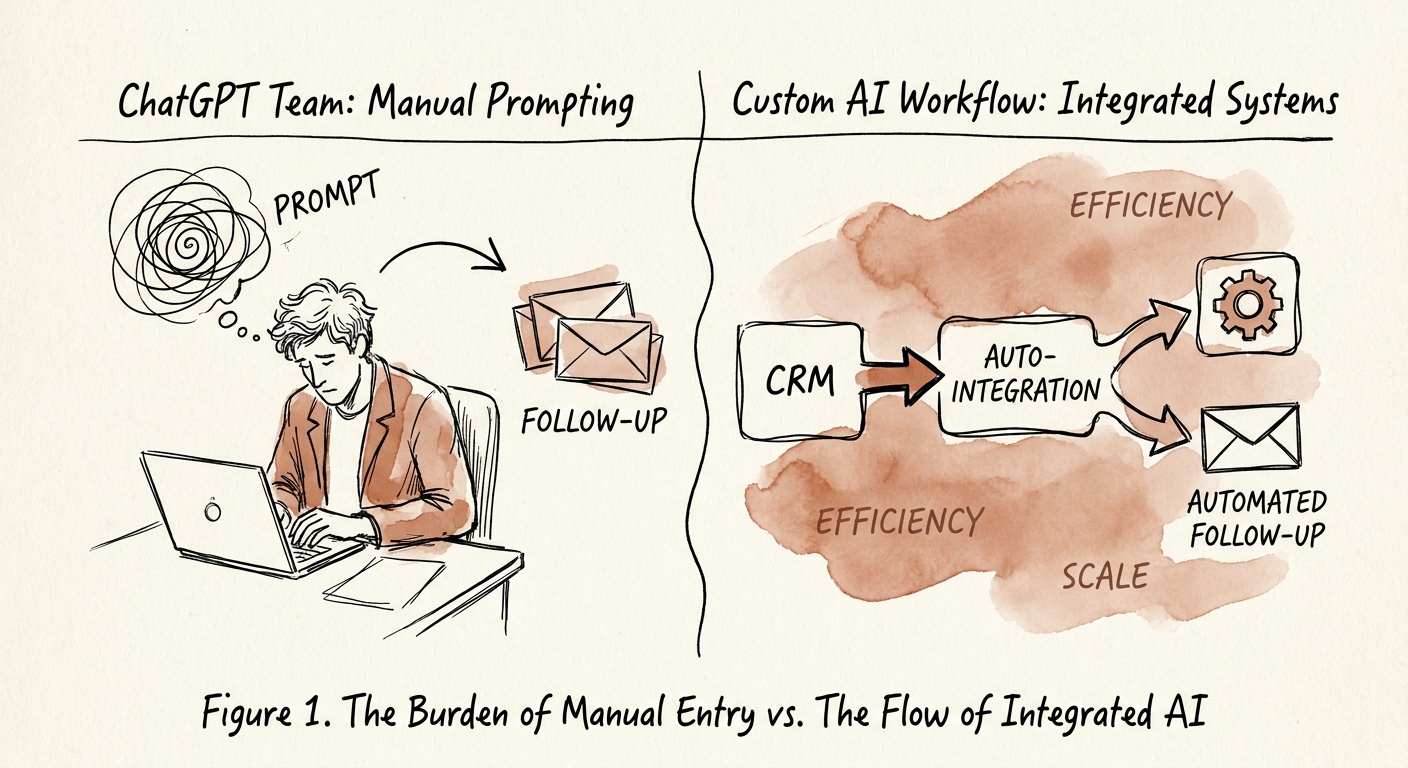
ChatGPT Business vs. a Custom Workflow for Sales Follow-Up: Which One Won't Email the Wrong Promise
A B2B sales build-vs-buy guide: when a ChatGPT Business seat handles follow-up and when you need a custom workflow that knows the CRM stage and the real commitment.
2 seats ChatGPT Business minimum standard seats
BRIEF · AI MEASUREMENT AND ROI
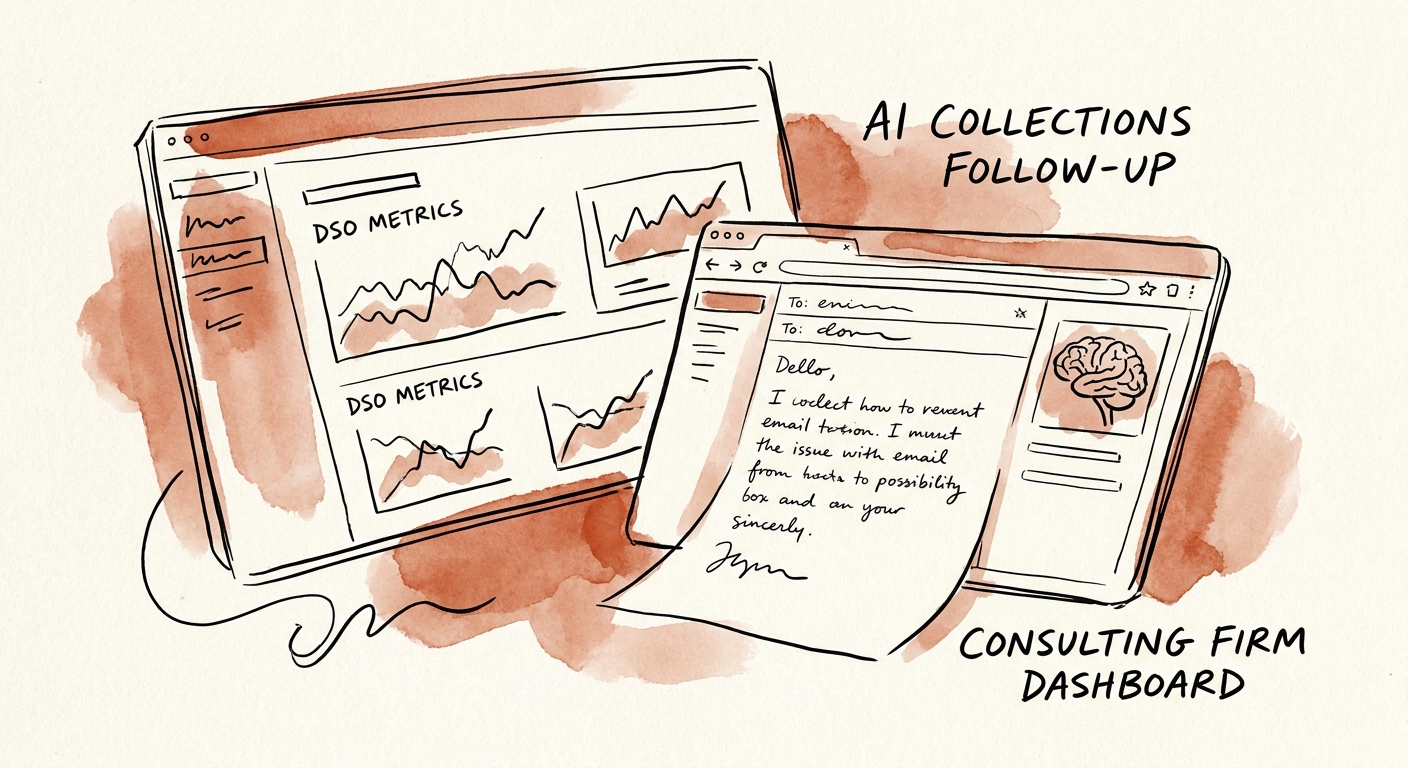
Collections AI for Consulting Firms: Chase Invoices Without Burning the Relationship
Consulting firms sit on aged AR because chasing a client you want to re-sign feels awkward. Here's how to use AI to prep the follow-up without touching tone.
30 days to pilot governed collections follow-up
BRIEF · AI KNOWLEDGE SYSTEMS
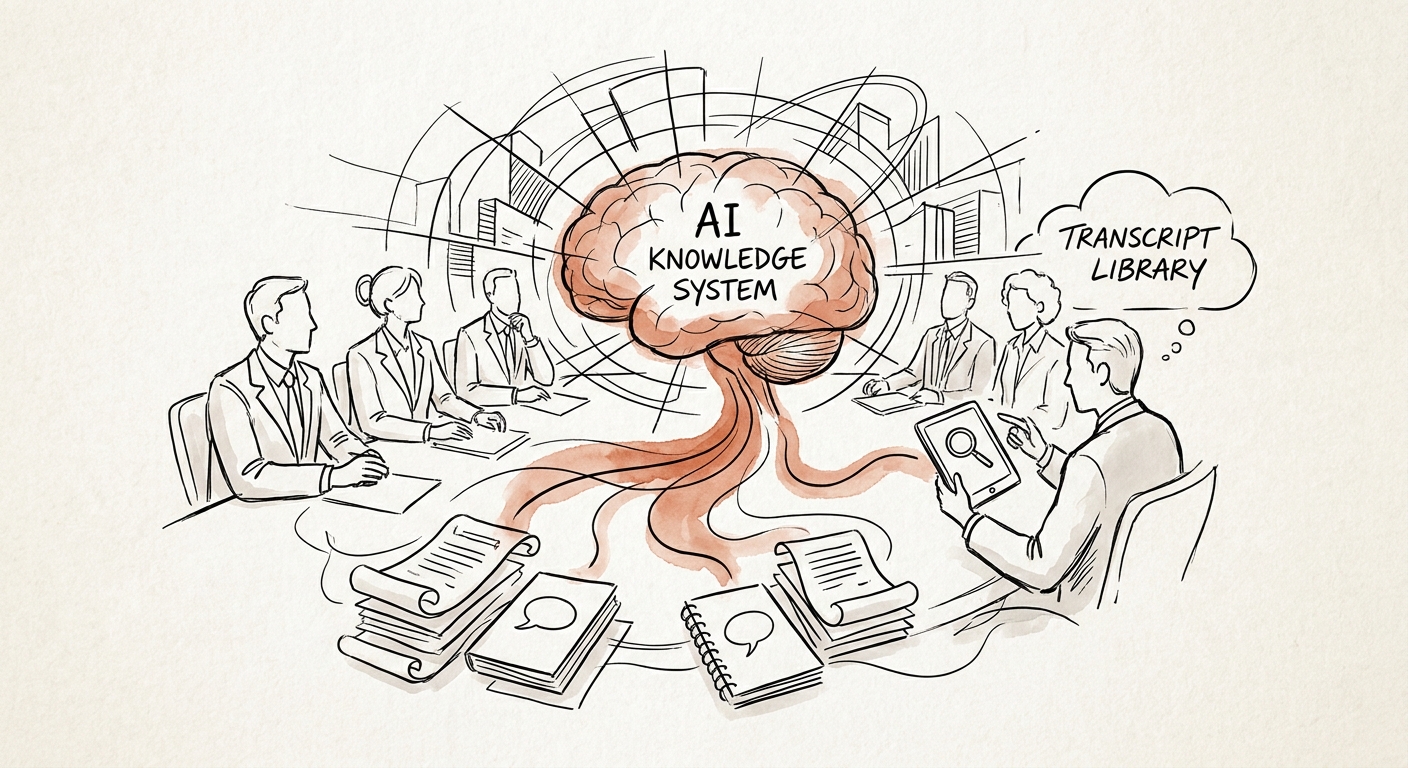
Your Meeting Transcripts Are Lying to Your AI: Building a Searchable Library That Knows the Difference Between Talk and Decisions
A 90-day playbook for professional services firms turning recorded calls into a searchable knowledge system that separates client decisions from hallway talk.
32% AI use at 100-249 employee firms
BRIEF · AI WORKFLOW AUTOMATION
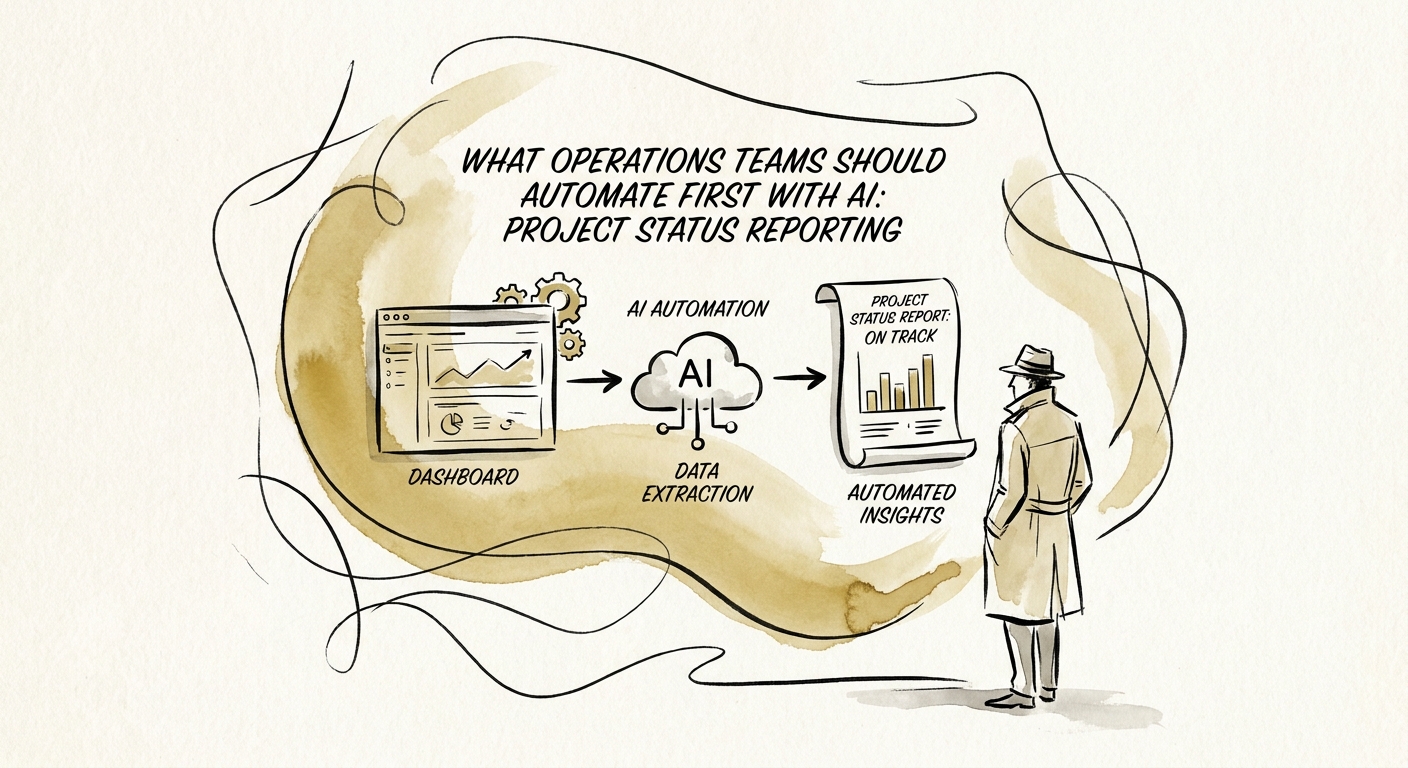
Automate the Friday Status Rollup First: An Ops Leader's Playbook
Why project status reporting is the smartest first AI automation for ops teams — and how to pilot it on one cadence without breeding a dashboard nobody trusts.
1 reporting cadence One reporting cadence before dashboard sprawl
BRIEF · AI GOVERNANCE AND TRAINING
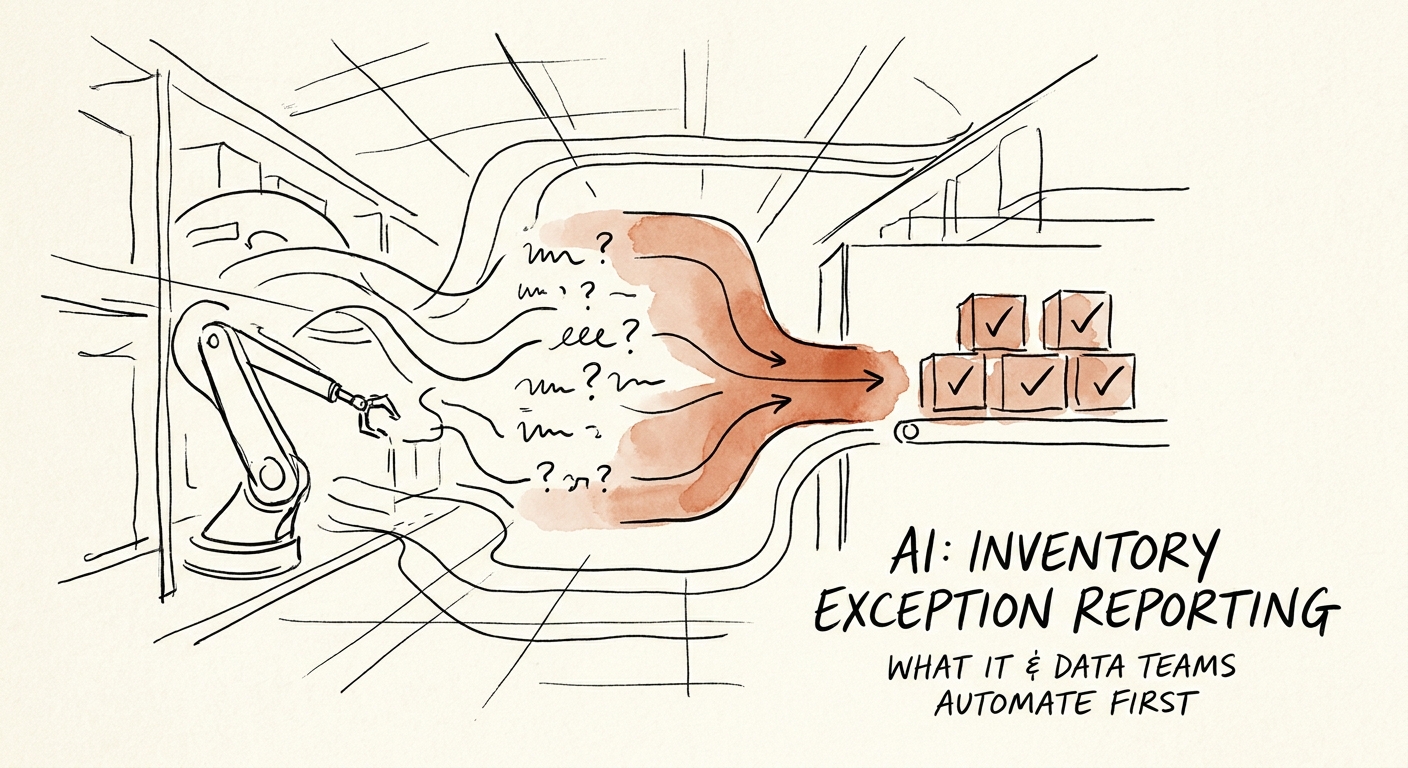
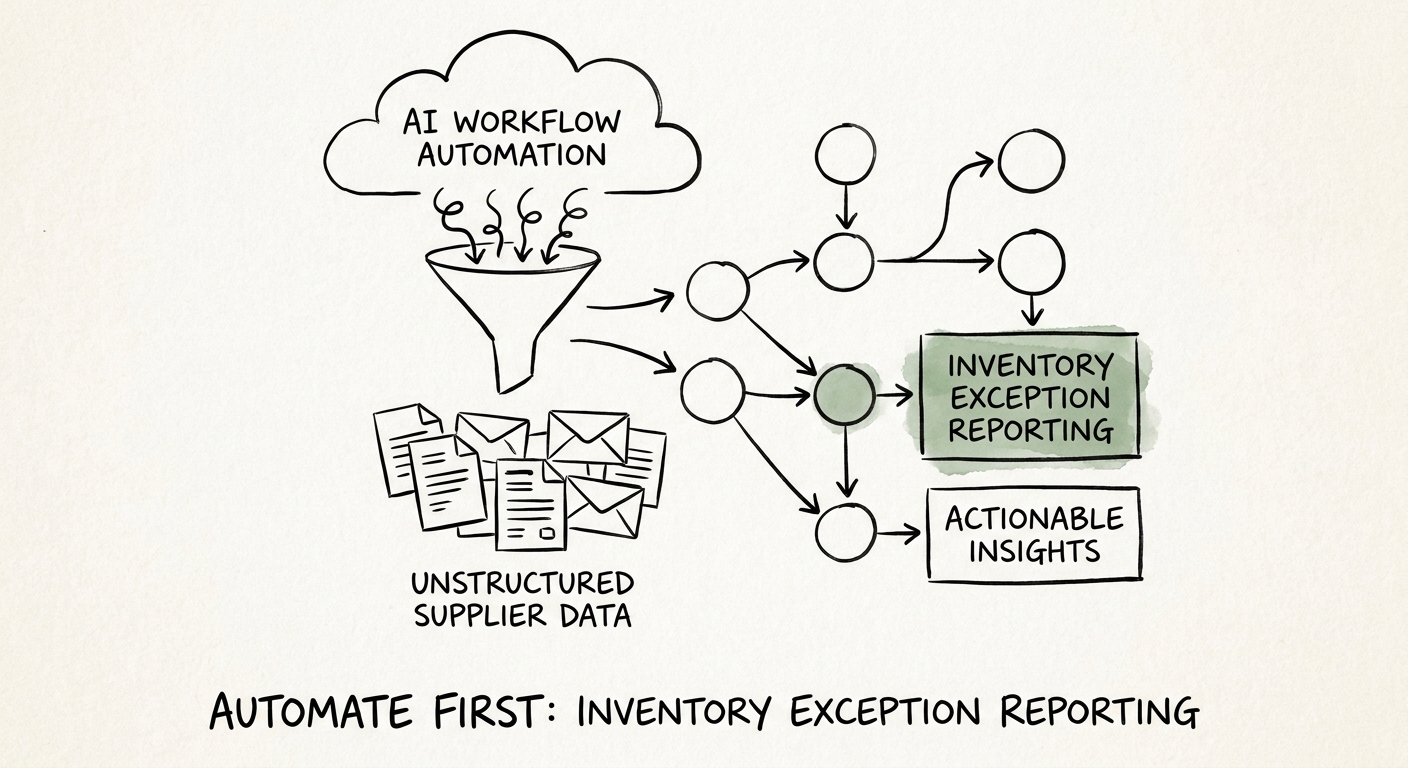
The First AI Workflow IT Should Build: Inventory Exception Reporting
A SKU shows 40 in the WMS, 12 on the shelf, and 8 already promised. Here is why inventory exception reporting is the AI workflow IT and data teams should ship first.
1 exception family to automate first
BRIEF · AI TRANSFORMATION STRATEGY
AI Readiness for a 100-Person MSP: Start at the Ticket Queue, Not the Platform
A 100-person MSP runs on tickets, runbooks, and client data under NDA. Here is how to score AI readiness by workflow before you buy a platform.
32% AI use at 100-249 employee firms
BRIEF · AI WORKFLOW AUTOMATION
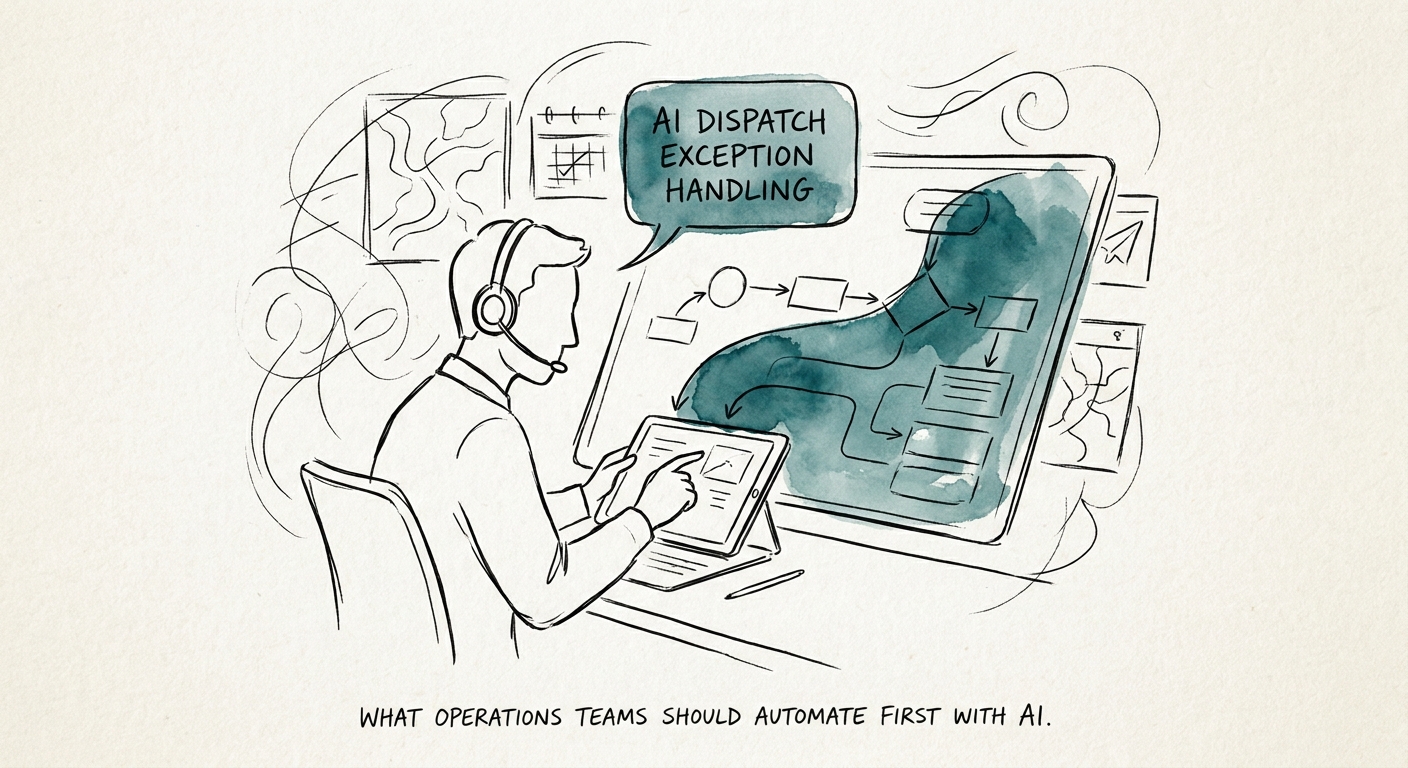
Start AI in the Dispatch Queue: Why Exception Triage Is the Right First Automation
Field service ops leaders: why ranking dispatch exceptions is the smartest first AI project, and how to run a one-exception-family pilot dispatchers actually trust.
4 signals needed before AI recommends a dispatch action
BRIEF · AI KNOWLEDGE SYSTEMS
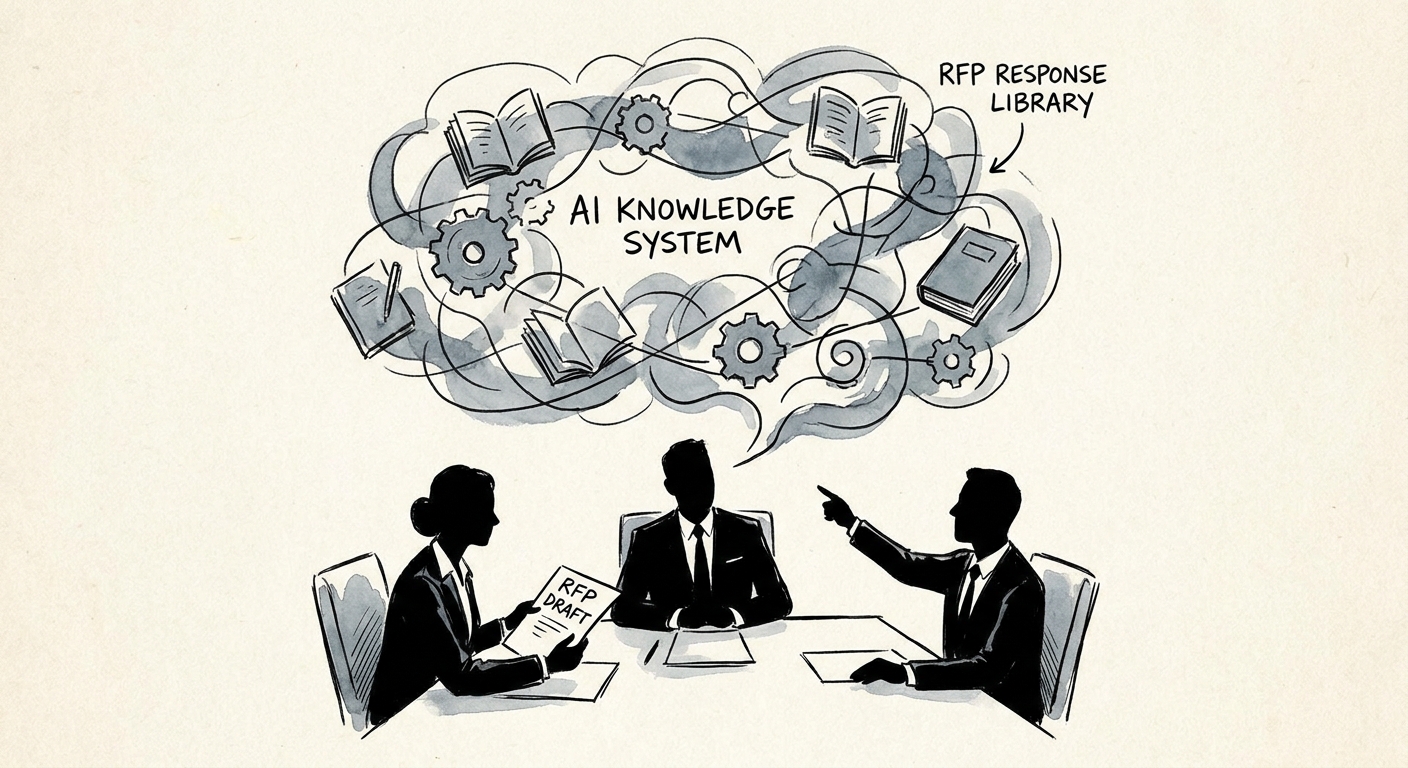
An AI RFP Library That Stops Your Firm From Submitting Stale Proof
How a professional services firm turns its RFP answer library into AI-assisted response support without letting expired proof points or old security language reach a submission.
3/4 Companies planning agentic AI deployment within two years
BRIEF · AI GOVERNANCE AND TRAINING
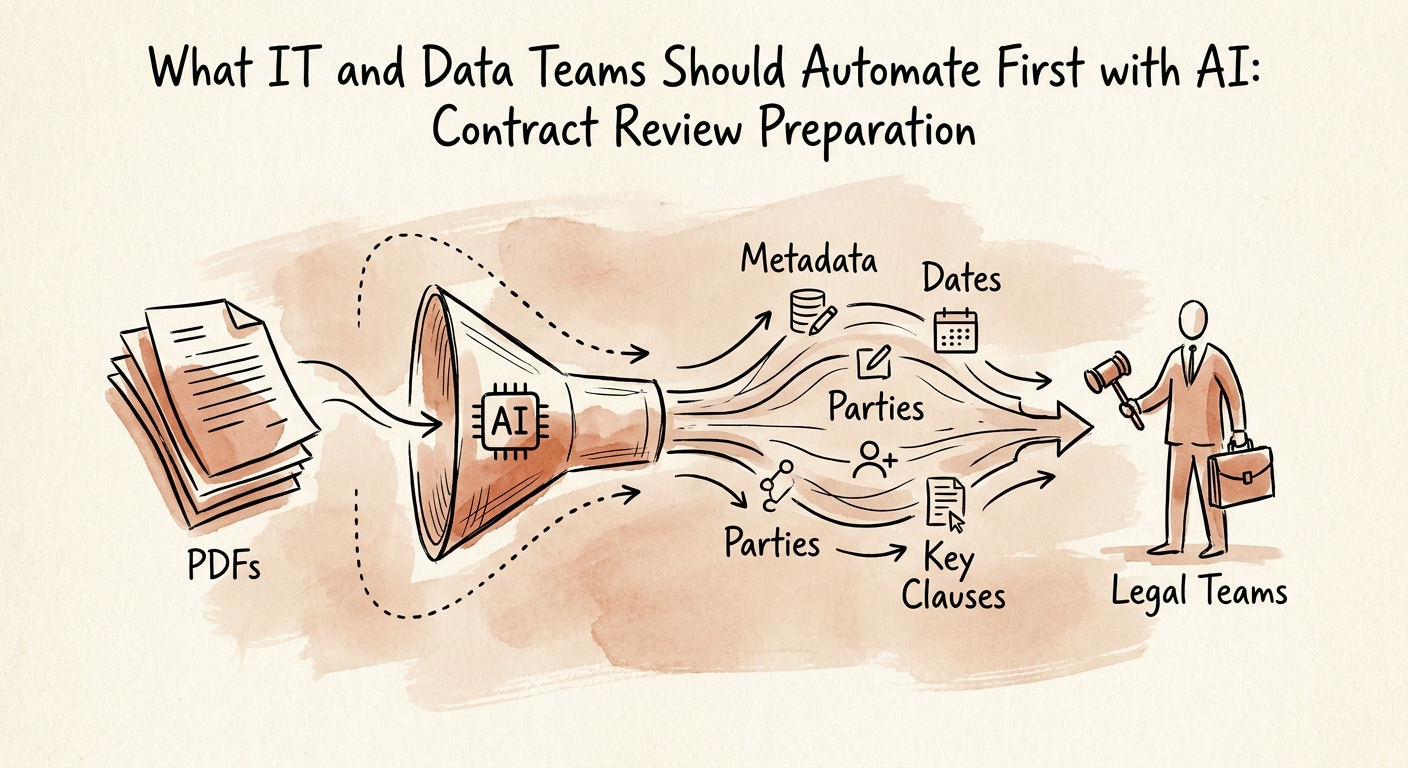
Contract Review Prep Is the Right First AI Job for IT and Data Teams — If You Fix the Permissions First
Why contract review preparation is the safest first AI build for IT and data teams — and the access-model problem that decides whether it works or backfires.
4 controls before AI contract preparation
BRIEF · AI MEASUREMENT AND ROI
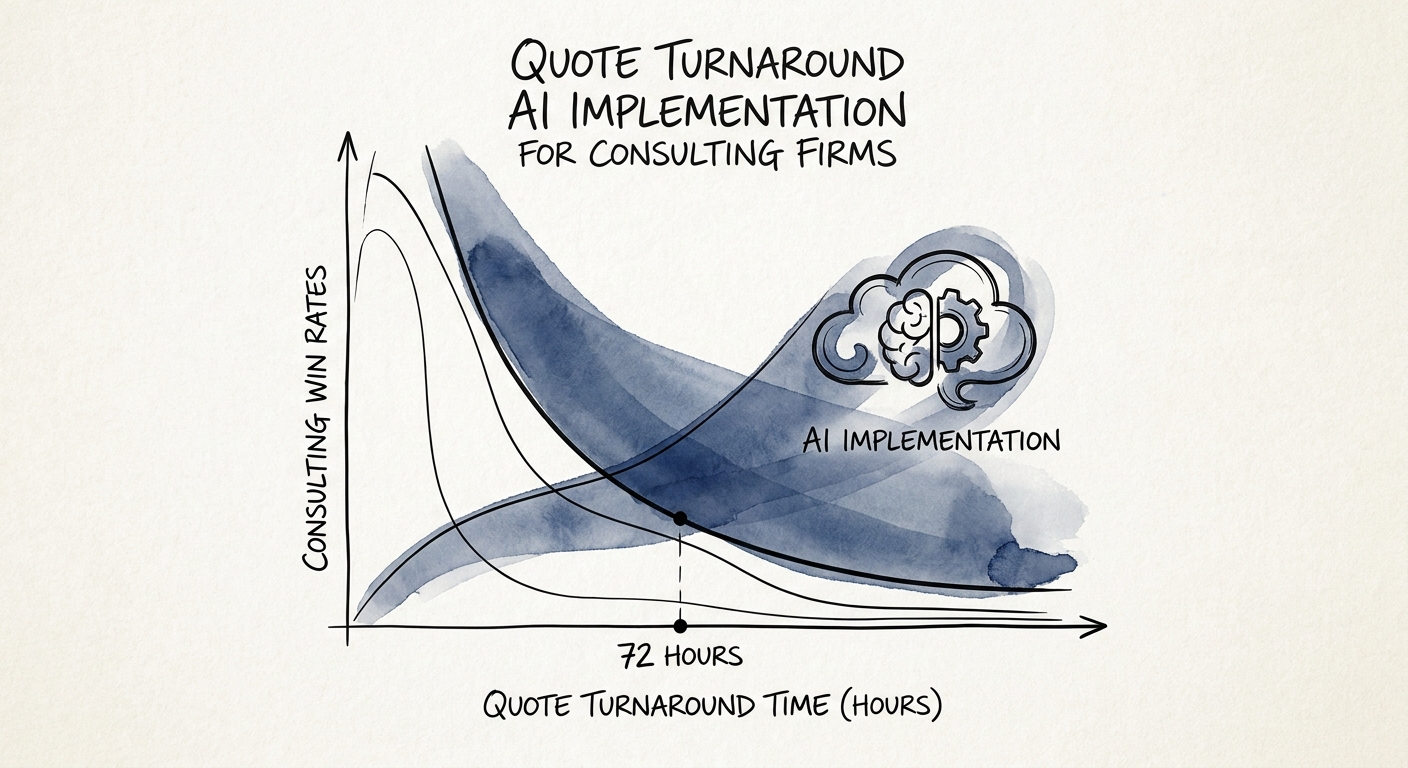
AI Quote Turnaround for Consulting Firms Without Eroding Margin
A consulting quote is a staffing and margin bet, not a document. Here's how to use AI to cut turnaround time while keeping scope, rates, and utilization honest.
1 quote family to prove first
BRIEF · AI FUNCTION USE CASES
Why Sales Onboarding Docs Are the First Thing Your Team Should Hand to AI
Your top rep's pitch lives in their head, not your playbook. Why sales onboarding and talk-track docs are the safest, highest-leverage first AI pilot.
1 role One role-based training workflow before scale
BRIEF · AI VENDOR AND BUILD-VS-BUY
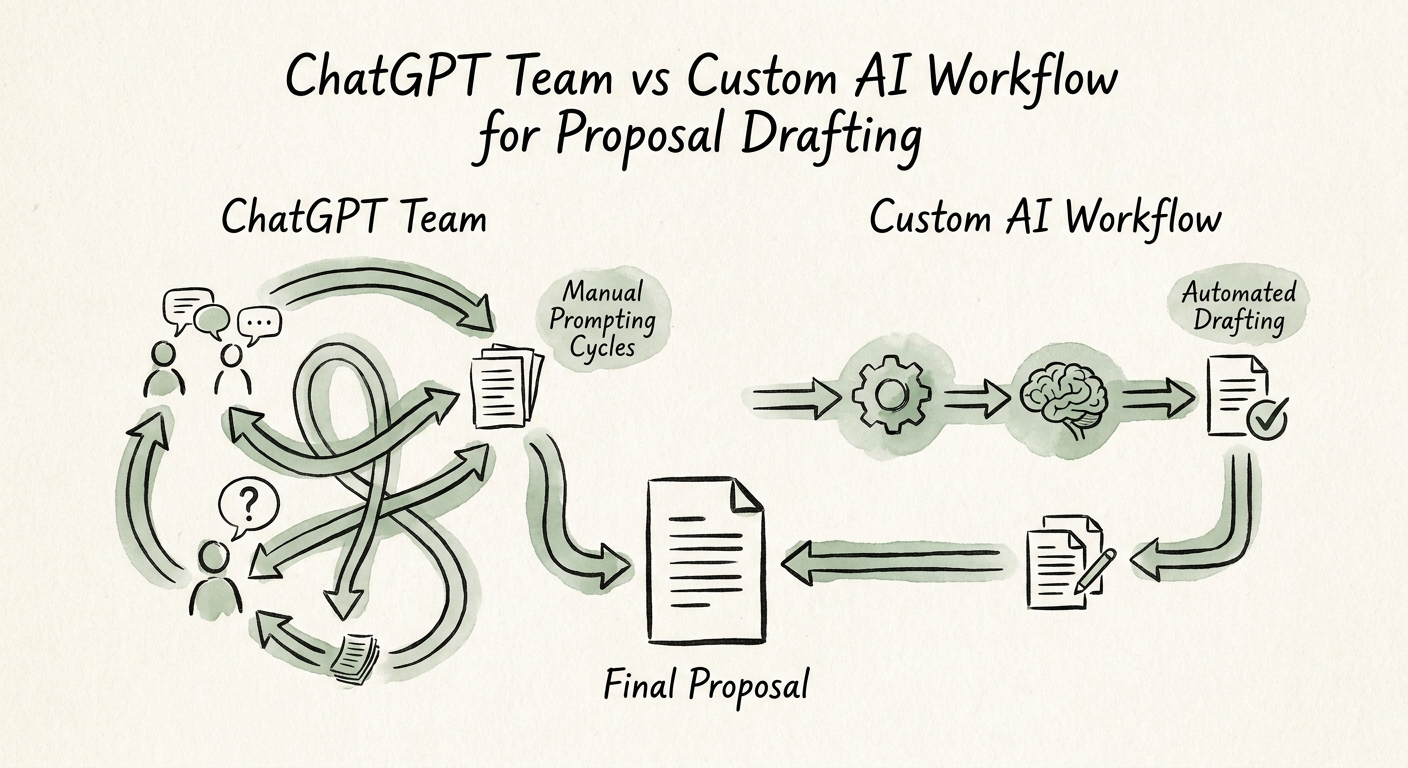
ChatGPT Business or a Custom Workflow for Proposals? Watch What Happens at the Margin Line
A B2B services build-vs-buy guide: when ChatGPT Business is enough for proposal drafting, and when scope, rate cards, and margin force a custom workflow.
2 seats ChatGPT Business minimum standard seats
BRIEF · AI WORKFLOW AUTOMATION
The First Thing Ops Should Automate With AI Is the Inventory Exception Queue
Why the inventory exception queue is the best first AI pilot for ops teams: every miss has an owner, a source record, and a reorder consequence you can measure.
1 exception queue One exception queue with measurable owner response
BRIEF · AI MEASUREMENT AND ROI
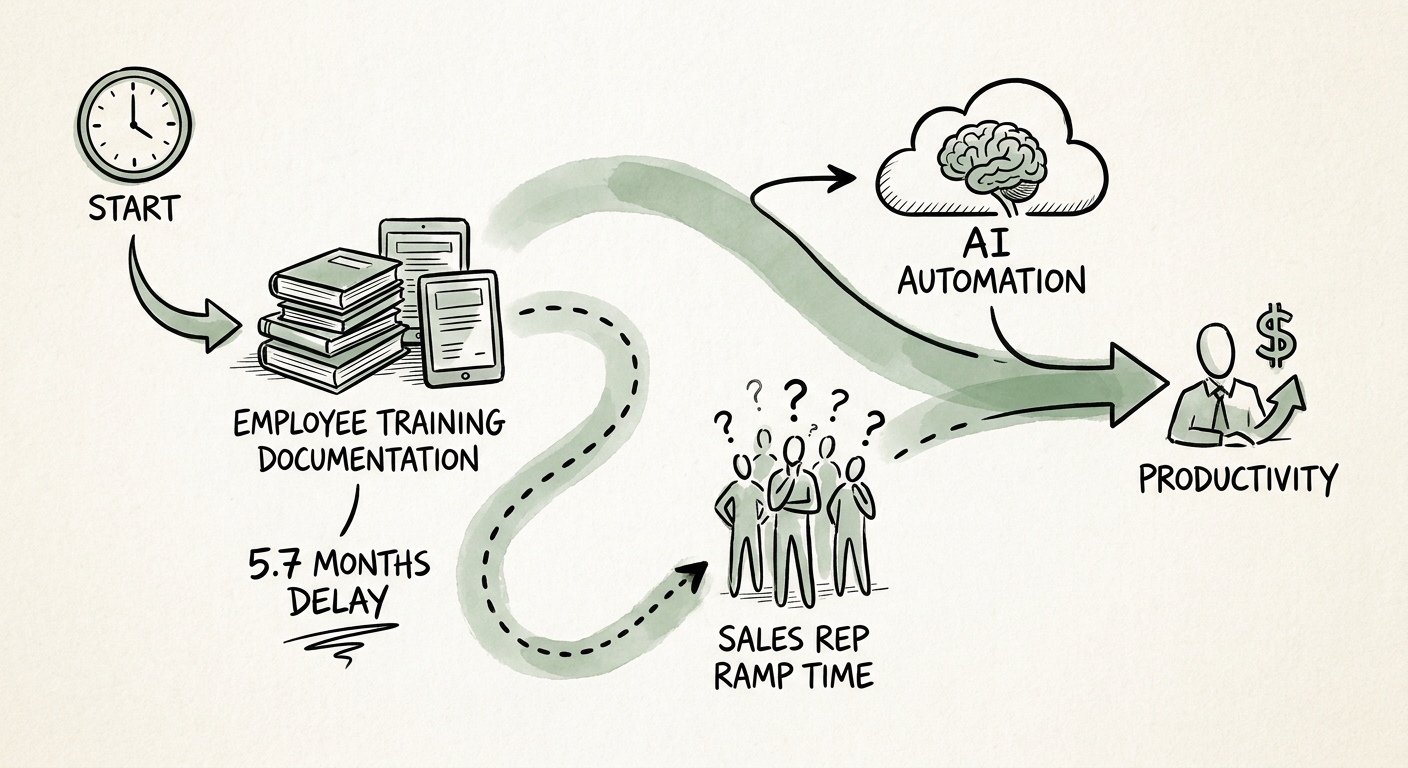
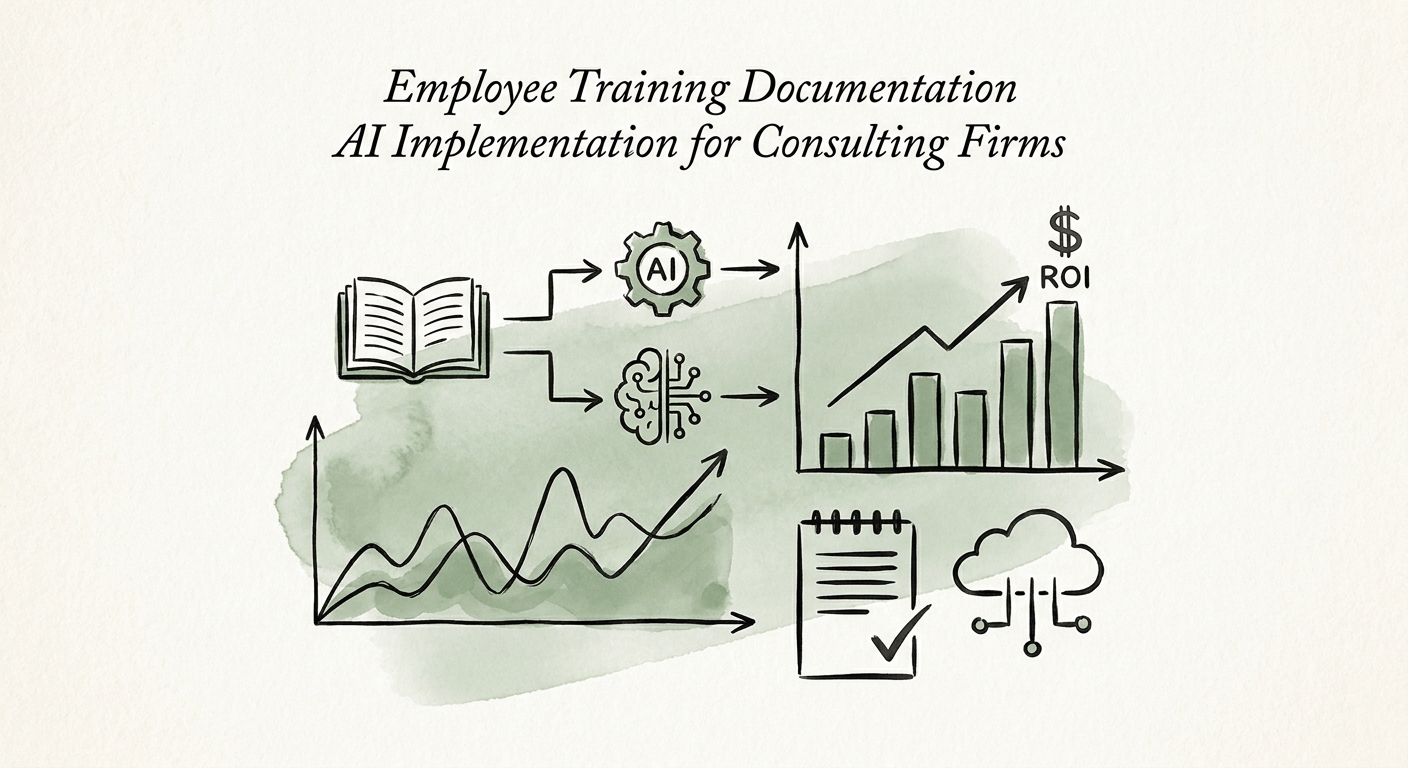
AI on Your Onboarding Docs: Why New Consultants Should Still Bother a Partner
A practical guide for consulting firms putting AI on training and onboarding documentation without teaching new hires last year's method.
34% Companies using AI to deeply transform the business