BRIEF · AI GOVERNANCE AND TRAINING
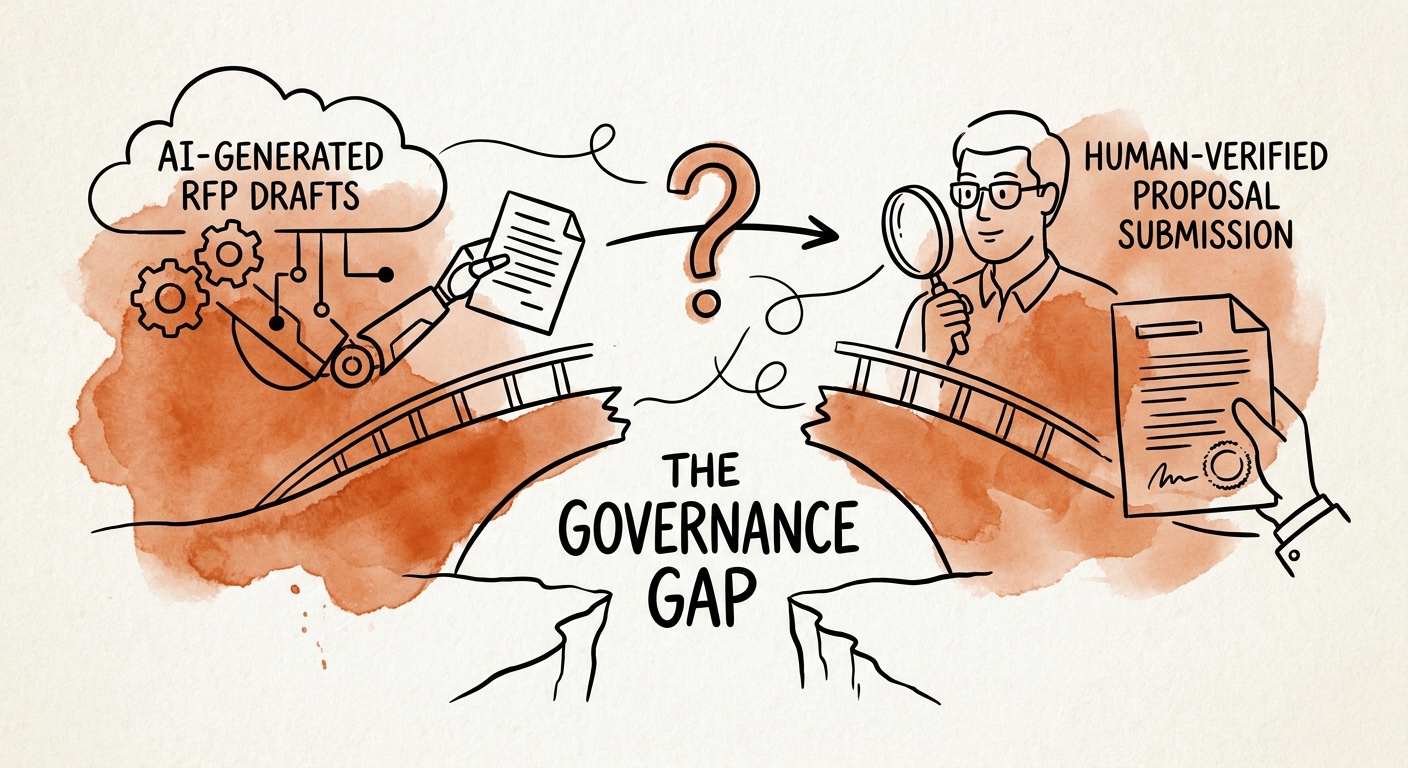
When Not to Automate RFP Responses: The Answer Library Test
An AI RFP assistant that retrieves approved answers saves days. One that drafts security and pricing answers from stale decks signs you up for things you didn't agree to.
4 RFP controls before automation
BRIEF · AI WORKFLOW AUTOMATION
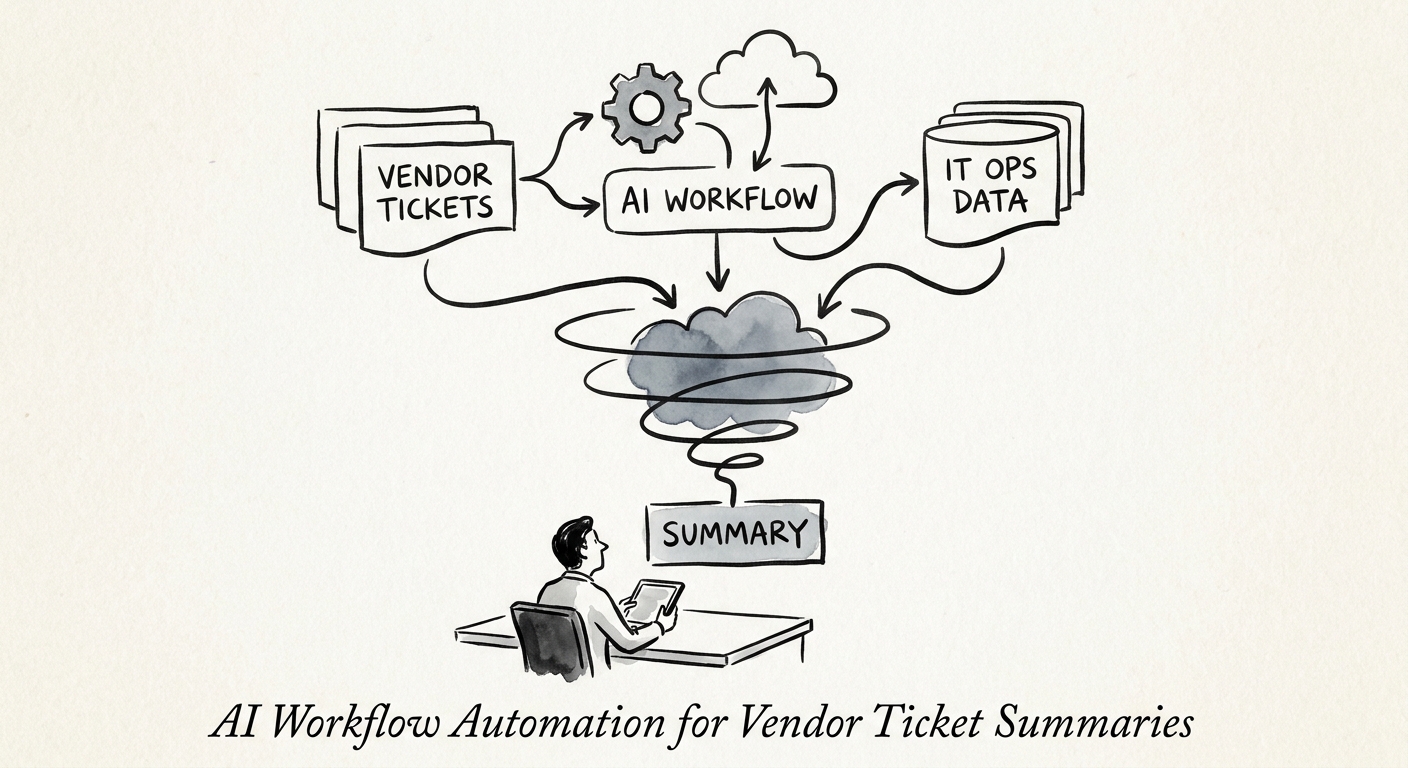
Stop Rebuilding the Same Vendor Ticket Context Every Escalation
Your team retypes the same vendor history into every escalation. Here is how IT and ops teams use AI to assemble the packet without losing accountability.
30 days to pilot vendor-ticket summary automation
BRIEF · AI WORKFLOW AUTOMATION
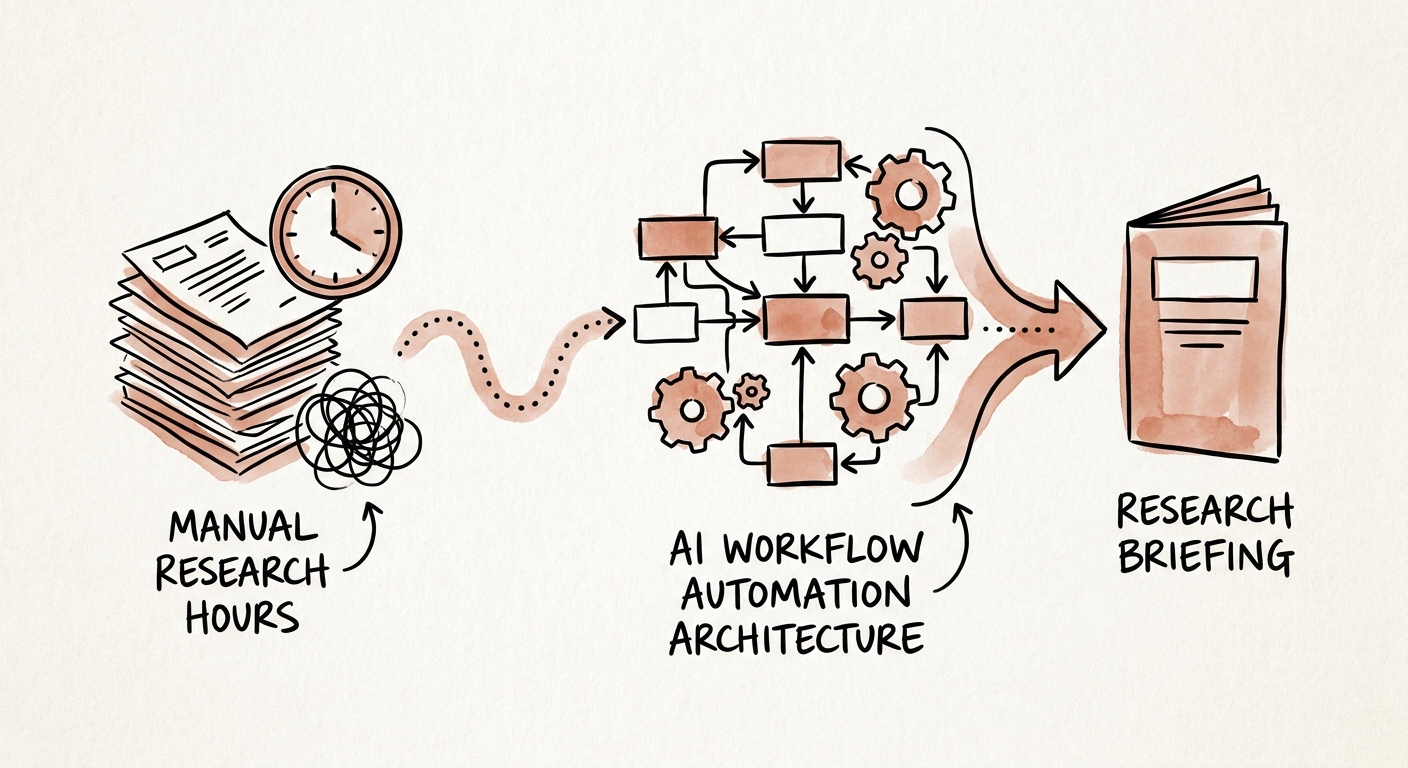
Automating the Research Brief: How to Make AI Prep Trustworthy Enough to Walk Into a Meeting
A briefing your partner can actually trust before a client meeting needs sources, dates, and a human reviewer baked in — not a longer summary. Here's the build.
4 briefing controls before scale
BRIEF · AI INDUSTRY USE CASES
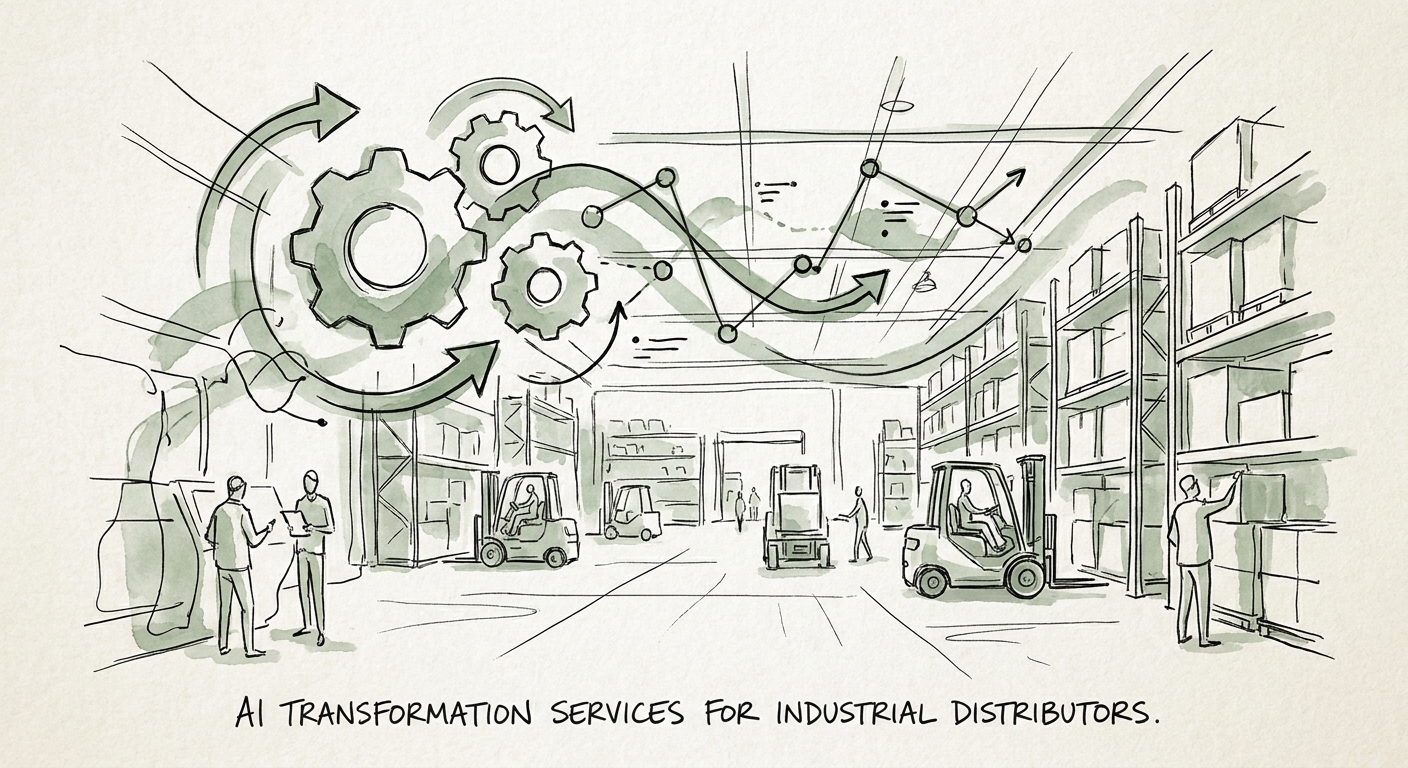
AI for Industrial Distributors: Fix the Quote Desk Before You Buy a Single Tool
Where AI actually pays off for industrial distributors: quote turnaround, substitutions, backorders, and invoice disputes. A workflow-first plan, not a dashboard.
6 distribution workflows to score before tool selection
BRIEF · AI MEASUREMENT AND ROI
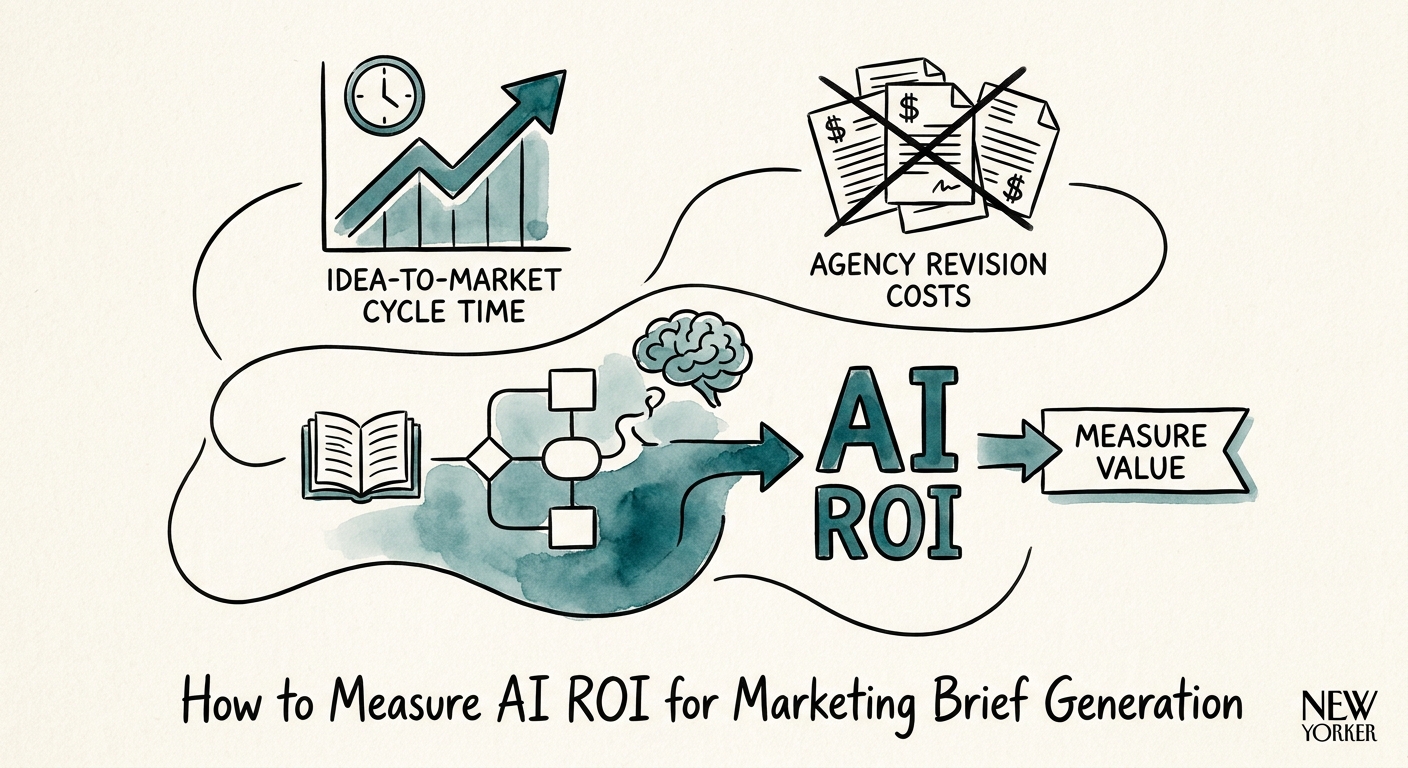
The Marketing Brief Is the Wrong Place to Look for AI Savings (Look Here Instead)
A creative brief that goes back three times costs more than a slow one. Here is how to measure AI ROI on brief generation by what it does to rework, not minutes.
30 days to baseline and pilot one marketing brief workflow
BRIEF · AI INDUSTRY USE CASES
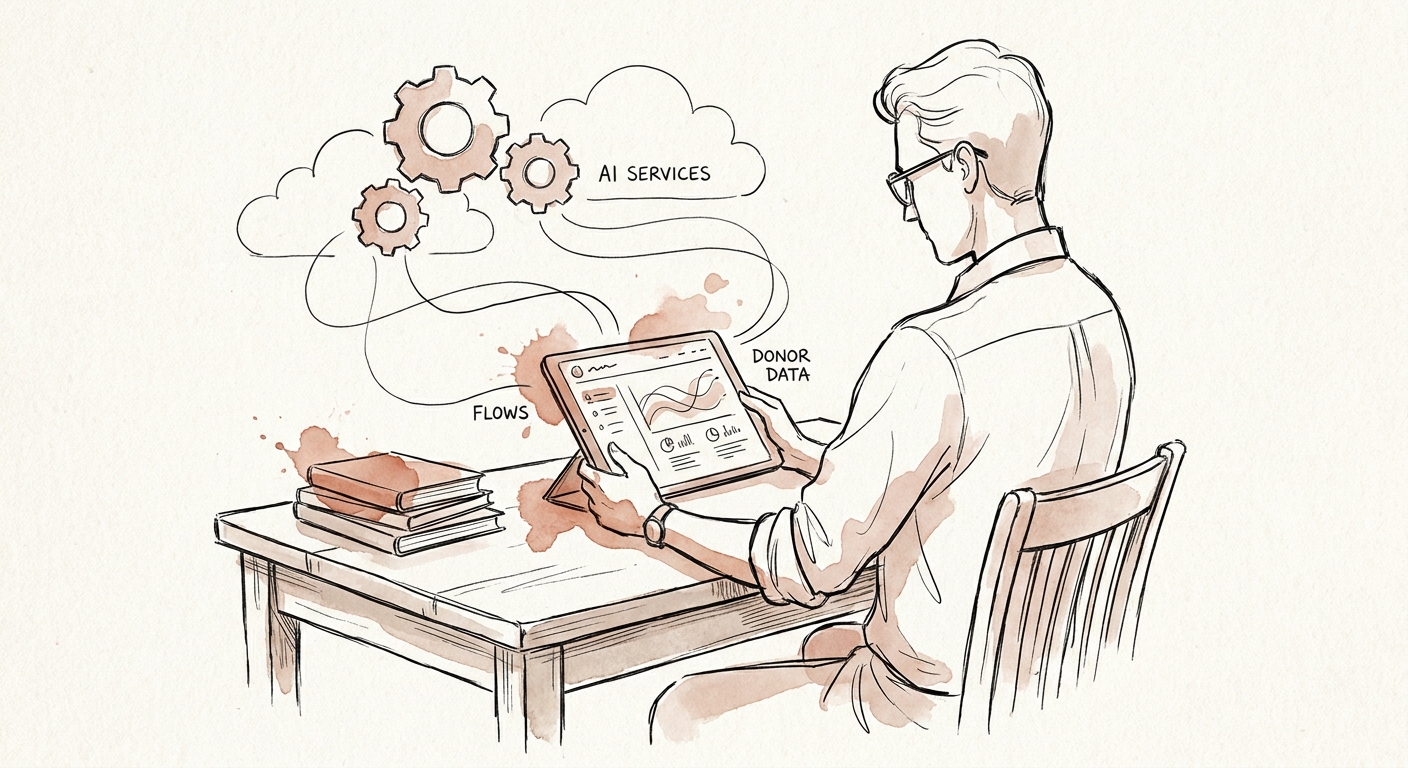
AI for Nonprofits: Start With the Grant Report, Not the Mission
Where AI actually helps a nonprofit: grant reporting, donor stewardship, board prep. A worked path that returns staff hours to mission without risking trust.
4 nonprofit workflows to evaluate first
BRIEF · AI MEASUREMENT AND ROI
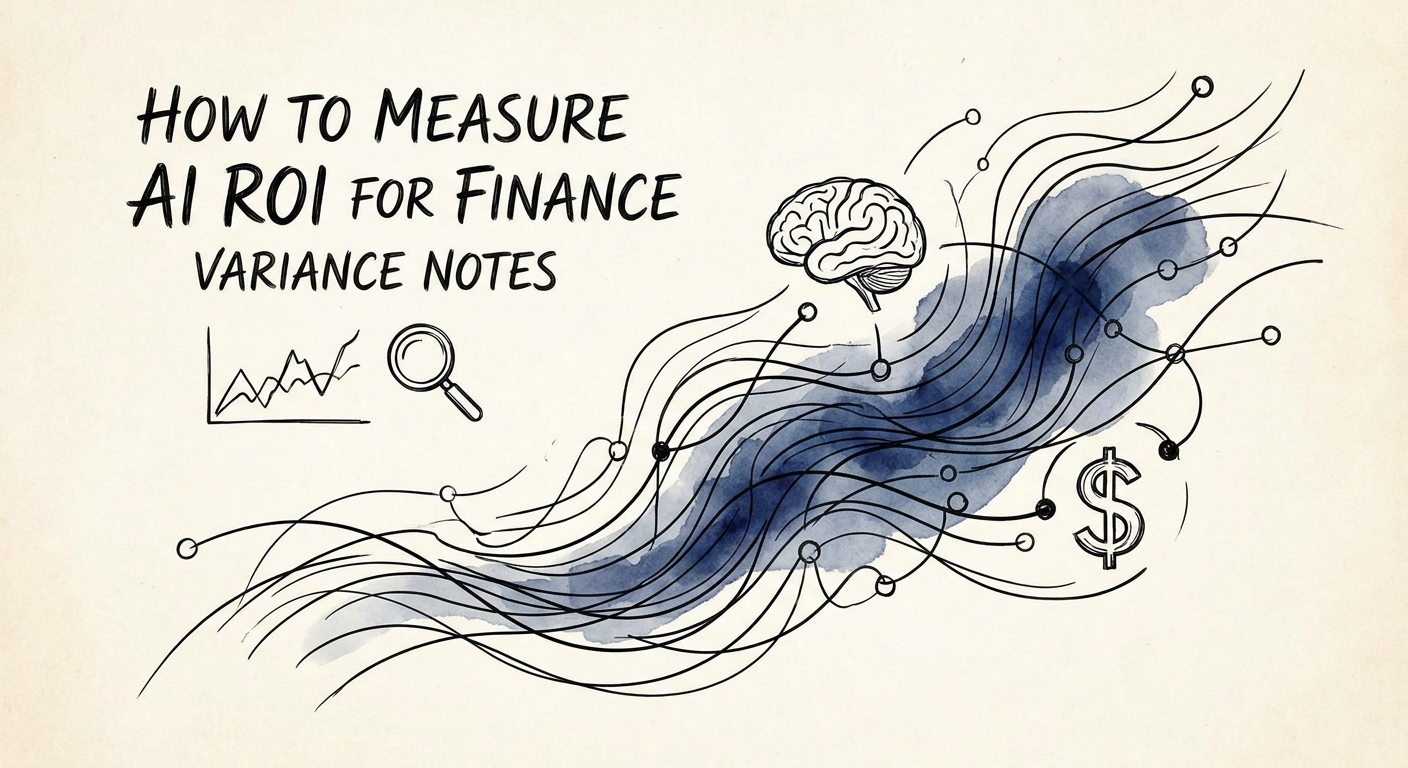
AI ROI for Finance Variance Notes: Proving It in the Close, Not the Demo
A variance note that reads well but can't trace its numbers is a liability. Here's how to measure whether AI on variance commentary actually pays off.
5 measures needed for finance variance notes ROI
BRIEF · AI MEASUREMENT AND ROI
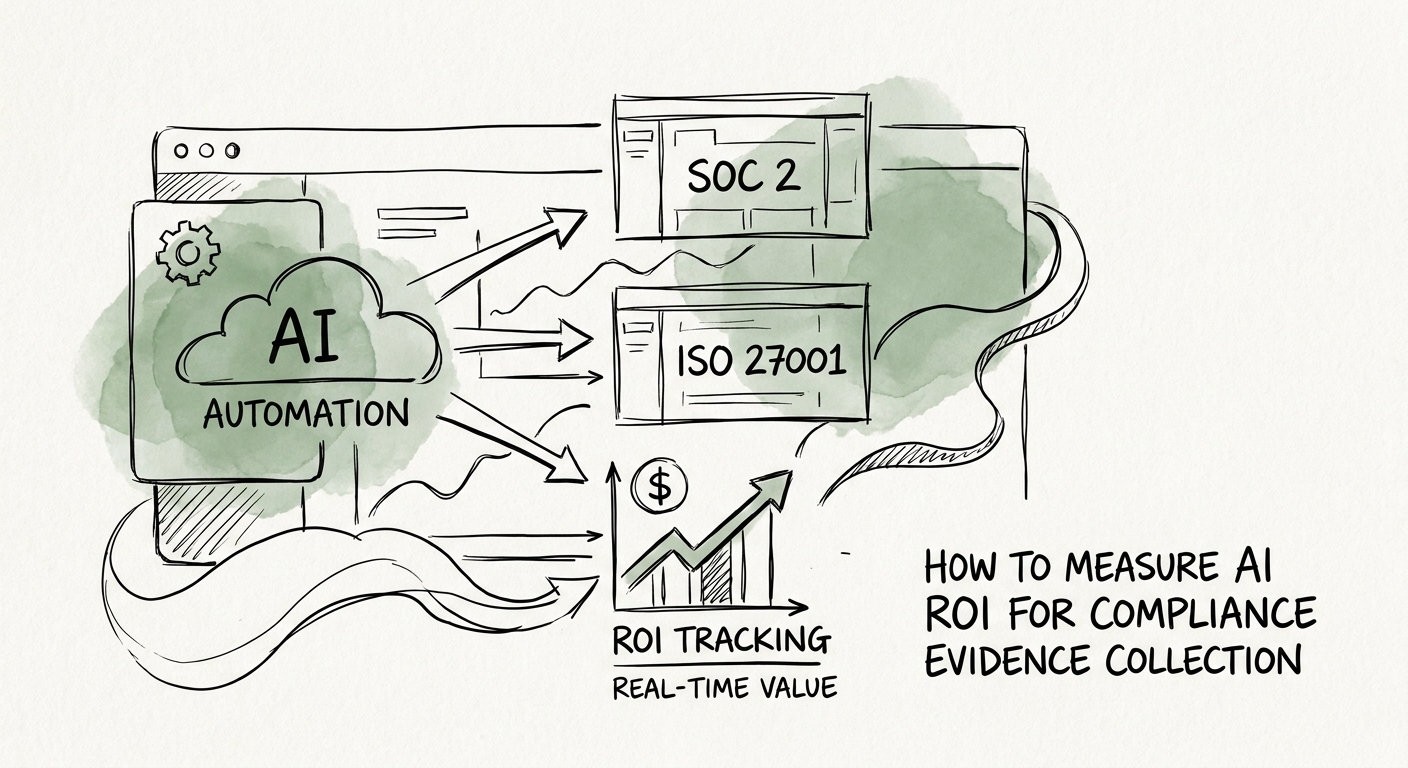
AI for Compliance Evidence: Measure the Reopen Rate, Not the Page Count
A faster audit packet that auditors reject isn't ROI. Measure AI on evidence request age, first-pass acceptance, and reopen rate at your tech-services firm.
5 measures needed for compliance evidence collection ROI
BRIEF · AI MEASUREMENT AND ROI
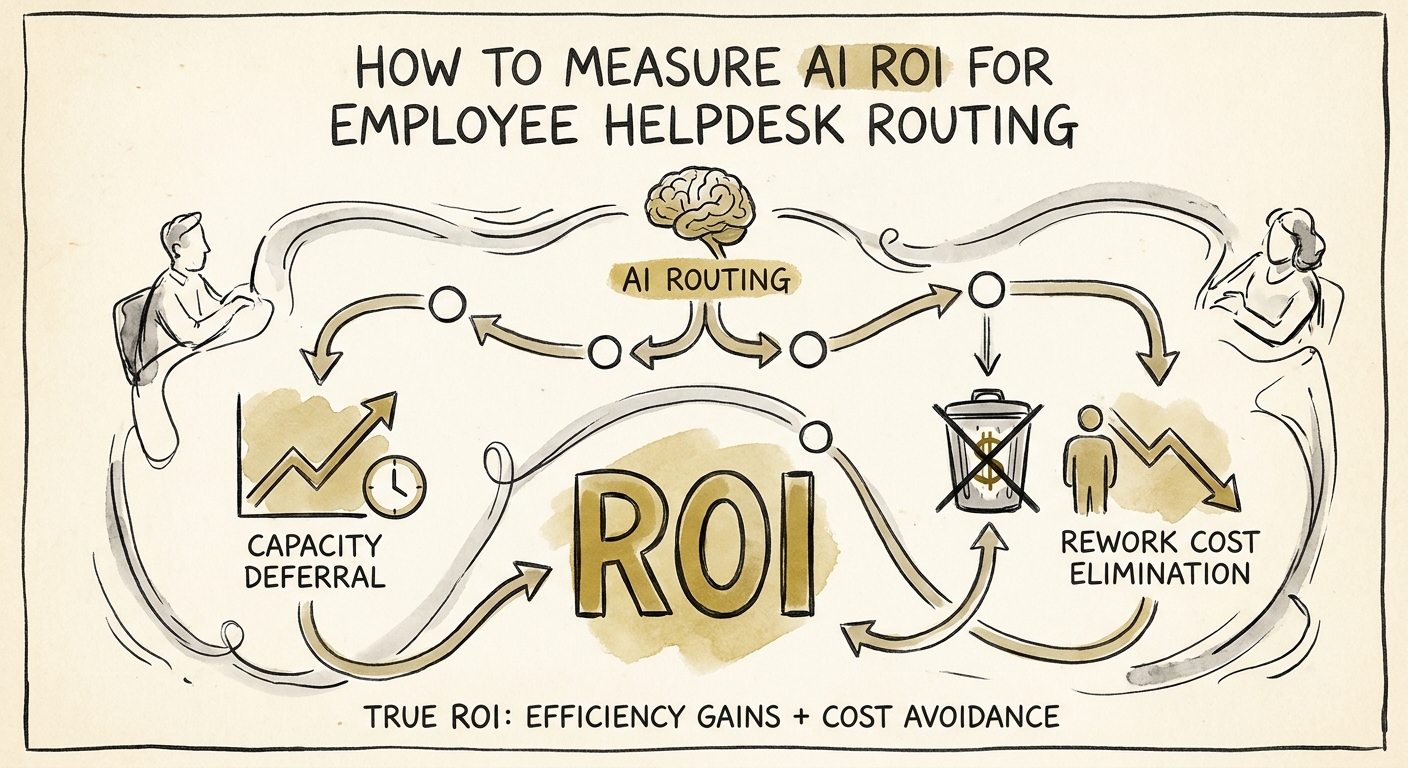
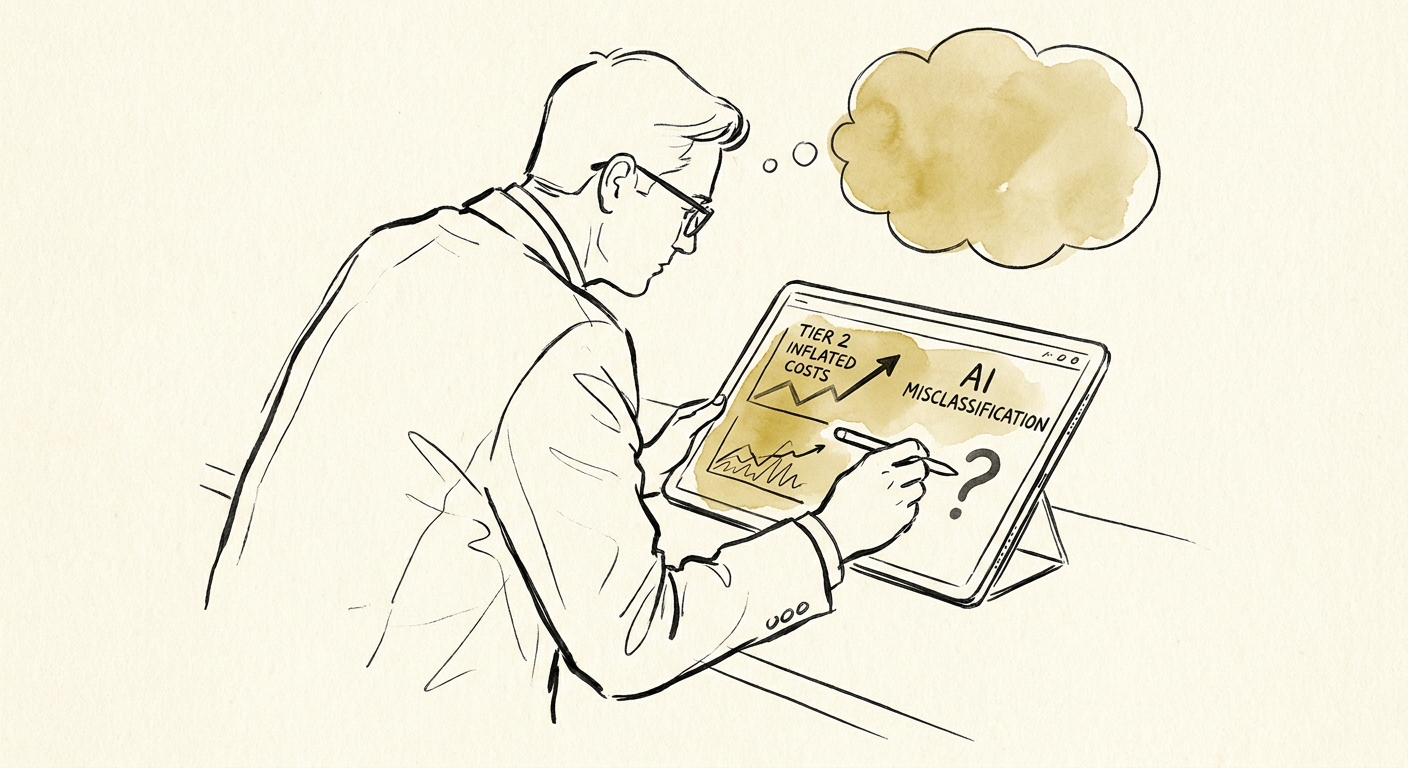
AI for Employee Helpdesk Routing: What ROI Actually Looks Like
A "where do I send this?" ticket that bounces three times costs more than the answer. Here's how to measure whether AI routing actually fixes it.
30 days to baseline employee helpdesk routing before piloting AI
BRIEF · AI GOVERNANCE AND TRAINING
The Helpdesk Ticket Your AI Router Should Never Auto-Close
Most helpdesk tickets are safe to auto-route. The 3 that aren't — access grants, spend exceptions, and "it's down" tickets — can quietly cost you. Here's the line.
3 helpdesk request types that need human review
BRIEF · AI GOVERNANCE AND TRAINING
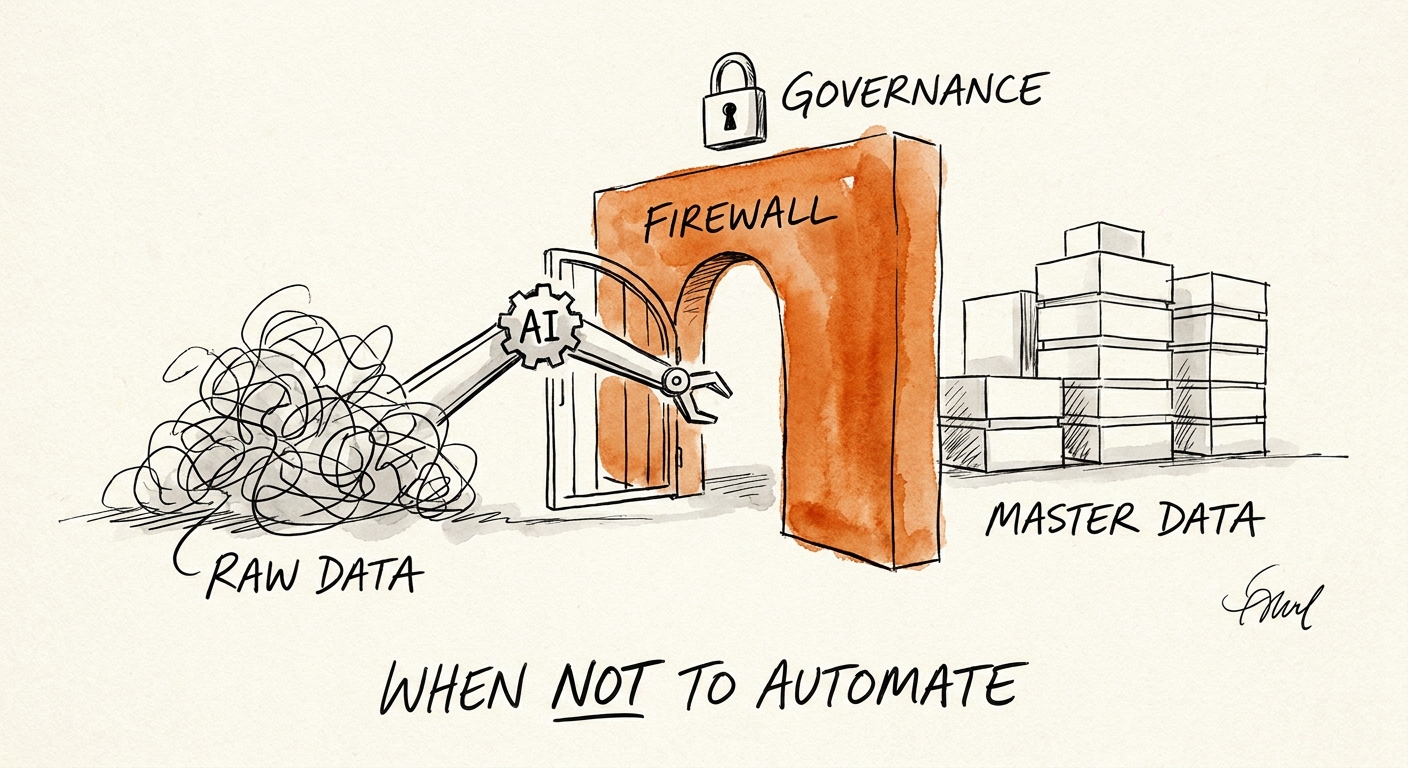
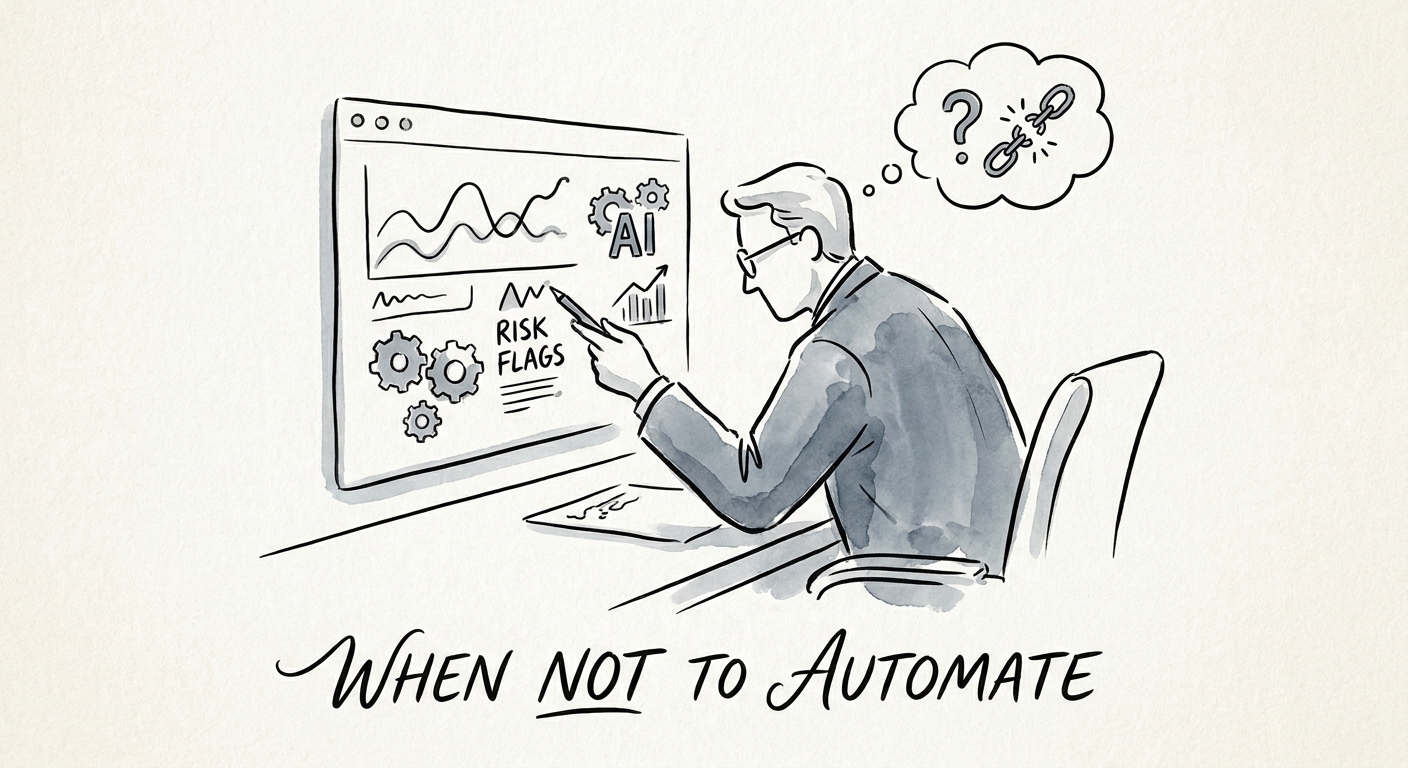
When the Right Move Is to NOT Automate Your Data Cleanup
A model that "cleans" 80,000 records before anyone agrees what a correct record is just standardizes the wrong answer at scale. Three gates to pass first.
3 readiness gates before data cleanup automation
BRIEF · AI WORKFLOW AUTOMATION
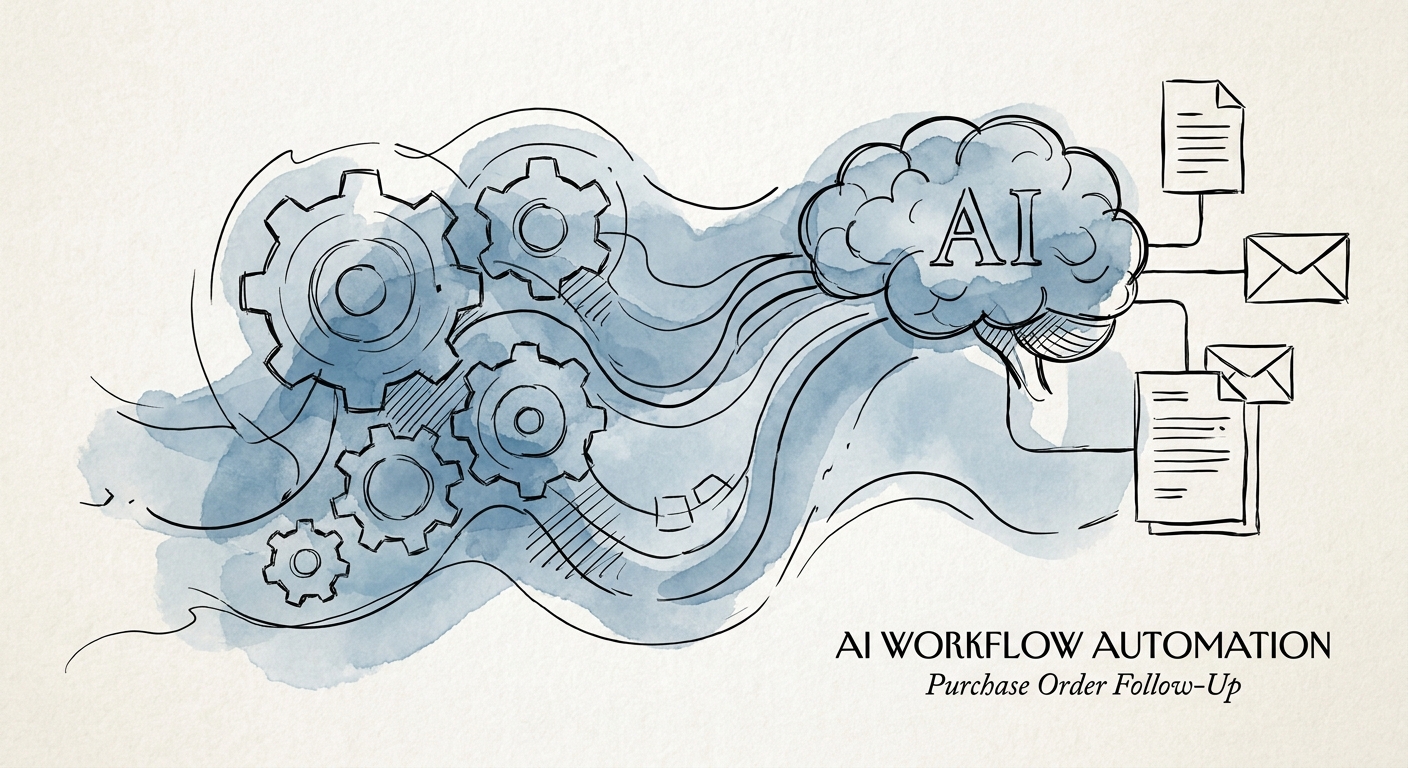
AI for Purchase Order Follow-Up: Catch the Late Supplier Before the Line Stops
A manufacturing buyer chases 200 open POs by memory and email. Here's how to put AI on the routine chasing and keep the date-slip exceptions in front of a human.
4 exception categories to review before ERP updates
BRIEF · AI WORKFLOW AUTOMATION
The Feature You Promised, the Feature You Built: AI QA for Services Delivery
The defects that kill services margin live in the gap between signoff and build. Here's how to point AI at that gap and surface exceptions before the client does.
Review gate first AI implementation QA milestone
BRIEF · AI GOVERNANCE AND TRAINING
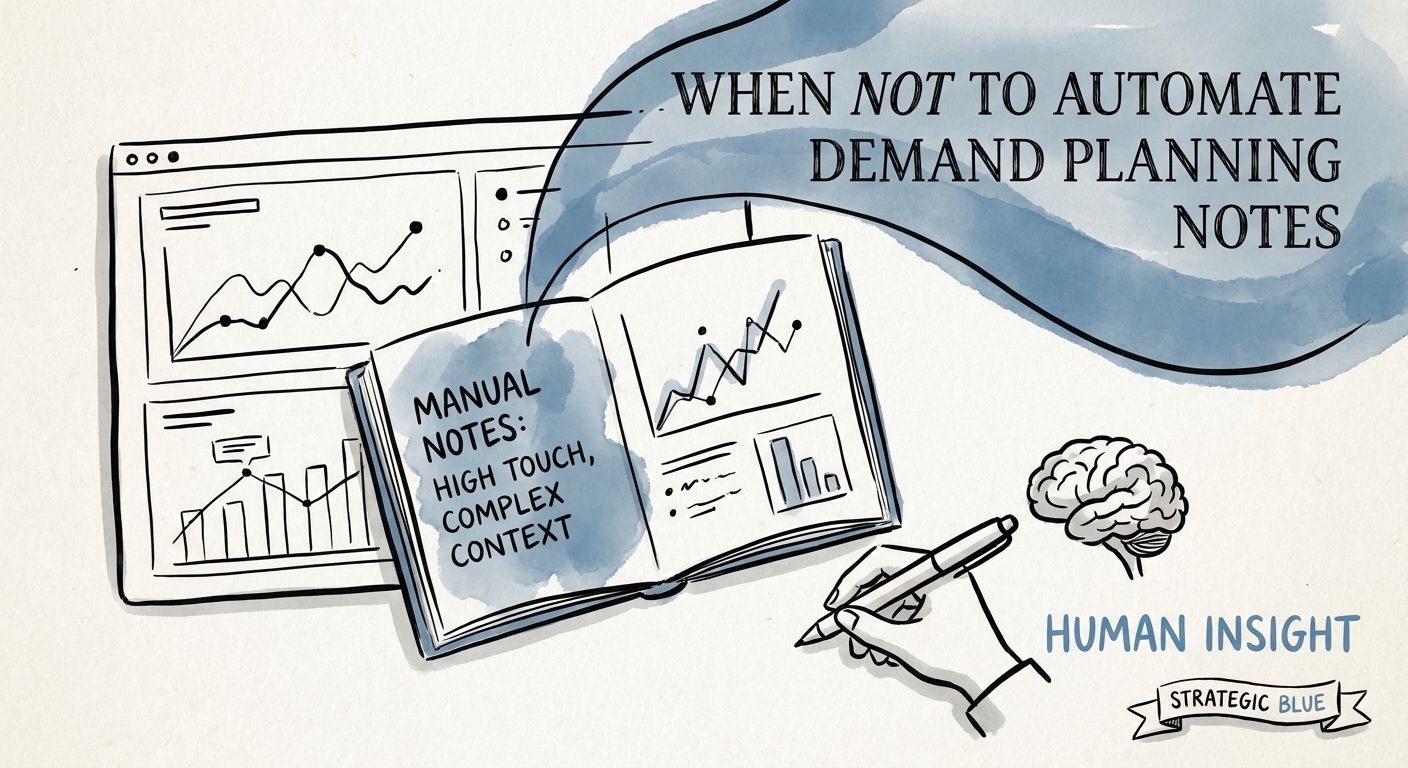
The Demand Planning Note That AI Should Never Write Alone
An AI can explain why a SKU forecast moved. It can't own the promotion bet or the supply cap behind it. Where to draw the line in demand planning.
4 planning controls before automation

BRIEF · AI INDUSTRY USE CASES
AI for Construction Companies: Close the Field-to-Office Gap Before It Eats Your Margin
Where construction AI actually pays off: RFIs, change-order backup, daily logs, and job-cost variance. A field-to-office workflow plan, not a dashboard demo.
90 days for one construction AI workflow pilot and review
BRIEF · AI GOVERNANCE AND TRAINING
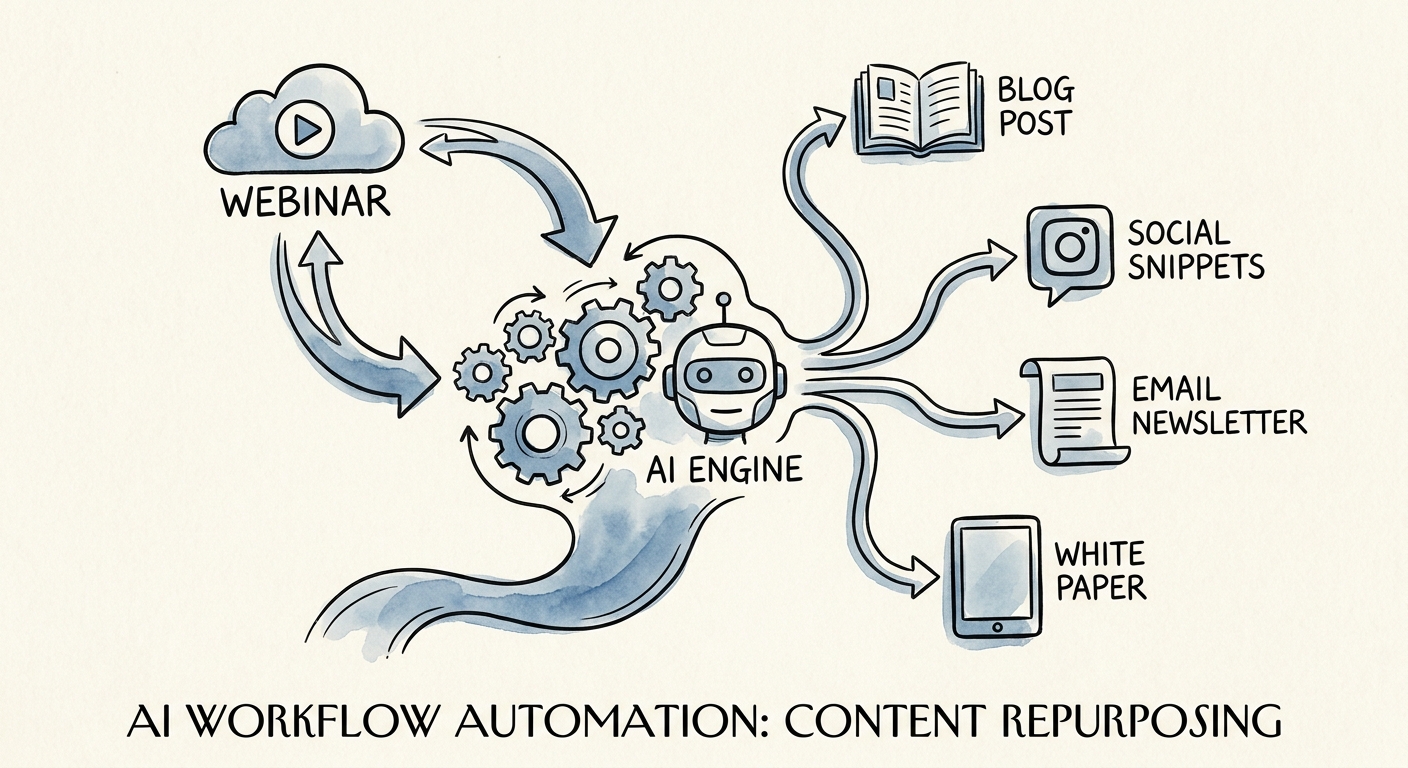
When Content Repurposing Goes Wrong: AI Turns One Webinar Into Forty Claims You Never Made
Repurposing AI splits one asset into dozens of derivatives. Here's the line between a fast reuse engine and a machine that invents positioning you never approved.
3 red flags before automating content repurposing
BRIEF · AI MEASUREMENT AND ROI
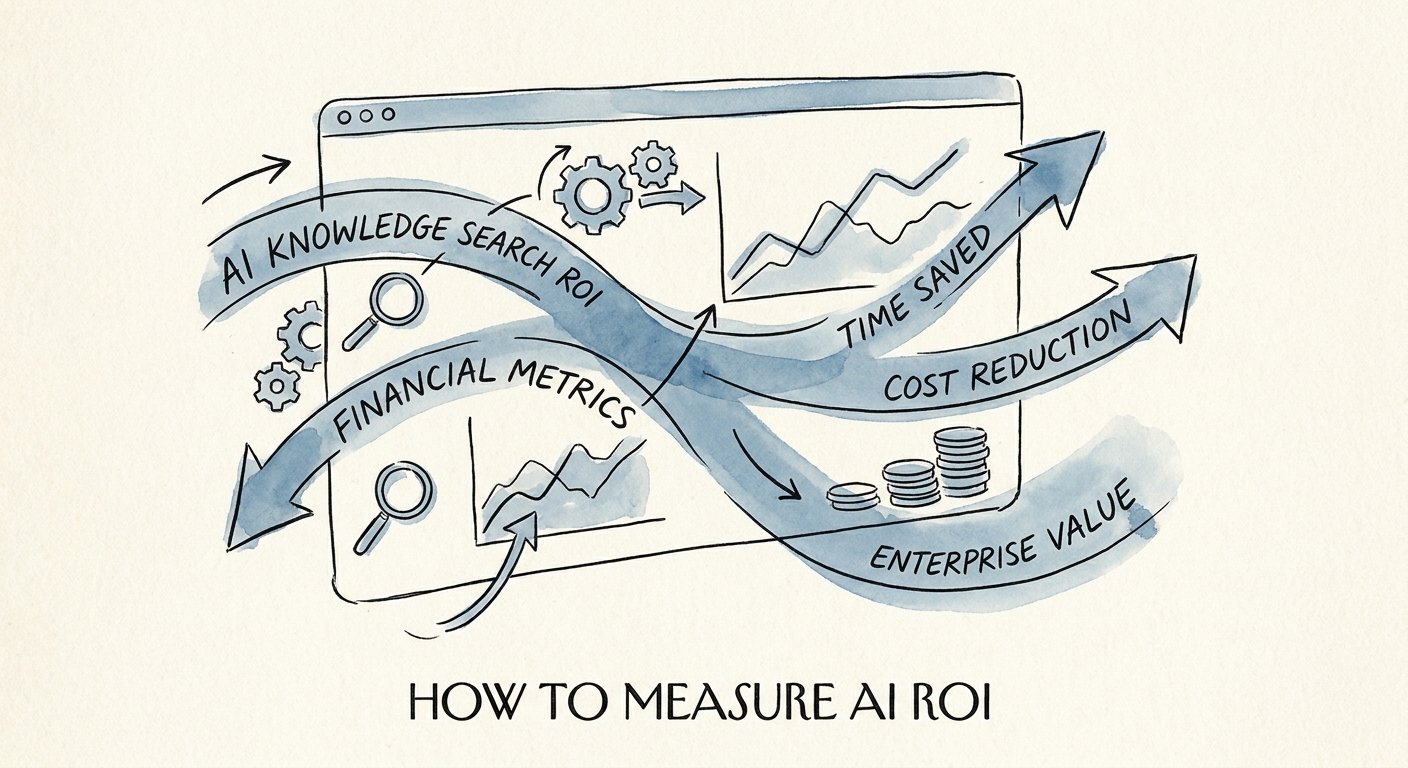
Internal Knowledge Search ROI: Measure the Interruptions It Kills, Not the Searches It Speeds
The ROI of an internal knowledge assistant isn't faster search. It's fewer Slack pings to your three people who know how things actually work. Here's how to count it.
5 measures needed for internal knowledge search ROI
BRIEF · AI WORKFLOW AUTOMATION
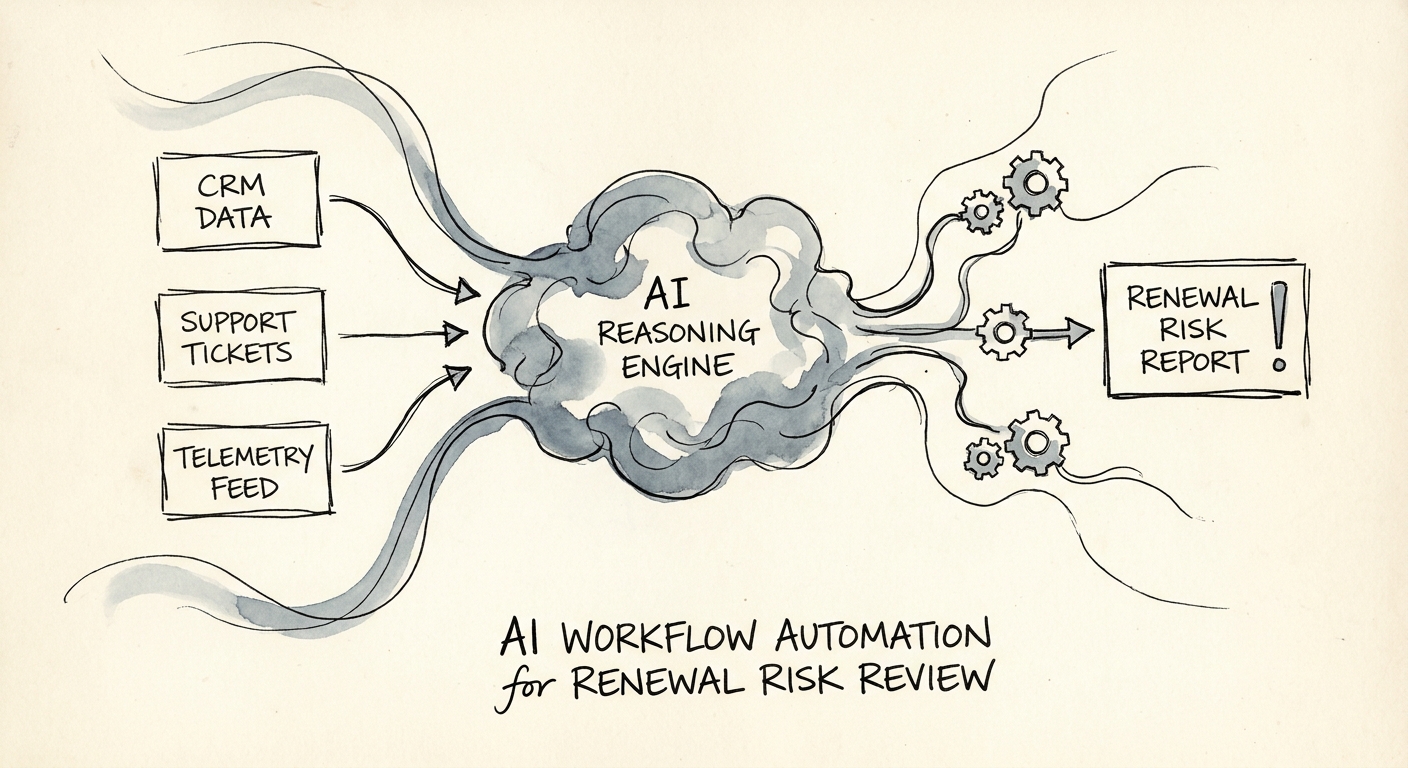
The Renewal You Lost in Q3 Was Already Dead in Q1
By the time a B2B SaaS renewal slips into the forecast as risk, you missed the signals months earlier. Here's how to assemble them before the QBR.
4 renewal signals to connect
BRIEF · AI GOVERNANCE AND TRAINING
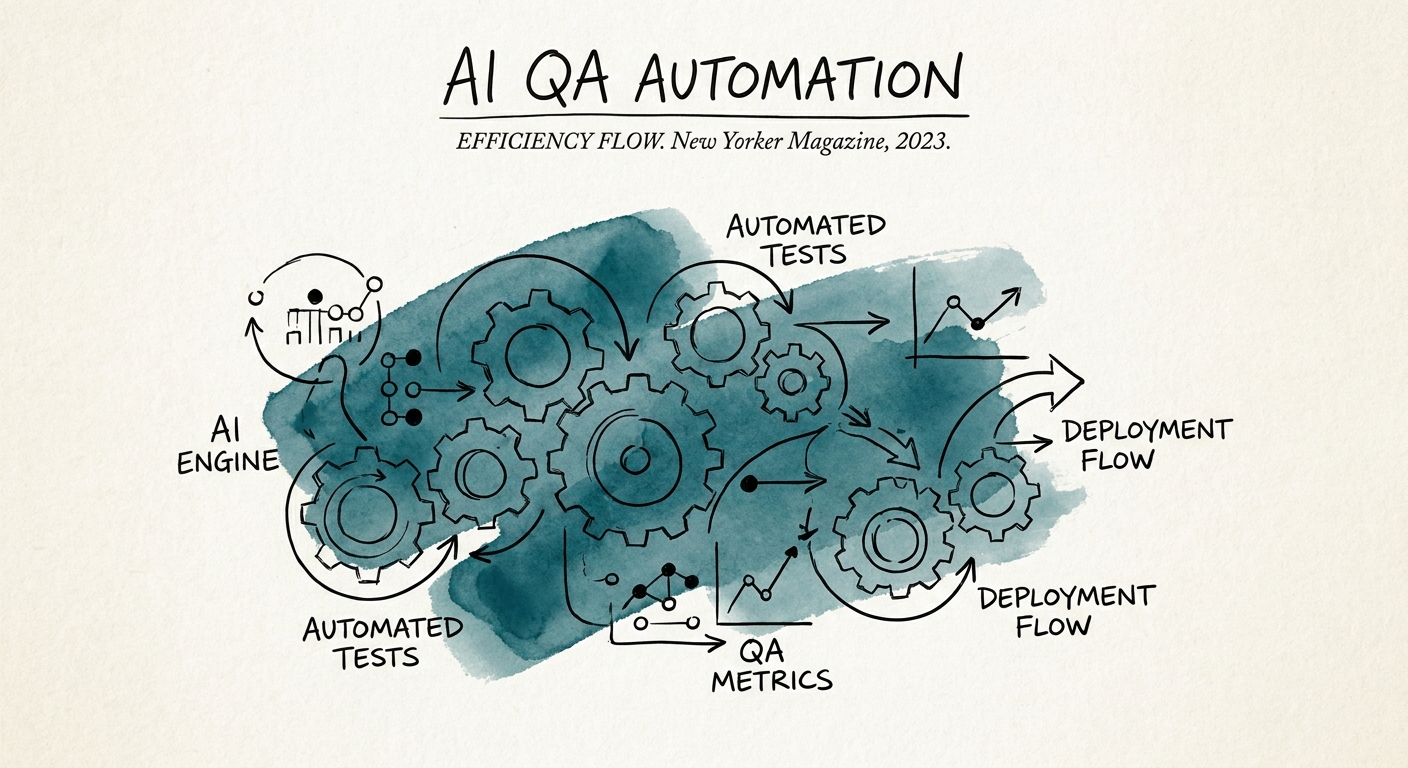
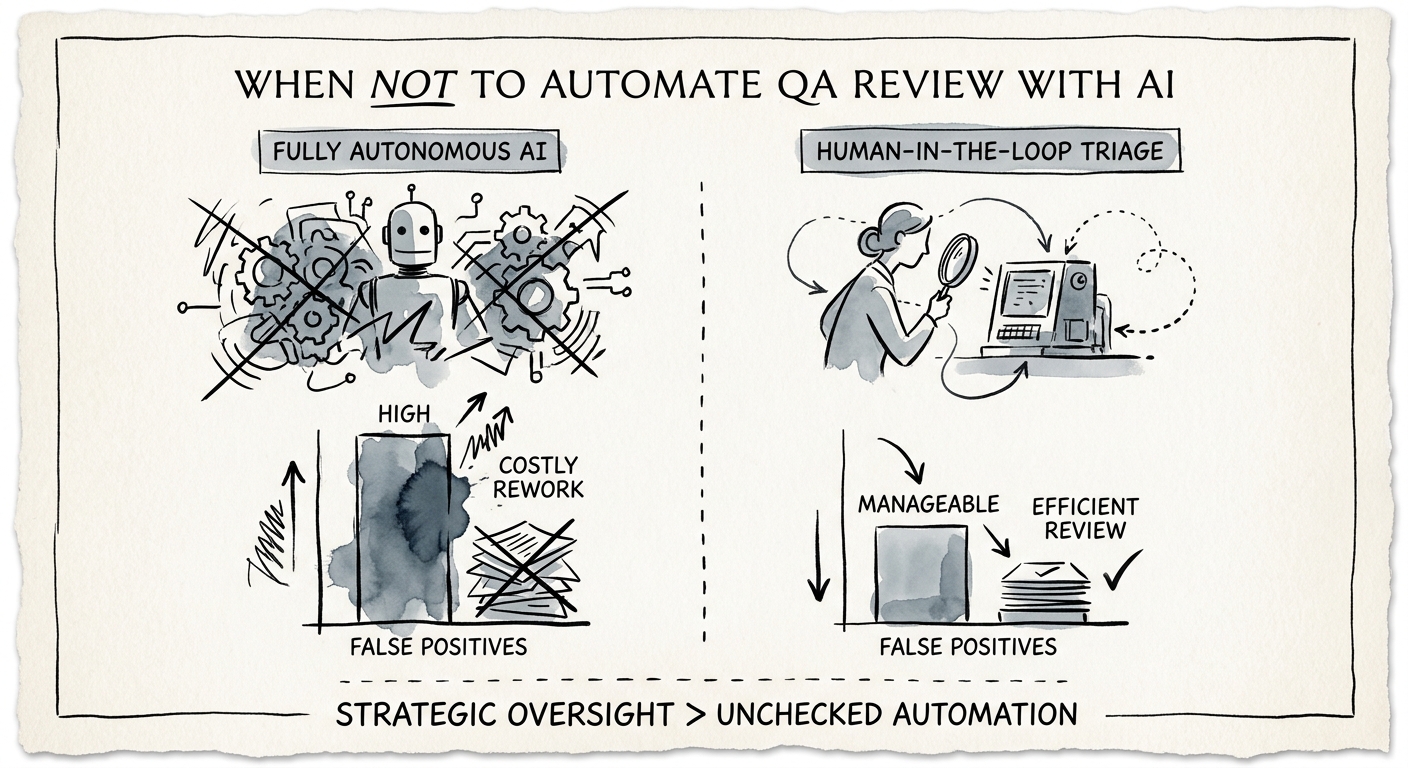
Why AI Loves Failing Your QA Review (And the Bugs It Waves Through)
An AI QA reviewer passes the build that breaks on Tuesday. Here is exactly where a tech team should let AI triage tickets and where a human still signs off.
21% leaders with mature agent governance
BRIEF · AI WORKFLOW AUTOMATION
The 40-Asset Webinar: How to Automate Content Repurposing Without Multiplying Mistakes
One approved source, dozens of channel assets. Here is how to automate content repurposing so AI amplifies your best thinking instead of your worst typo.
4 checks needed before content repurposing automation
BRIEF · AI INDUSTRY USE CASES
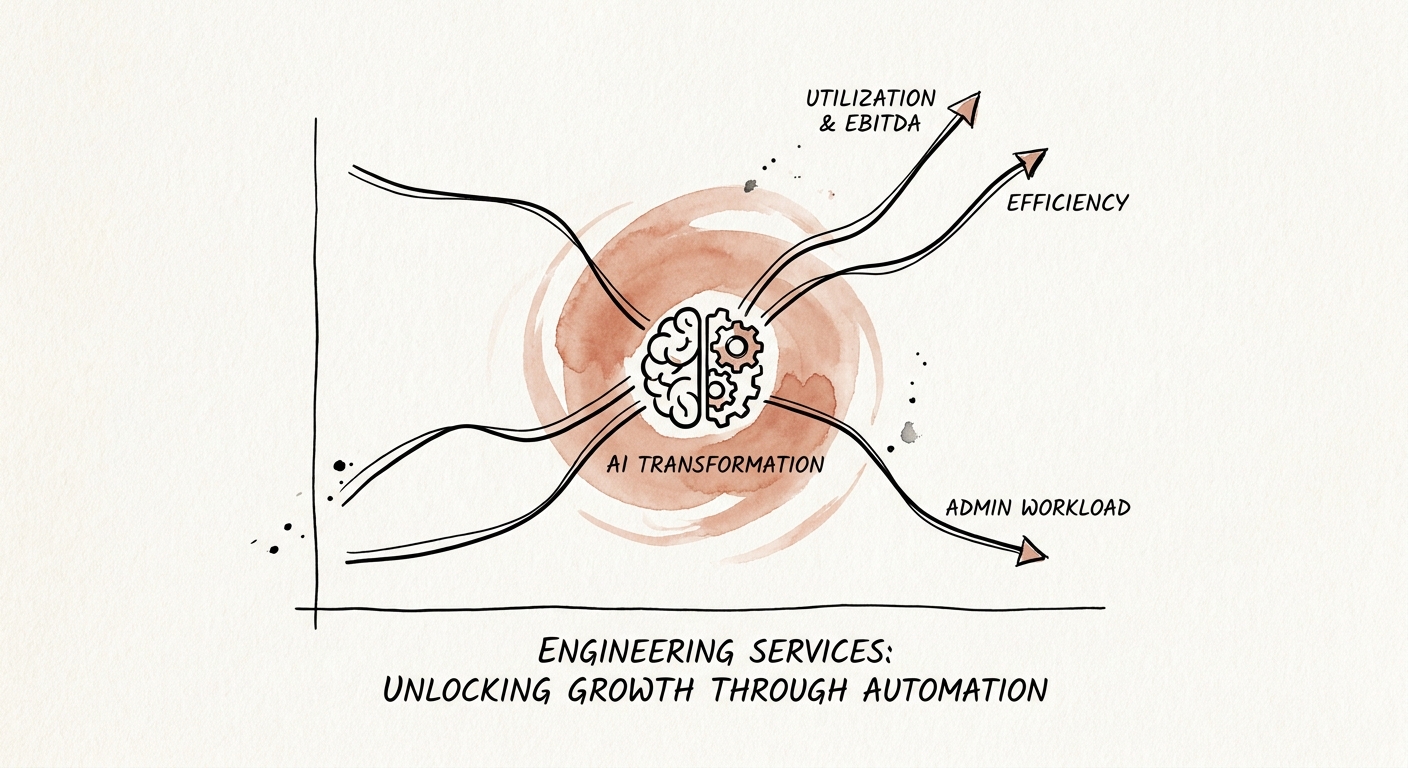
AI for Engineering Services Firms: Start With the RFI Backlog, Not the Drawings
Where engineering firms should actually start with AI: RFIs, submittals, change orders, and delivery reporting — with the engineer-of-record signoff intact.
5 engineering workflows to govern first
BRIEF · AI WORKFLOW AUTOMATION
AI QA Review: Let It Read Every Ticket, Not Score a Single One
B2B ops and CS teams sample 3% of tickets and calls. Here's how to use AI to read all of them for evidence, while humans still own the score.
5 QA decision types that require human review
BRIEF · AI TRANSFORMATION STRATEGY
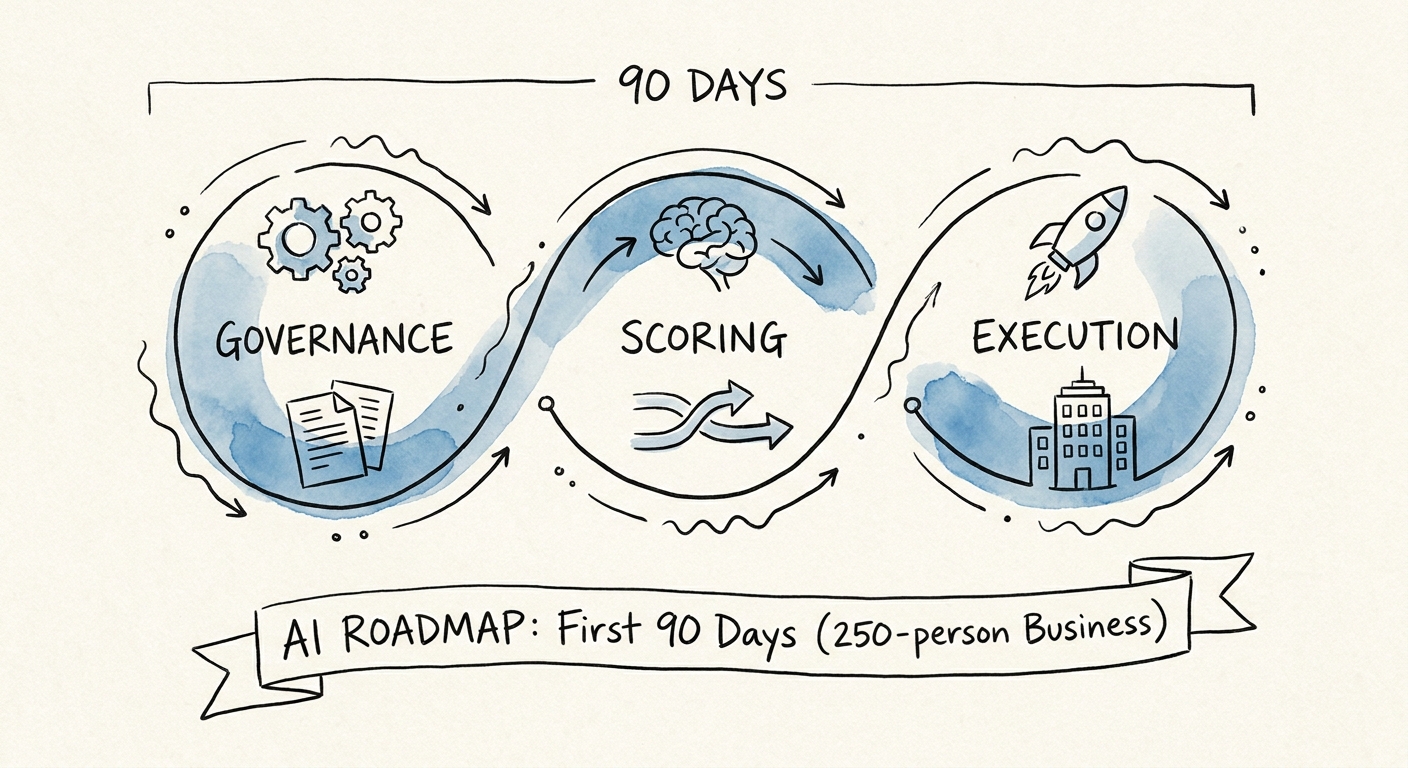
The 250-Person AI Roadmap: What to Actually Do in the First 90 Days
A real 90-day AI plan for a ~250-person company: inventory the work, fix who-can-see-what before rollout, run two governed pilots, and decide what scales.
90 days to move from inventory to governed pilots
BRIEF · AI MEASUREMENT AND ROI
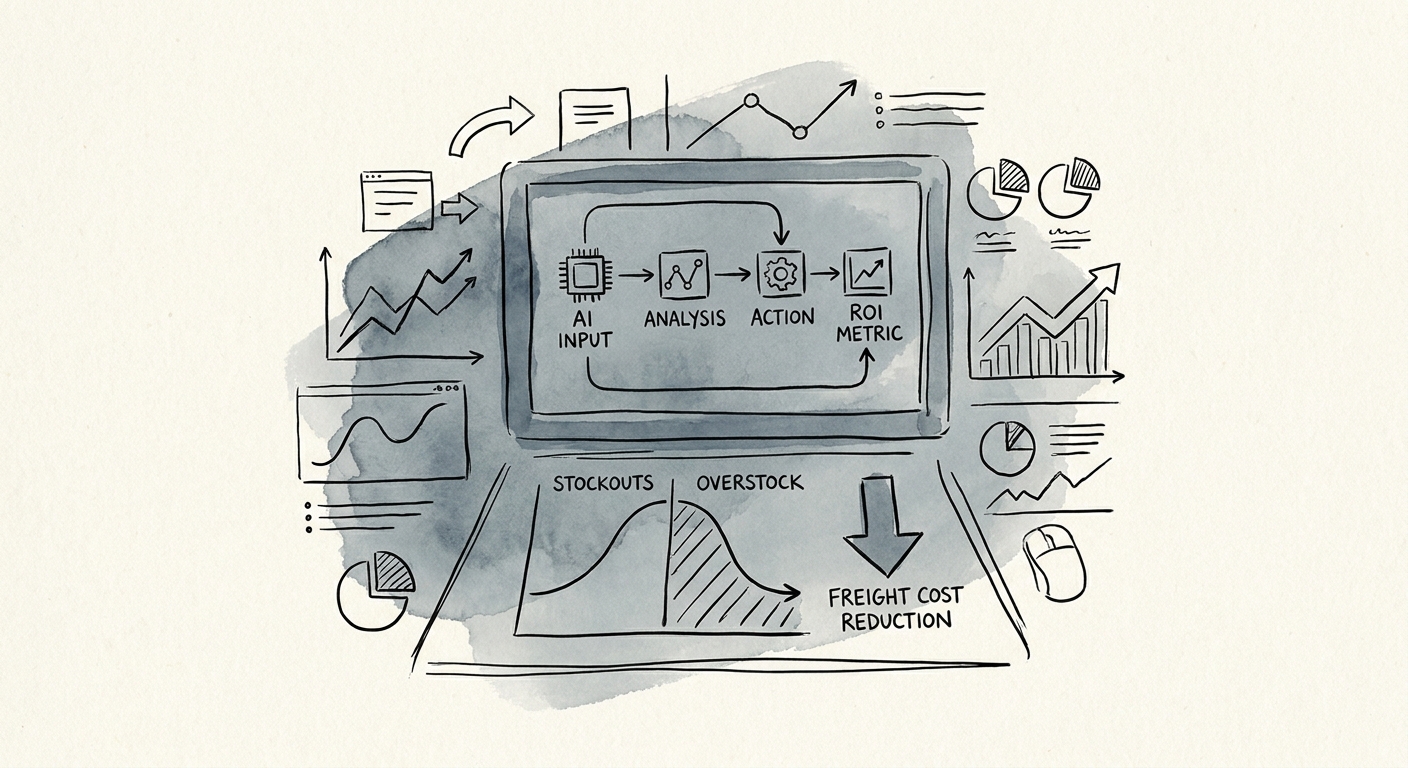
Inventory Exception AI: Measure Decisions, Not Alert Volume
Most inventory exception AI just builds a bigger alert queue. Here's how to measure whether planners actually act earlier — exception aging, overrides, avoided expedites.
5 measures needed for inventory exception reporting ROI