BRIEF · AI KNOWLEDGE SYSTEMS
The Three Answers Your Knowledge Base Already Got Wrong This Week
Before you point AI at your firm's support docs, settle four things: what's approved, who owns it, how fresh it is, and which client it belongs to.
4 knowledge controls before AI search
BRIEF · AI KNOWLEDGE SYSTEMS
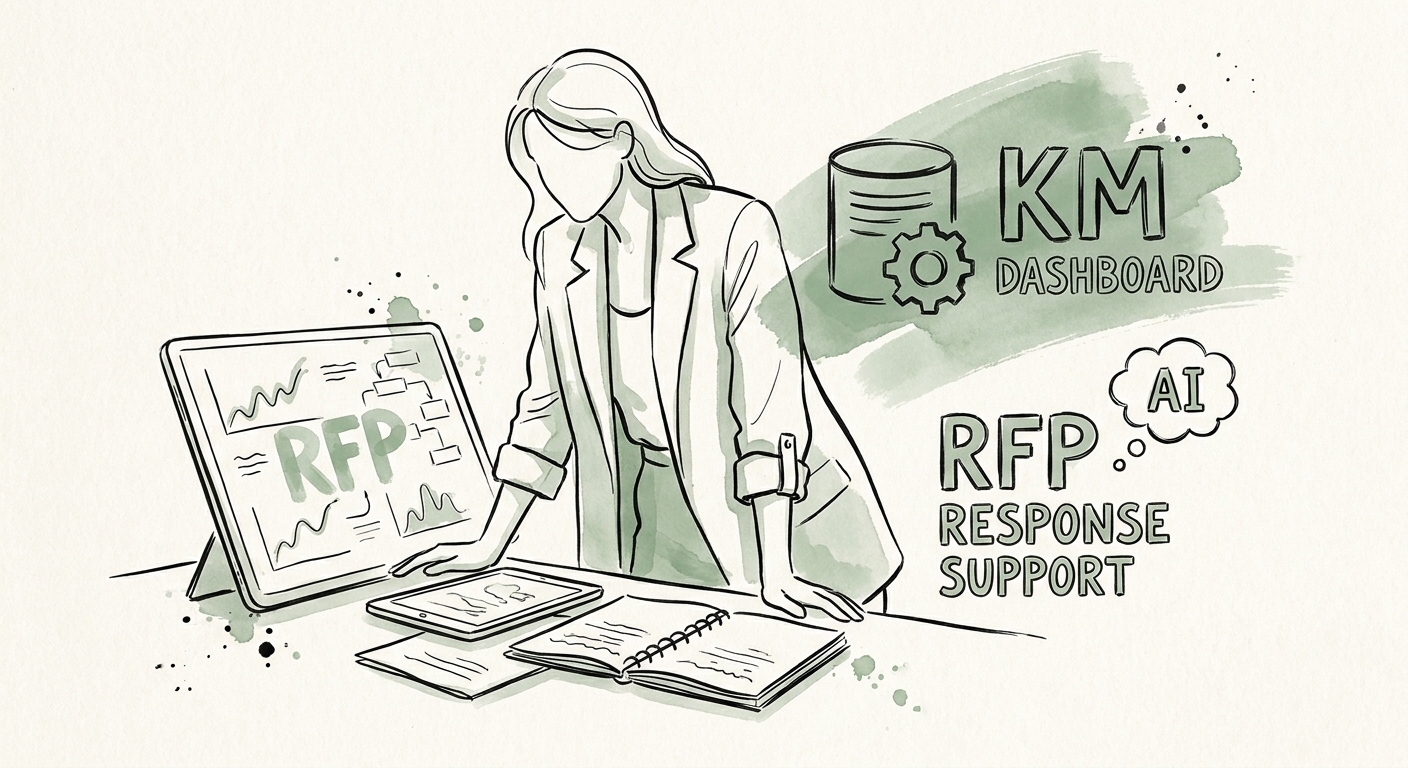
The First AI Win for RFP Teams: Stop Re-Answering the Same Security Questionnaire
Knowledge teams drown in RFP rework. Here's the one workflow to automate first with AI — and the answers you must never let it touch.
25% Leaders reporting transformative AI impact
BRIEF · AI FUNCTION USE CASES
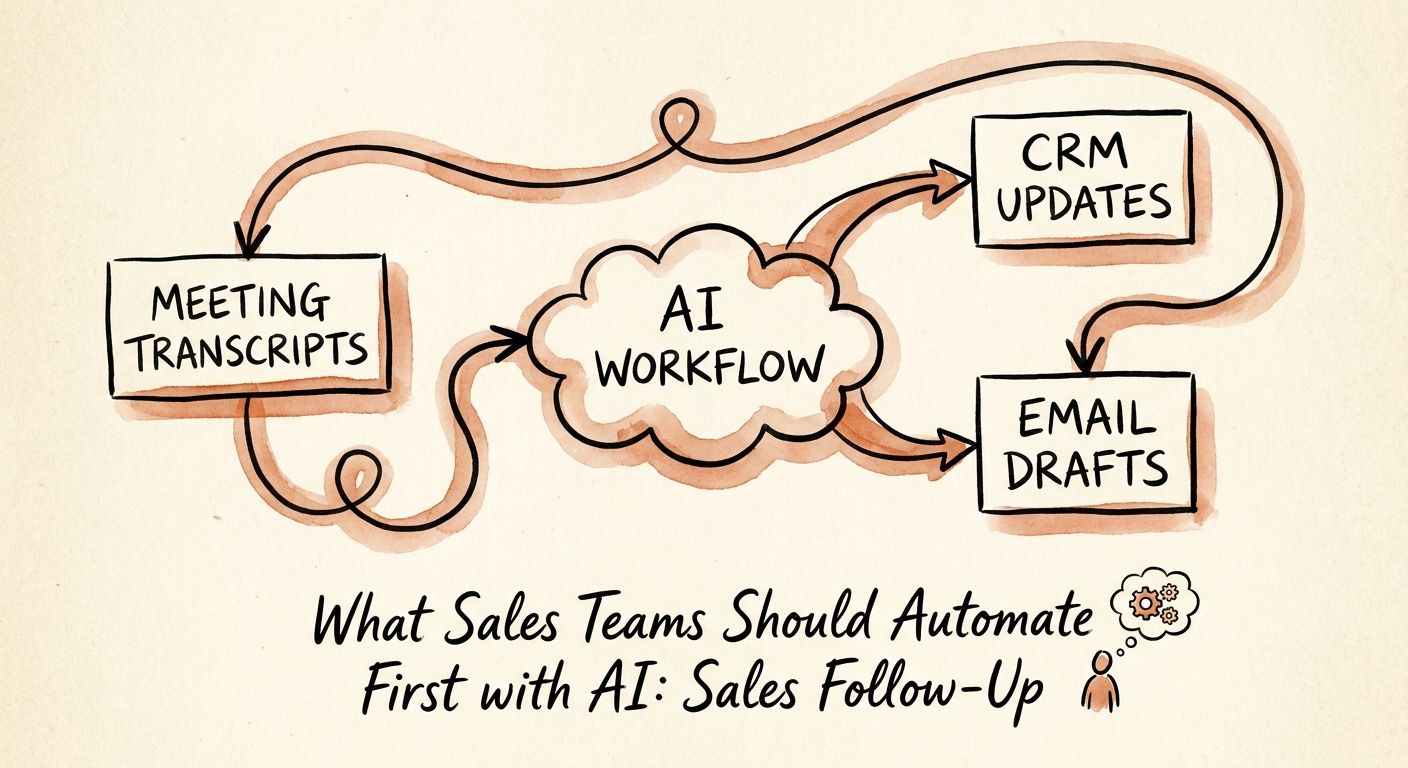
The First Workflow a B2B Services Sales Team Should Hand to AI: The Post-Meeting Follow-Up
In professional services, deals slip in the 48 hours after a great meeting. Here is how to let AI draft the follow-up without sounding like everyone else's.
1 follow-up motion to standardize first
BRIEF · AI FUNCTION USE CASES
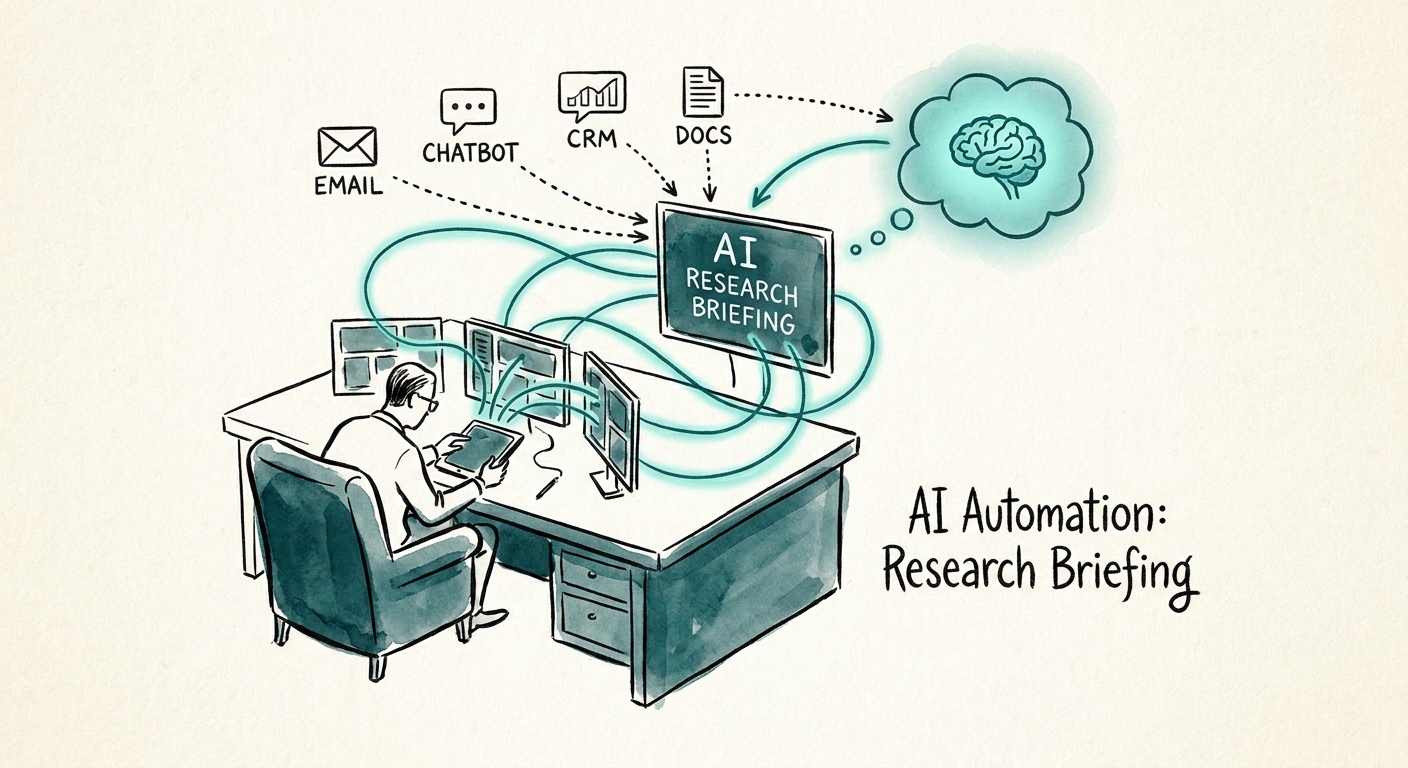
The First Thing Customer Service Should Automate Isn't Replies — It's the 90 Seconds Before Them
The highest-leverage AI in customer service isn't the answer — it's the context brief an agent reads before they open their mouth. Here's how to build it.
4 briefing inputs to govern
BRIEF · AI GOVERNANCE AND TRAINING
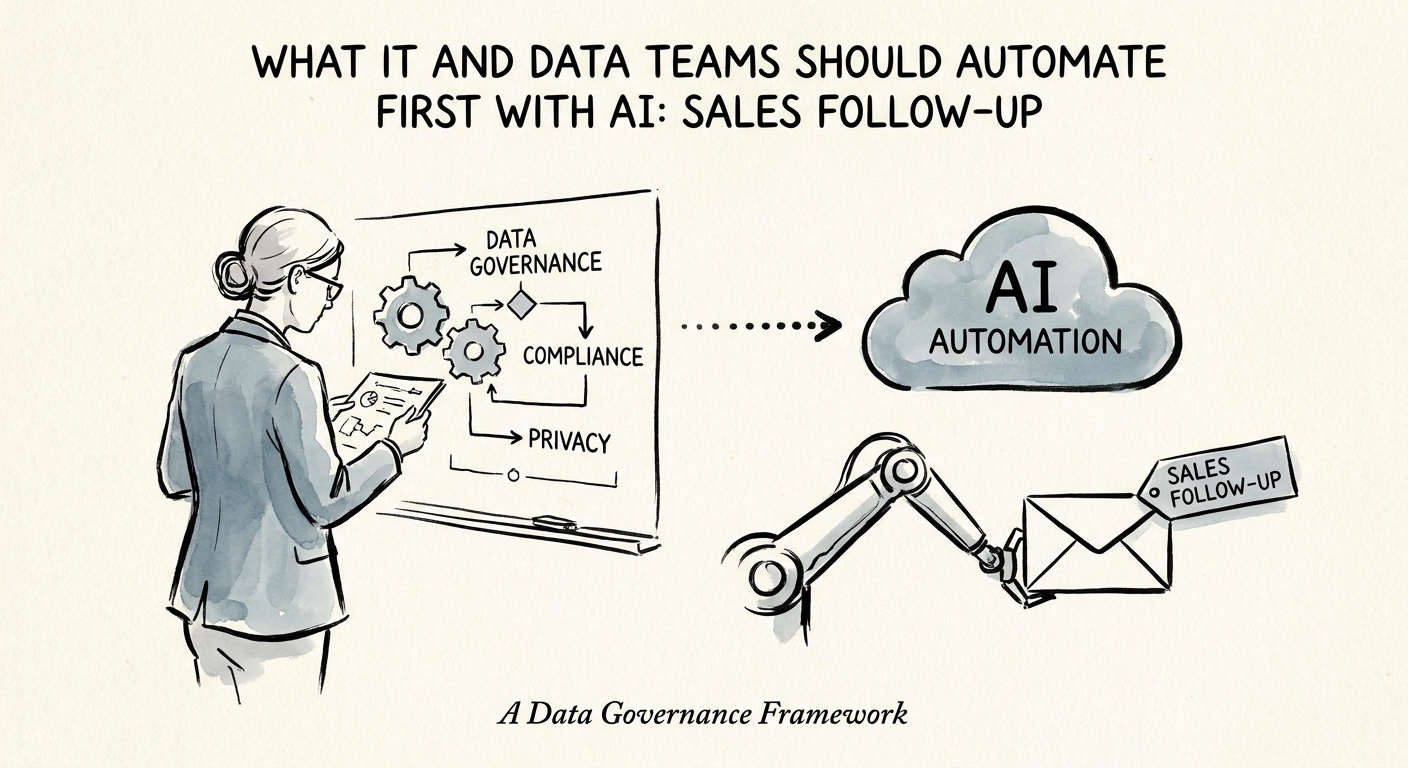
Why IT Should Own the First Sales Follow-Up Bot (Not Sales)
When a follow-up bot drafts outreach from stale CRM data and wrong account owners, it's an IT problem. Here's the source contract to build before the model writes.
4 source checks before AI drafts sales follow-up
BRIEF · AI WORKFLOW AUTOMATION
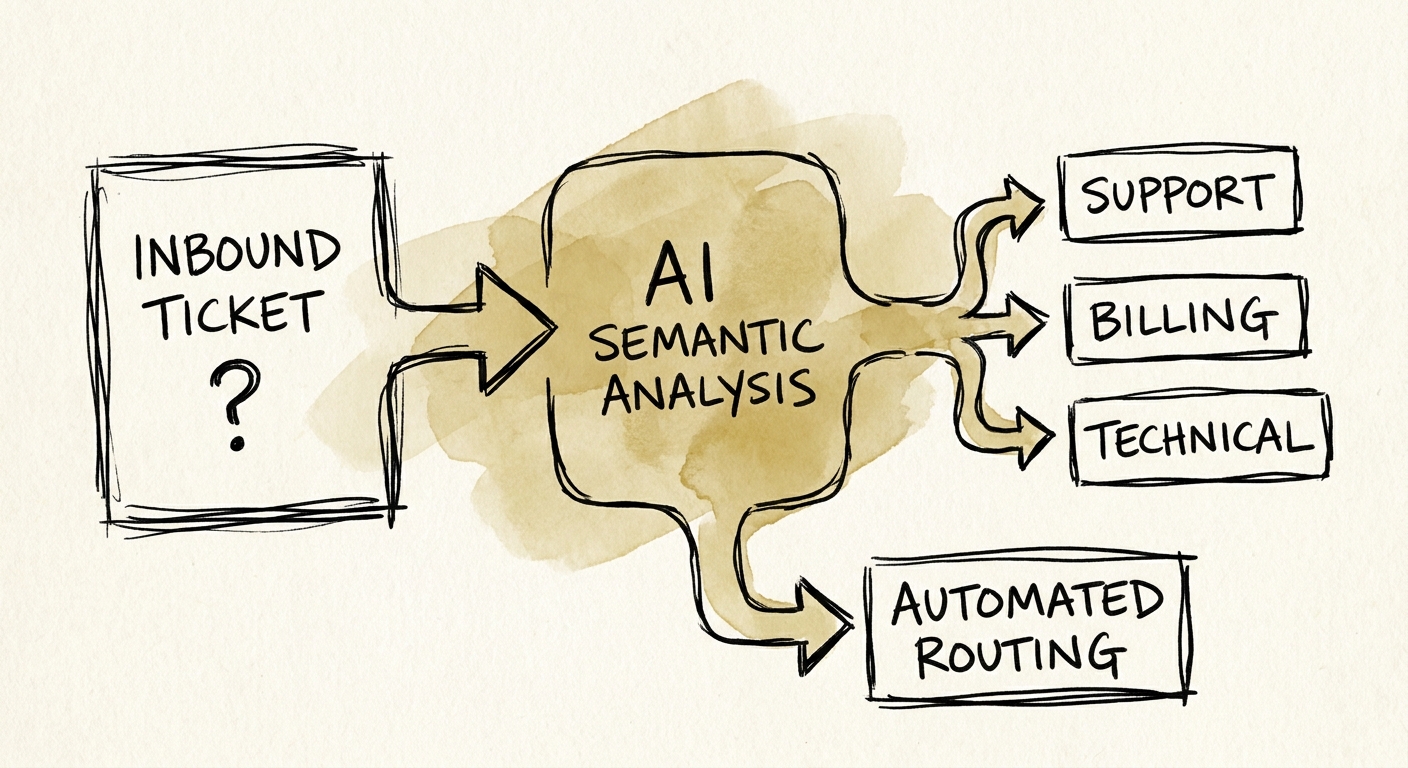
Why AI Ticket Triage Is the Safest First Automation for a Support Queue
Ticket triage is the first AI workflow that pays off because every misroute is already visible. Here is how to wire classification, missing-info, and escalation.
1 support queue to prove first
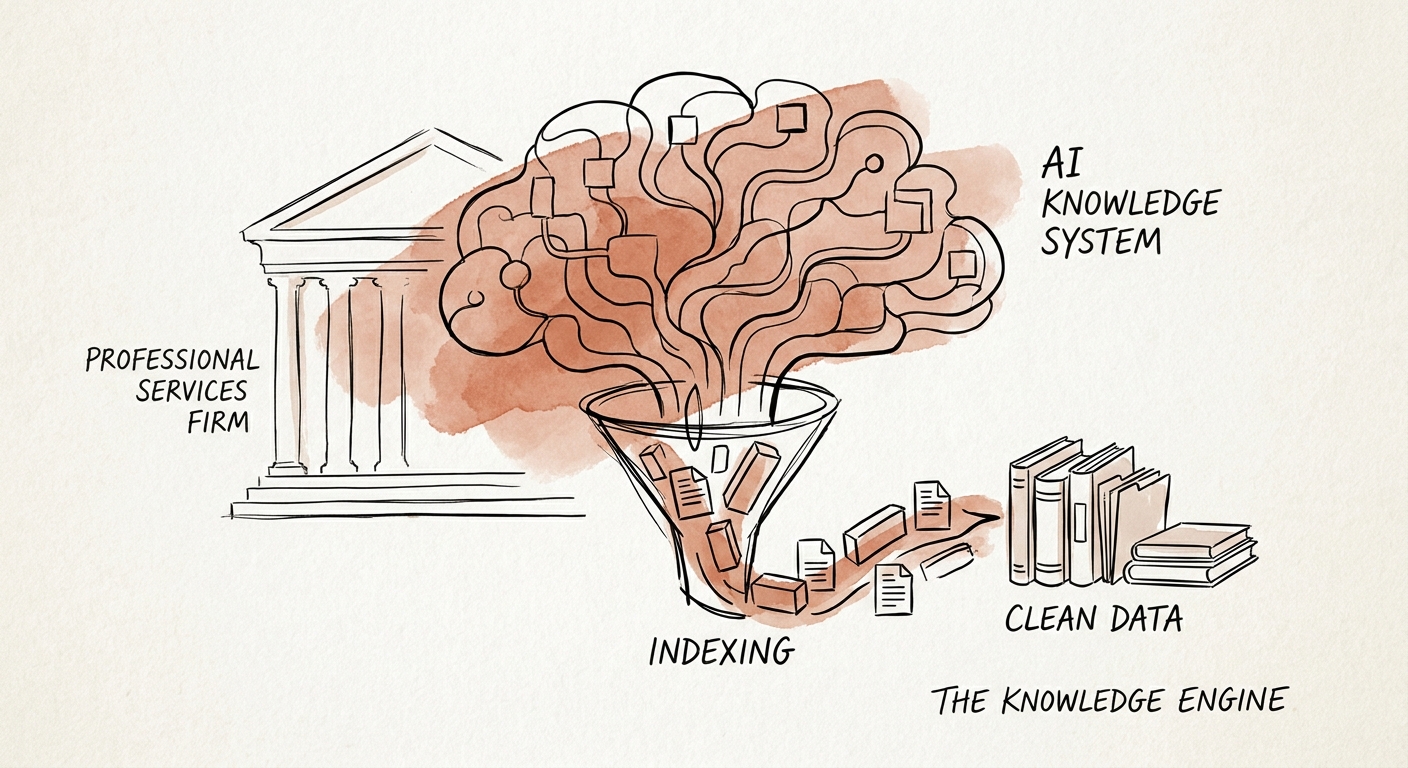
BRIEF · AI KNOWLEDGE SYSTEMS
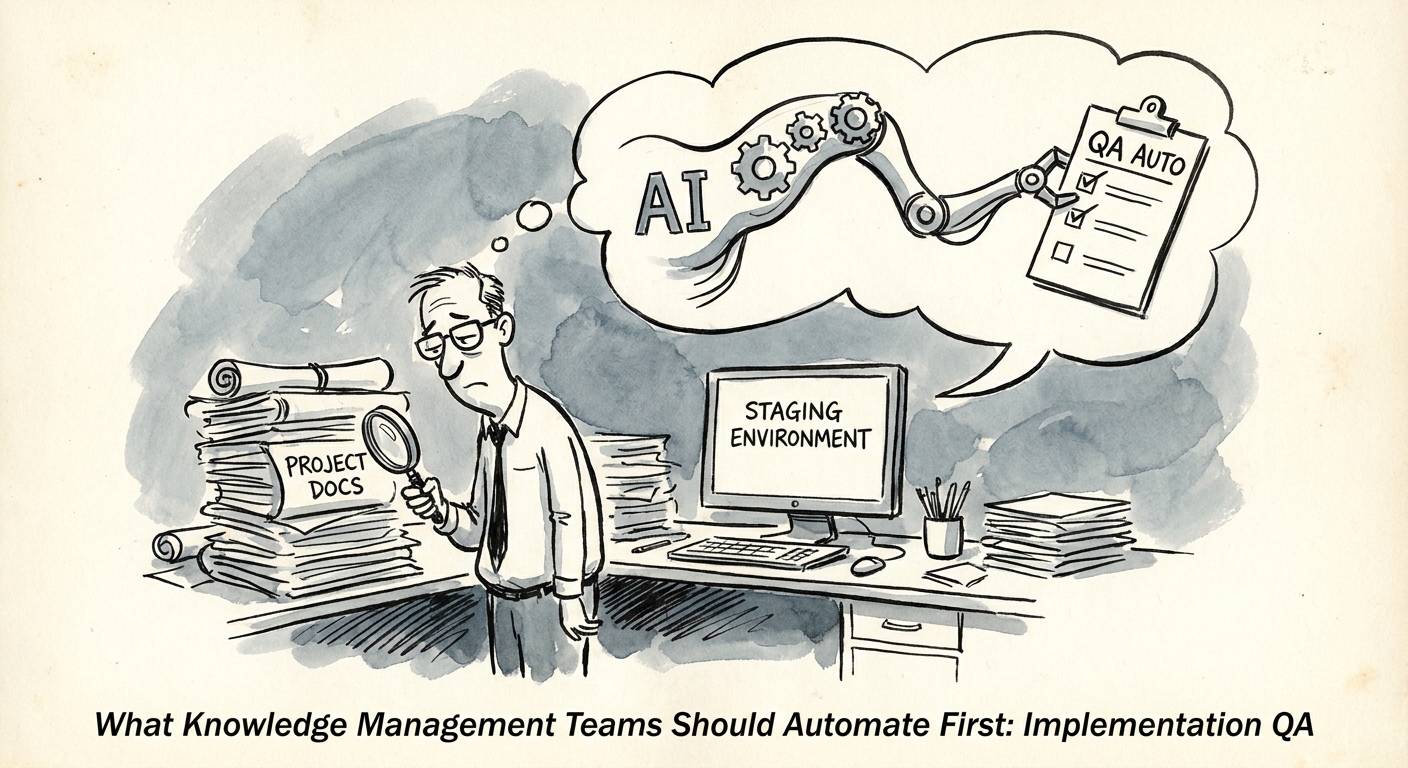
Your Firm Keeps Re-Learning the Same Implementation Mistake. Automate That First.
Professional services firms repeat delivery mistakes because lessons learned die in closed-project folders. Here's the first AI knowledge workflow to build.
Known issues first reusable QA knowledge asset
BRIEF · AI KNOWLEDGE SYSTEMS
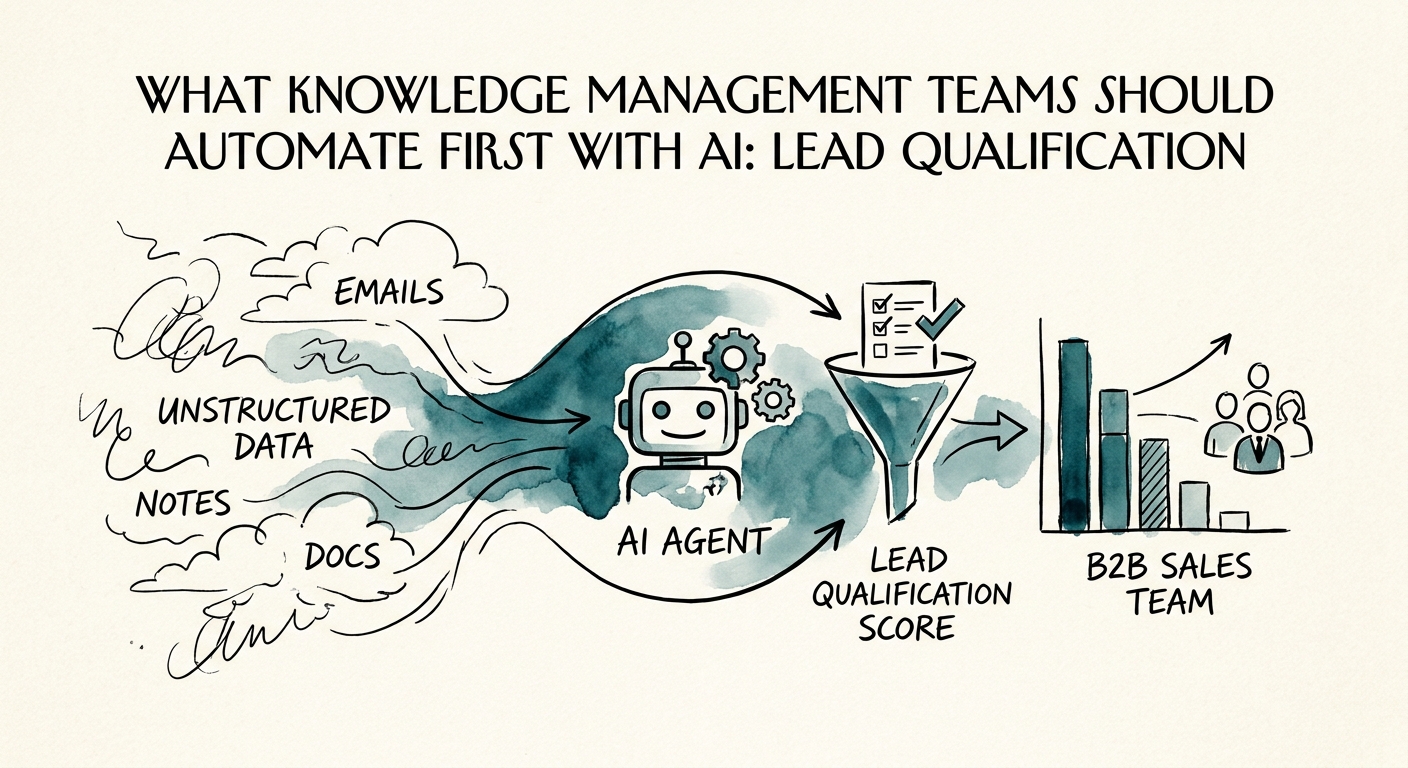
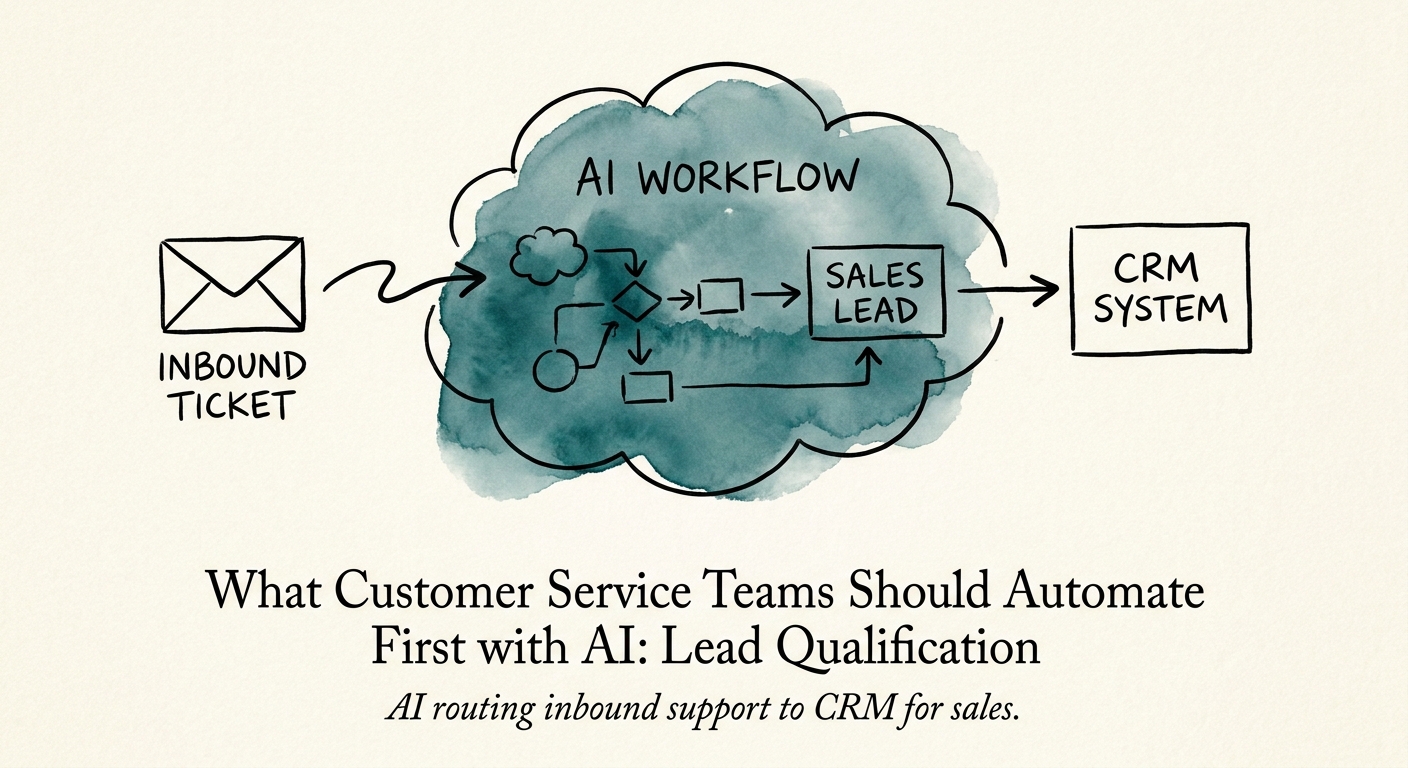
AI Lead Qualification: Why the Bottleneck Is Your Sales Knowledge, Not Your Scoring Model
Your reps already know which leads are real. AI lead qualification works when it retrieves the four knowledge sources they trust, not when it guesses from web signals.
4 knowledge sources needed for reliable lead qualification
BRIEF · AI FUNCTION USE CASES
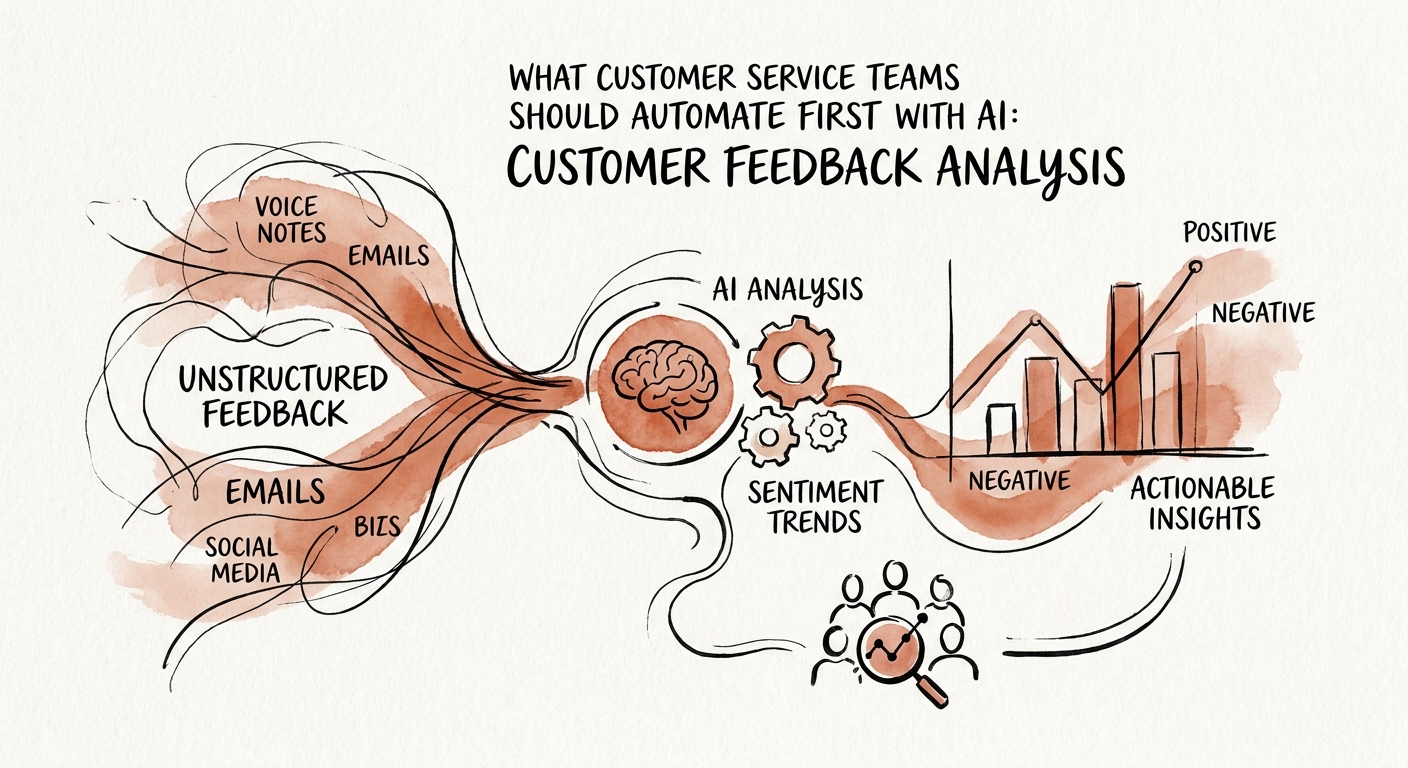
Drowning in Tickets? Automate Reading Feedback Before You Automate Answering It
Support leaders: the safest first AI win isn't a bot that answers customers. It's a workflow that reads every ticket and tells you what's actually breaking.
Theme routing first useful customer-service AI output
BRIEF · AI VENDOR AND BUILD-VS-BUY
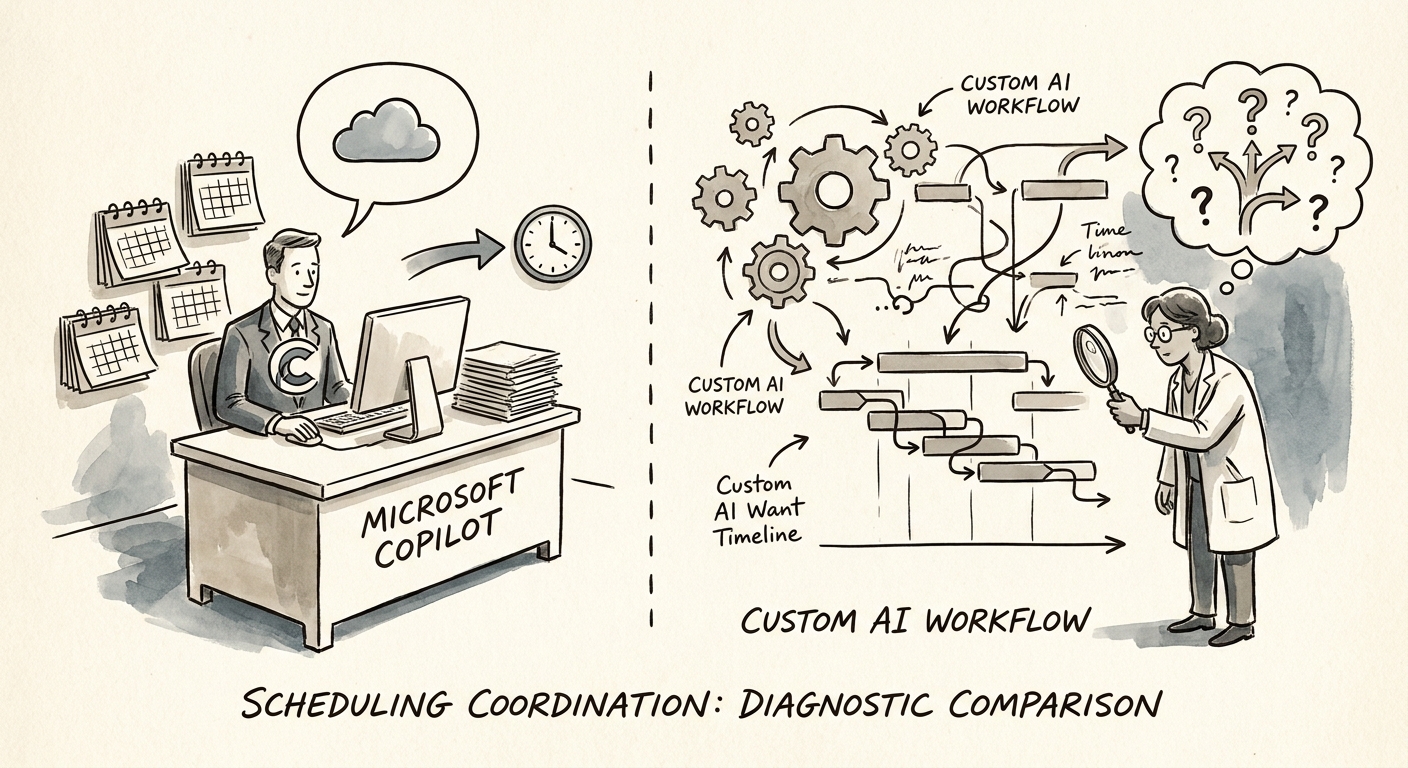
Microsoft Copilot or a Custom Scheduling Workflow? The Test Is Where the Calendar Breaks
Scheduling coordination breaks at the system boundary. Here's how to tell when Microsoft Copilot is enough and when a custom AI workflow earns its build cost.
2 paths to compare before approving the workflow
BRIEF · AI TRANSFORMATION STRATEGY
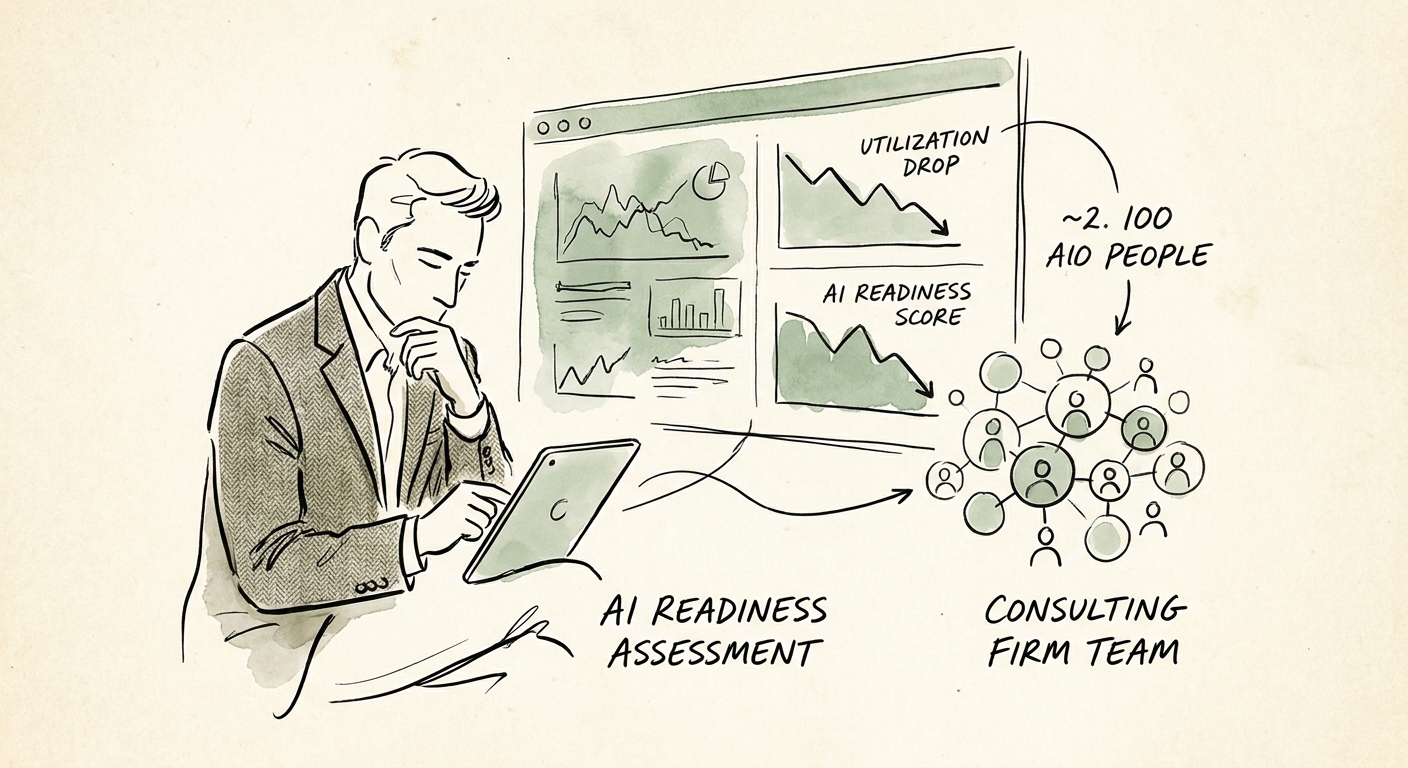
AI Readiness for a 100-Person Consulting Firm: Where the Leverage Actually Is
A 100-person consulting firm's AI readiness comes down to realization, partner review capacity, and the client-data line. Here's how to score it.
8 readiness dimensions before the first AI rollout
BRIEF · AI FUNCTION USE CASES
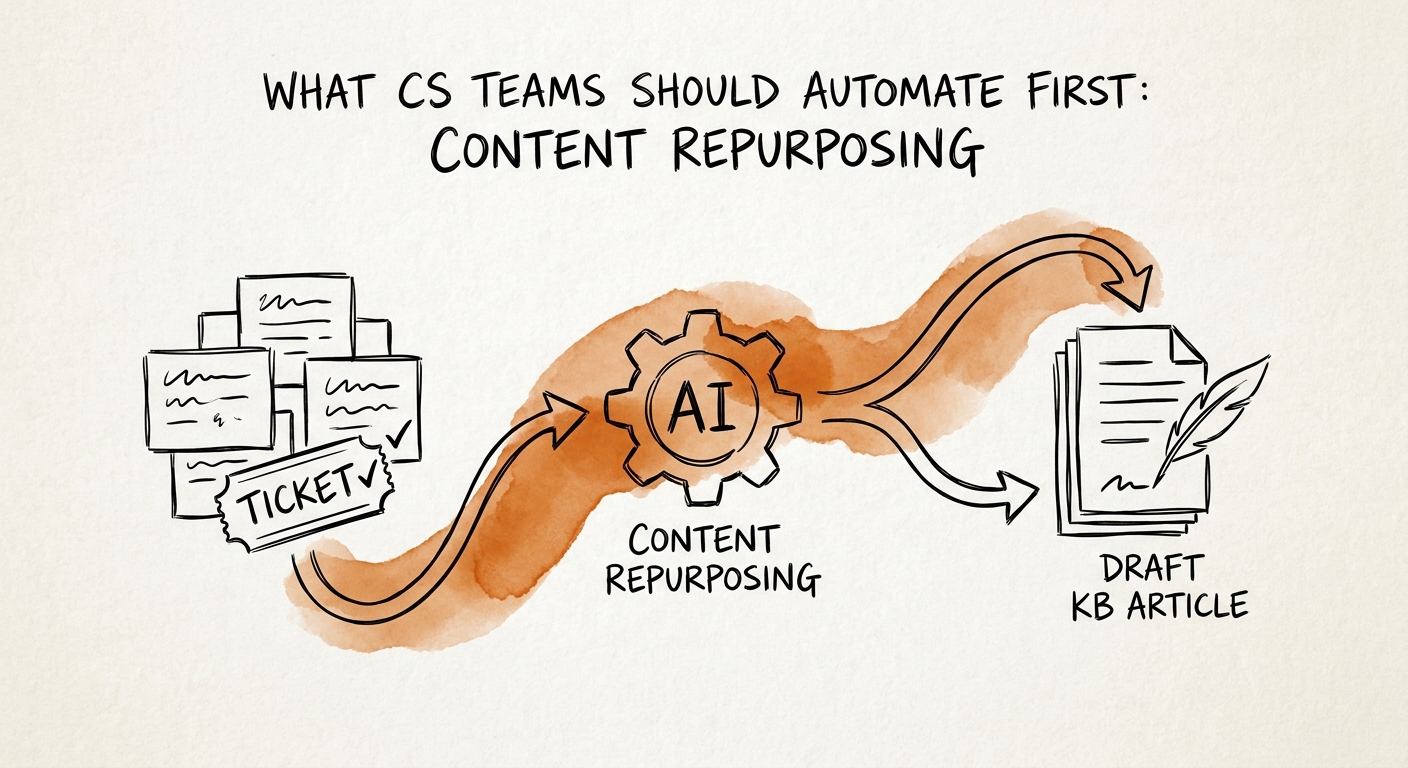
The First AI Win for Support Teams Isn't a Chatbot — It's Repurposing the Answers You Already Wrote
Your support team solves the same question 40 times a month. Here's how to turn approved tickets and help-center answers into customer education with AI — safely.
1 approved source library before customer-facing reuse
BRIEF · AI TRANSFORMATION STRATEGY
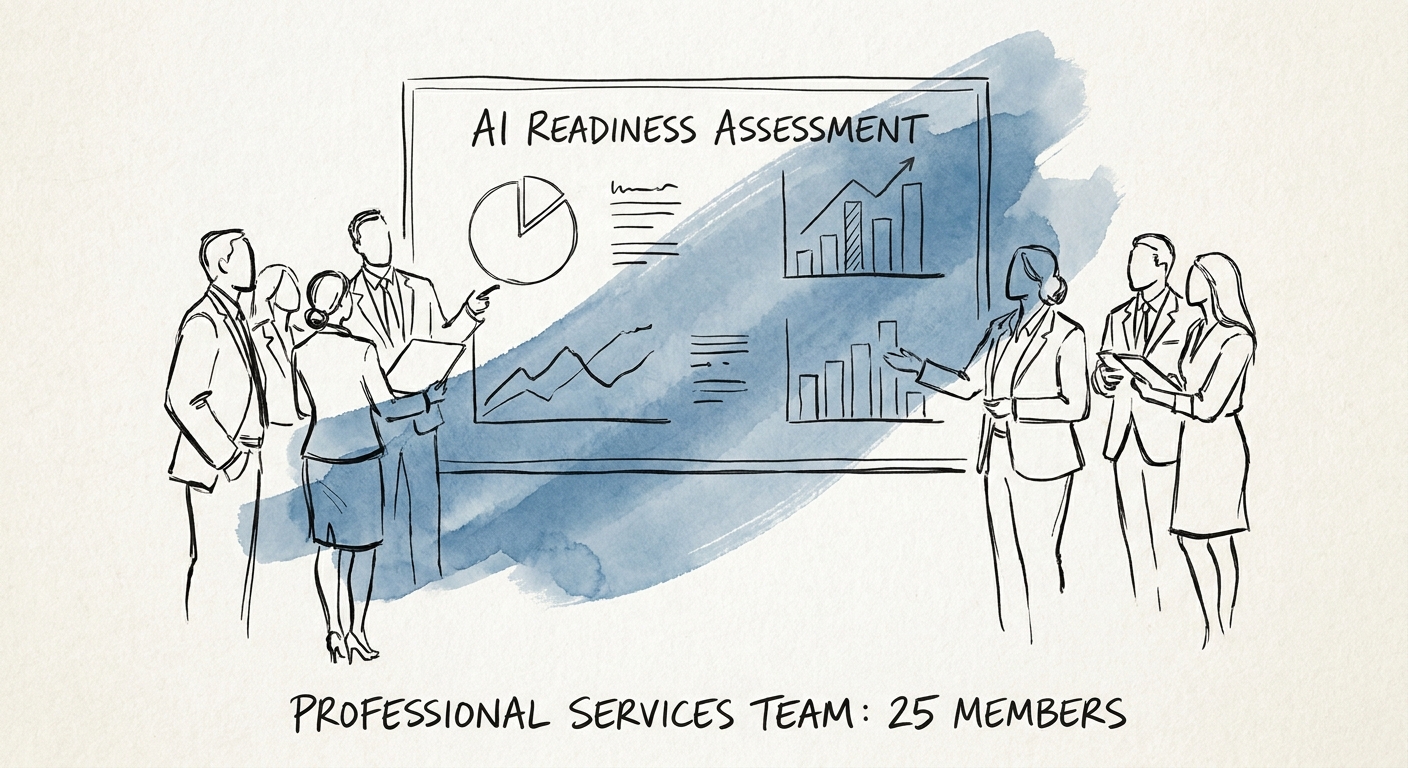
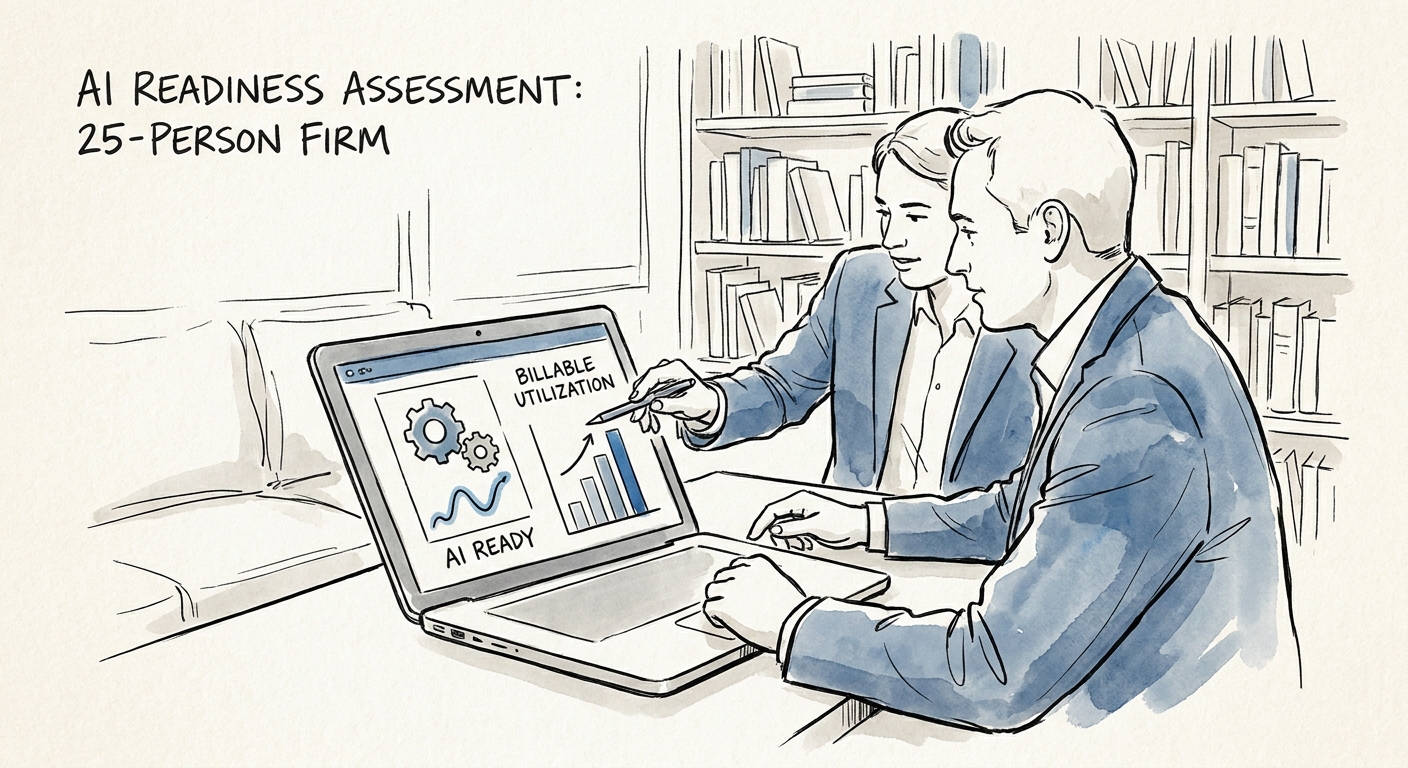
AI Readiness for a 25-Person Services Firm: Score the One Workflow That Touches Client Work
A 25-person services firm doesn't have a CISO or a data team. Here's how to score AI readiness against one billable workflow before anything reaches a client.
8 readiness dimensions to score before AI rollout
BRIEF · AI VENDOR AND BUILD-VS-BUY
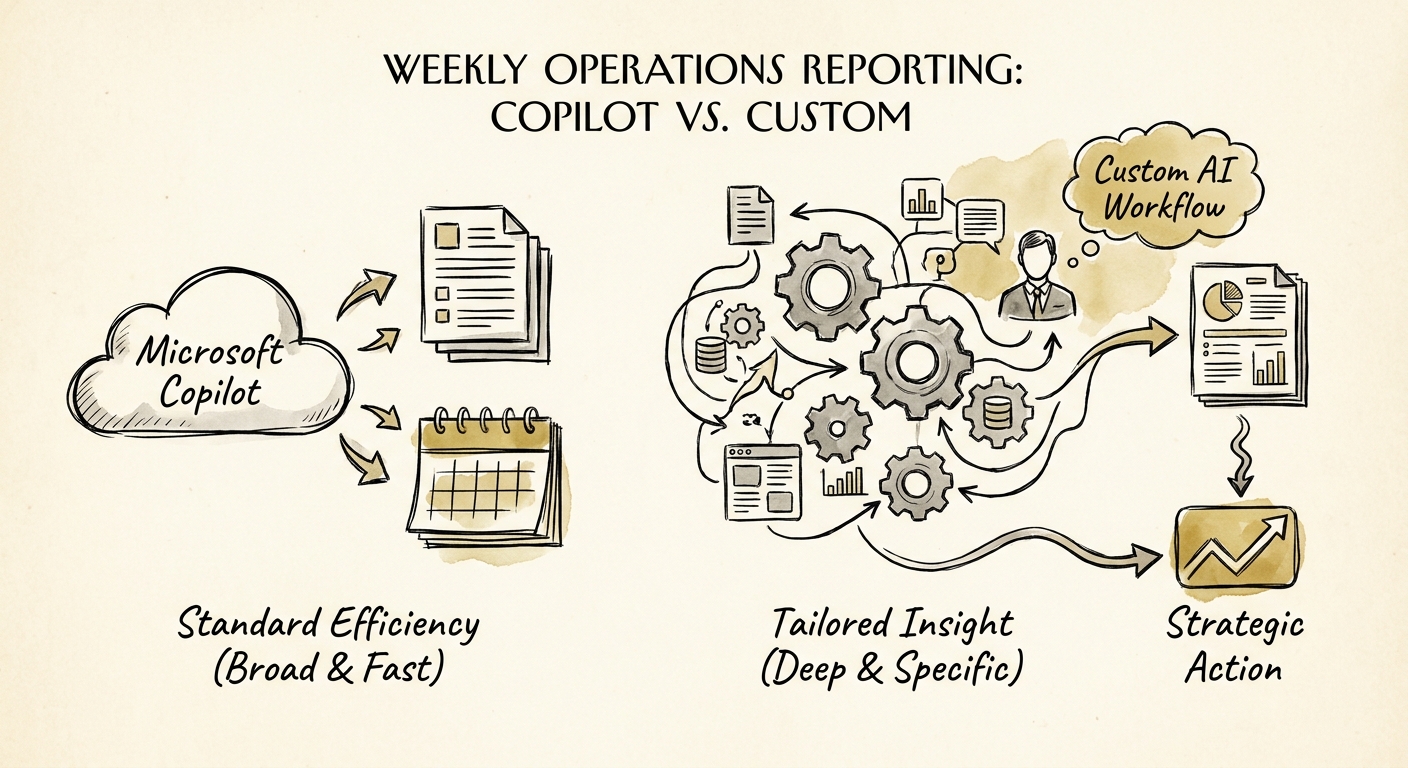
Copilot or a Custom Workflow for Your Weekly Ops Report? Follow the Data, Not the Demo
Your Monday ops report pulls from five systems. Here's how to decide whether Microsoft Copilot can own it or you need a custom AI workflow.
2 paths to compare before approving the workflow
BRIEF · AI VENDOR AND BUILD-VS-BUY
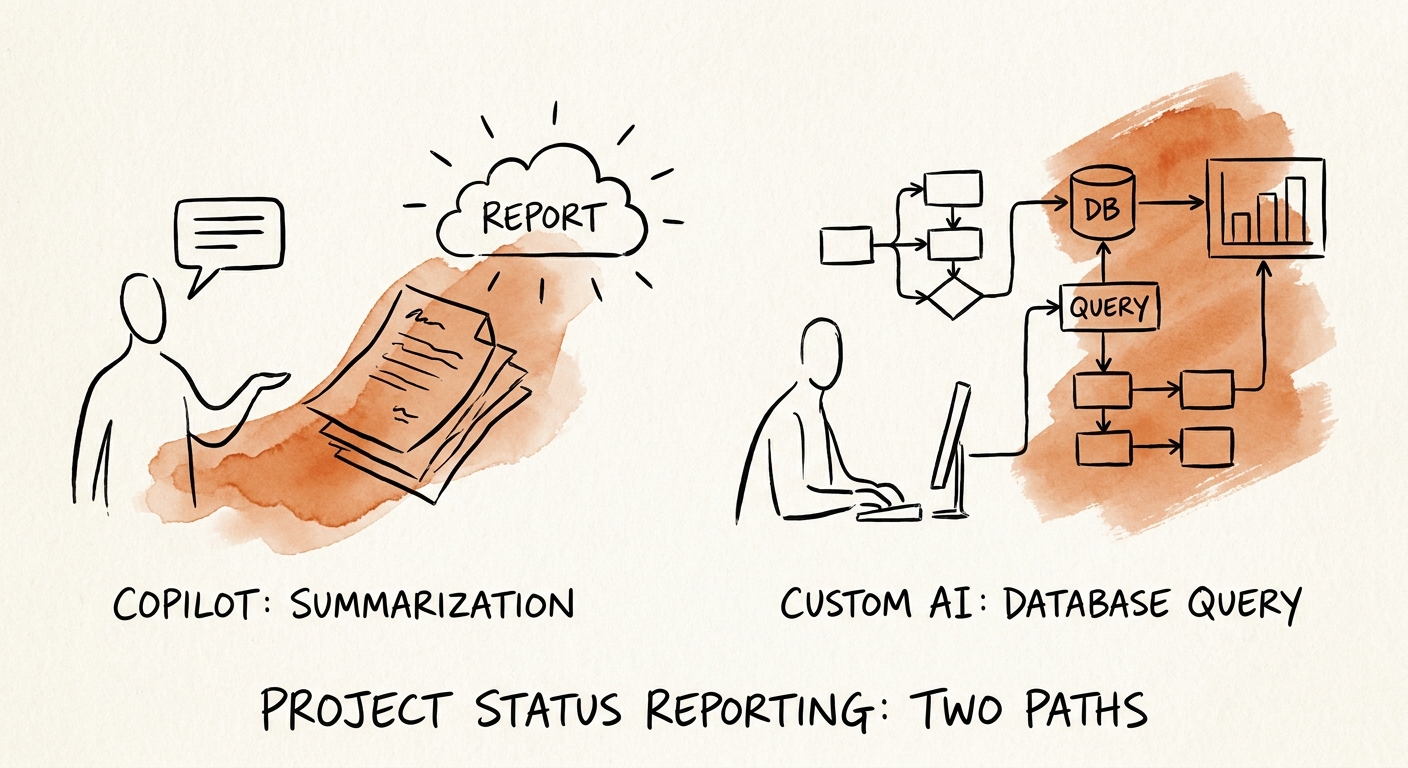
Copilot vs. Custom AI for Status Reports: Who Catches the Watermelon Project?
A green slide hid a red project. Here's how to decide whether Microsoft Copilot or a custom AI workflow should generate your delivery status reports.
2 implementation paths to compare before building
BRIEF · AI FUNCTION USE CASES
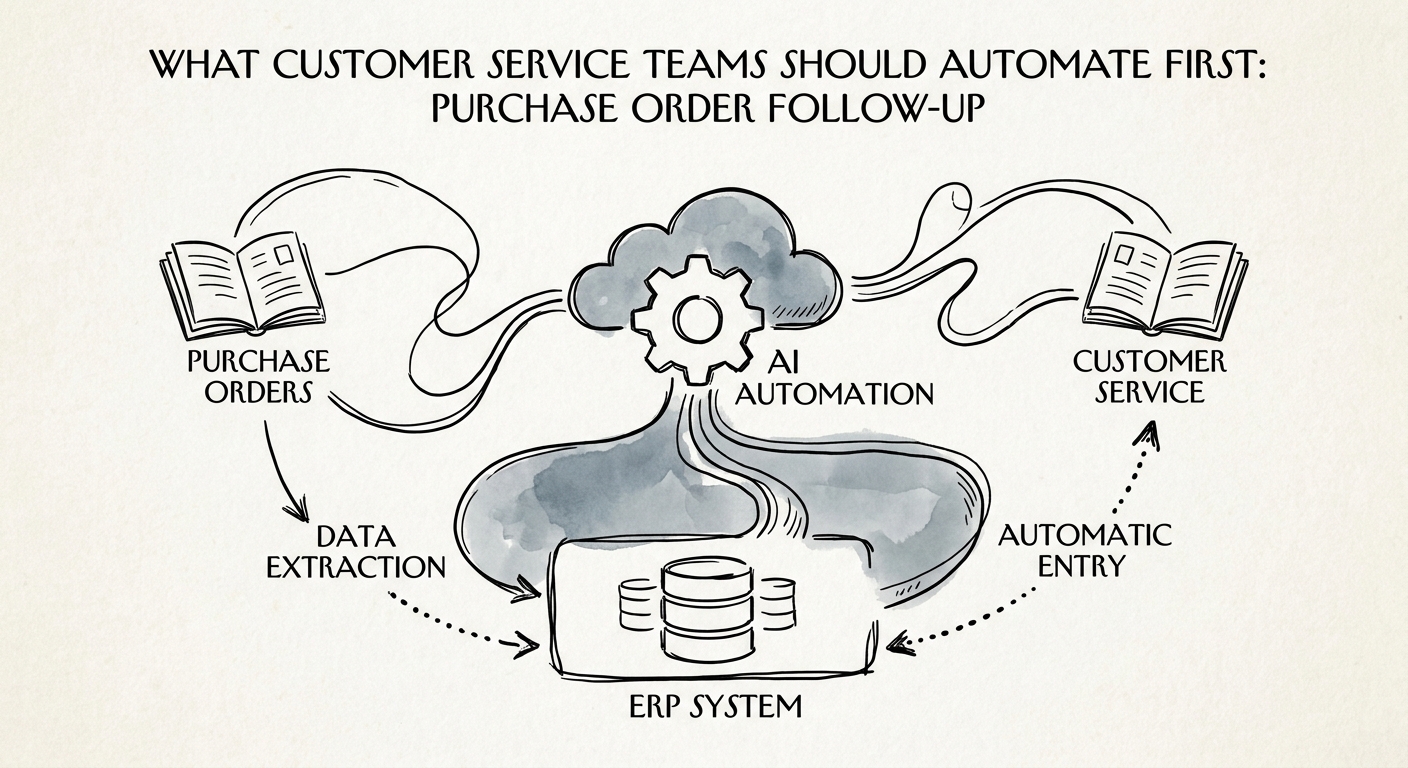
The First AI Win for Distribution Service Teams: Purchase Order Follow-Up Done Right
Why purchase order follow-up is the smartest first AI use case for distribution service teams — and how to wire ERP, CRM, and fulfillment so it never over-promises.
3 systems to reconcile before AI sends a follow-up
BRIEF · AI TRANSFORMATION STRATEGY
AI Readiness for a 10-Person Firm: The One-Workflow Test
At 10 people there is no IT department and no slack week. A readiness test built for a tiny services firm: score one workflow, name one owner, launch one thing.
8 readiness dimensions to score before AI rollout
BRIEF · AI KNOWLEDGE SYSTEMS
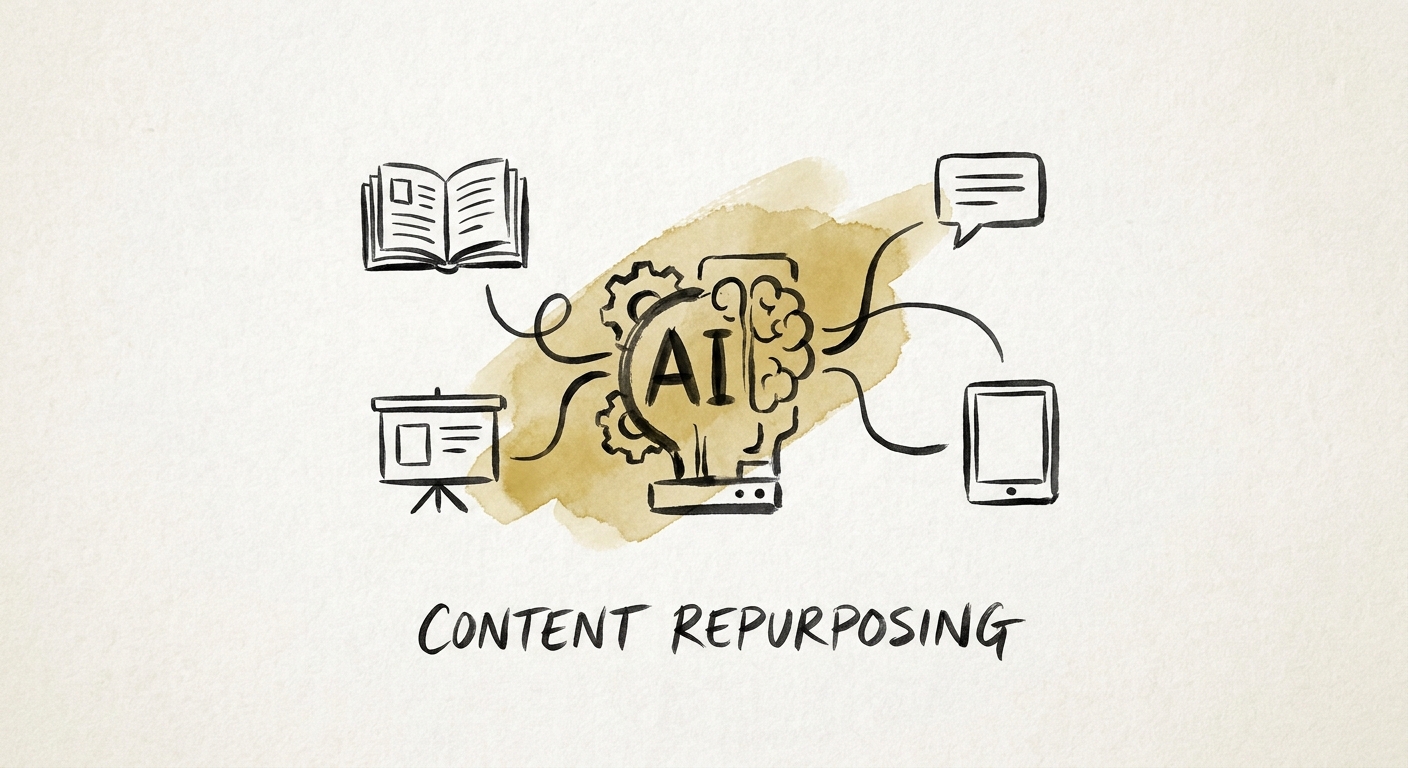
The First AI Win for Knowledge Teams: Stop Rewriting the Same Deliverable Five Times
A 90-day playbook for knowledge management teams in professional services to turn one approved deliverable into many formats with AI — without inventing facts.
25% leaders moving many AI pilots into production
BRIEF · AI FUNCTION USE CASES
Your Support Queue Already Knows Who Wants to Buy. Here's How to Listen.
In B2B software, the buying signal often arrives as a support ticket. How to use AI to surface expansion intent without turning your service team into a sales floor.
4 signals customer service should capture before routing a lead
BRIEF · AI KNOWLEDGE SYSTEMS
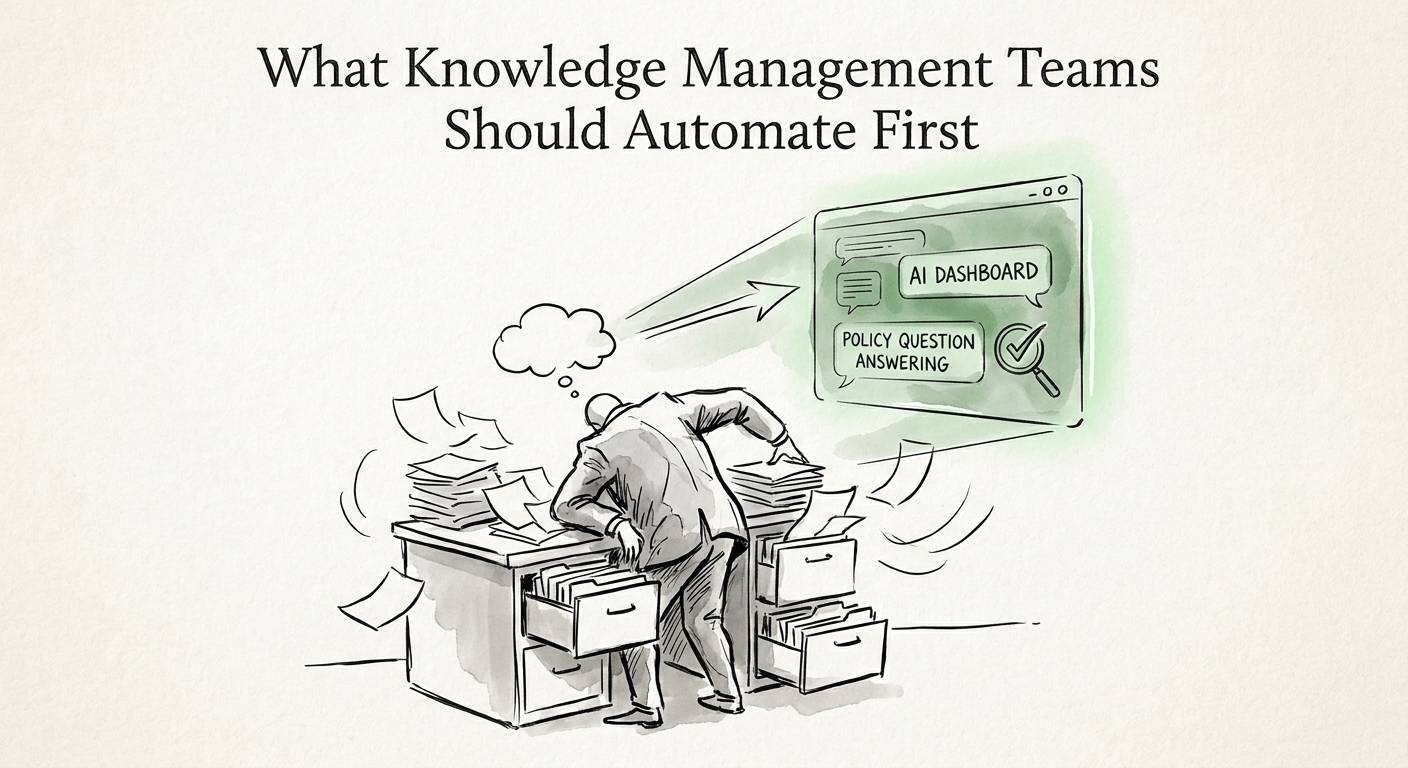
The First AI Project for Knowledge Teams: Answer "What's Our Policy On..." Without Guessing
An employee asks about the travel cap and gets a 2023 answer. Here's how knowledge teams build AI policy Q&A that cites the live source and knows when to escalate.
3 policy controls before AI answers employee questions
BRIEF · AI KNOWLEDGE SYSTEMS
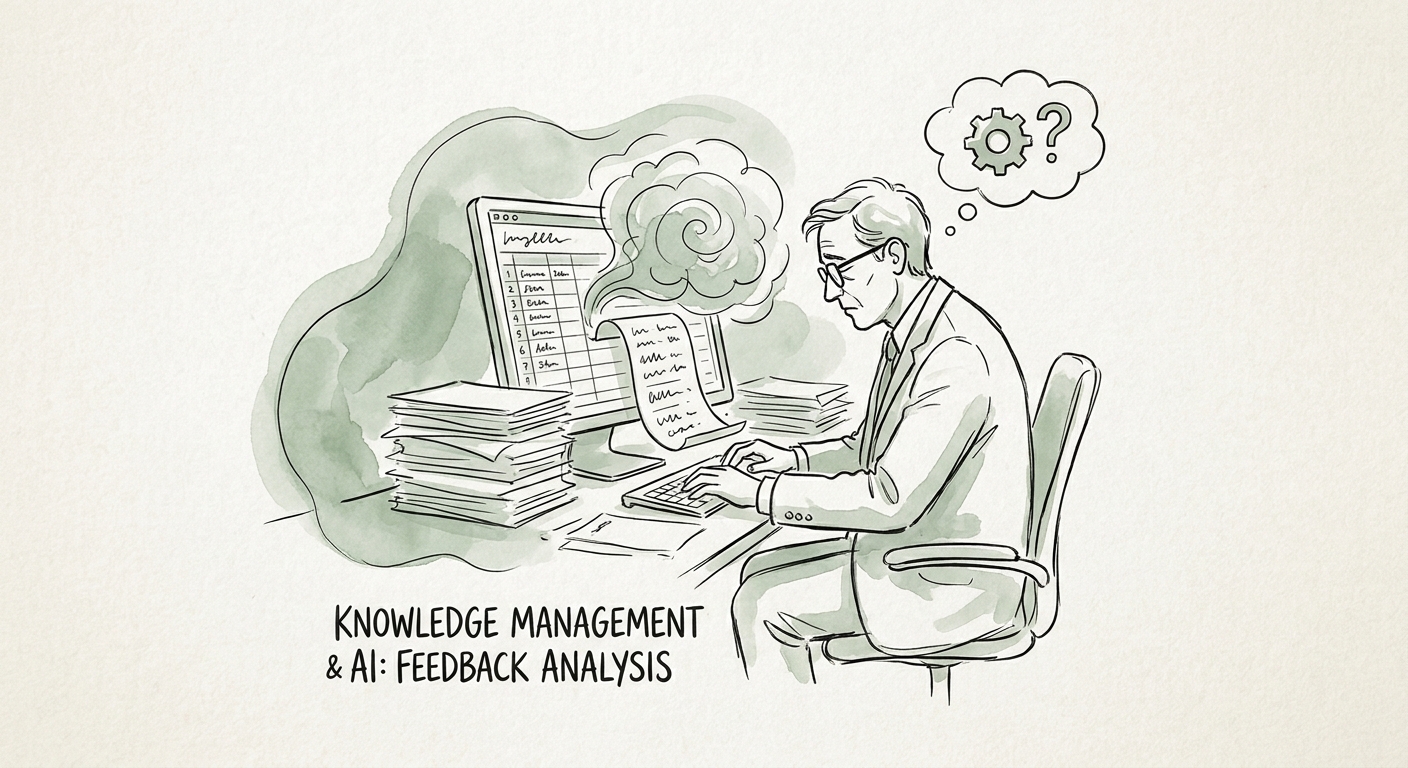
Your Customers Already Told You What's Wrong. AI Helps You Hear It.
B2B tech feedback is scattered across tickets, calls, and surveys. Here's how to turn AI feedback analysis into a routed loop that reaches an owner.
30 days to test one feedback workflow
BRIEF · AI KNOWLEDGE SYSTEMS
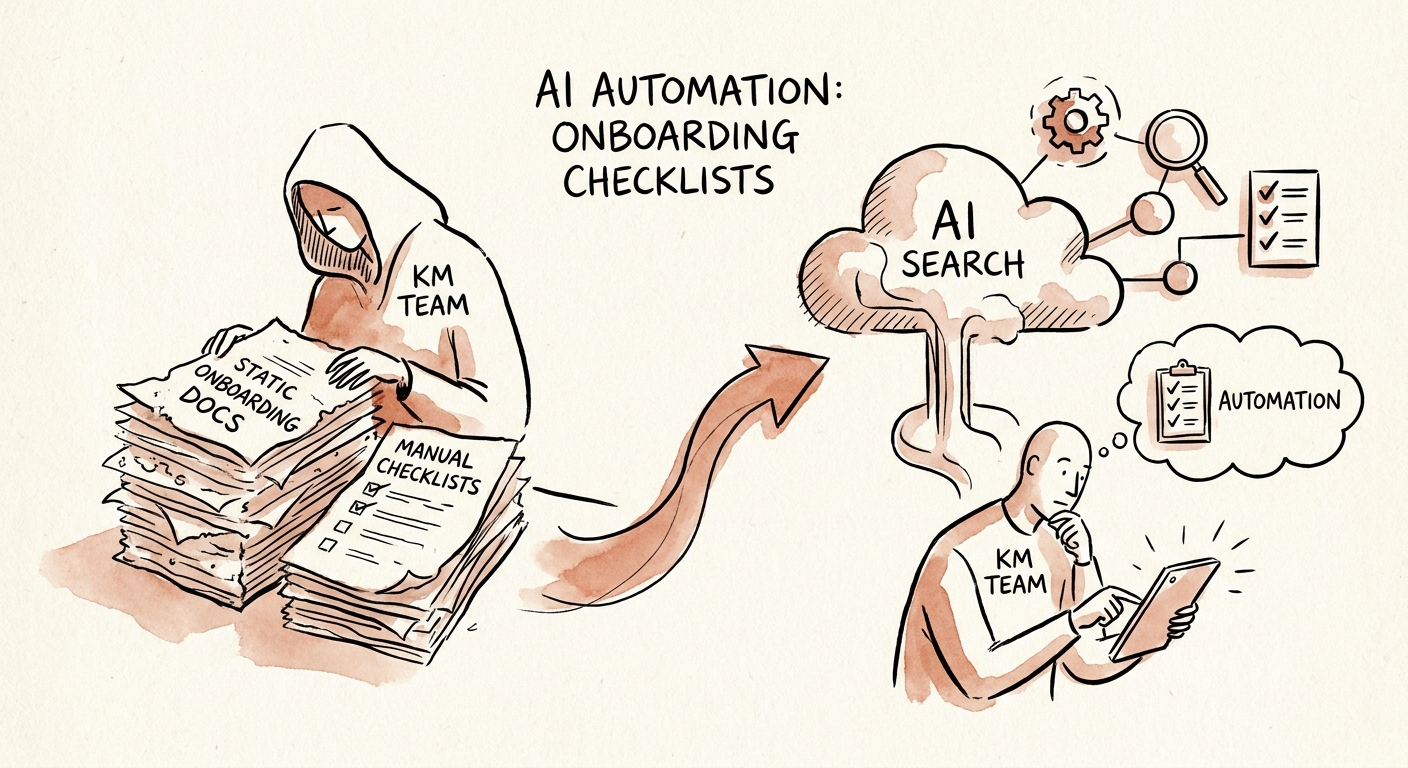
The First Thing KM Teams Should Hand AI: The New-Hire Onboarding Checklist
Why the new-hire onboarding checklist is the safest first AI workflow for knowledge management teams in professional services, and how to ship it in 90 days.
30-60-90 implementation path from pilot to governed workflow
BRIEF · AI VENDOR AND BUILD-VS-BUY
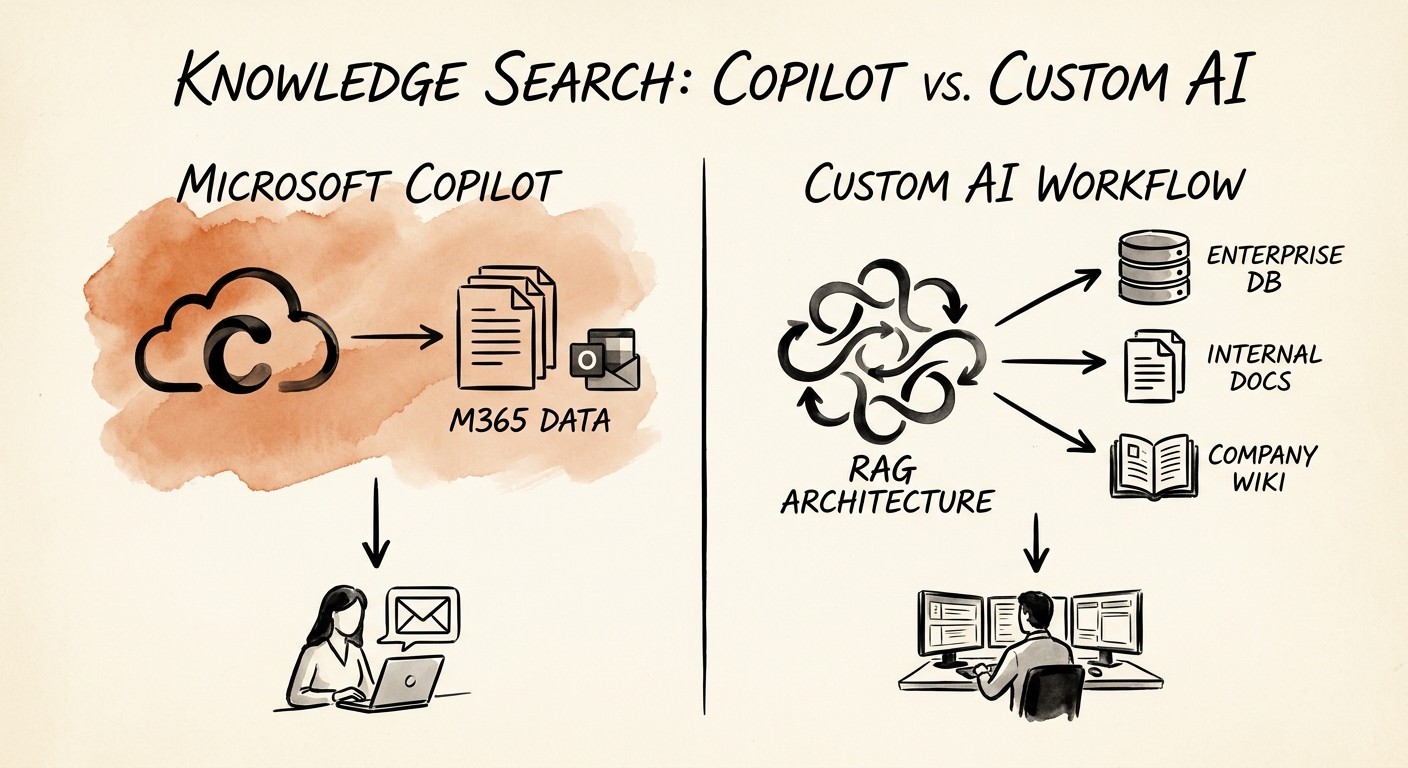
Copilot or Custom Build? The Knowledge-Search Decision Hinges on One Question
The real Copilot-vs-build decision for internal knowledge search comes down to where your answers live and whether the search needs to do something with them.
2 paths to compare before approving the workflow
BRIEF · AI TRANSFORMATION STRATEGY
The 25-Person Consulting Firm's AI Readiness Test: Can Your Proposals Survive Reuse?
A 25-person consulting firm's AI readiness lives or dies on knowledge reuse, proposal quality, and client-data handling. Here's how to assess it honestly.
4 readiness areas to assess